Time-resolved studies define the nature of toxic IAPP intermediates, providing insight for anti-amyloidosis therapeutics
- New York University School of Medicine, United States
- University of British Columbia, Canada
- Stony Brook University, United States
- University of Wisconsin-Madison, United States
Figures
Figure 1
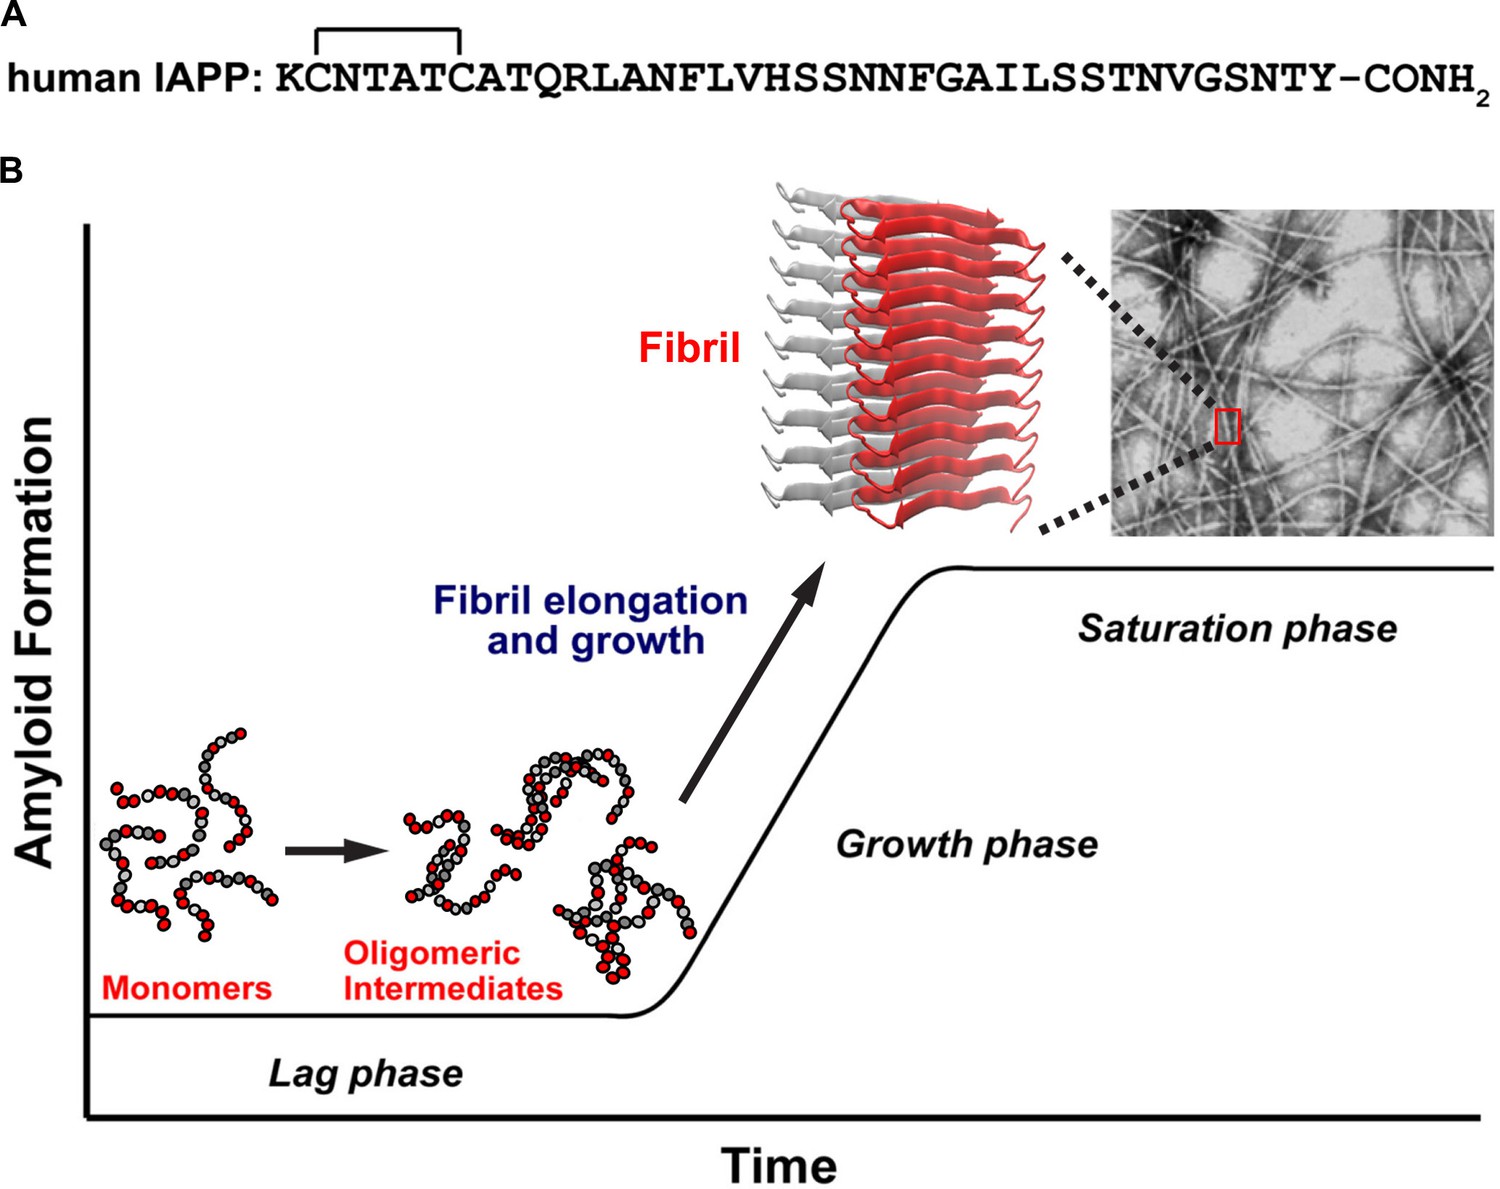
A schematic diagram of the process of amyloid formation by h-IAPP.
(A) Amino acid sequence of wild-type h-IAPP. The mature, bioactive form of the polypeptide has an amidated C-terminus and a disulfide bridge indicated by the bracket between Cys-2 and Cys-7. (B) Schematic diagram illustrating the kinetics of amyloid formation by h-IAPP. The ribbon diagram shown is derived from the IAPP model developed by Eisenberg and co-workers (Wiltzius et al., 2009).
Figure 2 with 2 supplements
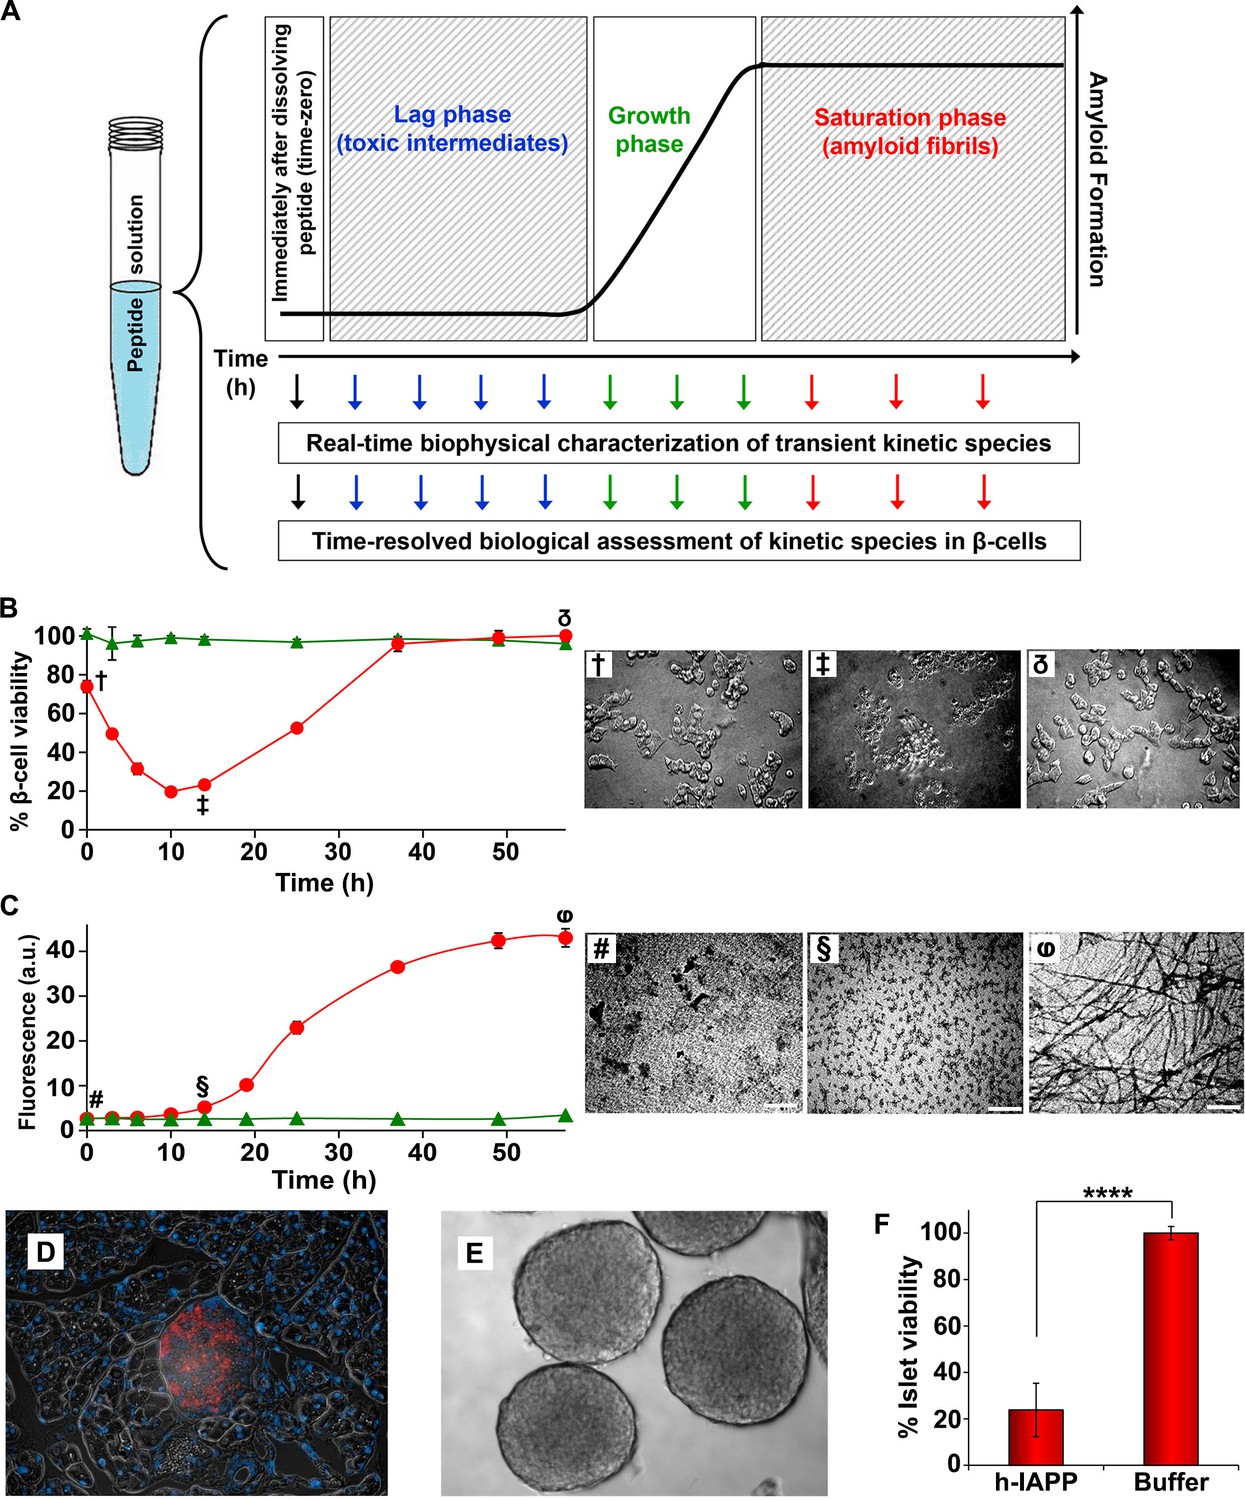
Toxic h-IAPP species are transiently populated lag phase intermediates.
(A) A schematic diagram of the experimental design for the kinetic assays. Protein aggregation was initiated by dissolving amyloidogenic IAPP, non-amyloidogenic IAPP variants or r-IAPP in 20 mM Tris HCl buffer at pH 7.4 (time-zero) followed by incubation. Aliquots were removed at designated time points over the course of amyloid formation (denoted by arrows) for concurrent biophysical characterization and biological assessment of transient kinetic species in rat INS-1 β-cells at the same time points, as described in the methods. (B) Time-resolved Alamar Blue reduction assays of INS-1 β-cells treated with h-IAPP (●) and r-IAPP (▲) at different time points during the course of aggregation. Light microscopy: (†) Viable β-cells after incubation with h-IAPP at time-zero; (‡) apoptotic β-cells shrink and detach from the cell culture substratum after incubation with lag phase intermediates; (δ) viable β-cells after incubation with amyloid fibrils. (C) Thioflavin-T monitored kinetics of amyloid formation: h-IAPP (●) and r-IAPP (▲). TEM images: (#) non-toxic h-IAPP at time-zero; (§) toxic pre-fibrillar lag phase intermediates; (φ) amyloid fibrils (Scale bars: 200 nm). (D) Immunofluorescence of a section of murine pancreas shows non-inflamed, insulin-positive islet: Sections of paraffin embedded pancreatic tissue were stained for insulin (red) indicative of β-cells, F4/80 (green) marker for macrophages indicative of inflammation and Dapi (blue) nuclear stain. (E) Light microscopy of hand purified pancreatic islets with intact mantels after isolation from wild-type mice. (F) Alamar Blue reduction assays show that h-IAPP lag phase intermediates are toxic to mouse pancreatic islets. Alamar Blue reduction in β-cell assays, thioflavin-T binding assays, light microscopy and TEM were conducted concurrently using aliquots from the same 20 µM peptide solutions. The peptide concentration after dilution into β-cell and islet assays was 14 µM. β-cell and islet viability is normalized to buffer treated cells or islets. Data represent mean ± SD of three to six replicate wells per condition and a minimum of three to ten replicate experiments per group (****p<0.0001). Some of the error bars in panels B and C are the same size or smaller than the symbols in the graphs. Figure 2—figure supplements 1 and 2 provide control experiments for the biophysical and cellular assay conditions used in the studies.
Figure 2—figure supplement 1
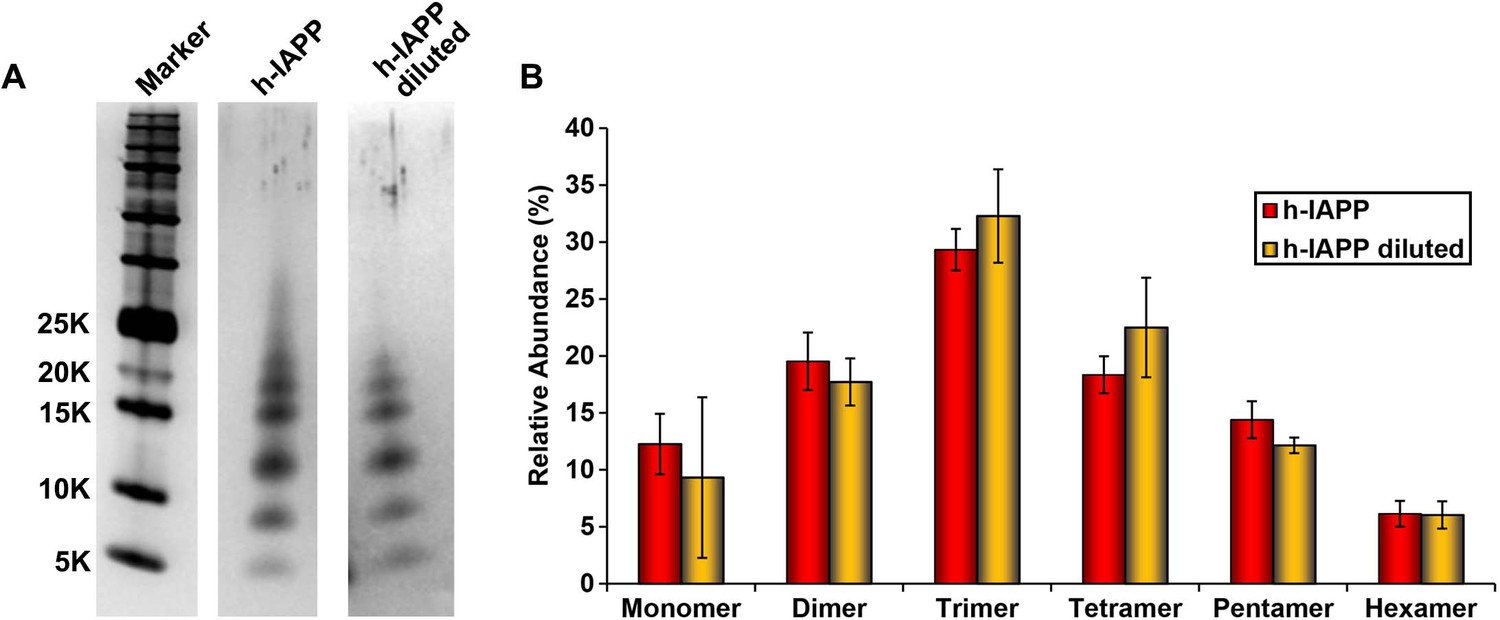
Dilution of h-IAPP by 30% does not change the distribution of the toxic oligomers.
A 20 µM stock solution of h-IAPP was prepared in Tris HCl buffer (20 mM, 25°C) and incubated until the middle of the lag phase was reached. The solution was centrifuged at 20,000 g for 20 min and an aliquot of the supernatant was removed, diluted to a final concentration of 14 µM and incubated for an additional 30 min at 37°C, before being irradiated for 10 s for photochemical cross-linking. A separate control sample (undiluted sample) was incubated for the same total length of time at 25°C and then photochemically cross-linked. (A) Representative SDS-PAGE of the photochemically cross-linked solutions (molecular weight marker: KDaltons). (B) Quantitative analysis of the gels shown in panel A: h-IAPP (red) and diluted h-IAPP (orange). Data represent mean ± SD of a minimum of three replicate experiments.
Figure 2—figure supplement 2
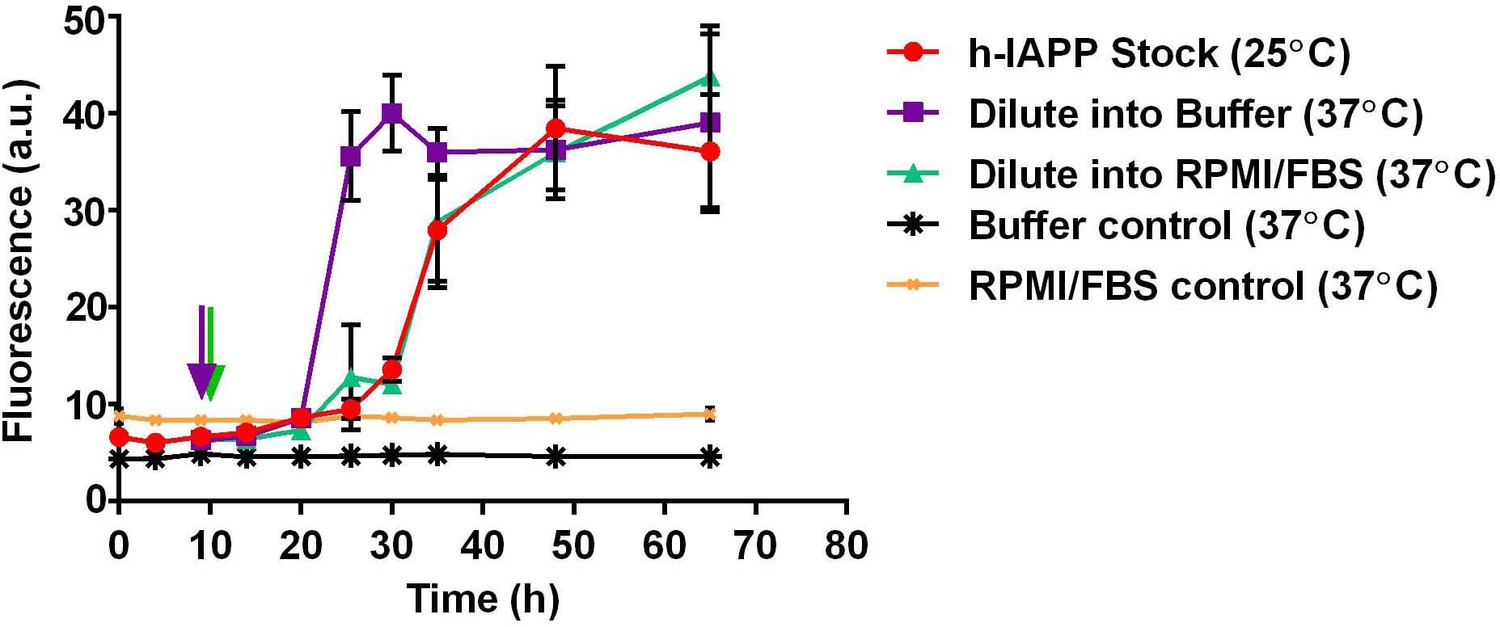
Dilution of h-IAPP by 30% into cell culture medium does not change the kinetics of amyloid formation.
A stock solution of h-IAPP (20 µM) was prepared in Tris HCl buffer (20 mM, 25°C) and the reaction was monitored by thioflavin-T fluorescence. Aliquots of the stock solution were removed after 10 h of incubation at 25°C (at mid-lag phase indicated by purple and green arrows) and diluted to a final concentration of 14 µM by transferring into either warm Tris HCl buffer (20 mM, 37°C) or warm cell culture medium (supplemented RPMI containing 10% FBS, 37°C) mimicking solution conditions in the cellular assays; amyloid formation was then monitored at 37°C. The data show that while the rate of amyloid formation by oligomers modestly increases upon dilution into warm Tris HCl buffer, there is no detectable effect upon dilution into warm cell culture medium; the modest increase in rate (decrease in the lag phase length) due to the increase in temperature is offset by the effect of the medium. Data represent mean ± SD of three to six replicates per condition. Some of the error bars are the same size or smaller than the symbols in the graph.
Figure 3 with 2 supplements
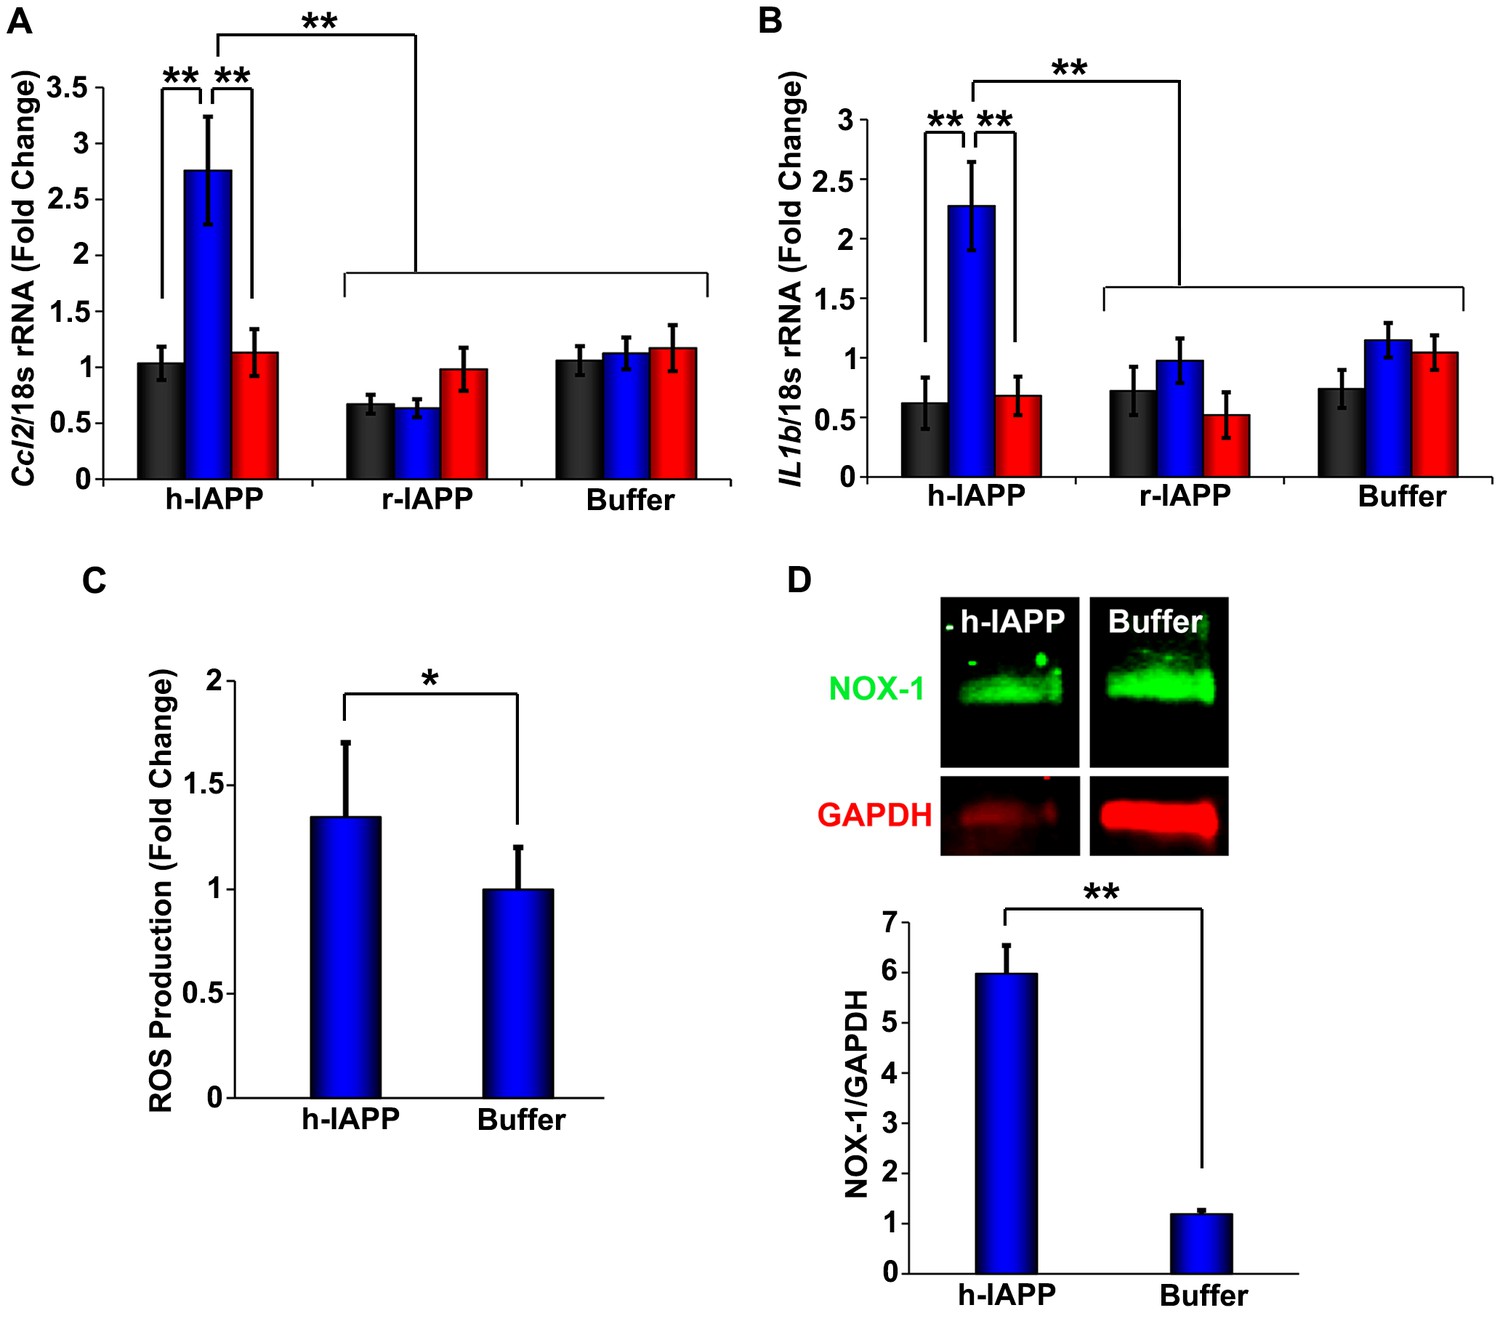
h-IAPP lag phase intermediates upregulate pro-inflammatory cytokines and oxidative stress.
(A and B) qPCR studies of INS-1 β-cells treated with h-IAPP: Lag phase intermediates (blue) upregulate (A) Ccl2 and (B) Il1b, but time-zero species (black), amyloid fibrils (red) and r-IAPP at the same time points do not. The peptide concentration after dilution into β-cell assays was 14 µM. (C) DHE-fluorescence assays of β-cells treated with h-IAPP lag phase intermediates show significant h-IAPP induced ROS production compared to control cells. (D) Western blot studies show upregulation of NOX1 in β-cells treated with h-IAPP lag phase intermediates compared to buffer treated cells. Data represent mean ± SD (DHE studies) and mean ± SEM (qPCR) of three to six replicate wells per condition and a minimum of three to ten replicate experiments per group (*p<0.05; **p<0.01). Figure 3—figure supplements 1 and 2 provide additional concurrent experiments showing that h-IAPP induced loss in β-cell viability is accompanied by ROS and cleaved caspase-3 production.
Figure 3—figure supplement 1
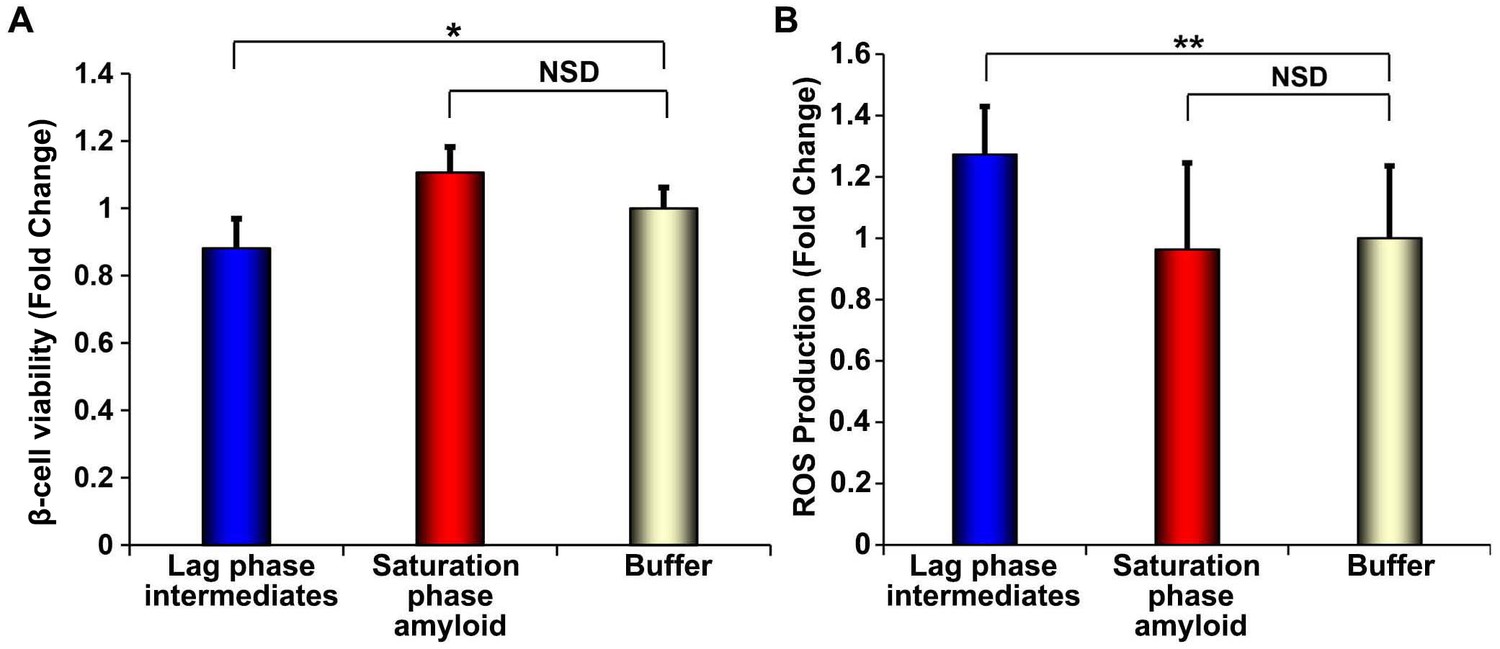
h-IAPP lag phase intermediates induce ROS production in INS-1 β-cells.
(A) Alamar Blue reduction assays and (B) DHE fluorescence assays of β-cells treated for 1 h with h-IAPP lag phase intermediates (blue), amyloid fibrils (red) or buffer (gold) show significant toxicity and ROS production induced by the lag phase intermediates but not by the amyloid fibrils. The final peptide concentrations after dilution into β-cell assays was 28 µM. Peptide solutions were incubated on cells for a shorter amount of time (1 h) in oxidative stress experiments and concurrent control β-cell viability assays shown in panels A and B, than generally employed in our standard β-cell viability assays (5 h), since the production and detection of transient ROS occurs prior to detectable loss in cell viability. The degree of loss in β-cell viability after 1 h incubation with toxic h-IAPP lag phase intermediates shown in panel A is significantly less than that detected after 5 h of incubation at the same peptide concentration, shown in Figure 10A. Data represent mean ± SD of three to ten technical replicates per condition and a minimum of three biological replicate experiments per group (*p<0.01, **p<0.01).
Figure 3—figure supplement 2
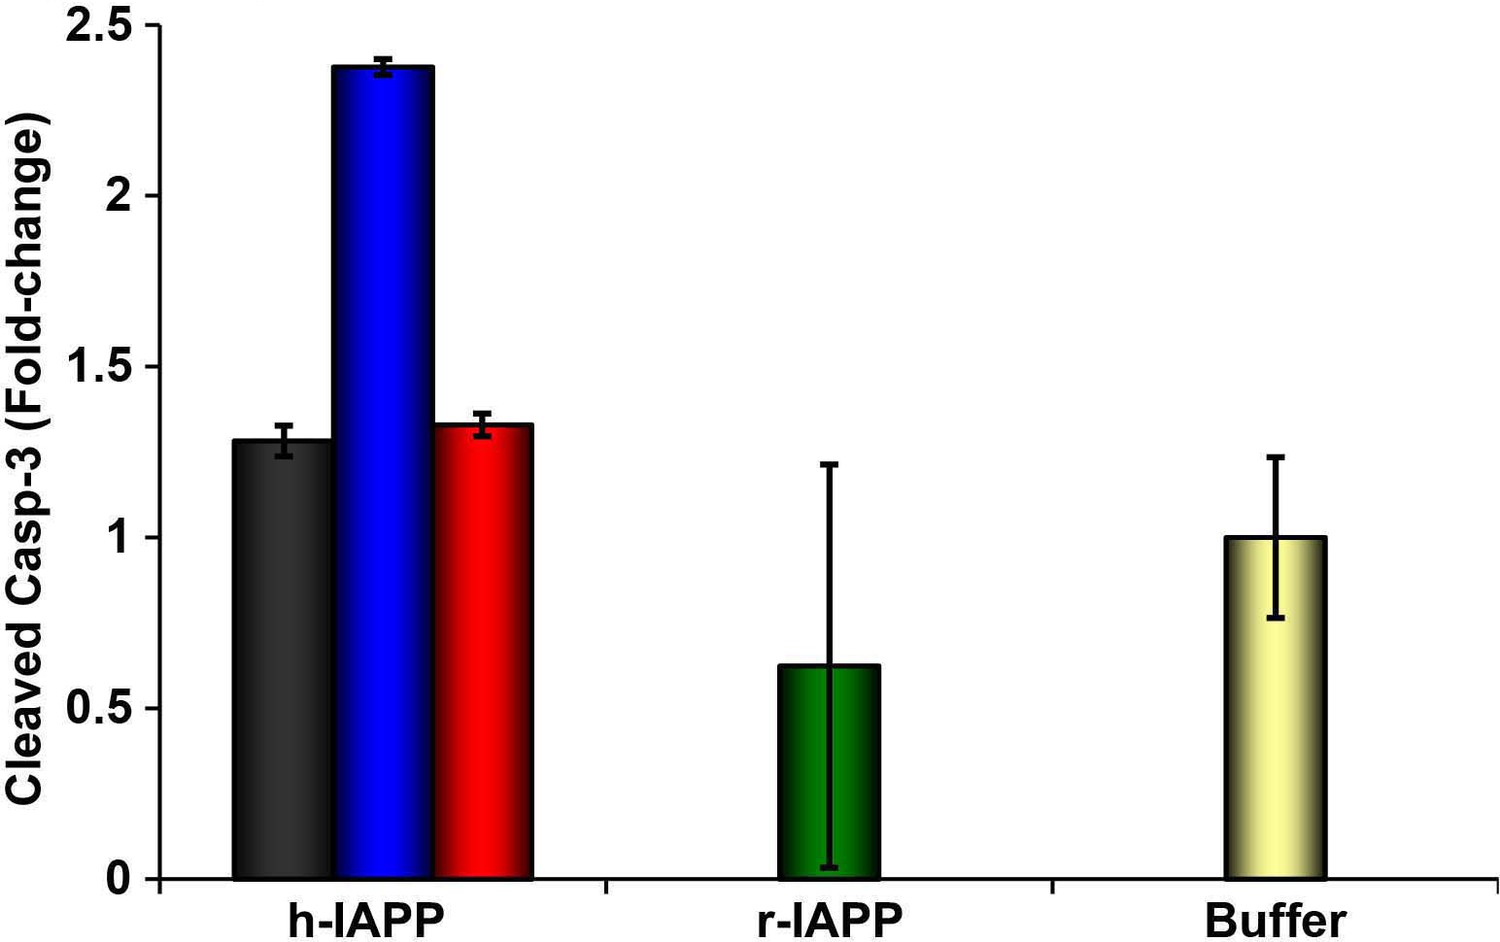
Toxic h-IAPP lag phase intermediates induce β-cell apoptosis, but freshly dissolved h-IAPP (time-zero) and amyloid fibrils do not.
Cleaved caspase-3 colorimetric assays of β-cells treated with exogenous h-IAPP lag phase intermediates (blue) show an increase in cleaved caspase-3, but time-zero h-IAPP species (black), h-IAPP amyloid fibrils (red), r-IAPP (green) and buffer (gold) do not. IAPP kinetic species were produced at 25°C in solutions containing 20 μM peptide. Final peptide concentration after dilution into β-cell assays was 14 μM. Data represent mean ± SEM of three replicates per condition.
Figure 4 with 5 supplements
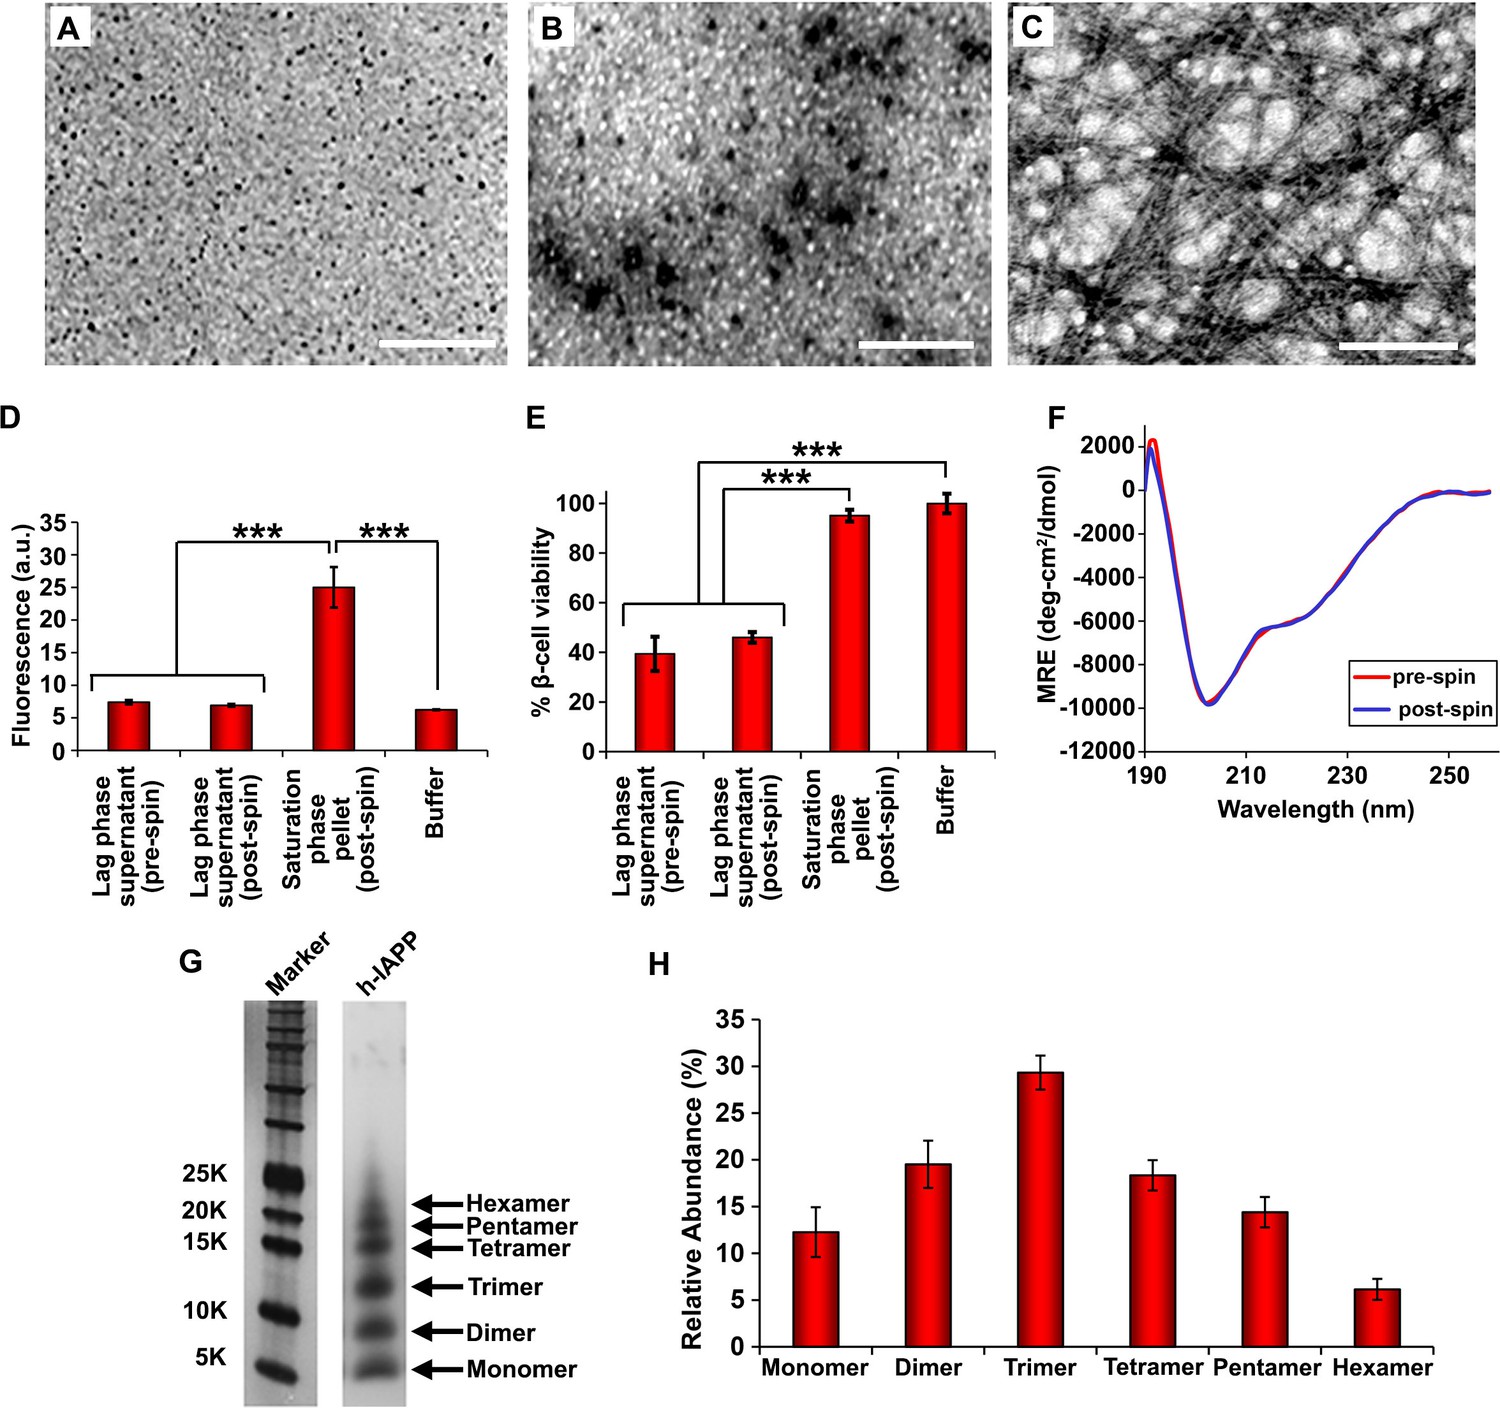
Toxic h-IAPP lag phase intermediates are soluble, low order oligomers with partial apparent α-helical structure.
(A–C) TEM images: (A) r-IAPP, (B) supernatant of ultracentrifuged solution of h-IAPP lag phase intermediates produced after 10 h of incubation, and (C) resuspended pellet of ultracentrifuged solution of h-IAPP amyloid fibrils produced after 70 h of incubation (Scale bars: 200 nm). (D) Thioflavin-T binding assays confirm absence of amyloid fibrils in solutions of h-IAPP lag phase intermediates before ultracentrifugation and in the ultracentrifuged solutions of h-IAPP lag phase intermediates shown in panel B; they also confirm the presence of amyloid in the resuspended pellets of ultracentrifuged saturation phase solutions shown in panel C. The buffer control sample contains free thioflavin-T and the resulting fluorescence from this control solution is similar to that of free thioflavin-T solution by itself, and is thus the baseline. (E) Alamar Blue reduction assays show that the supernatant of samples of lag phase intermediates are toxic before and after ultracentrifugation, while the resuspended pellet of ultracentrifuged saturation phase samples are not toxic. (F) CD spectra of toxic lag phase intermediates before (red) and after (blue) ultracentrifugation. Data are plotted as mean residue ellipticity. (G) Representative SDS-PAGE of photochemically cross-linked toxic h-IAPP lag phase intermediates: lane-1, markers (molecular weight: KDaltons); lane-2, h-IAPP. (H) Quantitative analysis of the gels shown in panel G show a distribution of low order oligomers at time points of toxicity ranging from monomers to hexamers. Samples assessed in panels B–H were ultracentrifuged at 20,000 g for 20 min. Samples assessed in panels B–F used aliquots from the same peptide solutions. h-IAPP solutions contained 20 µM peptide. The peptide concentration after dilution into β-cell assays was 14 µM. Data represent mean ± SD of three to six replicate wells per condition and a minimum of three to nine replicate experiments per group (***p<0.001). Figure 4—figure supplements 1–5 provide additional biophysical characterization data for h-IAPP and a control peptide.
Figure 4—figure supplement 1
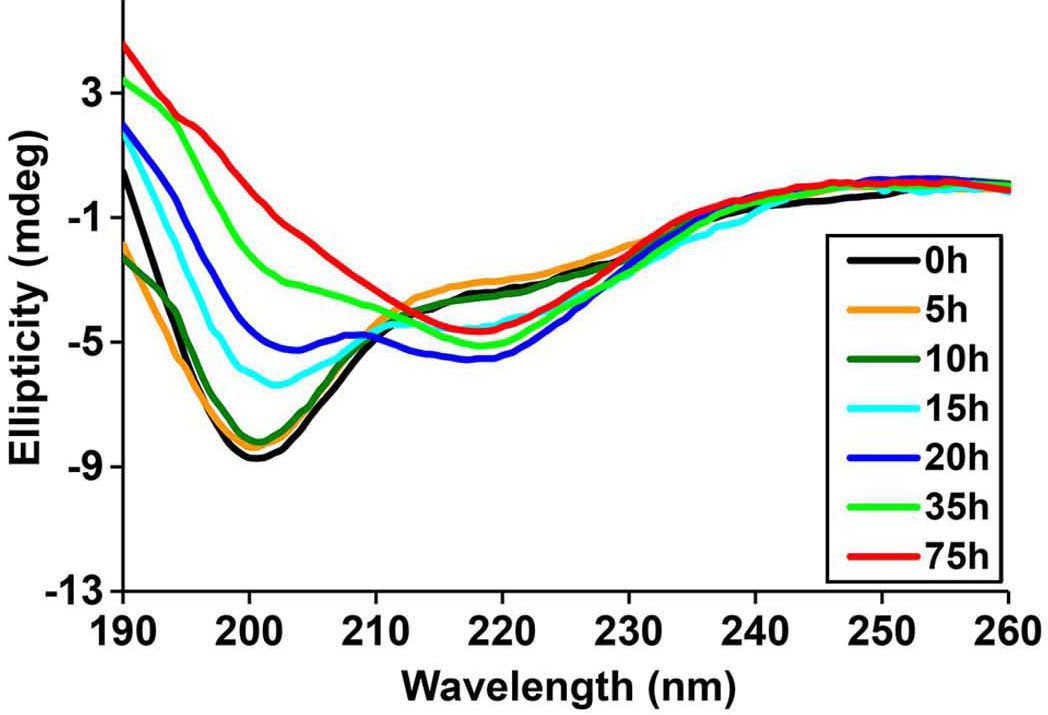
Time-dependent Far UV CD data of h-IAPP.
The lag time for h-IAPP to form amyloid under these conditions is on the order of 30 hr. The data show a conformational change from random coil to apparent α-helices that occur during the lag phase, followed by conversion to β-sheet structure in the growth phase.
Figure 4—figure supplement 2
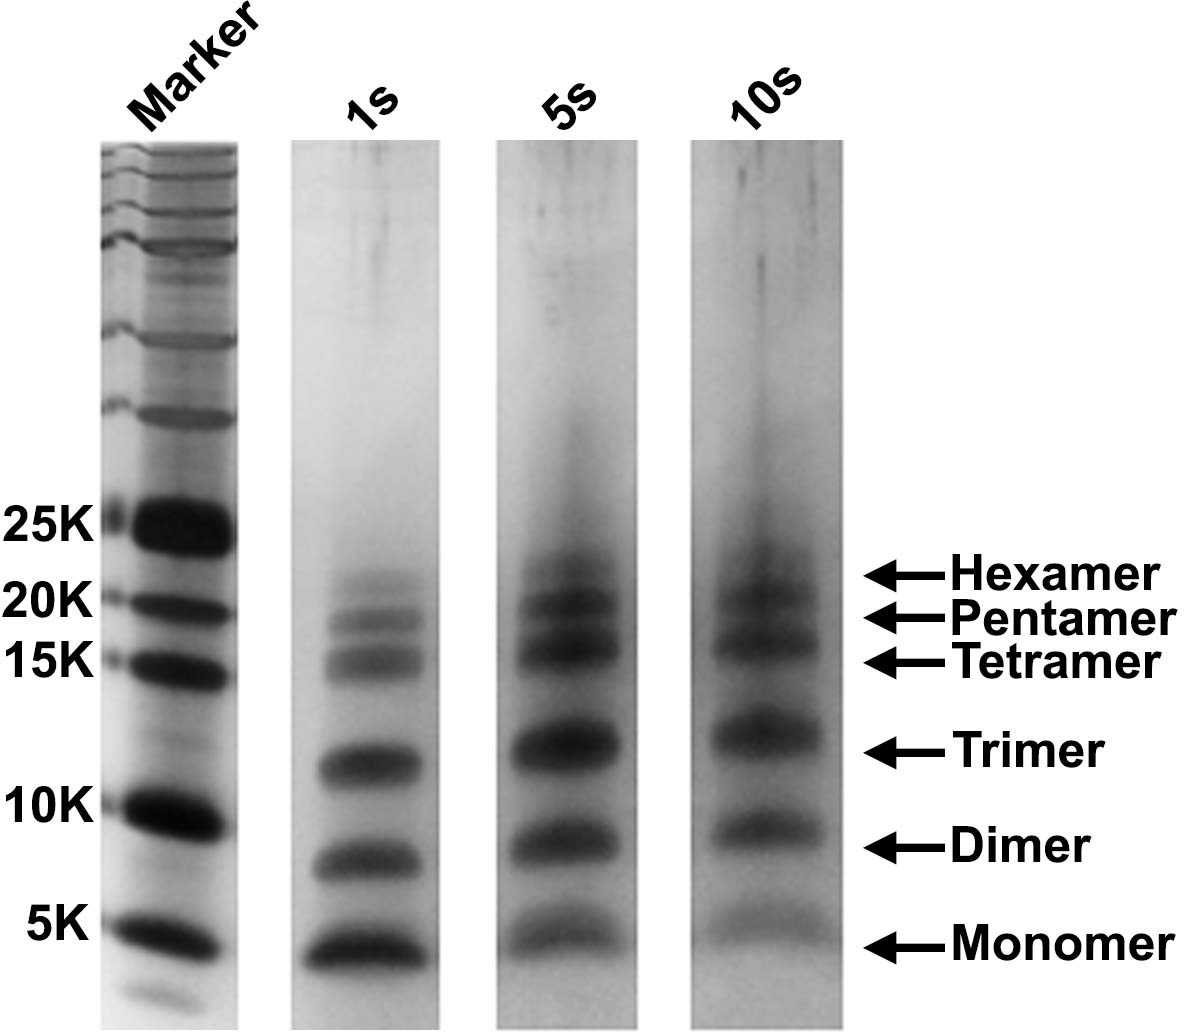
The detection of monomers through hexamers is not a consequence of the choice of irradiation time.
A 20 µM stock solution of h-IAPP was prepared in Tris HCl buffer (20 mM, 25°C) and incubated until the middle of the lag phase was reached. The solution was centrifuged at 20,000 g for 20 min and aliquots of the supernatant were removed and irradiated for 1, 5 and 10 s for photochemical cross-linking. Representative SDS-PAGE of the photochemically cross-linked solutions are shown (molecular weight marker: KDaltons).
Figure 4—figure supplement 3
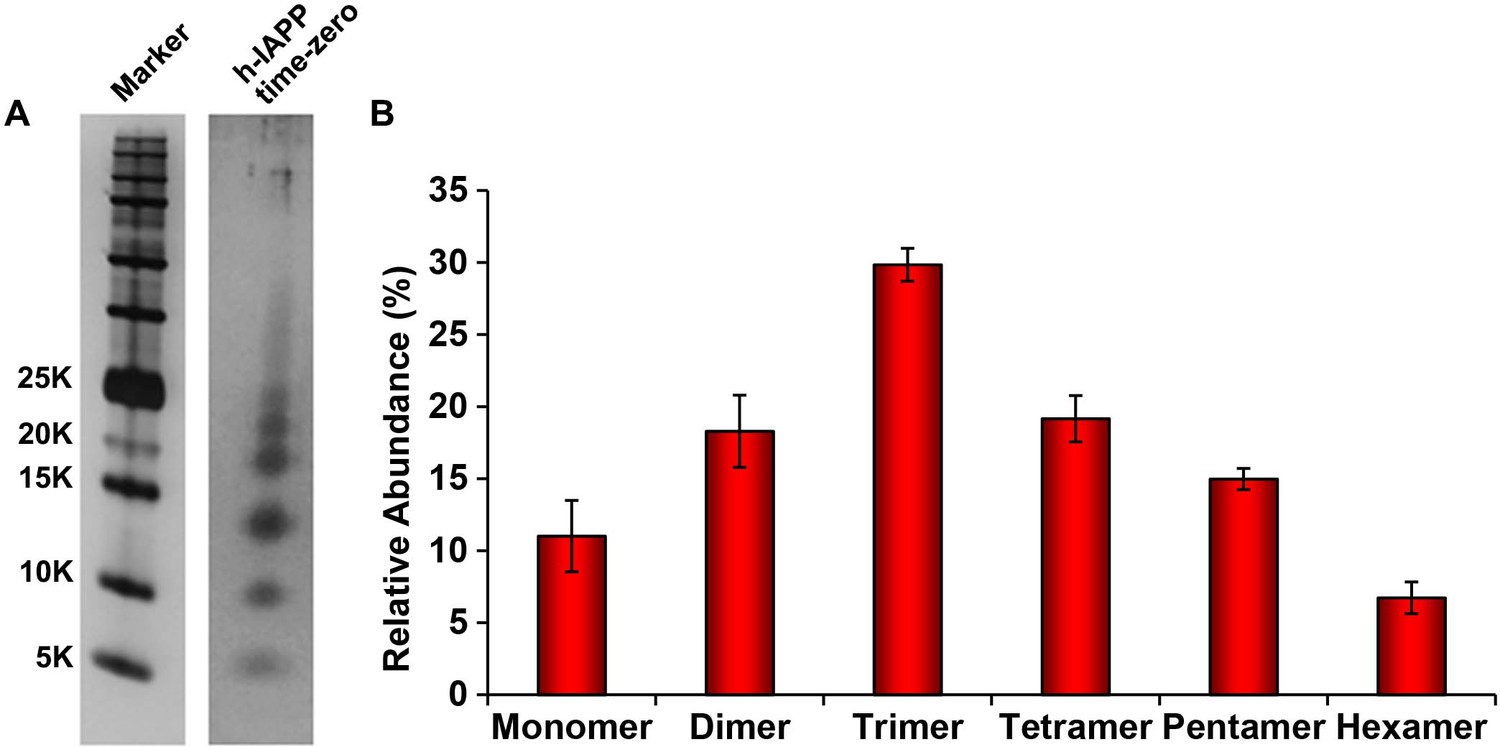
The distribution of photochemically cross-linked oligomers detected for h-IAPP at 'time-zero' is similar to those detected for toxic h-IAPP lag phase intermediates.
A 20 µM stock solution of h-IAPP was prepared in Tris HCl buffer (20 mM, 25°C) and aliquots were removed after several minutes and irradiated for 10 s for photochemical cross-linking. (A) Representative SDS-PAGE of the photochemically cross-linked solutions (molecular weight marker: KDaltons). (B) Quantitative analysis of the gels shown in panel A. Data represent mean ± SD of a minimum of three replicate experiments.
Figure 4—figure supplement 4
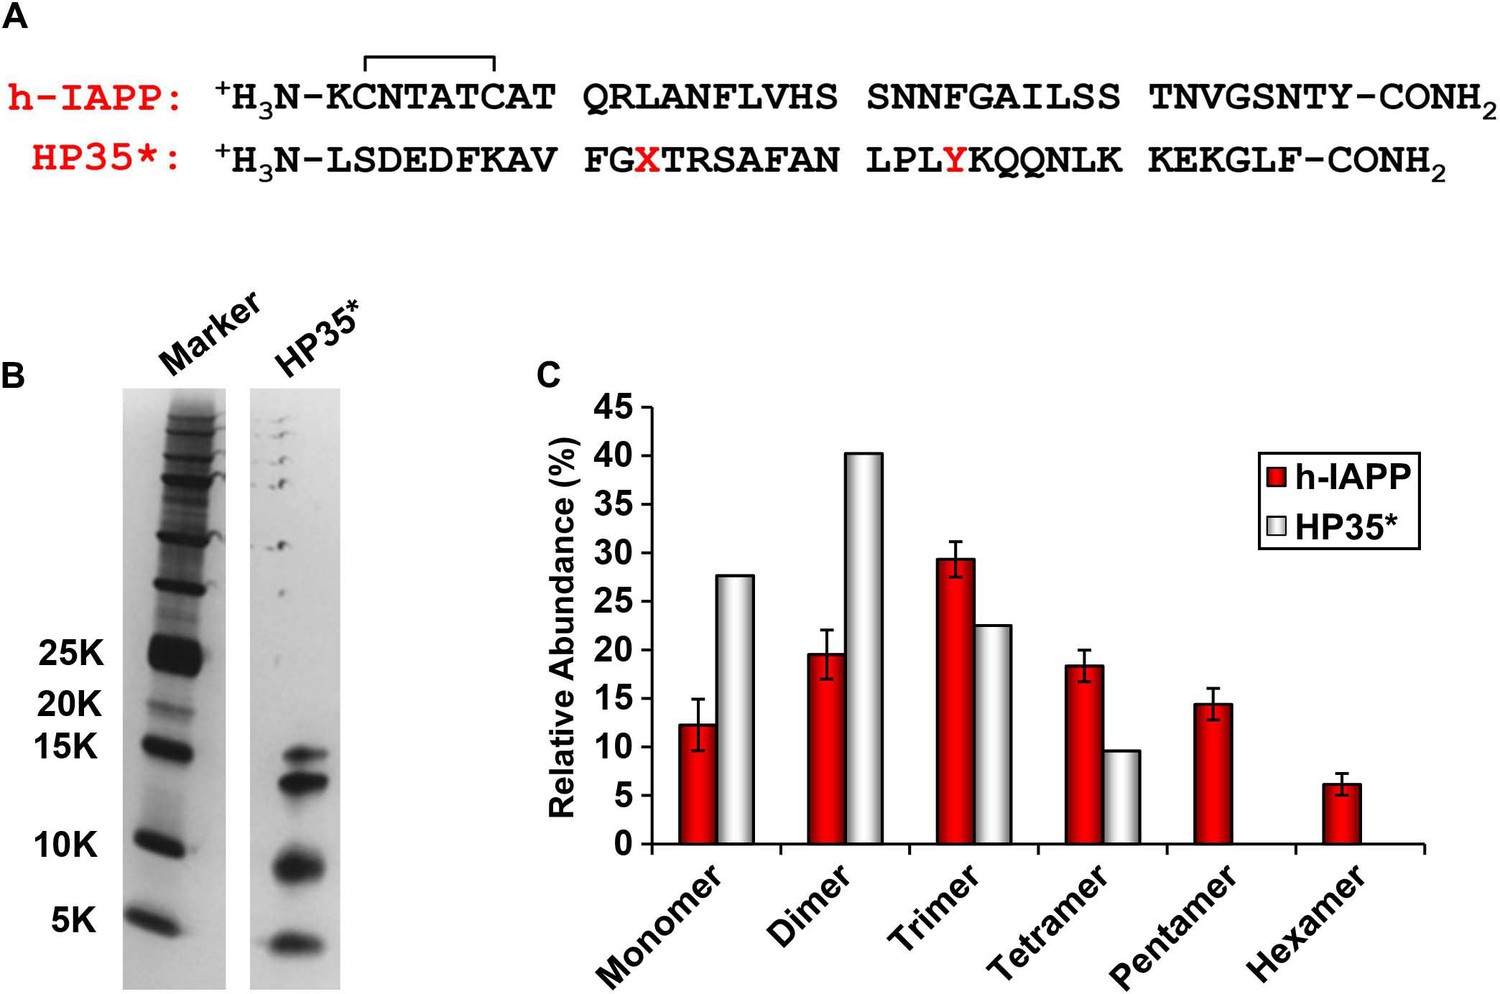
The distribution of photochemically cross-linked oligomers detected for h-IAPP is different from that observed for a monomeric protein of similar size.
(A) Sequence of h-IAPP and a variant of the villin headpiece helical subdomain (HP35*) in which the single Met residue was replaced by Nor-Leu and the single Trp by Tyr. These substitutions were made to ensure that the HP35* contains the same photochemically reactive residues as h-IAPP. The disulfide bond in h-IAPP and the amidated C-terminus are shown. (B) SDS-PAGE gels of photochemically cross-linked samples of h-IAPP and the control peptide HP35*. Cross-linking was performed for 10 s, as described in the methods. (C) Observed distribution of oligomers for h-IAPP (red) and HP35* (white). Data represent mean ± SD of three replicates per condition.
Figure 4—figure supplement 5
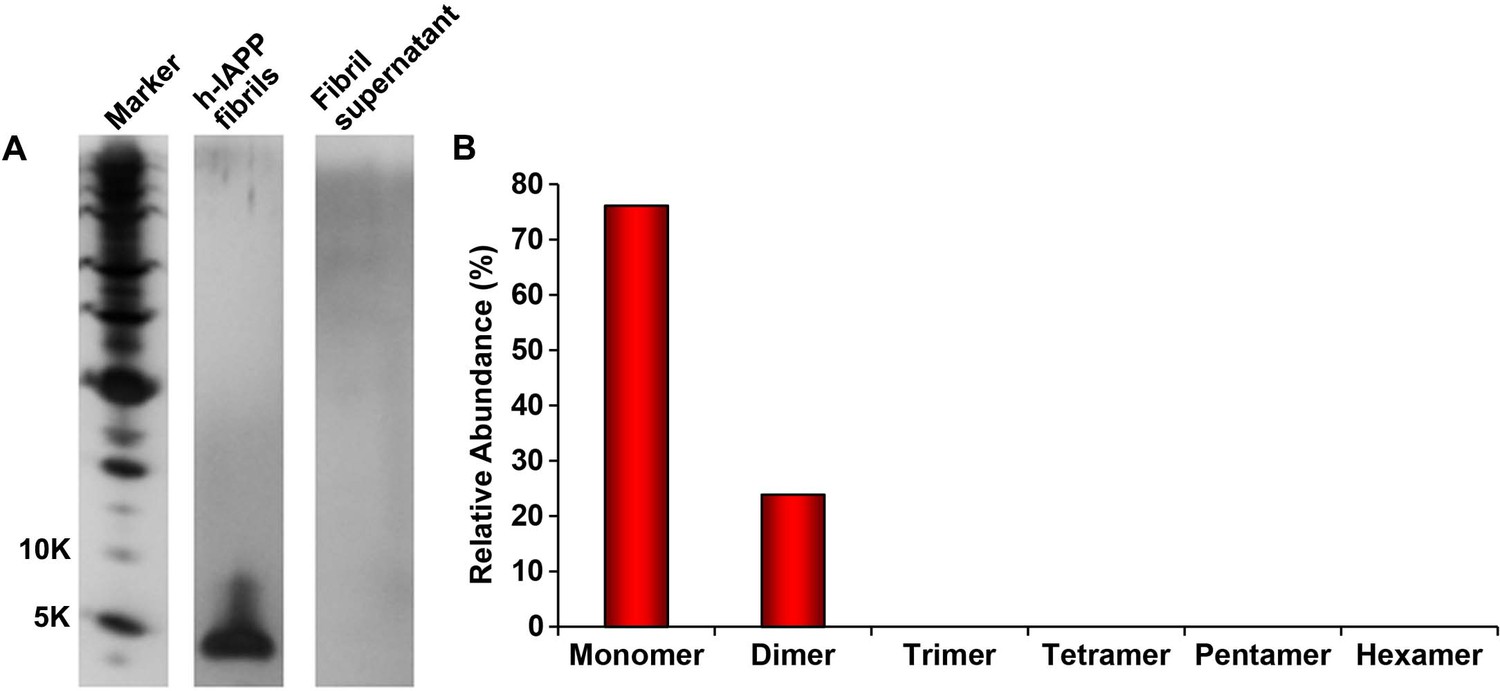
The distribution of photochemically cross-linked oligomers detected for solutions of non-toxic h-IAPP fibrils is significantly different than for toxic h-IAPP lag phase intermediates.
A 20 µM stock solution of h-IAPP was prepared in Tris HCl buffer (20 mM, 25°C) and incubated until the saturation phase was reached. The solution was centrifuged at 20,000 g for 20 min and the supernatant was removed from the pellet containing amyloid fibrils and photochemically cross-linked. The pellet was resuspended in buffer and likewise photochemically cross-linked. (A) Representative SDS-PAGE of the photochemically cross-linked solutions (molecular weight marker: KDaltons). (B) Quantitative analysis of the gels shown in panel A. No peptide was detected in the supernatant.
Figure 5 with 7 supplements
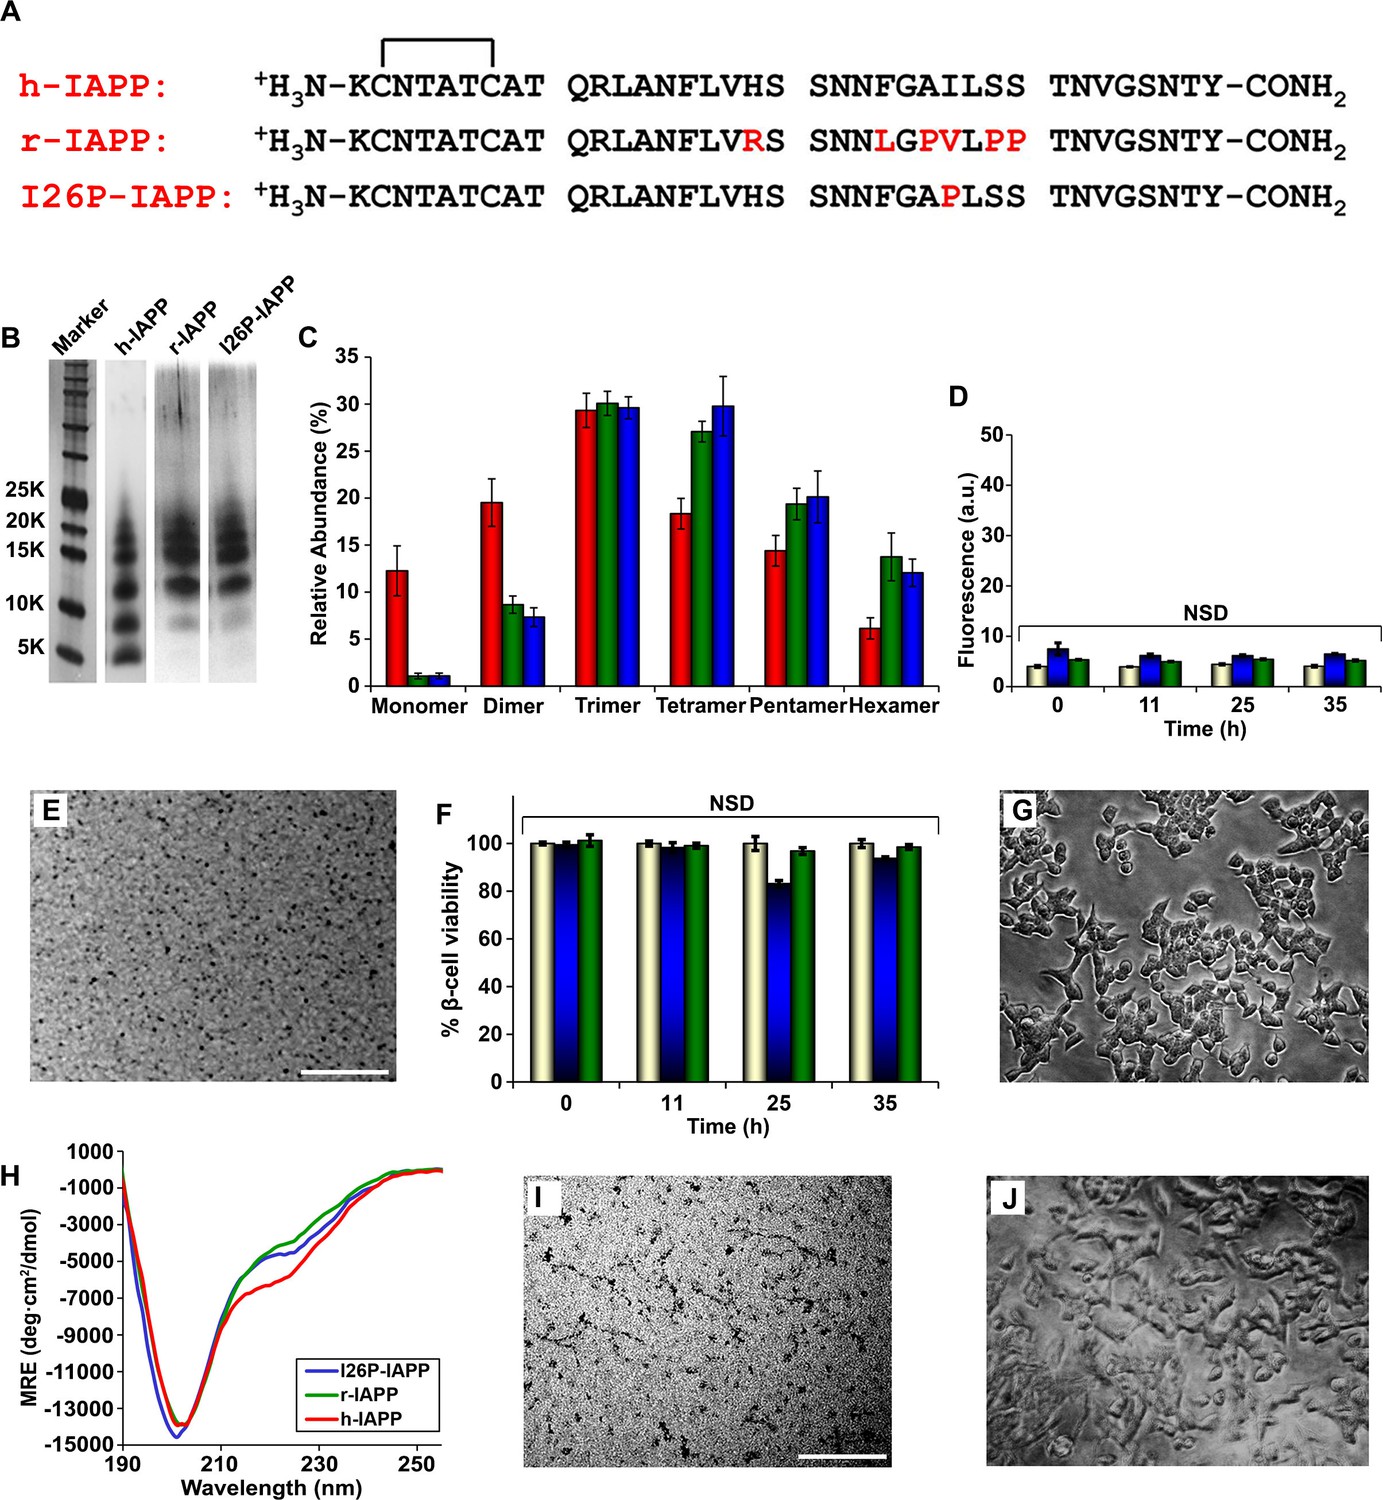
r-IAPP and I26P-IAPP form oligomers that are similar in size to those formed by h-IAPP, but do not form amyloid under the conditions of these studies, and are not toxic.
(A) Primary sequence of h-IAPP, r-IAPP and I26P-IAPP. Mature polypeptides contain a disulfide between Cys2 and Cys7, indicated by brackets, and an amidated C-terminus. Amino acid positions that differ from h-IAPP are indicated in red. (B) Representative SDS-PAGE of photochemically cross-linked non-toxic r-IAPP and I26P-IAPP show the presence of low order oligomers. Peptide solutions were incubated at 25°C until time points corresponding to h-IAPP toxicity and ultracentrifuged for 20,000 g for 20 min. Aliquots of the supernatants were removed and irradiated for 10 s for cross-linking, and analyzed using silver staining. Lane-1, markers (molecular weight: KDaltons); lane-2, h-IAPP; lane 3, r-IAPP; and lane 4, I26P-IAPP. (C) Quantitative analysis of the gels shown in panel B reveal a distribution of low order oligomers ranging up to hexamers: h-IAPP (red); r-IAPP (green); and I26P-IAPP (blue). (D) Thioflavin-T binding assays of aliquots of buffer (gold), r-IAPP (green) or I26P-IAPP (blue) at different time points over the course of aggregation. (E) TEM image of r-IAPP oligomers after 14 h incubation (Scale bars: 200 nm). (F) Alamar Blue reduction assays of β-cells treated with buffer (gold), r-IAPP (green) or I26P-IAPP (blue) at different time points over the course of aggregation. (G) Light microscopy image of viable β-cells after treatment with r-IAPP aggregates shown in panel E. (H) CD spectra of I26P-IAPP (blue), r-IAPP (green) and h-IAPP (red). Data is plotted as mean residue ellipticity. (I) TEM image of I26P-IAPP oligomers after 14 h incubation. (J) Light microscopy image of viable β-cells treated with oligomers shown in panel I. IAPP solutions contained 20 µM peptide. The final peptide concentration after dilution into β-cell assays was 14 µM. Data represent mean ± SD of three to six replicate wells per condition and three replicate experiments per group (NSD: no significant difference; Scale bars: 200 nm). Figure 5—figure supplements 1–7 provide additional biochemical information, biophysical characterization and toxicity experiments for the non-toxic, non-amyloidogenic r-IAPP and h-IAPP mutants.
Figure 5—figure supplement 1
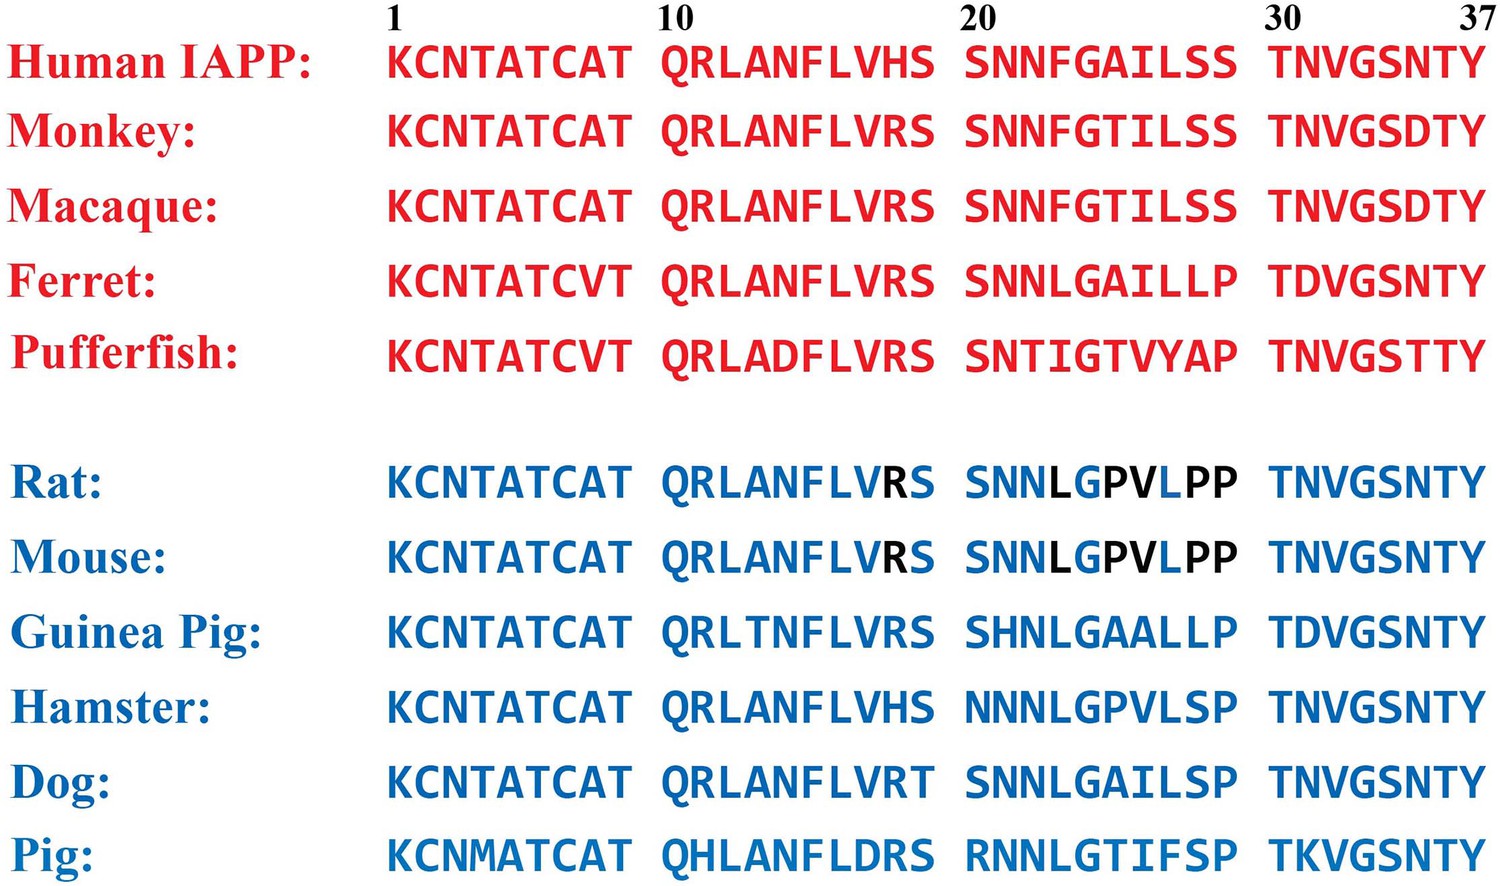
Primary sequences of IAPP from different species.
Sequences depicted in red have been shown to form amyloid in vitro and/or are from species that are known to form islet amyloid in vivo. Sequences in blue are non-amyloidogenic in vitro and/or are derived from species that do not form islet amyloid in vivo. Rat and mouse IAPP have identical sequences. The residues in rat/mouse IAPP (r-IAPP) that differ from the corresponding residues in human IAPP (h-IAPP) are indicated in black.
Figure 5—figure supplement 2
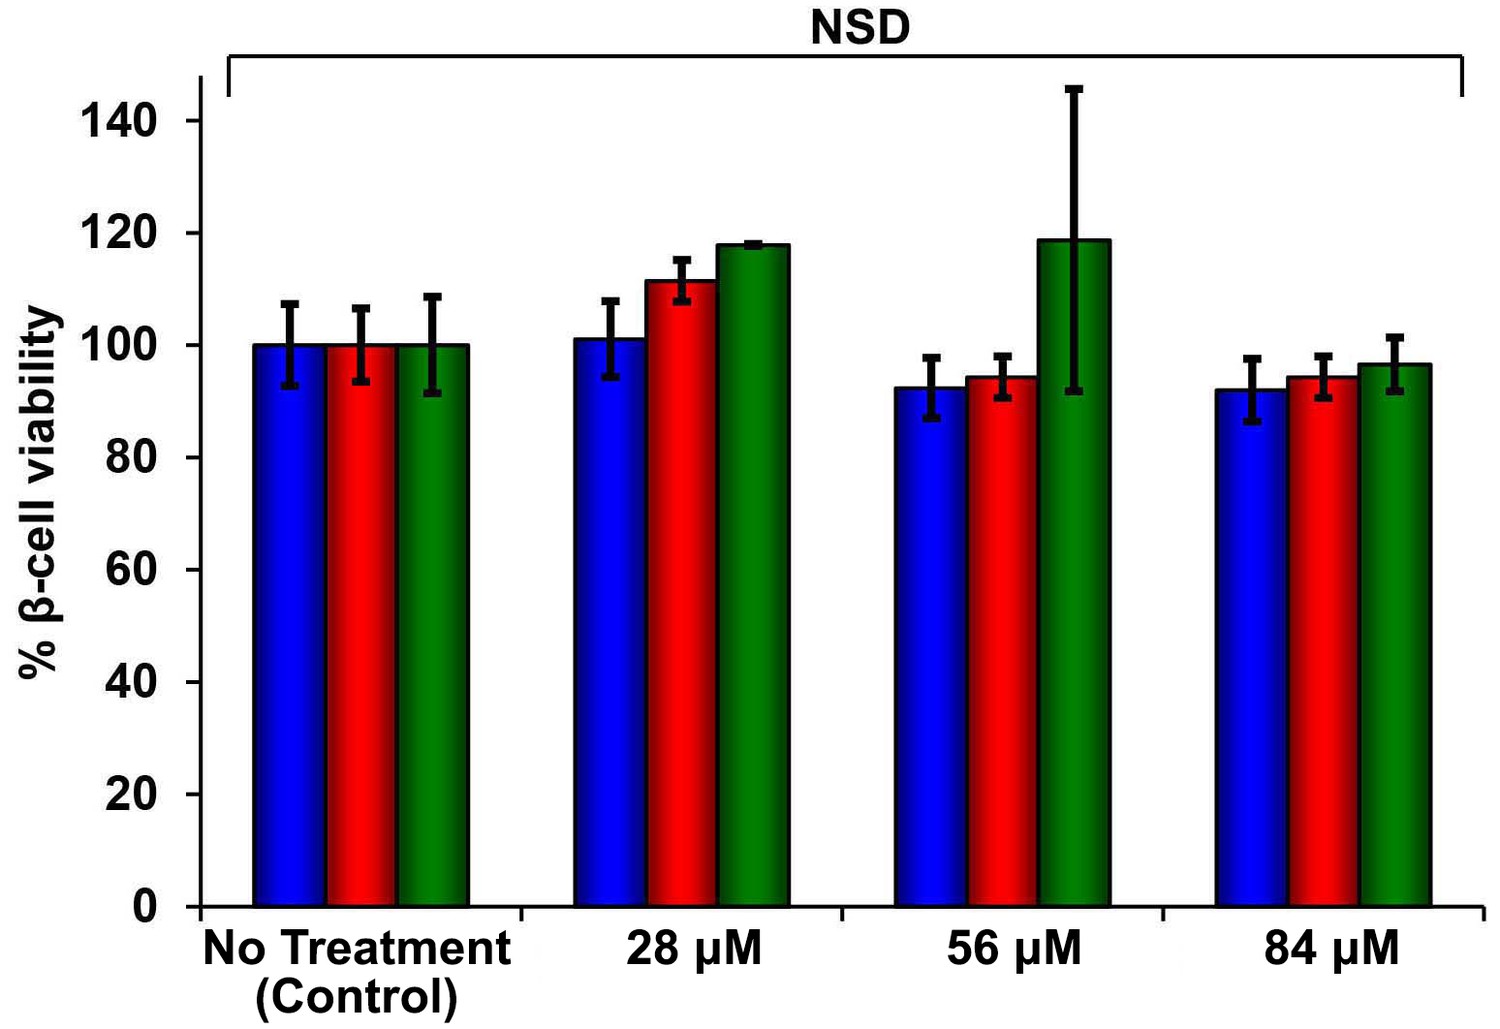
Dose-response studies show r-IAPP is not toxic.
Alamar Blue reduction assays of rat INS-1 β-cells treated with increasing concentrations of r-IAPP. Peptide solutions were prepared directly in cell culture medium (28, 56 and 84 µM peptide) and added to β-cells. Data show that r-IAPP is not significantly toxic at the concentrations examined after 24 h (blue), 48 h (red) or 96 h (green) of incubation on cells. Toxicity data represent mean ± SD of three to six technical replicates per condition and three biological replicates per group. NSD: no significant difference.
Figure 5—figure supplement 3
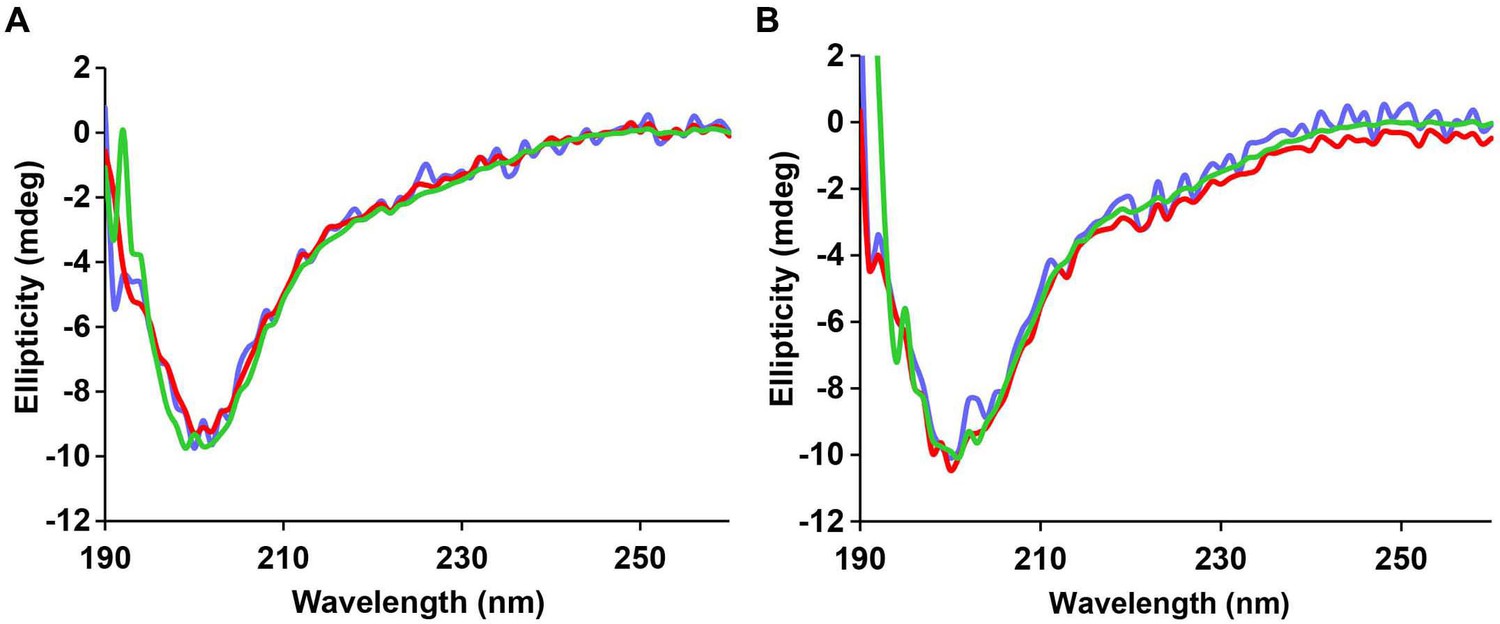
The CD spectrum of r-IAPP reveals random coil conformation and is independent of concentration and time.
CD data show a random coil conformation for r-IAPP at every dose examined at (A) time-zero and (B) after 5 h of incubation: 28 µM (blue), 56 µM (red) and 84 µM (green). Spectra are plotted in mdeg, but are normalized for concentration. A stock solution of r-IAPP was prepared and serially diluted.
Figure 5—figure supplement 4
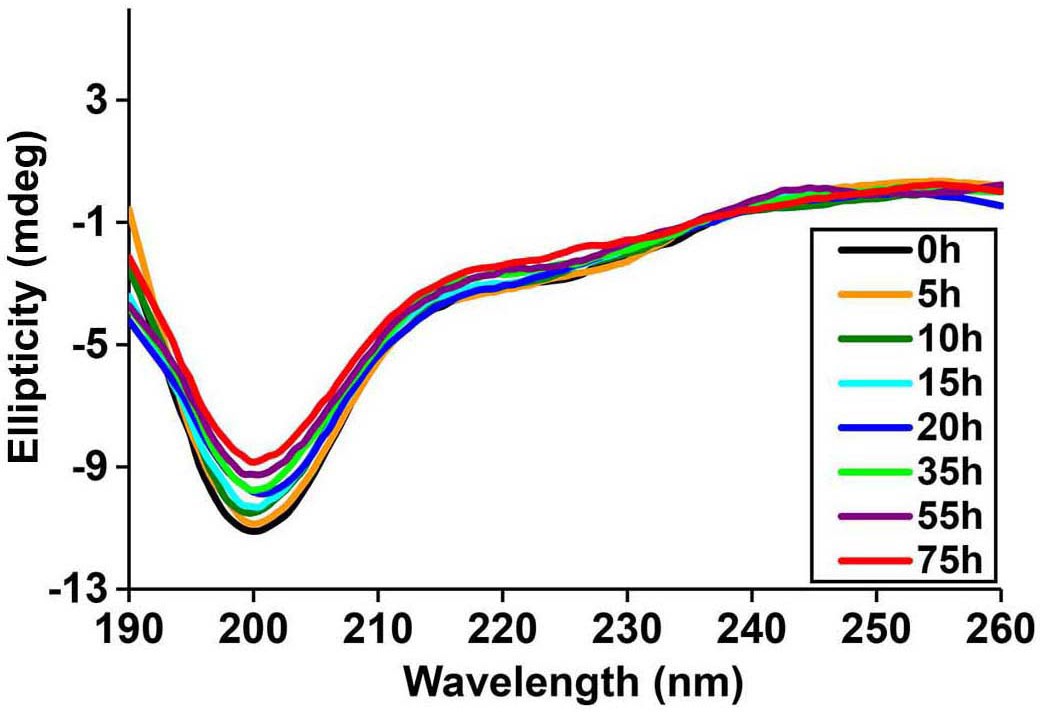
Time-dependent far UV CD data of I26P-IAPP.
CD data of I26P-IAPP collected at different time points over 75 h of aggregation confirm that this peptide does not form amyloid under these experimental conditions.
Figure 5—figure supplement 5
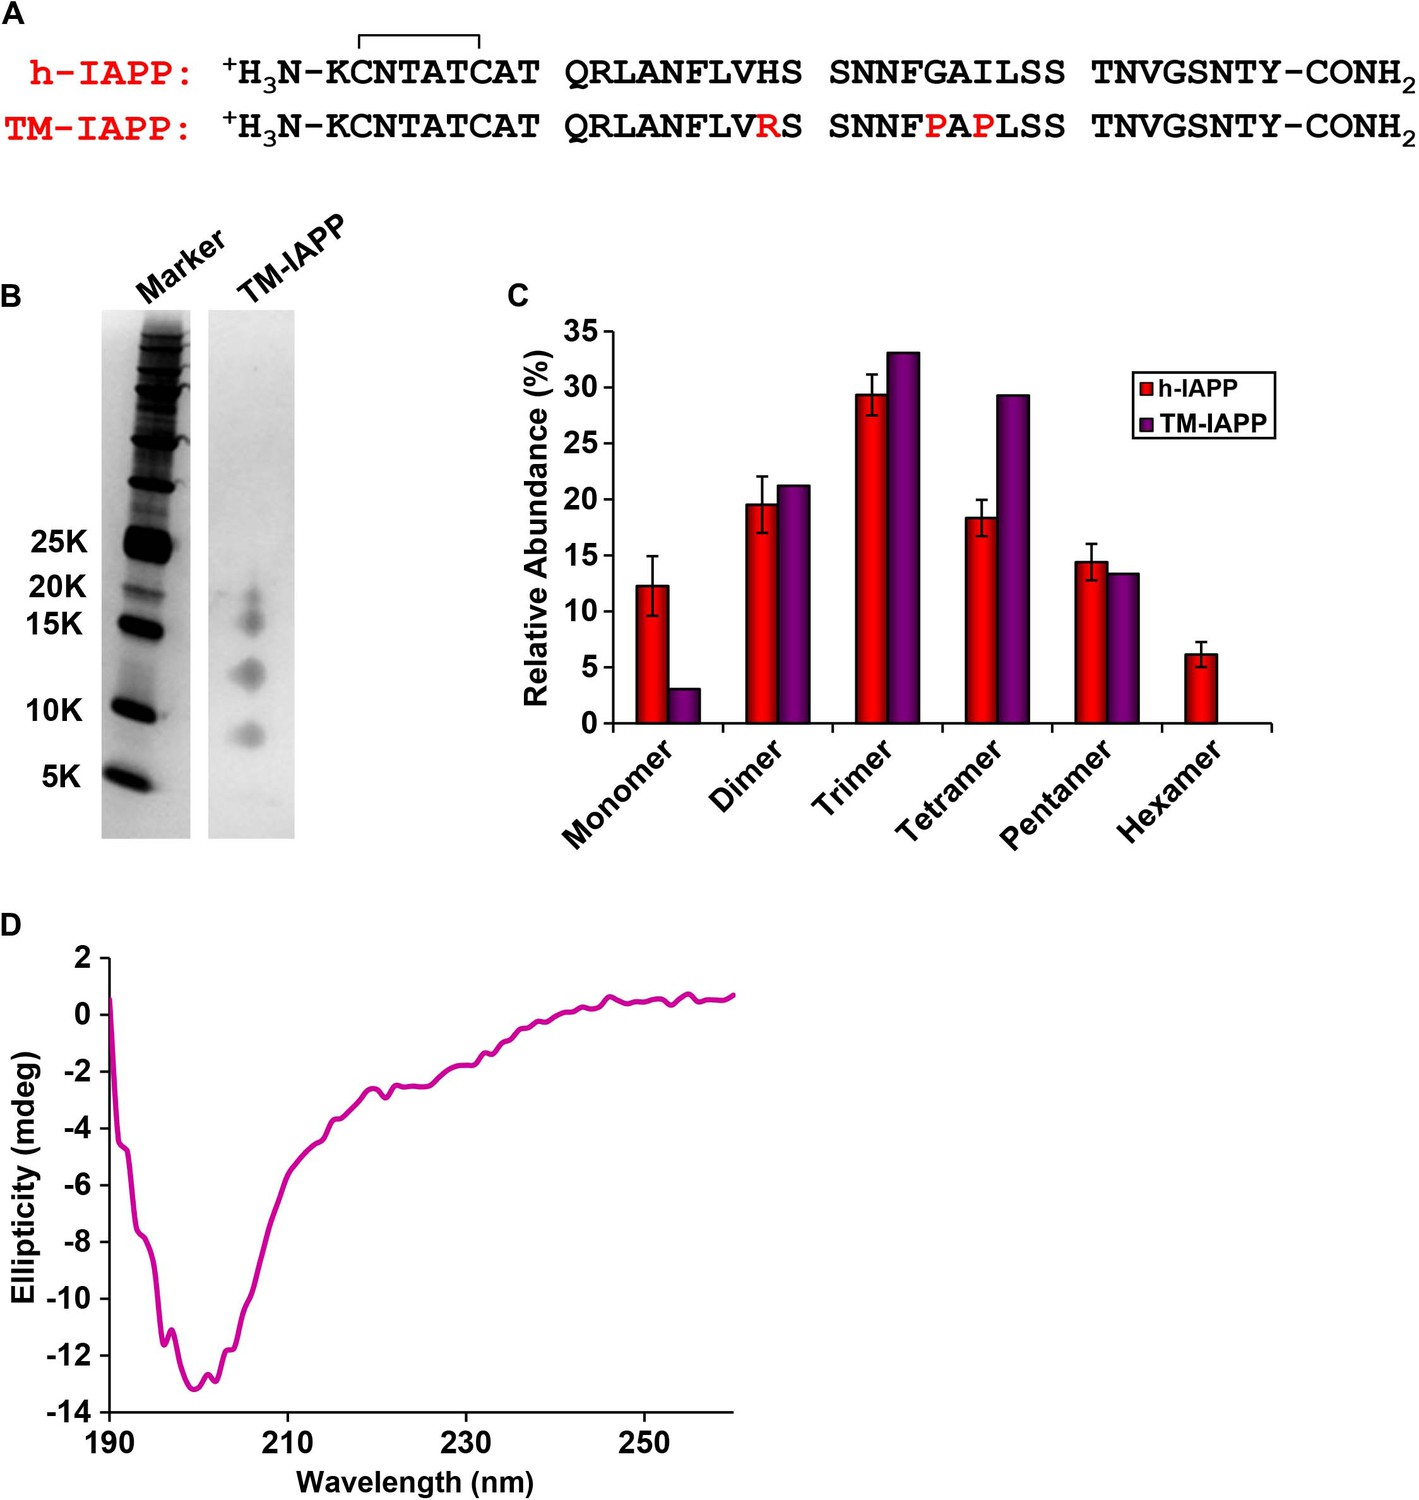
A designed, non-toxic H18R, G24P, I26P triple mutant of h-IAPP (TM-IAPP) oligomerizes.
(A) Sequence alignment of h-IAPP with TM-IAPP. Both peptides contain a disulfide bond and have amidated C-termini. (B) Representative SDS-PAGE gel of a photochemically cross-linked sample of TM-IAPP (molecular weight marker: KDaltons). A stock solution of TM-IAPP (20 μM) was prepared in Tris HCl buffer (20 mM, 25°C) and incubated until the mid-lag phase was reached. The solution was ultracentrifuged at 20,000 g for 20 min and the supernatant was removed, and photochemically cross-linked. (C) Quantitative analysis of the gel shown in panel B showing the observed distribution of oligomers for TM-IAPP (purple). The distribution for h-IAPP is also included for comparison (red). (D) CD Spectrum of TM-IAPP recorded at the midpoint of the lag phase. Data represent mean ± SD of three to six technical replicates per condition and a minimum of three to ten replicate experiments per group.
Figure 5—figure supplement 6
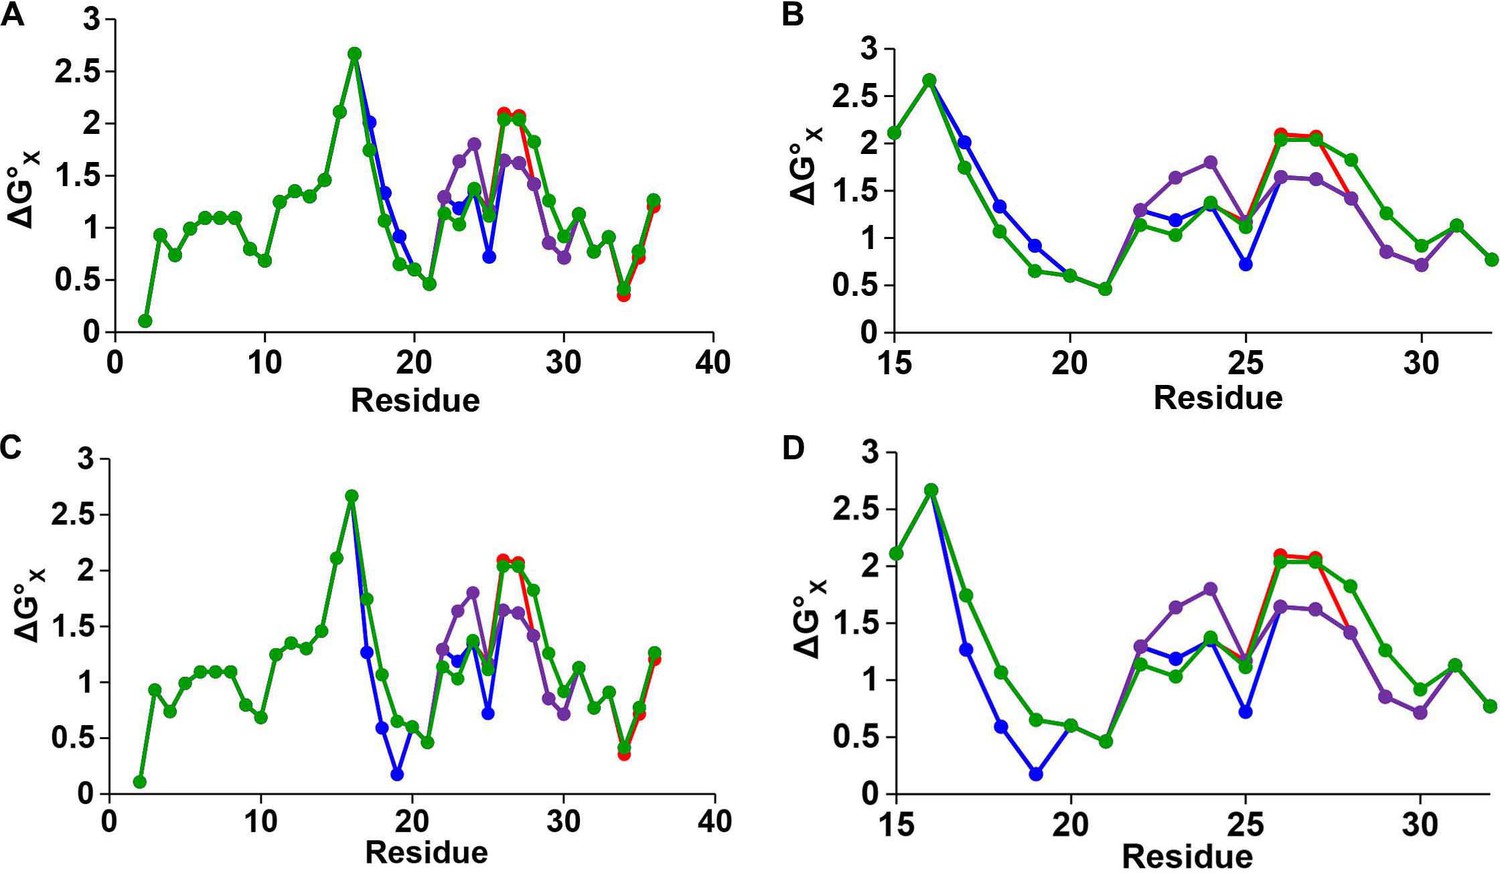
Hydropathy plots for IAPP peptides.
Plots of hydrophobicity versus residue number for h-IAPP (red), r-IAPP (green), TM-IAPP (purple) and I26P-IAPP (blue) constructed with a three residue sliding window. (A and B) Calculations performed assuming histidine is neutral. (B) An expansion of panel A showing the values from position 16 to 32 to emphasize the differences in this region. (C and D) Calculations performed assuming histidine is positively charged. (D) An expansion of panel C showing the values from position 16 to 32 to emphasize the differences in this region. The plots for all peptides overlap from position 2 to 16 and from position 31 to 37. h-IAPP and I26P-IAPP overlap at all positions with the exception of 25, 26 and 27. The hydrophobicity values are derived from the octanol to water scale of Wimley and White (Wimley et al., 1996). The vertical axes are residue solvation free energies calculated with mole-fraction units with glycine set to zero. Larger positive numbers indicate an increased hydrophobicity.
Figure 5—figure supplement 7
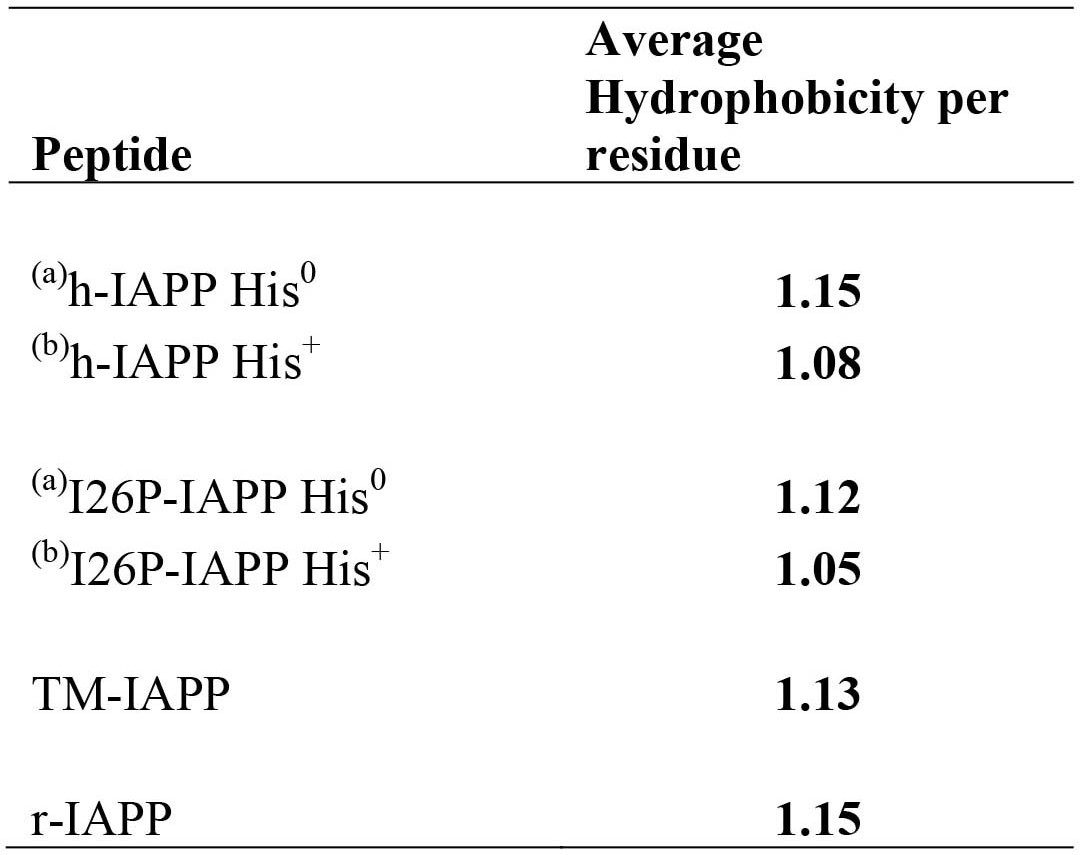
Average per residue hydrophobicity for different IAPP peptides.
The hydrophobicity values were taken from the octanol to water scale of Wimley and White (Wimley et al., 1996). Larger positive numbers indicate an increased hydrophobicity.
Figure 6 with 1 supplement
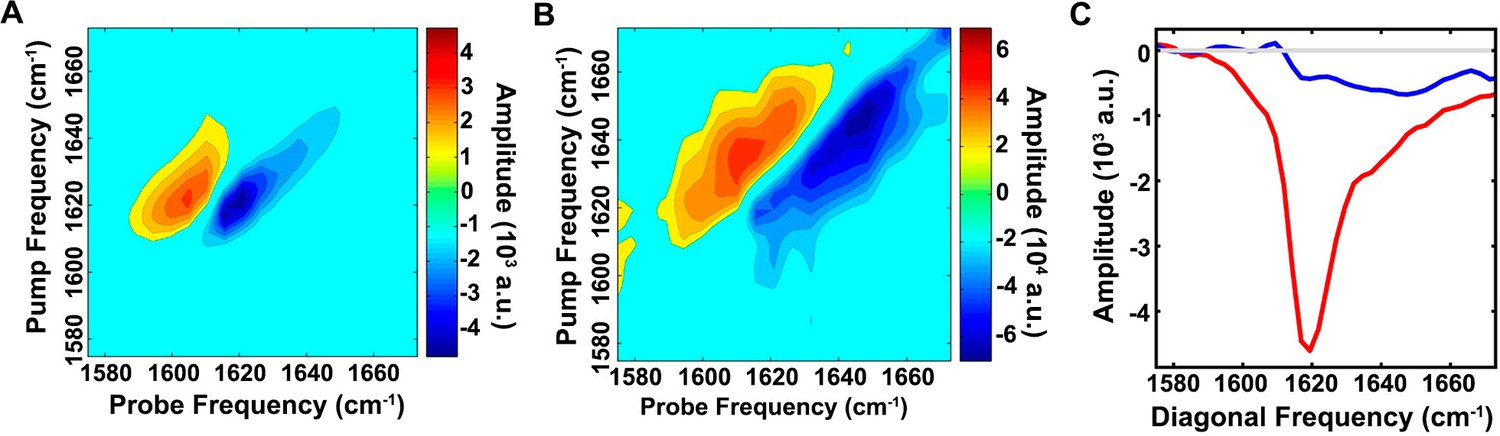
The ensemble of toxic h-IAPP oligomers contain only modest amounts of overall β-sheet structure.
2D IR spectra of h-IAPP: (A) Amyloid fibrils are rich in β-sheet structure, but (B) lag phase intermediates show no significant (<15%) β-sheet structure. The spectra in panels A and B are plotted on different intensity scales. (C) Comparison of the intensity of the diagonal slice in panels A and B: Intermediates (blue), fibrils (red) and zero baseline (grey). Figure 6—figure supplement 1 provides sequence alignment analysis of h-IAPP and Aβ40.
Figure 6—figure supplement 1
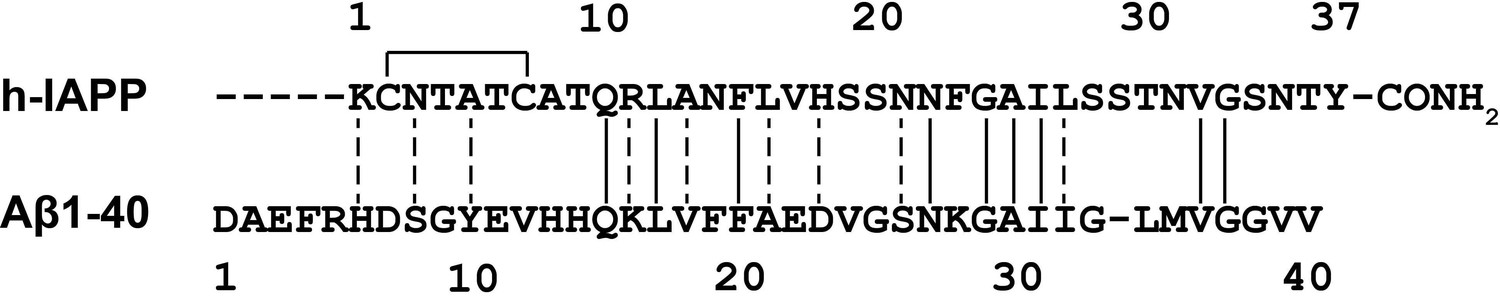
Sequence alignment of h-IAPP with Aβ40.
The disulfide bond in h-IAPP and the amidated C-terminus are shown. Solid vertical lines indicate amino acid identity; dashed lines indicate amino acid similarity.
Figure 7 with 14 supplements
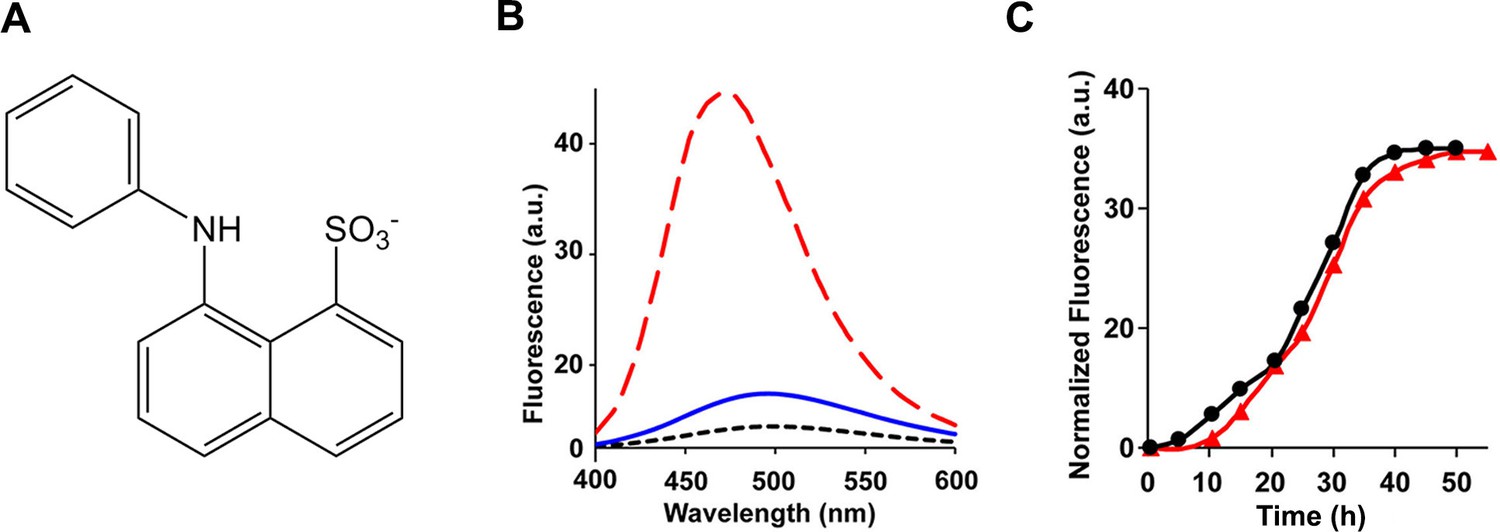
The ensemble of toxic h-IAPP oligomers do not bind ANS.
(A) Structural model of an ANS molecule. (B) ANS fluorescence emission spectra of h-IAPP at time-zero (black, ····), lag phase intermediates (blue, —) and amyloid fibrils (red, - - - -). (C) Kinetic assays monitored by ANS binding (●) and thioflavin-T binding (▲) confirm that h-IAPP lag phase intermediates do not bind ANS. Figure 7—figure supplements 1–14 provide additional dye-binding studies using bis-ANS and Nile Red, and biophysical characterization of the toxic h-IAPP lag phase intermediates.
Figure 7—figure supplement 1
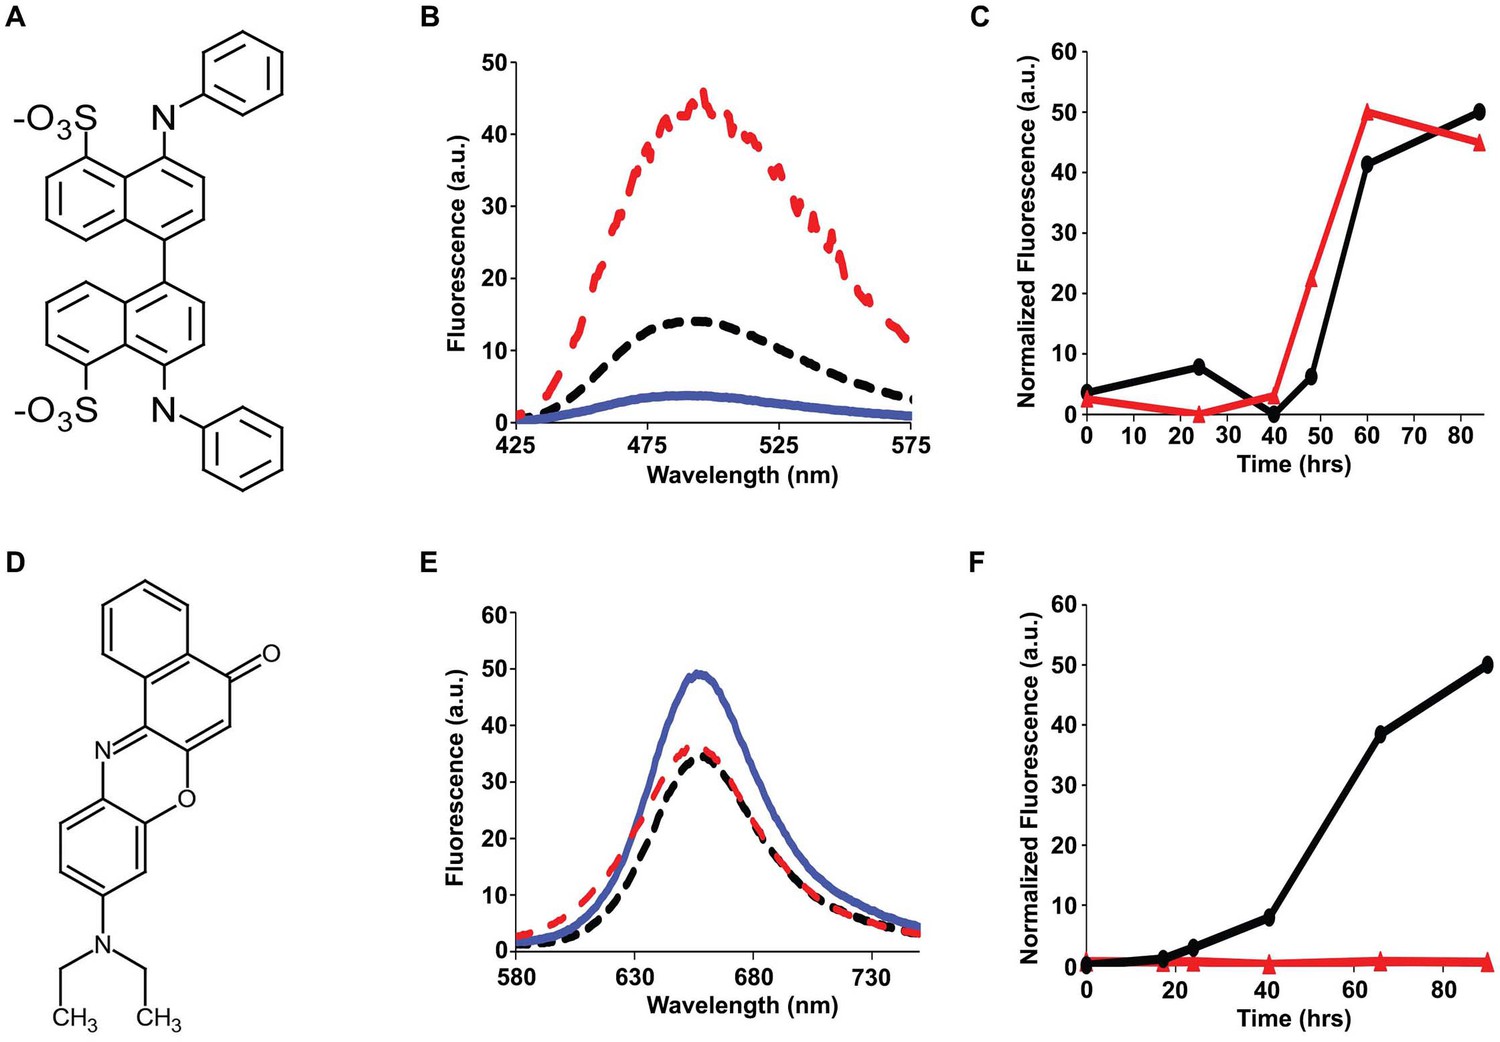
Bis-ANS and Nile Red do not bind to h-IAPP lag phase intermediates.
(A) Structure of bis-ANS. (B) Bis-ANS fluorescence emission spectra in the presence of h-IAPP at time-zero (black, ····), with h-IAPP lag phase intermediates (blue, —), and with h-IAPP amyloid fibrils (red, - - - -). (C) Kinetic assays monitored by thioflavin-T fluorescence (●) and bis-ANS fluorescence (▲) confirm that bis-ANS binds to amyloid fibrils and not lag phase intermediates. (D) Structure of Nile Red. (E) Nile Red fluorescence emission spectra in the presence of h-IAPP at time-zero (black, ····), with h-IAPP lag phase intermediates (blue,—), and with h-IAPP amyloid fibrils (red, - - - -). The fluorescence intensity of Nile Red in buffer is comparable to the fluorescence intensity of Nile Red in the presence of h-IAPP. (F) Kinetic assays monitored by thioflavin-T fluorescence (●) and Nile Red fluorescence (▲) confirm that Nile Red does not bind to h-IAPP at any time during amyloid fibril formation.
Figure 7—figure supplement 2
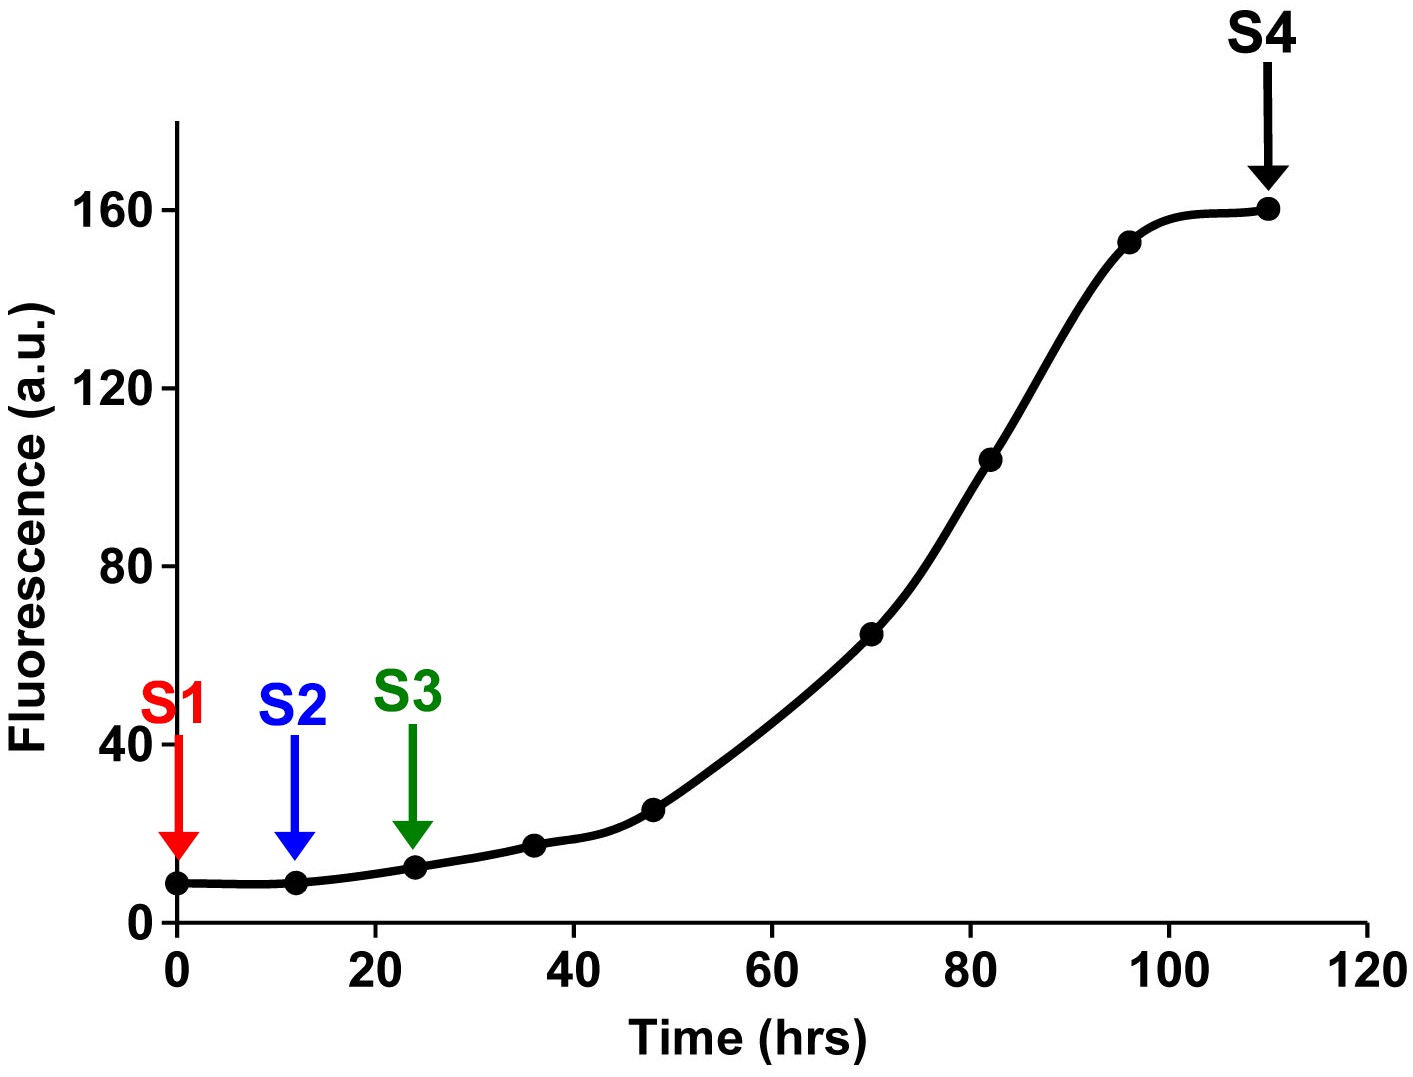
Fluorescence detected thioflavin-T binding assay (black) showing the kinetics of amyloid formation by a solution of h-IAPP used in the proteolytic digestion studies presented in Figure 7—figure supplements 3–14.
Arrows indicate time points at which aliquots were removed and subjected to Proteinase K treatment. The time points are denoted as: (red, S1) time-zero, (blue, S2) early lag phase intermediates, (green, S3) mid-lag phase intermediates and (black, S4) saturation phase containing amyloid fibrils.
Figure 7—figure supplement 3
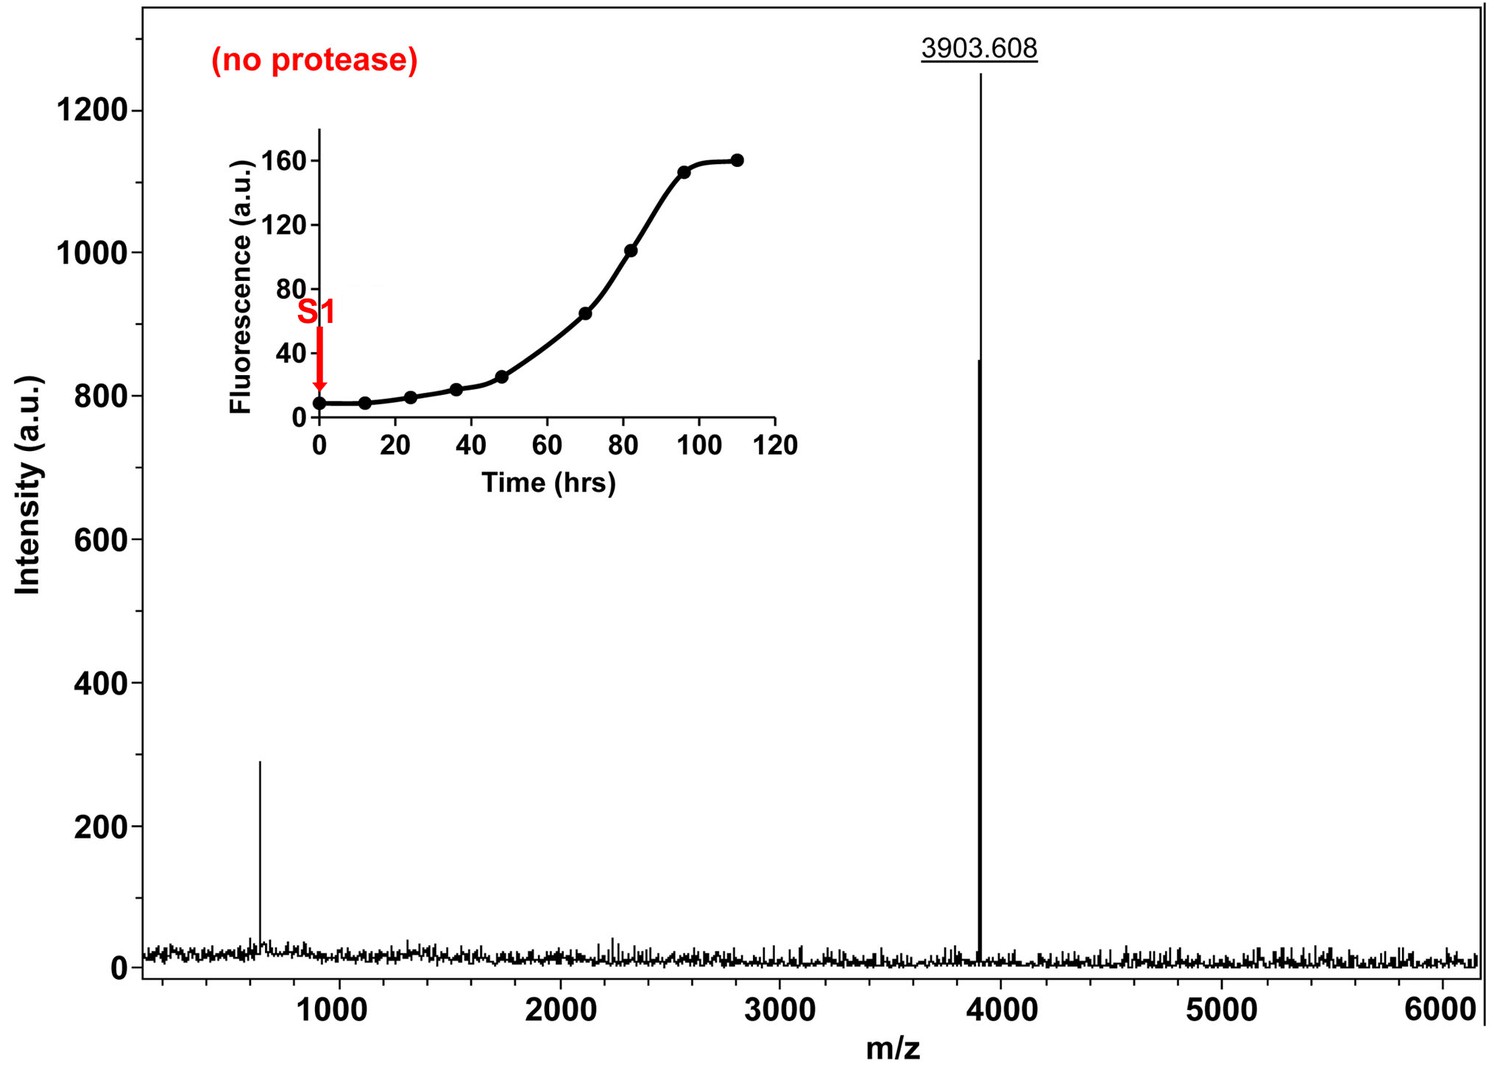
Characterization of h-IAPP time-zero species by MALDI-TOF MS.
MALDI-TOF mass spectra of h-IAPP aliquots taken at time-zero directly after initiation of aggregation, in the absence of Proteinase K. Data show the expected molecular weight for h-IAPP (3903 Daltons). The insert indicates the time point (red arrow, S1) at which the aliquots for mass spectroscopy were removed over the course of amyloid formation.
Figure 7—figure supplement 4
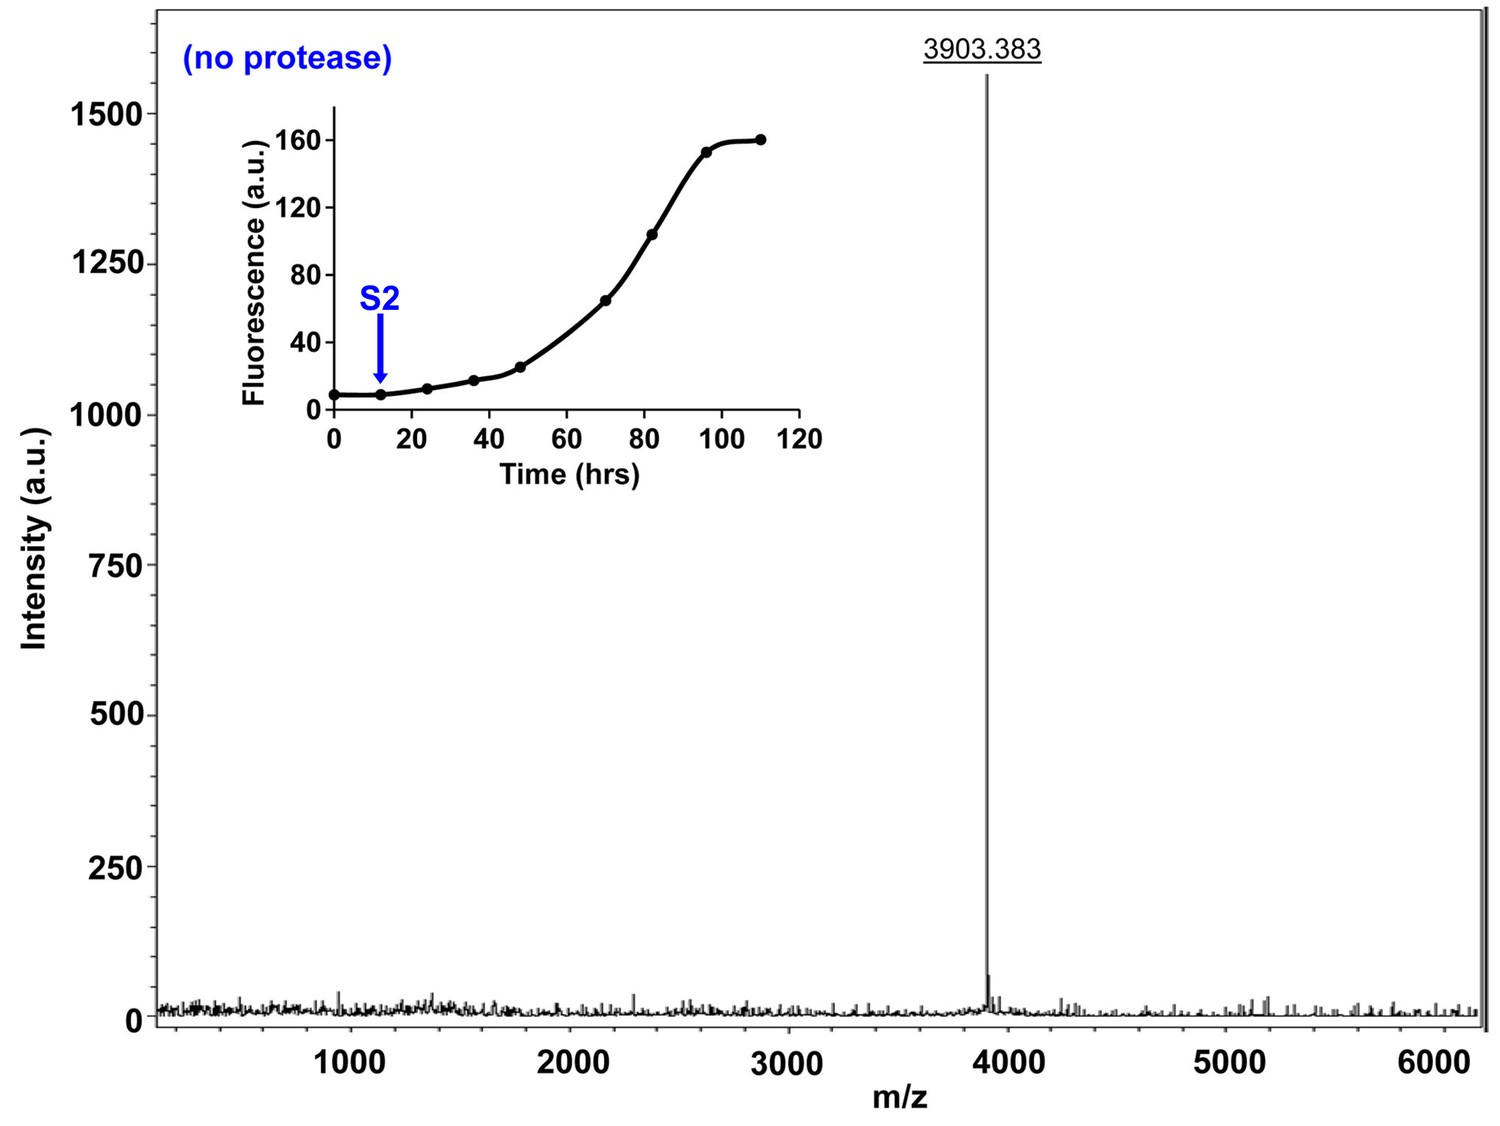
Characterization of h-IAPP early lag phase species by MALDI-TOF MS.
MALDI-TOF mass spectra of h-IAPP aliquots taken early in the lag phase of amyloid formation, in the absence of Proteinase K. Data show the expected molecular weight for h-IAPP (3903 Daltons). The insert indicates the time point (blue arrow, S2) at which the aliquots were removed for mass spectroscopy analysis.
Figure 7—figure supplement 5
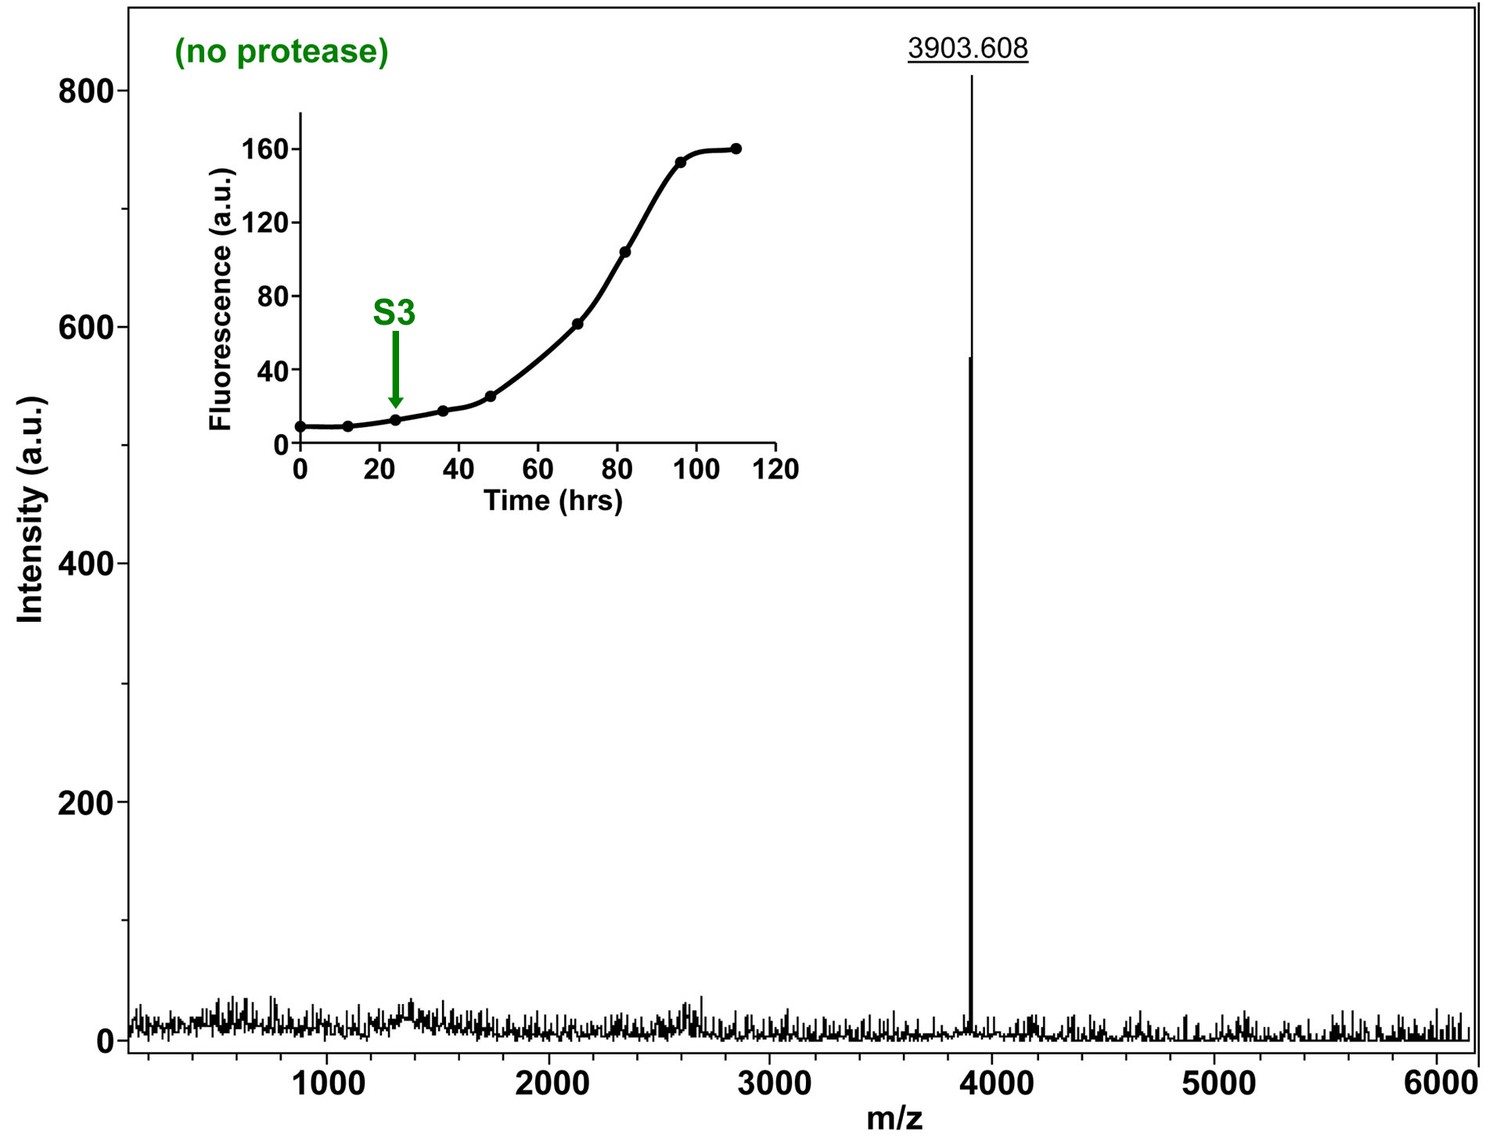
Characterization of h-IAPP mid-lag phase species by MALDI-TOF MS.
MALDI-TOF mass spectra of h-IAPP aliquots taken in the middle of the lag phase of amyloid formation, in the absence of Proteinase K. Data show the expected molecular weight for h-IAPP (3903 Daltons). The insert indicates the time point (green arrow, S3) at which the aliquots were removed for mass spectroscopy analysis.
Figure 7—figure supplement 6
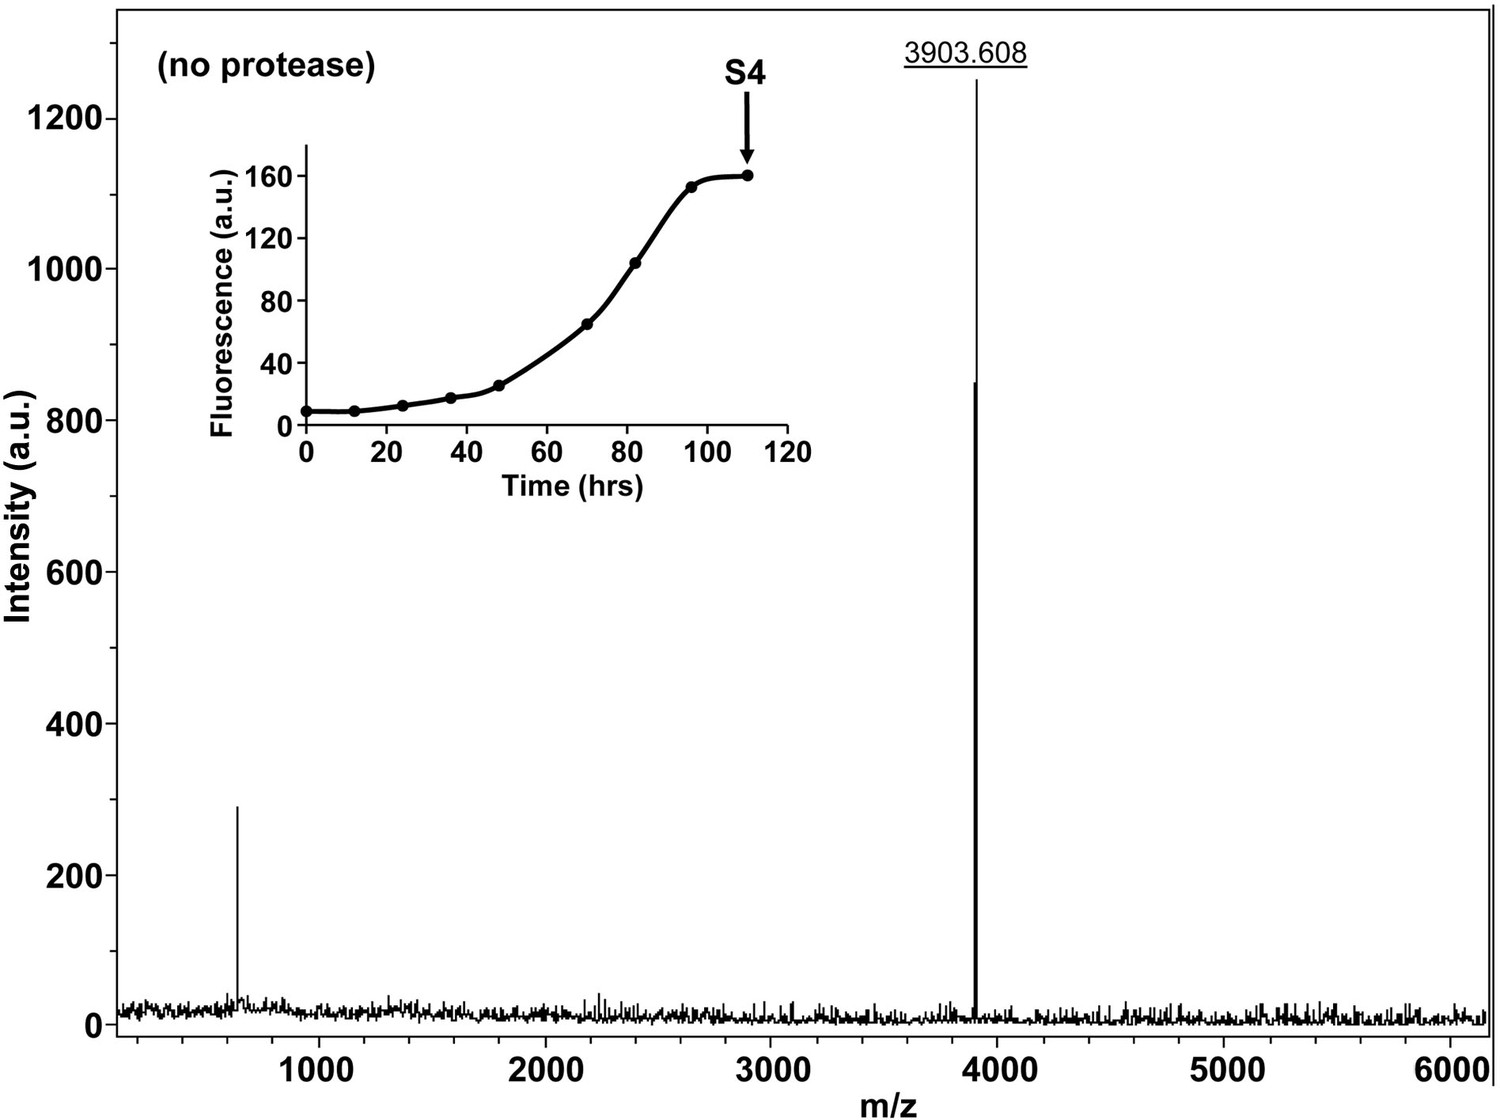
Characterization of h-IAPP amyloid fibrils by MALDI-TOF MS.
MALDI-TOF mass spectra of h-IAPP aliquots taken in the saturation phase of amyloid formation, in the absence of Proteinase K. Data show the expected molecular weight for h-IAPP (3903 Daltons). The insert indicates the time point (black arrow, S4) at which the aliquots were removed for mass spectroscopy analysis.
Figure 7—figure supplement 7
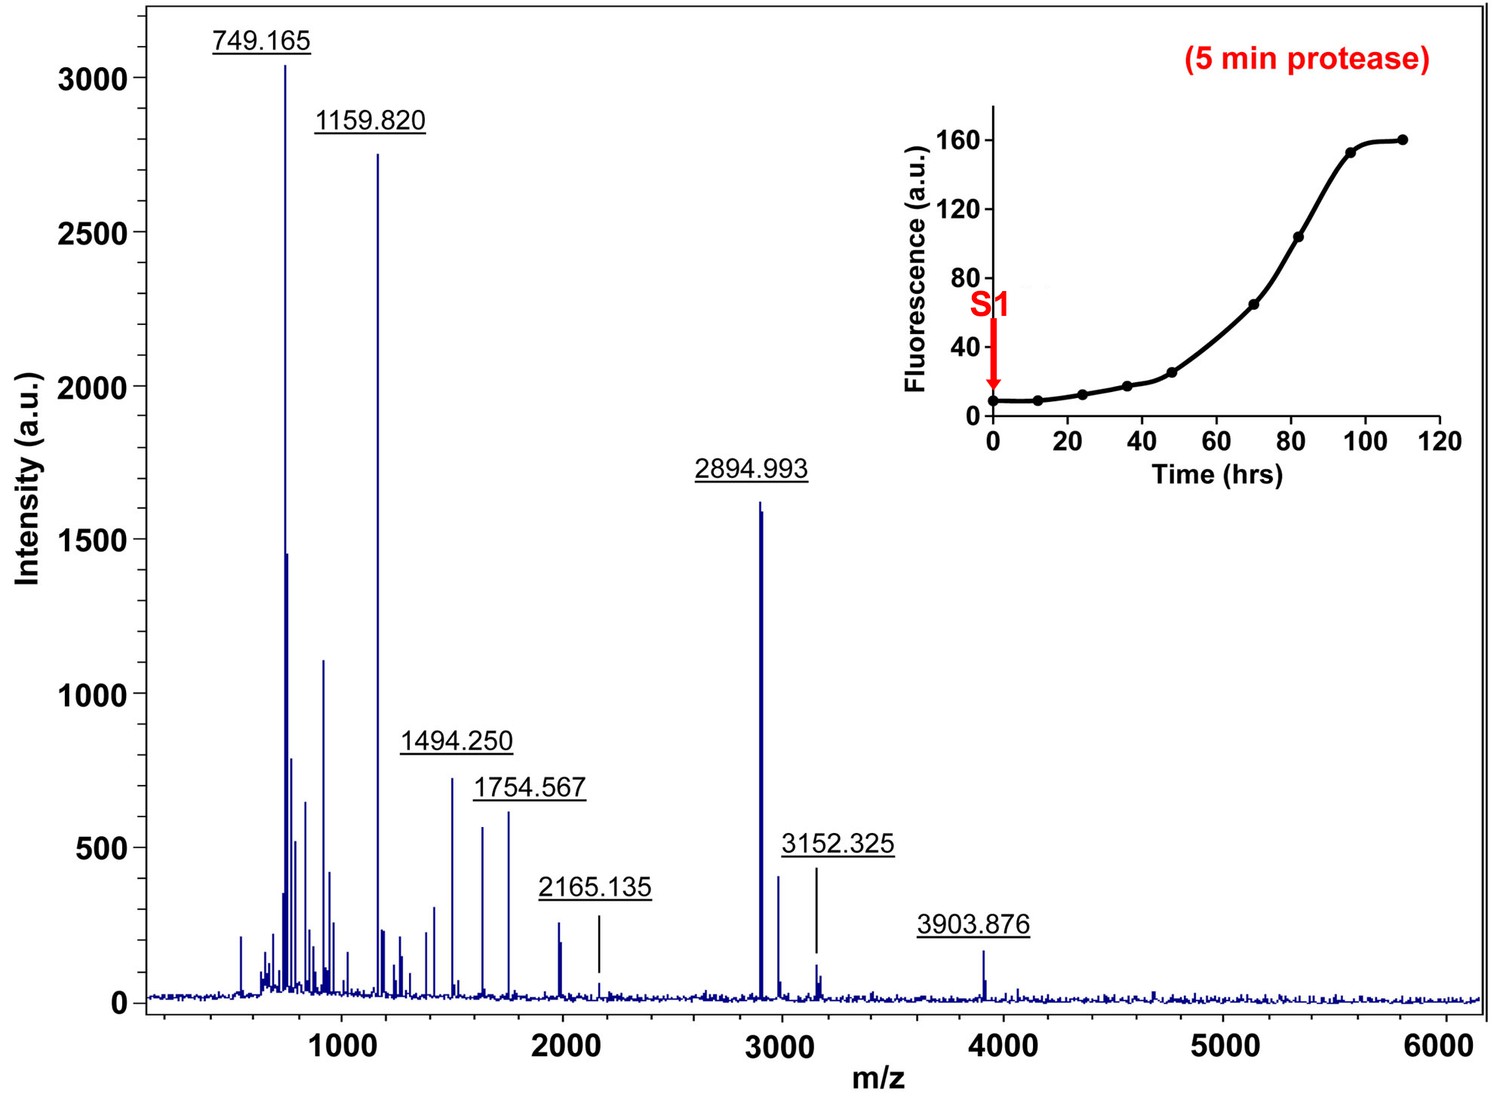
Characterization of h-IAPP time-zero species by five minute Proteinase K digestion as monitored by MALDI-TOF MS.
MALDI-TOF mass spectra of h-IAPP aliquots taken at time-zero directly after initiation of aggregation, after 5 min treatment with Proteinase K. Data show that freshly dissolved h-IAPP are rapidly proteolytically degraded. The insert indicates the time point (red arrow, S1) at which the aliquots were removed for Proteinase K treatment, prior to mass spectroscopy analysis.
Figure 7—figure supplement 8
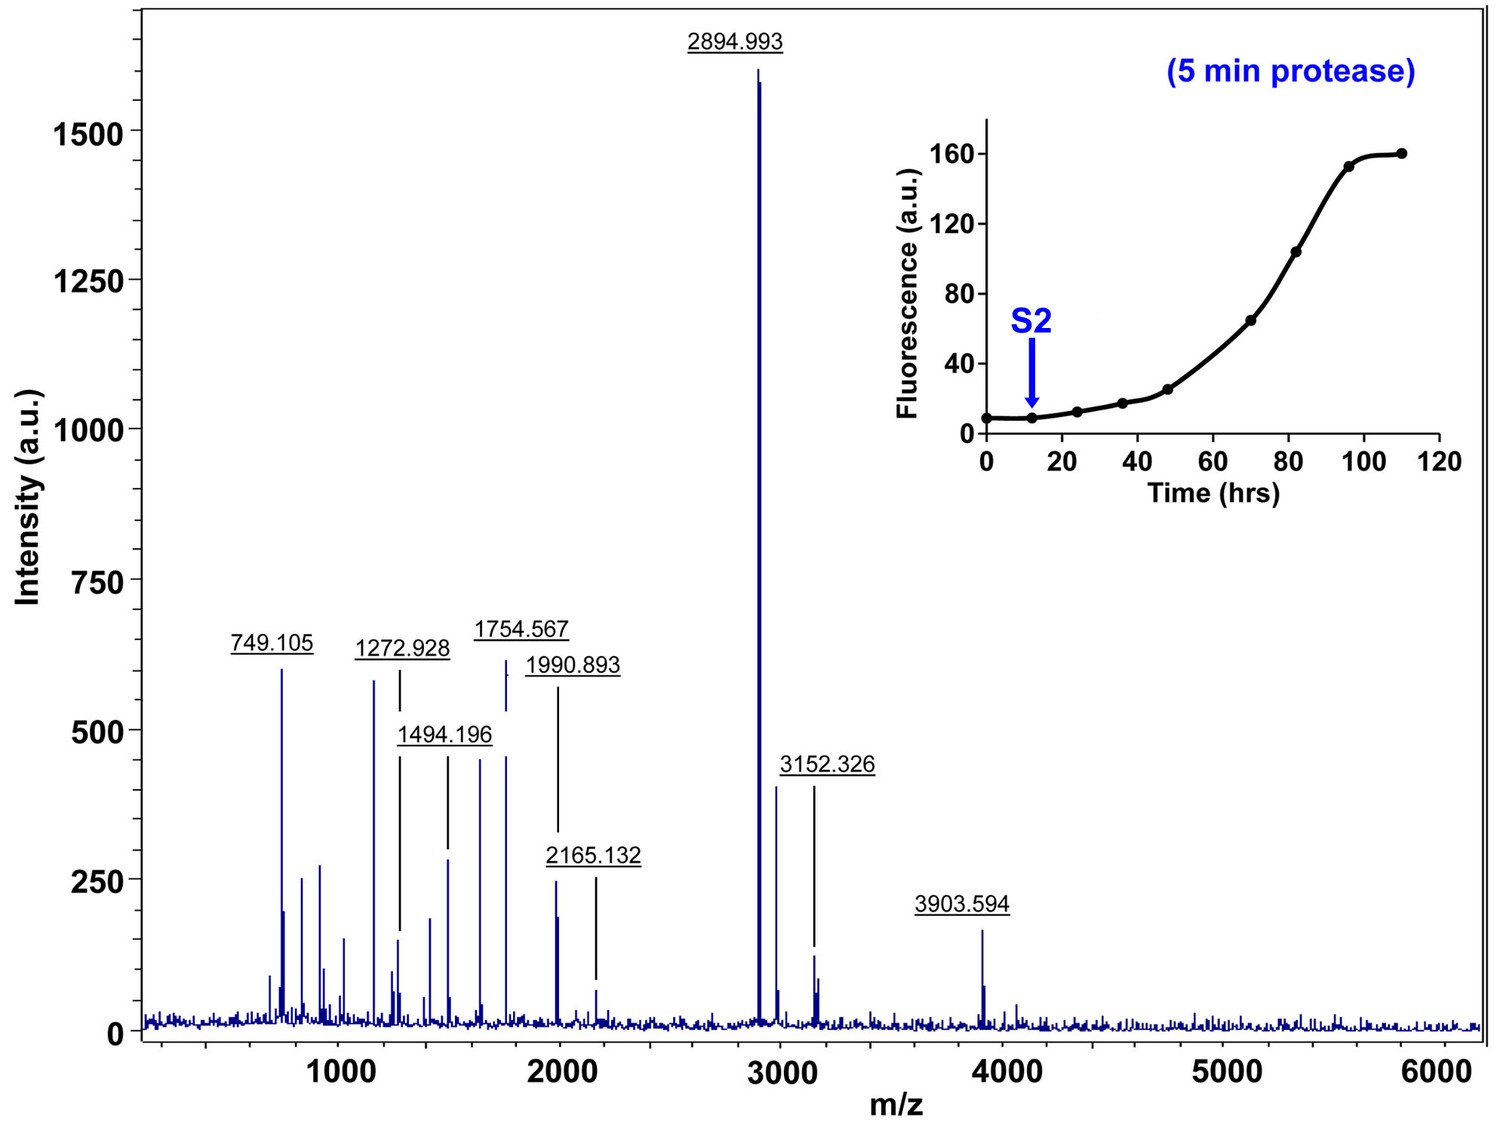
Characterization of h-IAPP early lag phase species by five minute Proteinase K digestion as monitored by MALDI-TOF MS.
MALDI-TOF mass spectra of h-IAPP aliquots taken early in the lag phase of amyloid formation, after 5 min treatment with Proteinase K. Data show that early h-IAPP lag phase intermediates are rapidly proteolytically degraded. The insert indicates the time point (blue arrow, S2) at which the aliquots were removed for Proteinase K treatment, prior to mass spectroscopy analysis.
Figure 7—figure supplement 9
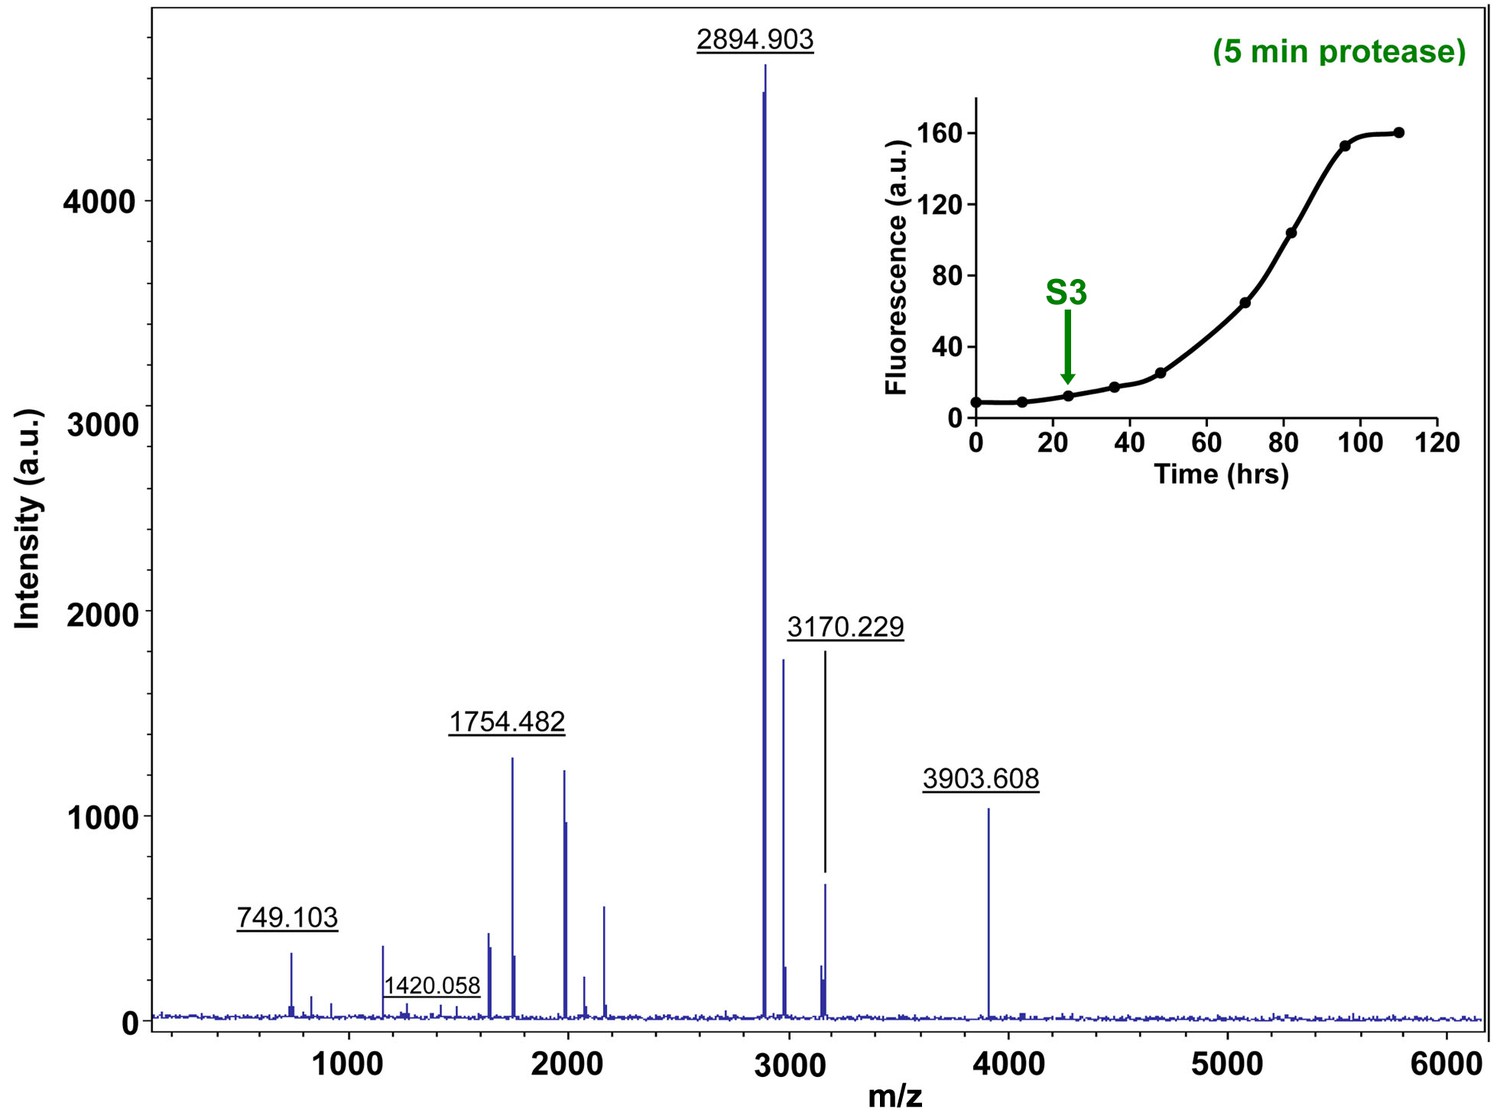
Characterization of h-IAPP mid-lag phase species by five minute Proteinase K digestion as monitored by MALDI-TOF MS.
MALDI-TOF mass spectra of h-IAPP aliquots taken in the middle of the lag phase of amyloid formation, after 5 min treatment with Proteinase K. Data show that h-IAPP lag phase intermediates are rapidly proteolytically degraded. The insert indicates the time point (green arrow, S3) at which the aliquots were removed for Proteinase K treatment, prior to mass spectroscopy analysis. MALDI-TOF mass spectra of h-IAPP aliquots are shown in the following panels: (Figure 7—figure supplement 3–6) in the absence of proteinase K, Figure 7—figure supplement 7–10) after 5 min treatment with proteinase K and (Figure 7—figure supplement 11–14) after 40 min treatment with proteinase K. Data show that freshly dissolved h-IAPP at time-zero (red arrow) and h-IAPP lag phase intermediates (blue and green arrows) are rapidly proteolytically degraded, but h-IAPP amyloid fibrils are not (black arrow). The inserts in figure supplements 3-14 indicate the time point at which the aliquots were removed.
Figure 7—figure supplement 10
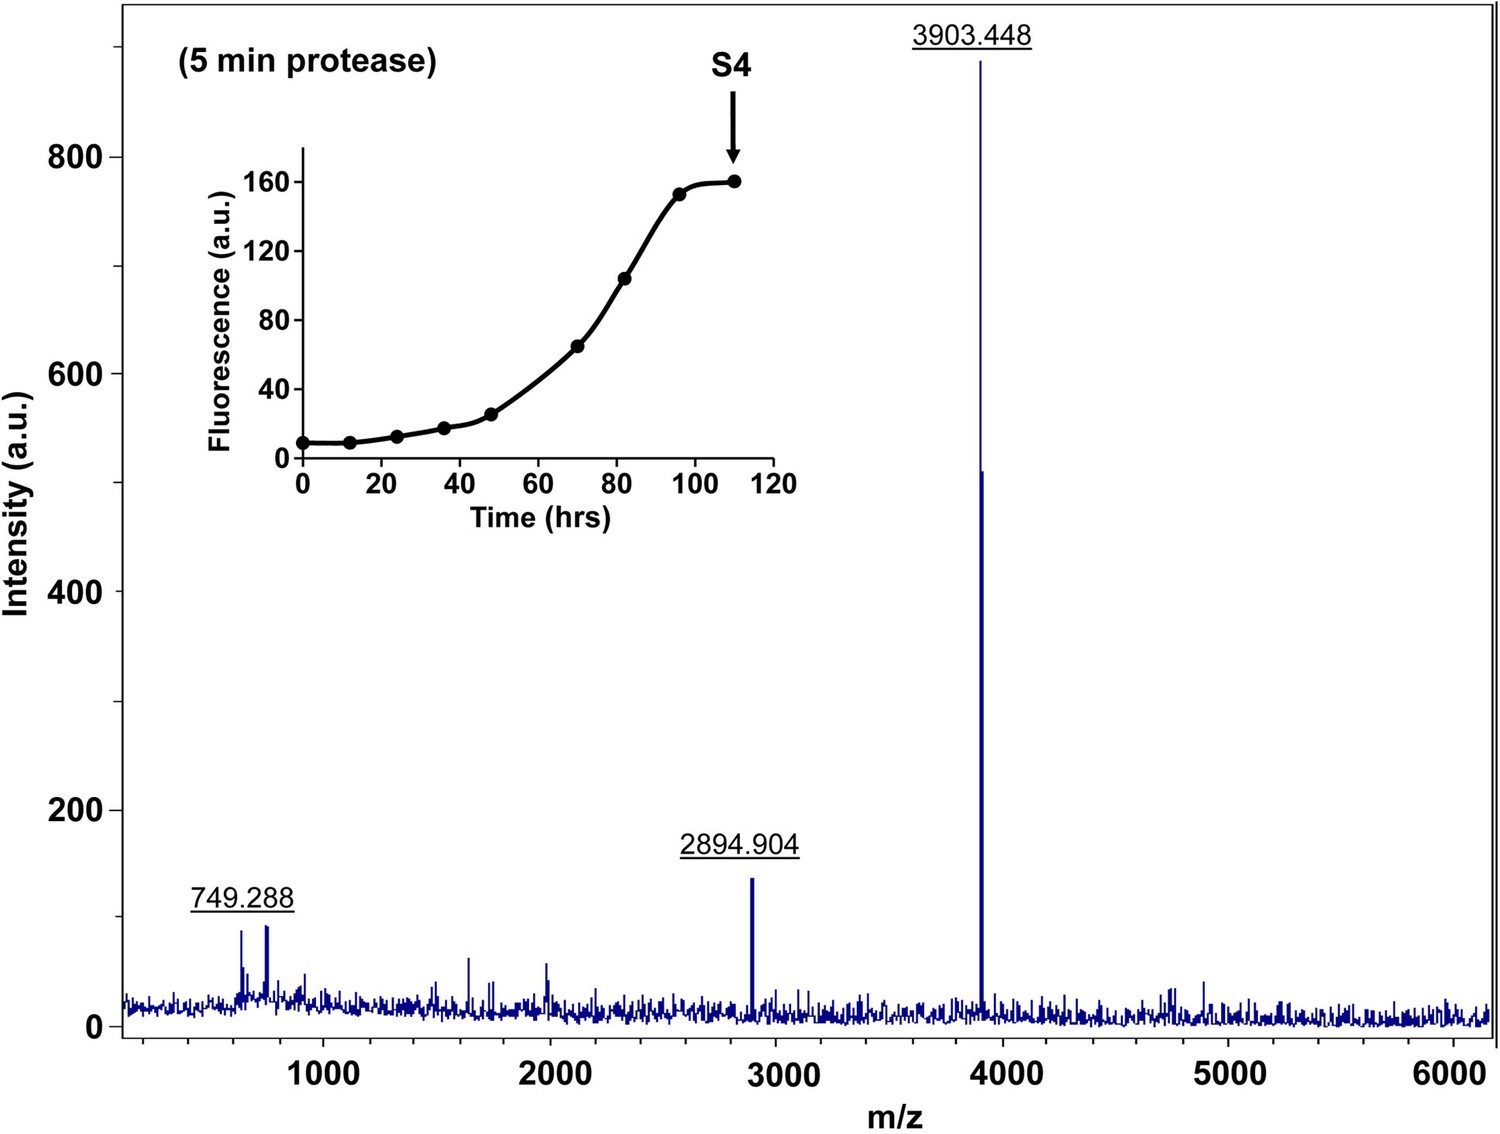
Characterization of h-IAPP amyloid fibrils by five minute Proteinase K digestion as monitored by MALDI-TOF MS.
MALDI-TOF mass spectra of h-IAPP aliquots taken in the saturation phase of amyloid formation, after 5 min treatment with Proteinase K. Data show the expected molecular weight of h-IAPP (3903 Daltons) indicating that the amyloid fibrils are not proteolytically degraded. The insert indicates the time point (black arrow, S4) at which the aliquots were removed for Proteinase K treatment, prior to mass spectroscopy analysis.
Figure 7—figure supplement 11
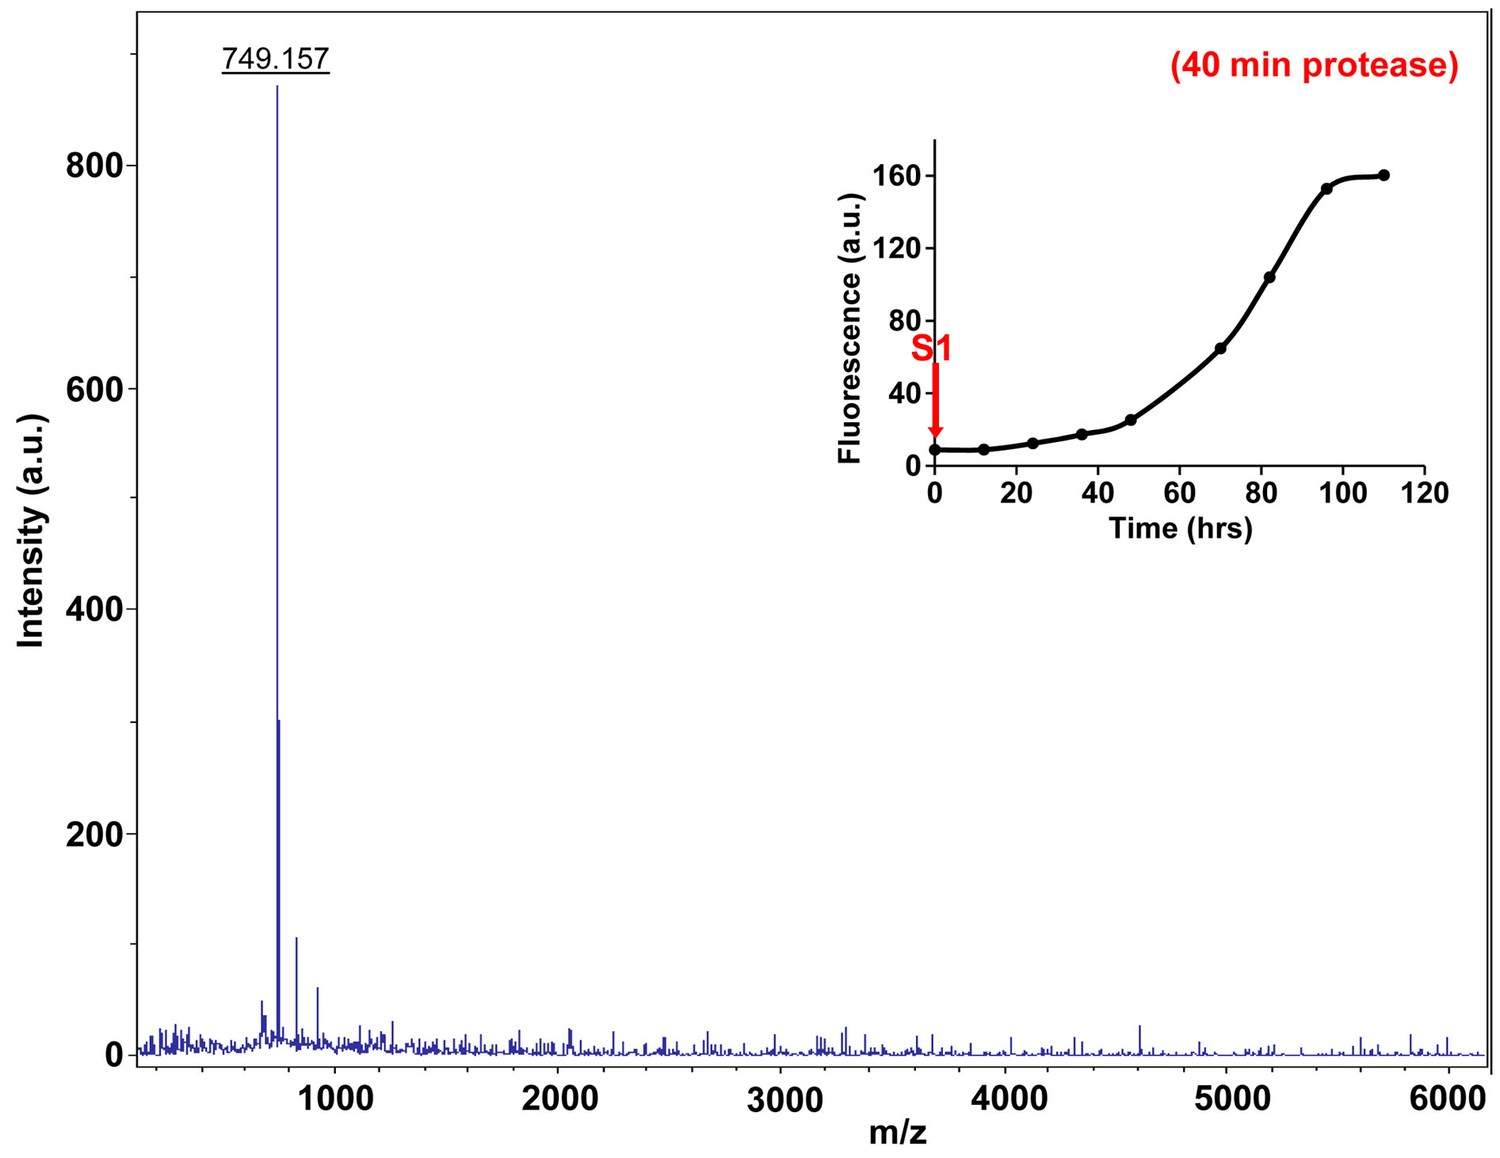
Characterization of h-IAPP time-zero species by forty minute Proteinase K digestion as monitored by MALDI-TOF MS.
MALDI-TOF mass spectra of h-IAPP aliquots taken at time-zero directly after initiation of aggregation, after 40 min treatment with Proteinase K. Data show that freshly dissolved h-IAPP are proteolytically degraded. The insert indicates the time point (red arrow, S1) at which the aliquots were removed for Proteinase K treatment, prior to mass spectroscopy analysis.
Figure 7—figure supplement 12
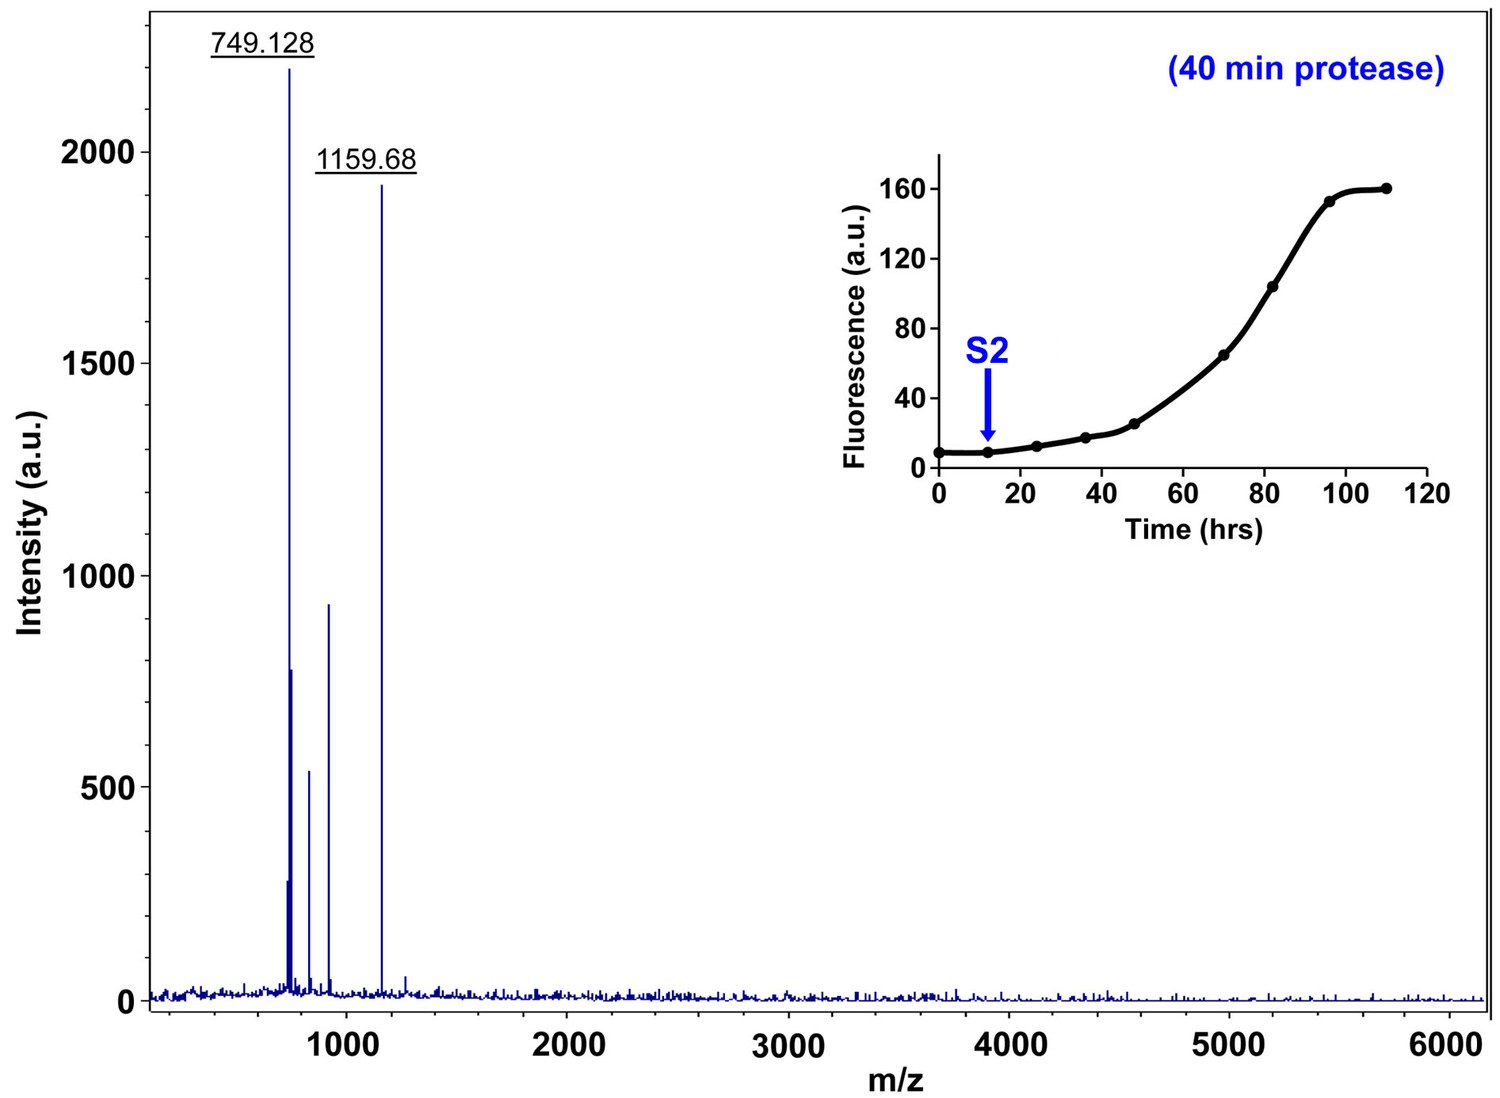
Characterization of h-IAPP early lag phase species by forty minute Proteinase K digestion as monitored by MALDI-TOF MS.
MALDI-TOF mass spectra of h-IAPP aliquots taken early in the lag phase of amyloid formation, after 40 min treatment with Proteinase K. Data show that early h-IAPP lag phase intermediates are proteolytically degraded. The insert indicates the time point (blue arrow, S2) at which the aliquots were removed for Proteinase K treatment, prior to mass spectroscopy analysis.
Figure 7—figure supplement 13
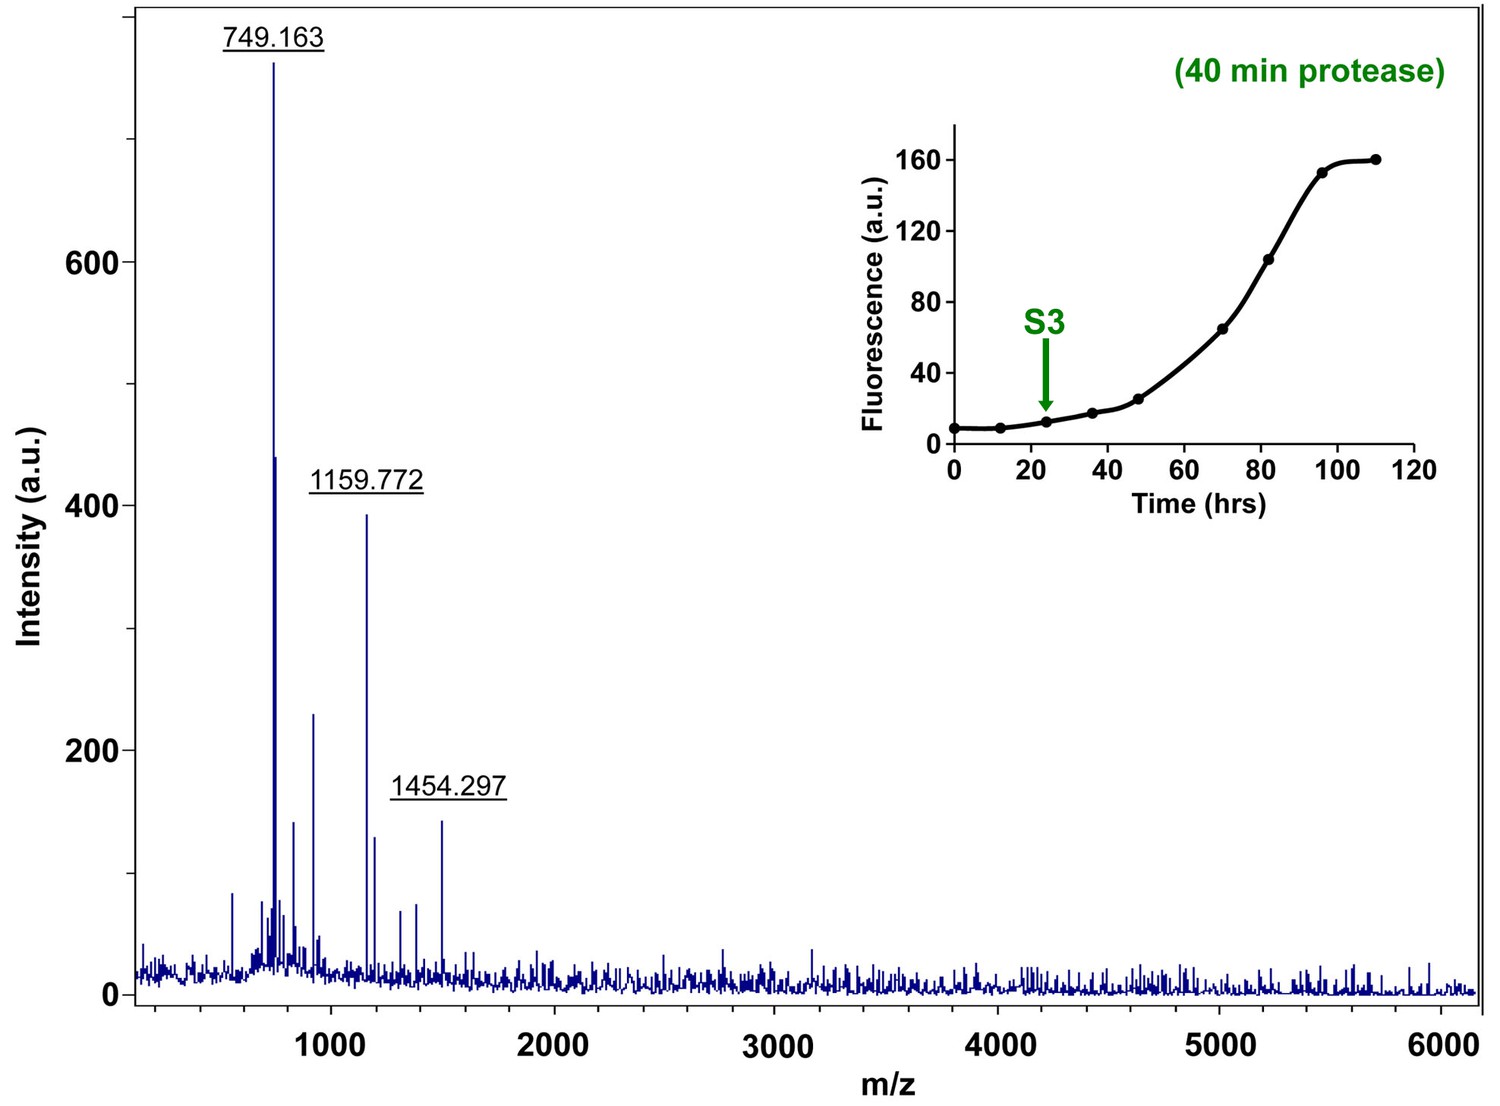
Characterization of h-IAPP mid-lag phase species by forty minute Proteinase K digestion as monitored by MALDI-TOF MS.
MALDI-TOF mass spectra of h-IAPP aliquots taken in the middle of the lag phase of amyloid formation, after 40 min treatment with Proteinase K. Data show that h-IAPP lag phase intermediates are proteolytically degraded. The insert indicates the time point (green arrow, S3) at which the aliquots were removed for Proteinase K treatment, prior to mass spectroscopy analysis.
Figure 7—figure supplement 14
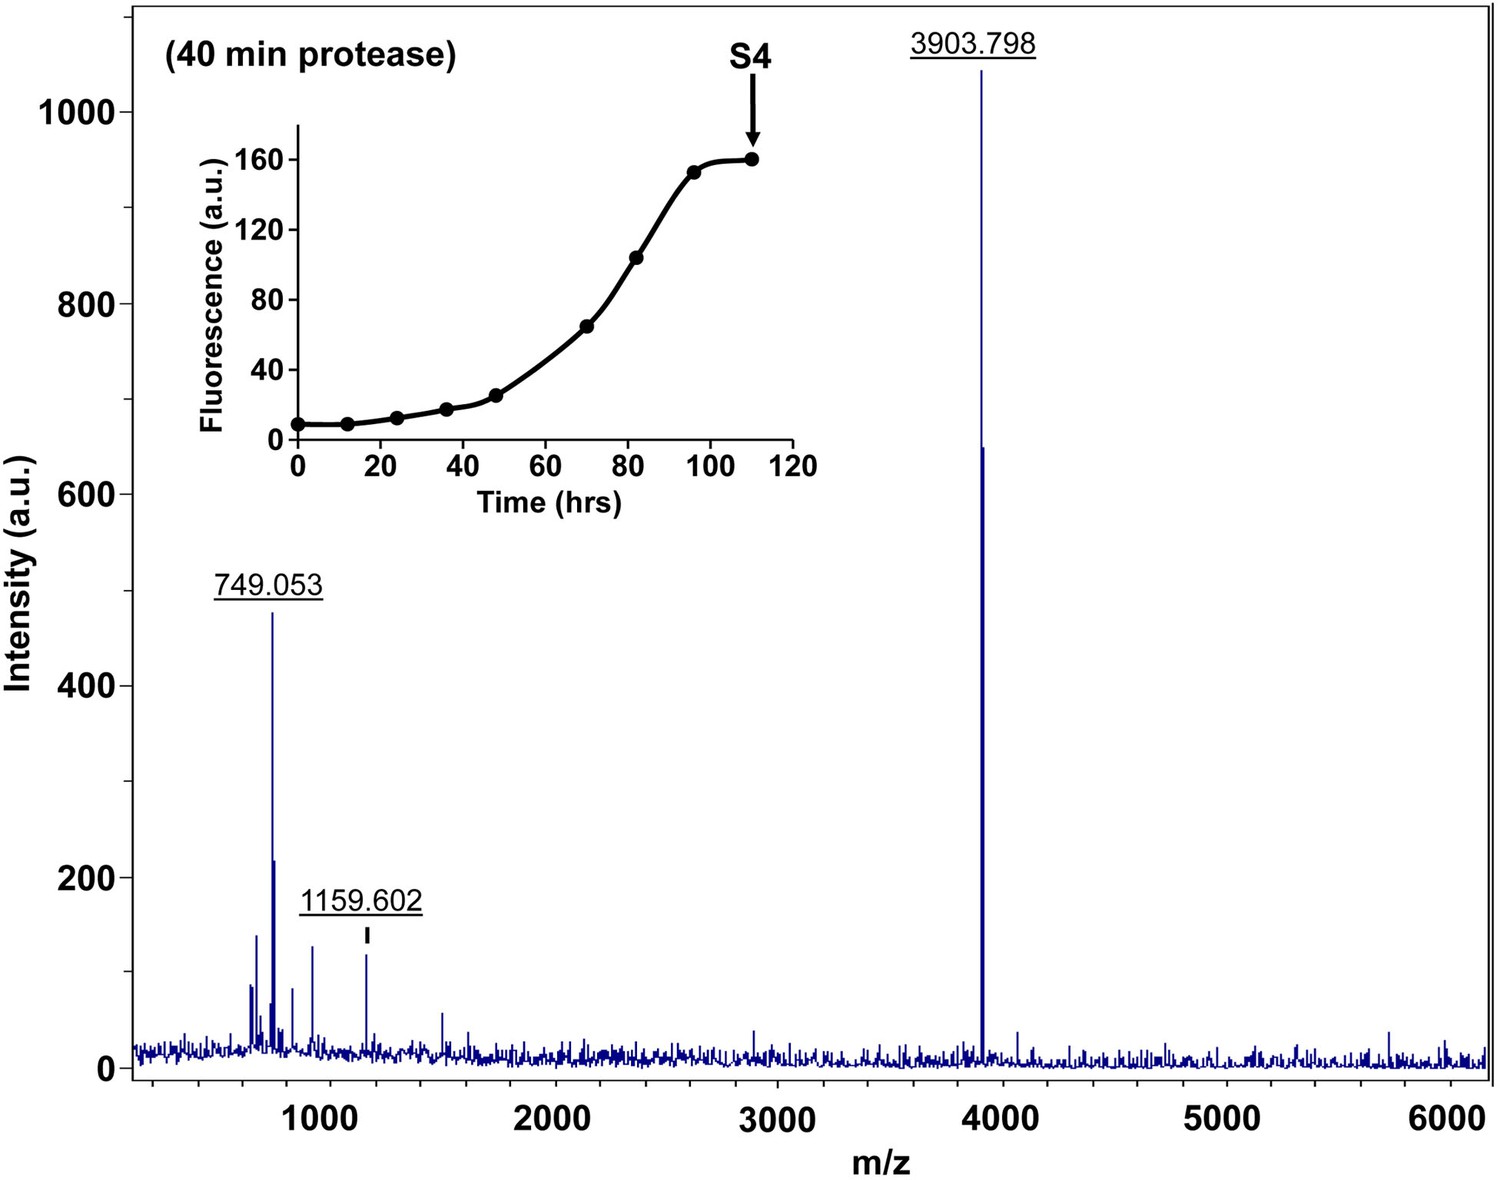
Characterization of h-IAPP amyloid fibrils by forty minute Proteinase K digestion as monitored by MALDI-TOF MS.
MALDI-TOF mass spectra of h-IAPP aliquots taken in the saturation phase of amyloid formation, after 40 min treatment with Proteinase K. Data show the expected molecular weight for h-IAPP (3903 Daltons), indicating that the amyloid fibrils are not proteolytically degraded, even after longer incubation with the enzyme. The insert indicates the time point (black arrow, S4) at which the aliquots were removed for Proteinase K treatment, prior to mass spectroscopy analysis.
Figure 8
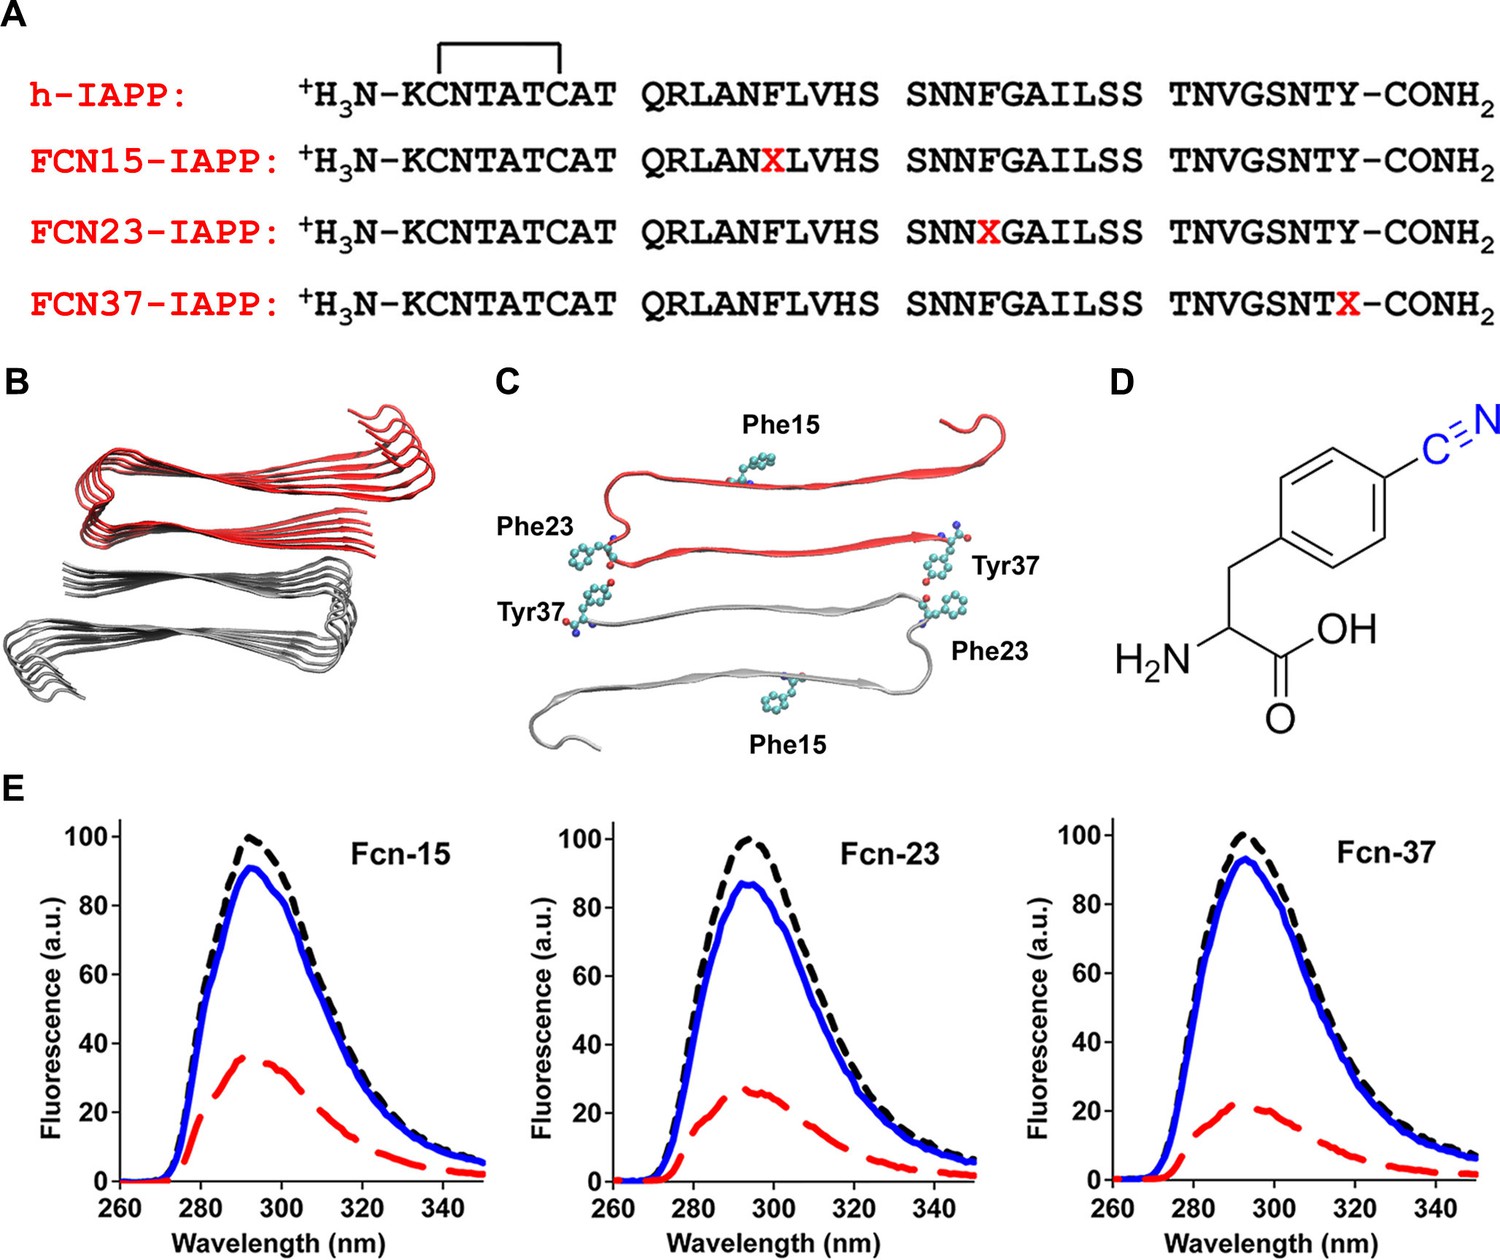
Aromatic residues in the ensemble of toxic h-IAPP oligomers are solvent exposed.
(A) Primary sequences of h-IAPP and p-cyano-phenylalanine variants; red X=cyanophenylalanine. (B) A structural model of the h-IAPP amyloid fibril. (C) Location of aromatic residues in h-IAPP which are replaced with p-cyano-phenylalanine in the h-IAPP variants. (D) Structure of the unnatural amino acid p-cyano-phenylalanine. (E) p-Cyano-phenylalanine fluorescence emission spectra reveal that aromatic side chains are solvent exposed in time-zero species (black, ····) and lag phase intermediates (blue, —), but are buried in amyloid fibrils (red, - - - -).
Figure 9
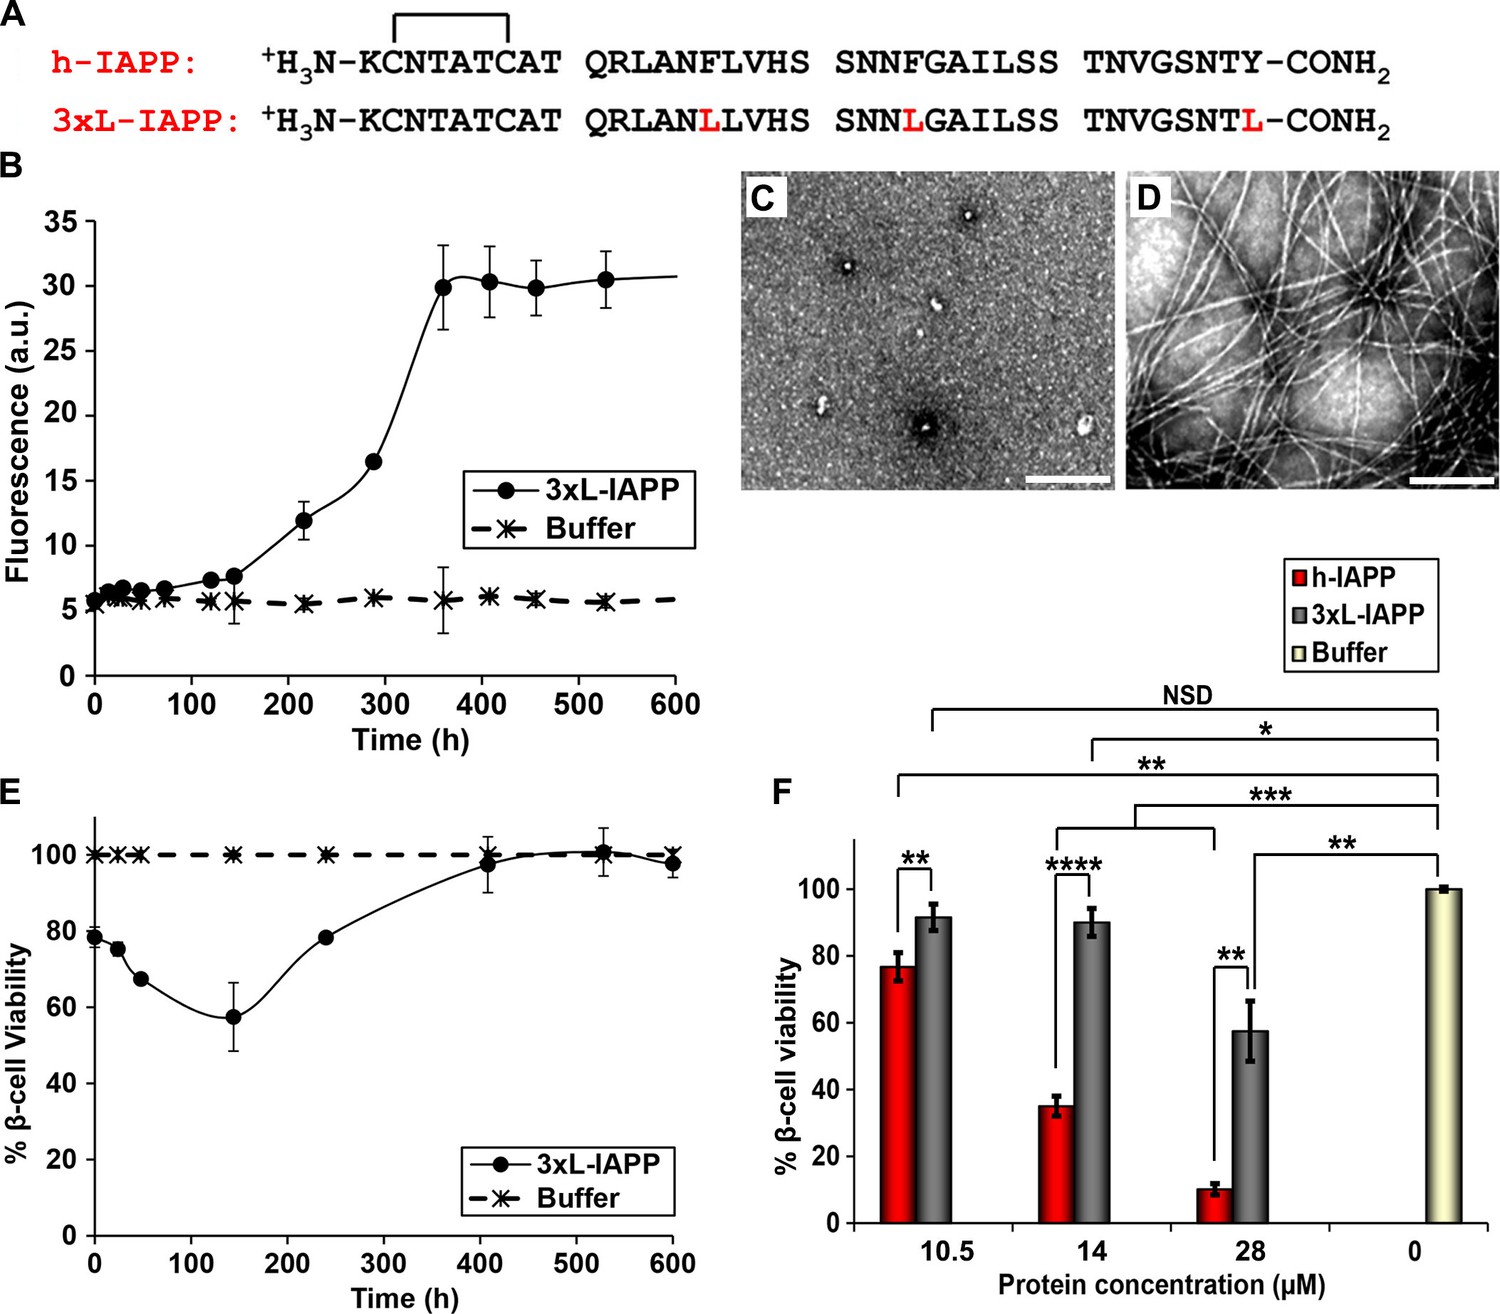
Aromatic-aromatic and aromatic-hydrophobic interactions are not required for toxicity.
(A) Primary sequences of h-IAPP and 3xL-IAPP. Amino acid positions differing from h-IAPP are indicated in red. (B) Thioflavin-T monitored kinetics of amyloid formation by 3xL-IAPP (●) and buffer control (*). (C) TEM image of spherical, toxic, mid-lag phase intermediates produced during amyloid formation by 3xL-IAPP. (D) TEM image of non-toxic amyloid fibrils produced by 3xL-IAPP. (E) Time-resolved Alamar Blue reduction assays of β-cells treated with 3xL-IAPP (●) or buffer (*) at different time points during the course of amyloid formation. (F) Alamar Blue reduction assays measuring β-cell viability in response to increasing doses of h-IAPP or 3xL-IAPP with respect to buffer treated cells: h-IAPP (red), 3xL-IAPP (dark grey) and buffer (gold). Concurrent Alamar Blue reduction assays, thioflavin-T binding assays and TEM studies were carried out using aliquots from the same 40 μM peptide solutions. The peptide concentration in samples assessed in panels B–D was 40 μM. The final peptide concentration in samples assessed in panel E after dilution of the 40 μM peptide solutions into β-cell assays was 28 μM. The final peptide concentrations in dose-response experiments in panel F, after dilution of peptide solutions into β-cell assays was 10.5, 14 and 28 μM. Data represent mean ± SD of three to six replicate wells per condition and three replicate experiments per group. Some of the error bars in panels B and E are the same size or smaller than the symbols in the graphs (Scale bars: 200 nm; *p<0.05, **p<0.01, ***p<0.001, ****p<0.0001).
Figure 10
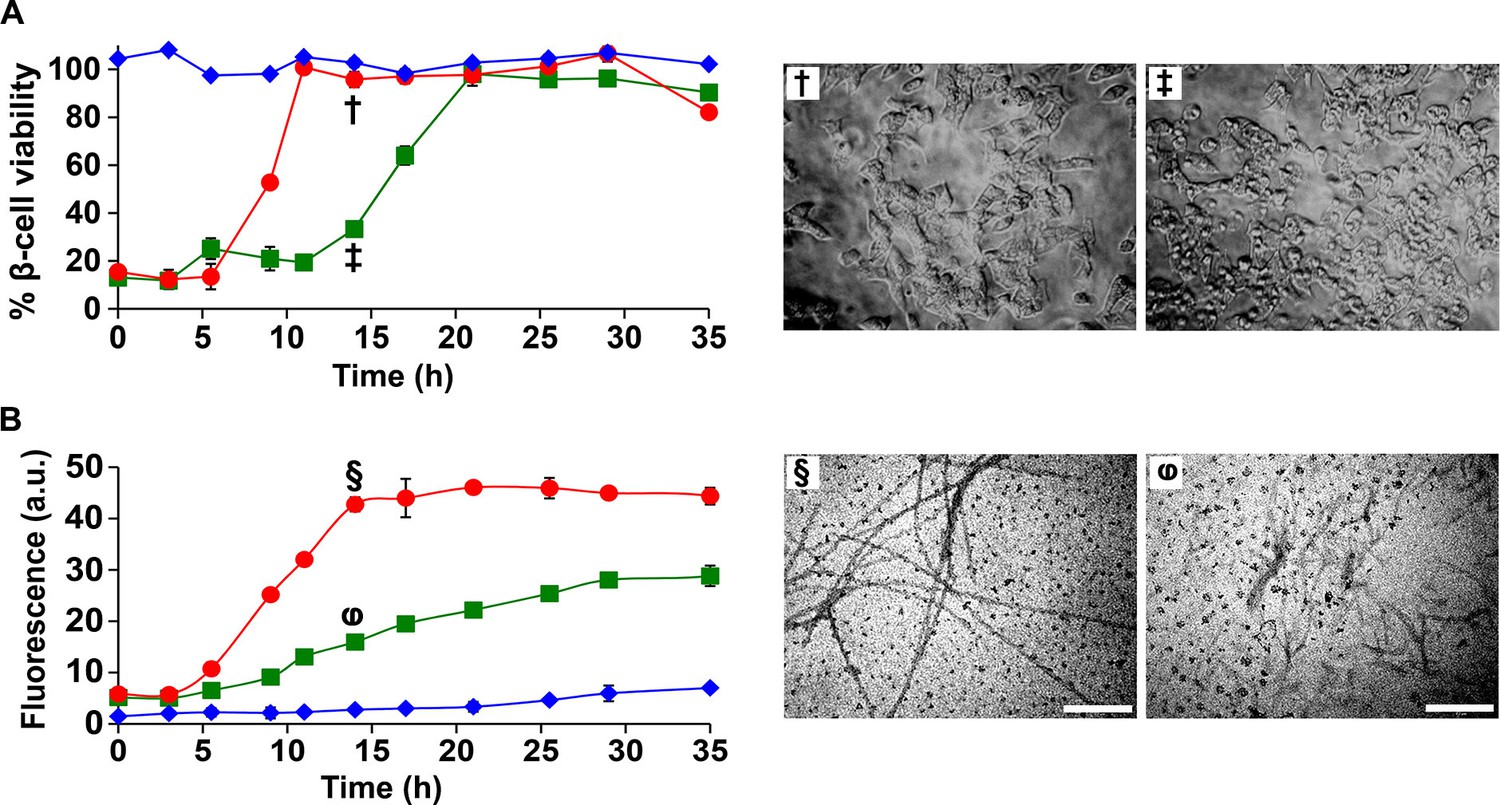
I26P-IAPP inhibits h-IAPP amyloid formation, but prolongs cytotoxicity.
(A) Time-resolved Alamar Blue reduction assays of β-cells treated with: I26P-IAPP (♦), h-IAPP (●) and 1:1 I26P-IAPP/h-IAPP (■). Light microscopy: (†) Viable β-cells treated with h-IAPP amyloid fibrils formed after 14 h- of incubation; (‡) shrunken apoptotic β-cells after treatment with lag phase intermediates of 1:1 I26P-IAPP/h-IAPP produced after 14 h of incubation. (B) Thioflavin-T monitored kinetics of amyloid formation by I26P-IAPP (♦), h-IAPP (●) and 1:1 I26P-IAPP/h-IAPP (■). The same color coding is used in panels A and B. TEM images of aliquots of: (§) h-IAPP and (φ) 1:1 I26P-IAPP/h-IAPP obtained from the same samples monitored in panel B and applied to β-cells in panel A (Scale bars: 200 nm). Concurrent Alamar Blue reduction assays, thioflavin-T binding assays, light microscopy and TEM studies used aliquots from the same peptide solutions containing 40 µM (single peptide samples) or 80 µM peptide (1:1 mixture). The final peptide concentrations after dilution into β-cell assays were 28 µM and 56 µM, respectively. Data represent mean ± SD of three to six replicate wells per condition and three replicate experiments per group. Some of the error bars in panels A and B are the same size or smaller than the symbols in the graphs.
Download links
A two-part list of links to download the article, or parts of the article, in various formats.
Downloads (link to download the article as PDF)
Open citations (links to open the citations from this article in various online reference manager services)
Cite this article (links to download the citations from this article in formats compatible with various reference manager tools)
Time-resolved studies define the nature of toxic IAPP intermediates, providing insight for anti-amyloidosis therapeutics
eLife 5:e12977.
https://doi.org/10.7554/eLife.12977


