A bacteriophage endolysin that eliminates intracellular streptococci
- University of Maryland, College Park, United States
- Carnegie Mellon University, United States
- National Institute of Standards and Technology, United States
- The Rockefeller University, United States
- USDA, United States
Figures
Figure 1 with 1 supplement
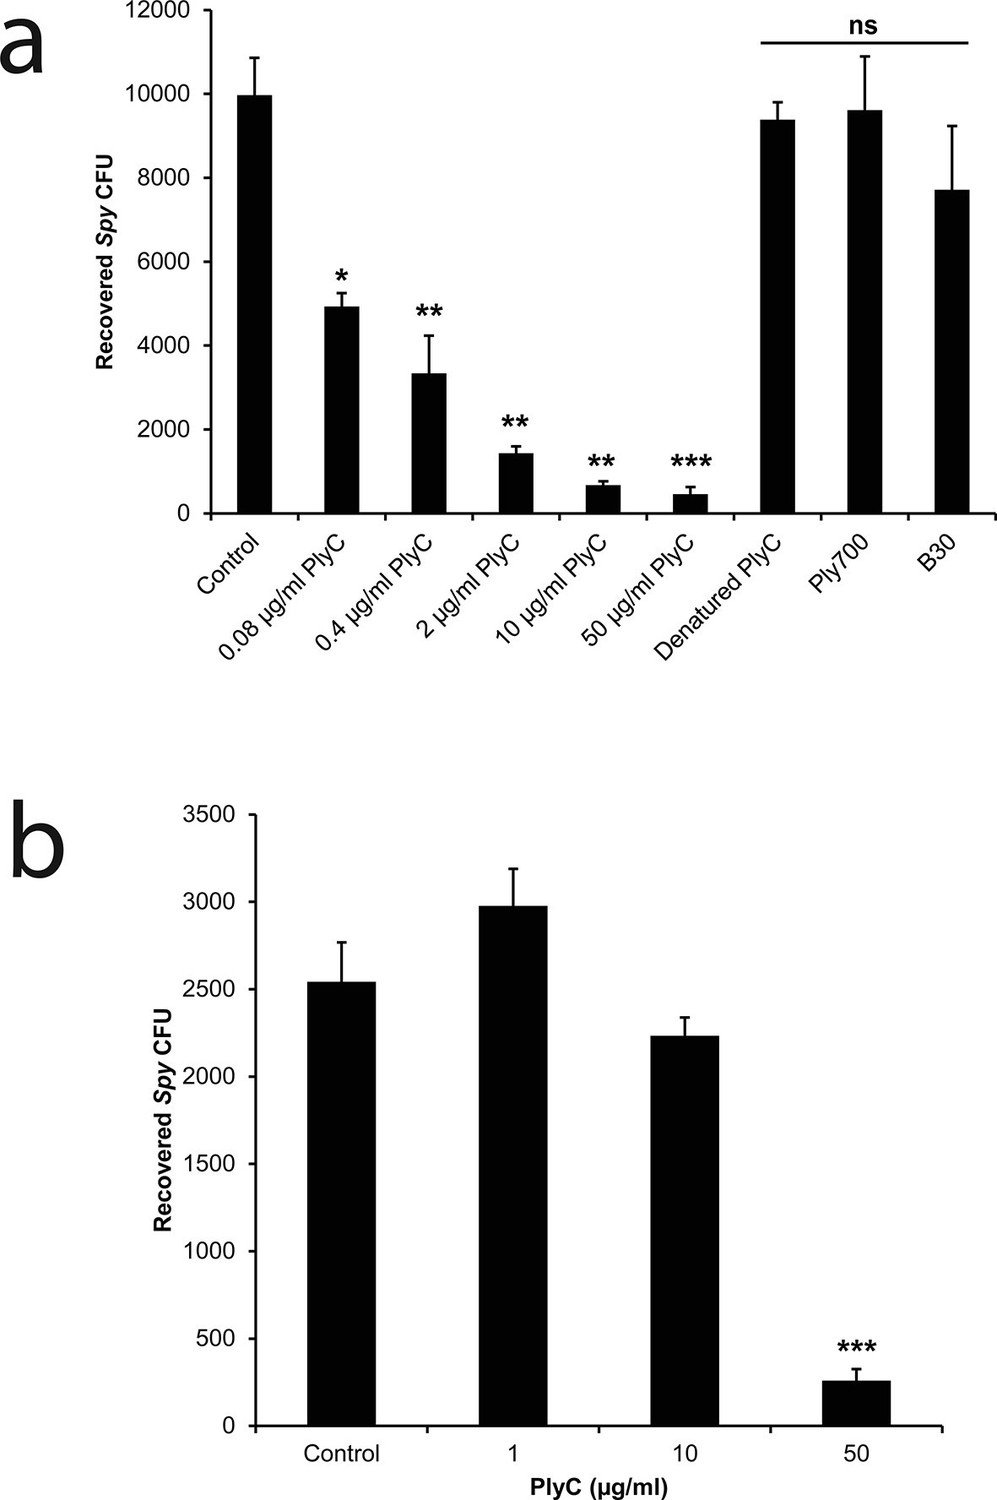
PlyC eliminates intracellular Spy in a dose-dependent manner.
(a) Spy/A549 co-cultures, treated with 10 µg/ml penicillin and 200 µg/ml gentamicin for 1 hr to remove extracellular bacteria, were incubated for another hour with antibiotic-free growth medium in dilutions of PlyC beginning at 50 μg/ml (440 nM), or with 50 μg/ml heat-denaturated PlyC (70°C for 30 min.), 50 μg/ml (1890 nM) Ply700, or 50 μg/ml (890 nM) B30. Viable intracellular Spy were enumerated as colonies on agar plates that had been incubated with serial dilutions of cell lysates. (b) A primary tonsillar epithelial cell co-culture was treated with 10 μg/ml penicillin and 200 μg/ml gentamicin for 1 hr after which the antibiotic was removed and the tonsil cells were incubated with 50, 10, or 1 μg/ml PlyC for 1h before lysis and enumeration of Spy. All experiments were performed in triplicate biological replicates, with mean and standard deviations displayed. Statistical analysis using Student's t-test is reported as *p<0.05; **p<0.005; ***p<0.001; ns: not significant.
Figure 1—figure supplement 1
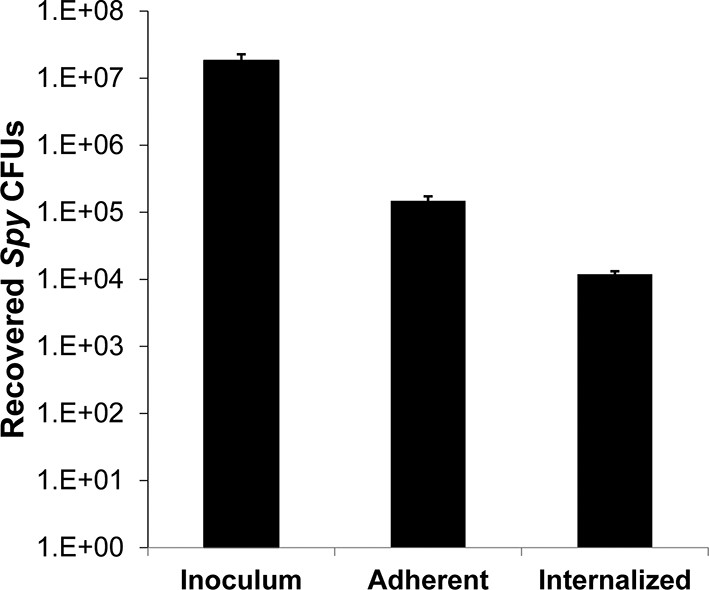
Adherent and internalized colony counts of Spy recovered from co-culture assay.
Determination of the adherent and internalized (intracellular) Spy CFUs in co-culture with A549 epithelial cells. A ~107 CFU innoculum dose was added to cultured A549 cells, incubated for 2 hours, and washed to remove non-adherent Spy. The remaining culture was treated with media or media supplemented with 10 μg/ml penicillin and 200 μg/ml gentamicin for 1 hr, followed by an additional wash step to remove antibiotics, lysis of A549 cells, and serial dilution plating to enumerate Spy CFUs. Media only-treated A549 cells represented adherent plus internalized Spy, whereas antibiotic-treated A549 cells represented internalized Spy. All experiments were performed in triplicate biological replates, with mean and standard deviations displayed.
Figure 2 with 1 supplement
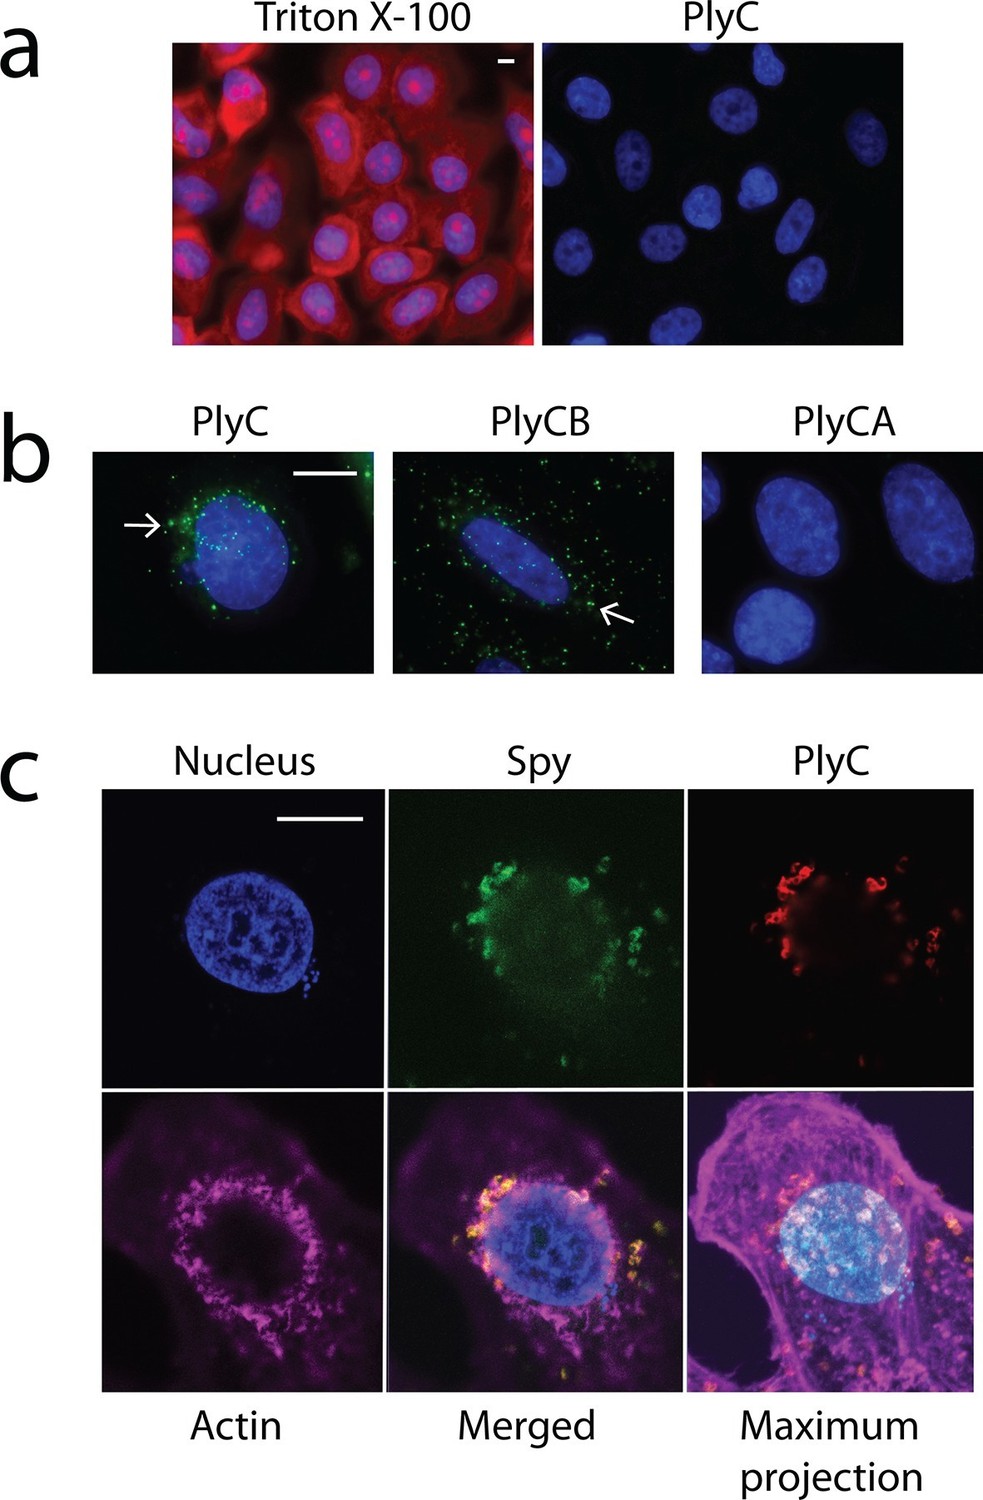
Membrane integrity is not compromised by PlyC, and internalization is mediated by the PlyCB subunit.
(a) A549 epithelial cells were permeabilized with 0.02% Triton X-100 (left panel), as shown by staining with propidium iodide (red) and DAPI (nucleus, blue), whereas cells pre-incubated with 100 μg/ml PlyC for 1 hr showed no damage (right). Scale bar is 5 μm. (b) Fluorescently labeled PlyC (left panel) and PlyCB (middle panel), but not PlyCA (right panel), are internalized in A549 cells upon incubation, as shown with protein (5 µg/ml) conjugated with AlexaFluor555 (green stain). Cells were incubated in serum-free F12K medium for 30 min at 37°C, fixed with 4% PFA in PBS and subsequently stained with DAPI (blue). Arrows indicate internalized PlyC or PlyCB in vesicle-like structures with an average size of 0.5 μm. Scale bar is 10 μm. (c) Confocal microscopy of internalized PlyC colocalized with intracellular Spy. Nucleus (blue, DAPI), Spy bacteria (green, AlexFluor 488 conjugated wheat germ agglutinin), PlyC (red, AlexFluor 555 conjugated), and actin filament (magenta, AlexFluor 647 conjugated phalloidin) are shown in the same focal plane. PlyC (red) is colocalized with Spy (green) in the merged image. The maximum intensity projection shows all Z-stacks simultaneously. Scale bar, 10 μm.
Figure 2—figure supplement 1
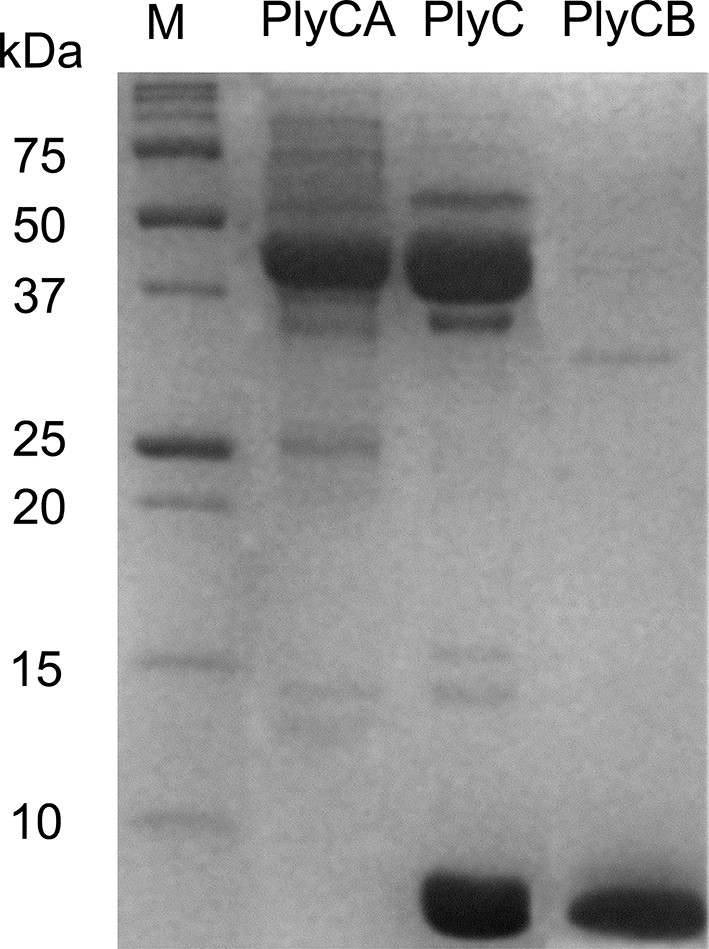
Purification of PlyC and its individual subunits.
12% SDS-PAGE of purified PlyCA (50 kDa subunit), PlyC holoenzyme (50 and 8 kDa subunits), and PlyCB (8 kDa subunit). Molecular mass markers as indicated.
Figure 3 with 1 supplement
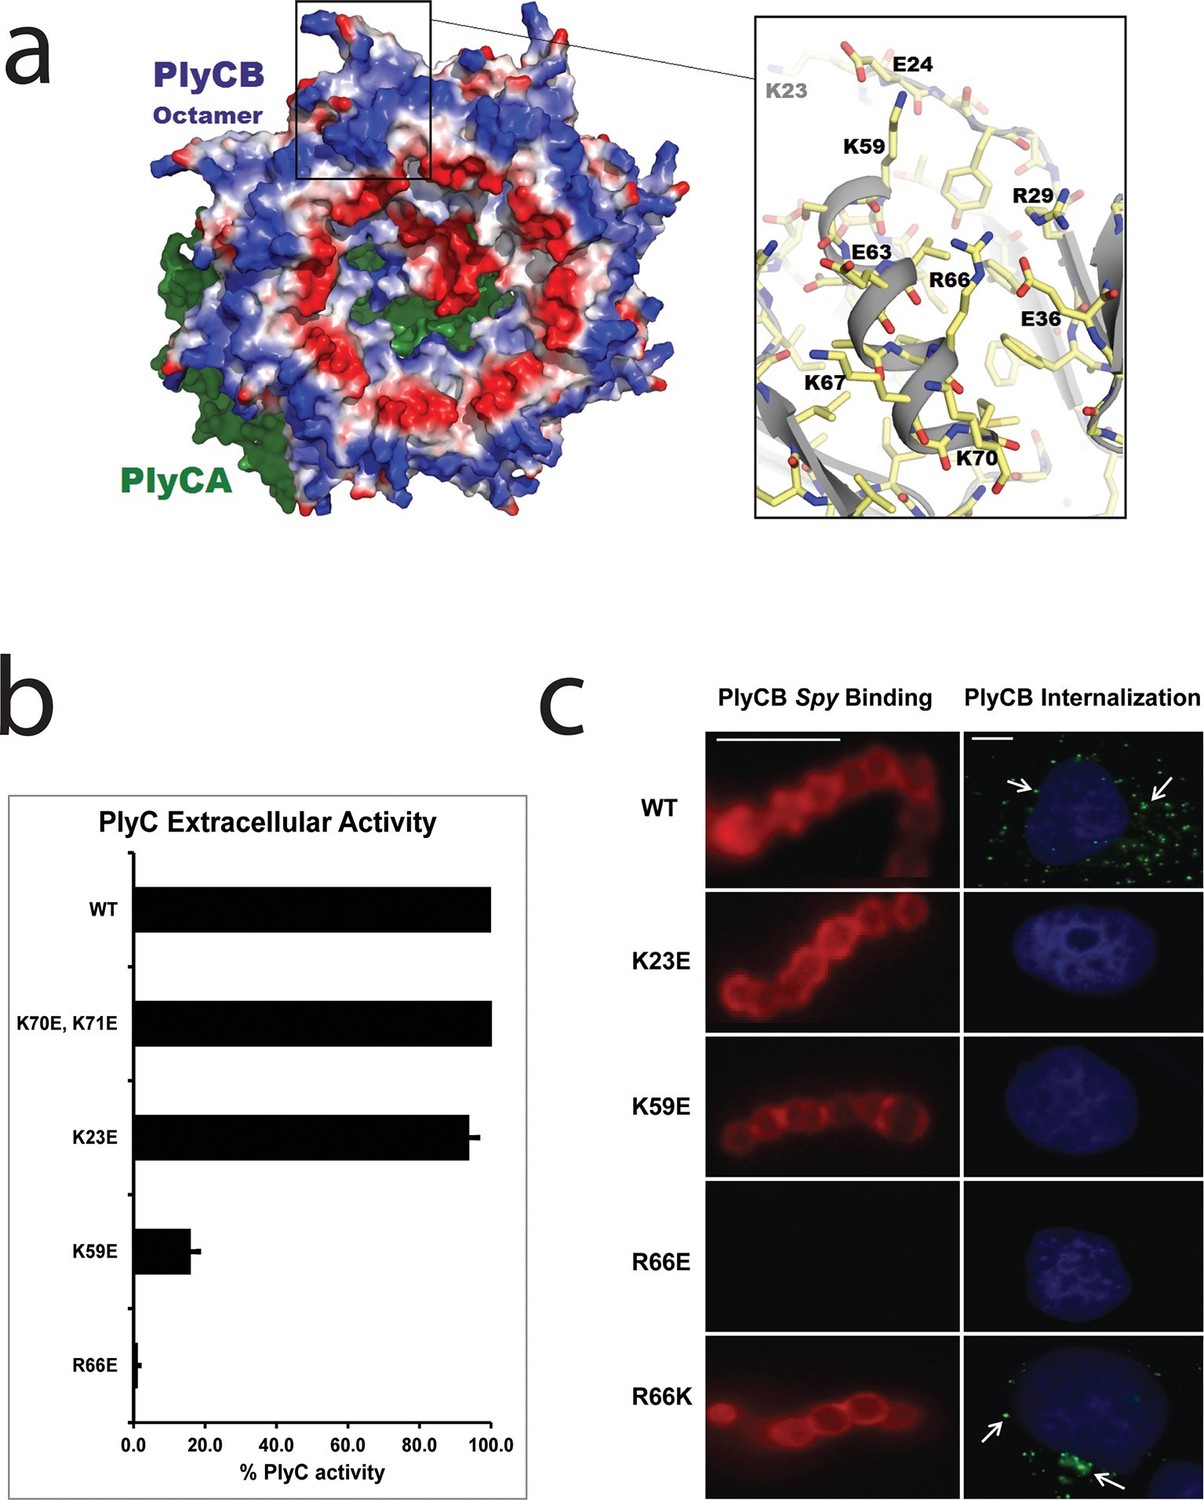
Cationic residues on the surface of PlyCB are important for Spy binding and epithelial cell internalization.
(a) View of the membrane-binding interface of the PlyC holoenzyme (PDB: 4F88). The PlyCB octamer’s solvent-accessible surface is color-coded blue and red for areas of net positive and negative charge, respectively, with Arg and Lys side chains assigned as positive and Asp and Glu as negative. The PlyCA catalytic subunit, located behind the PlyCB octamer in this view, is shown in green. The rectangular region at top is enlarged at the right using the high-resolution model of PlyCB (PDB: 4F87) that shows details of a cationic groove. Based on effects of mutations, this region appears important for interactions with both bacterial and mammalian cells. (b) Extracellular bacteriolytic activity of selected PlyC mutants on Spy, normalized to WT PlyC in a turbidity reduction assay. All experiments were performed in triplicate biological replicates, with mean and standard deviations displayed. (c) Microscopy of fluorescently labeled PlyCB and mutants on Spy (left column) and internalization into A549 epithelial cells (right column), where arrows point to intracellular PlyCB. In distinction to the data in Figure 2c, Spy are not ruptured upon protein binding since the constructs lack the catalytic PlyCA domains. Scale bar is 5 μm in the left column and 10 μm in the right column.
Figure 3—figure supplement 1
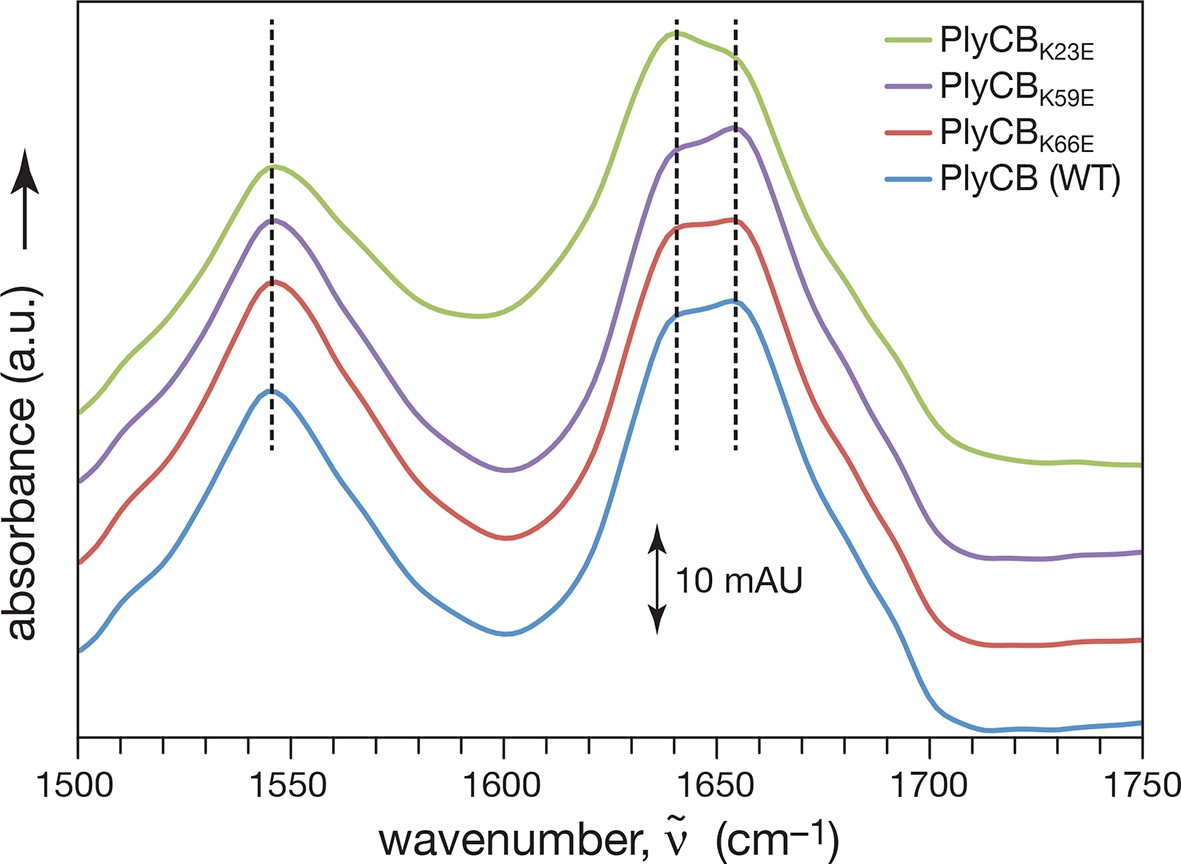
Fourier Transform Infrared Spectroscopy of WT PlyCB and binding groove mutants.
Amide I and amide II vibrational bands of PlyCB, PlyCBK23E, PlyCBK59E, and PlyCBR66E. The amplitudes of the raw spectra were adjusted such that all spectra coincided at 1650 and at 1750 cm–1. Therefore, the absorbance scale of 10 mAU (10–2 absorbance units) applies strictly only to the WT PlyCB data set. For clarity, the spectra for PlyCBR66E, PlyCBK59E and PlyCBK23E were subsequently shifted by 10, 20 and 30 mAU, respectively, and dashed lines are intended to guide the eye to band maxima. Within the amide I band, spectral contributions centered at 1660 cm–1 are usually assigned to α-helices and contributions centered at 1640 and 1680 cm–1 are attributed to β-sheets. Judged by this assignment, the secondary structure of the WT protein is largely conserved in PlyCBR66E and PlyCBK59E while the ratio of α and β structural motives may differ in PlyCBK23E.
Figure 4 with 2 supplements
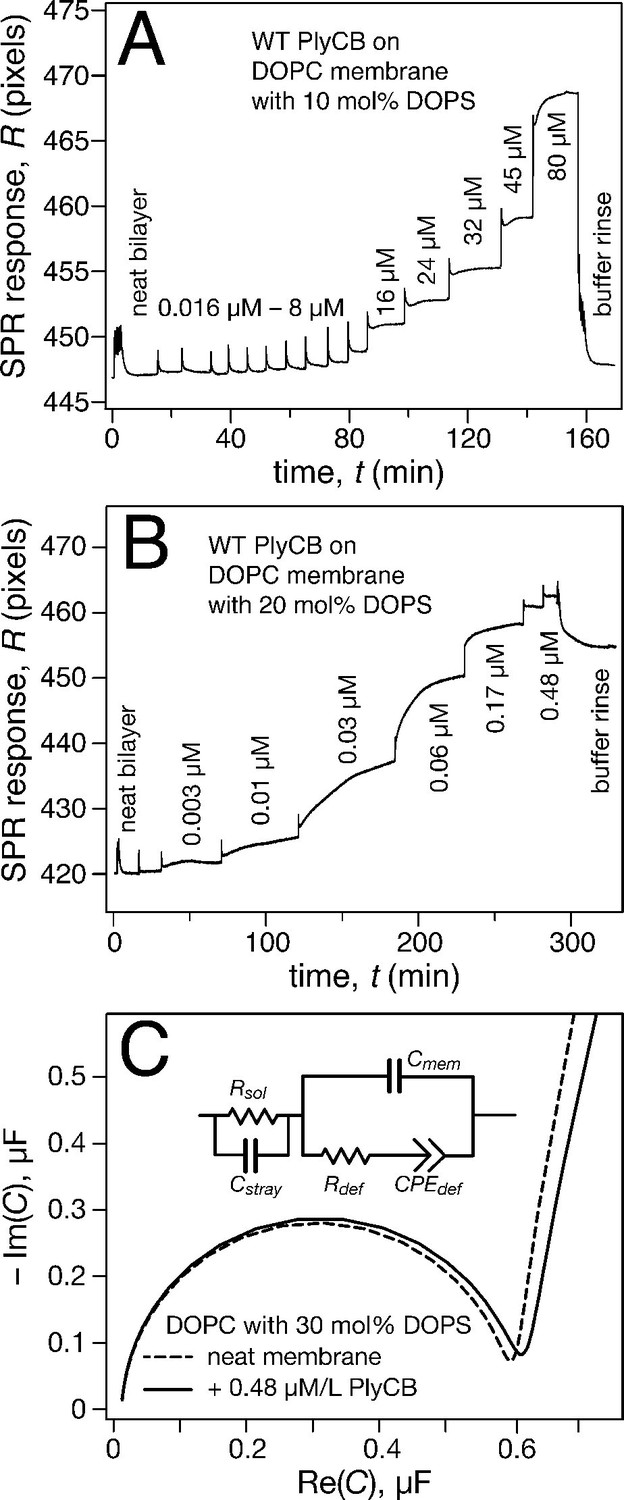
PlyCB binds to PS-containing membranes.
PlyCB in 150 mM NaCl at pH 7.4 was characterized on surface-ligated DOPC-based stBLMs with PS at various concentrations and its impact on membrane structure monitored with EIS. (a,b) Binding of PlyCB to stBLMs with 10 and 20 mol% DOPS, respectively. Each spike indicates an injection with an increased concentration of protein. A final buffer rinse removed the adsorbed protein quantitatively on 10 mol% PS, but only partially on 20 mol% PS, indicating that the association of the protein with the membrane surface differed depending on PS concentration. (c) Raw EIS spectra (Cole-Cole plots) of an stBLM (20 mol% DOPS) as prepared (dashed line) and after incubation with 480 nM PlyCB (solid line). Fitted parameters (equivalent circuit model, see inset), corrected for electrode surface size, are given in Table 1.
Figure 4—figure supplement 1
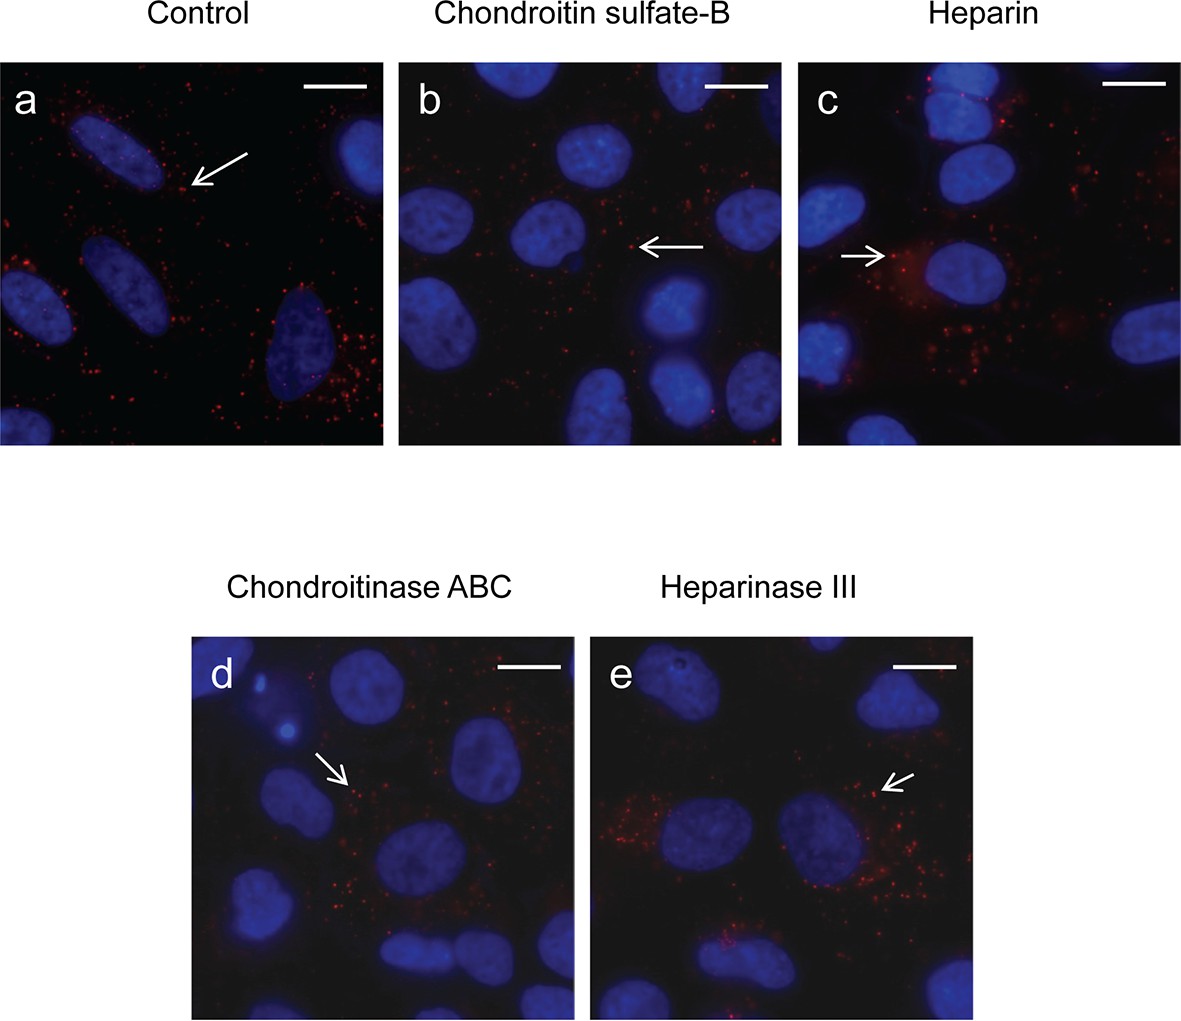
Effects of soluble GAGs or GAG lyases on internalization of PlyC.
(a) A549 epithelial cells were incubated with PlyCB-AlexaFluor555 (red) in serum-free medium F12K for 30 min at 37ºC, fixed by 4% PFA in PBS and stained with DAPI (nucleus, blue). (b) Cells were pre-treated with 50 μg/ml of chondroitin sulfate-B for 30 min then incubated with PlyCB-AlexaFluor555 before being fixed and stained with DAPI. (c) Cells were pre-treated with 100 IU/ml of heparin for 30 min then incubated with PlyCB-AlexaFluor555 before being fixed and stained with DAPI. (d) Cells were pre-treated with 20 mIU/ml of chondroitinase ABC for 1 hr then incubated with PlyCB-AlexaFluor555 before being fixed and stained with DAPI. (e) Cells were pre-treated with 5 mIU/ml of Heparinase III for 1 hr then incubated with PlyCB-AlexaFluor555 before being fixed and stained with DAPI. Arrows indicate the internalized PlyCB. Scale bar is 10 μm.
Figure 4—figure supplement 2
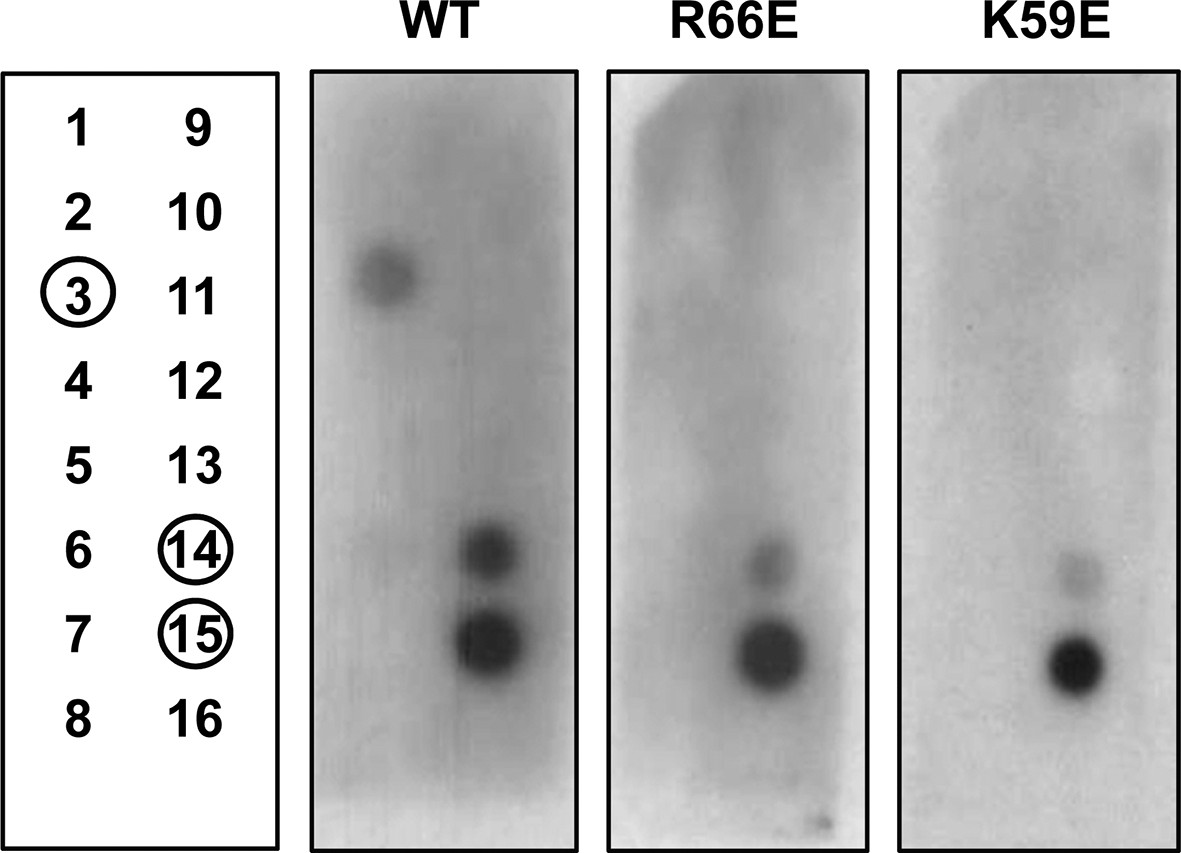
Assessment of PlyCB binding to phospholipids using a PIP Strip array.
Layout of phospholipids used in the phospholipid arrays (left panel) and binding results of His-tagged WT PlyCB, PlyCBR66E, and PlyCBK59E. The blot was developed with the LumiSensor Chemiluminescent HRP Substrate Kit while using Mouse Anti-His mAb followed by Goat Anti-Mouse IgG [HRP]. Legend: 1, lysophosphatidic acid (LPA); 2, lysophosphocholine (LPC); 3, phosphatidylinositol (PI); 4, phosphatidylinositol-3-phosphate (PI3P); 5, phosphatidylinositol-4-phosphate (PI4P); 6, phosphatidylinositol-5-phosphate (PI5P); 7, phosphatidylethanolamine (PE); 8, phosphatidylcholine (PC); 9, sphingosine-1-phosphate (S1P); 10, phosphatidylinositol-3,4-bisphosphate (PI(3,4)P2); 11, phosphatidylinositol-3,5-bisphosphate (PI(3,5)P2); 12, phosphatidylinositol-4,5-bisphosphate (PI(4,5)P2); 13, phosphatidylinositol-3,4,5-trisphosphate (PI(3,4,5)P3); 14, phosphatidic acid (PA); 15, phosphatidylserine (PS), 16, blank.
Figure 5
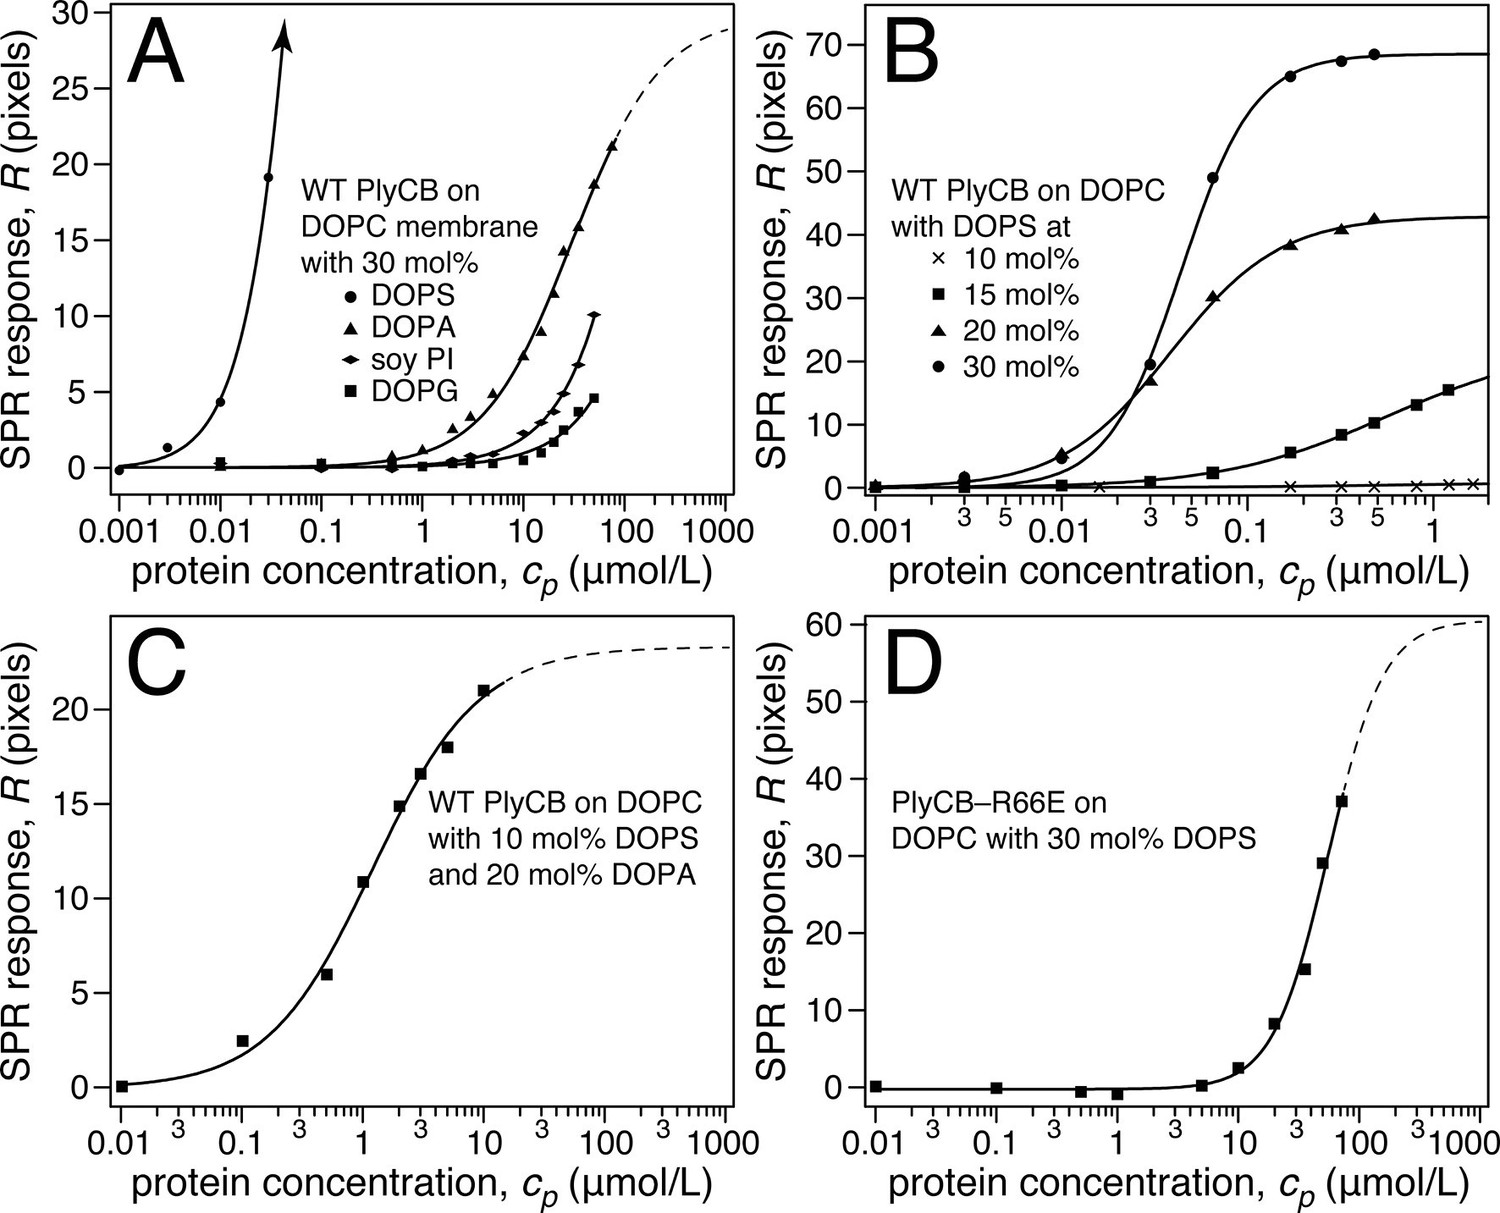
Roles of specific interaction of PlyCB with PS and electrostatic interaction in membrane binding.
(a) Binding isotherms of WT PlyCB to membranes with different anionic phospholipids of the same concentration. The isotherm for DOPC:DOPS = 70:30 is only partially shown. Buffer rinses following protein incubations removed bound PlyCB from PG, PI, and PA-containing membranes as in the experiment shown Figure 4a. (b) WT PlyCB binding to binary membranes with DOPC and various concentrations of DOPS. (c) WT PlyCB binding to a ternary membrane composed of DOPC:DOPA:DOPS = 70:20:10. (d) PlyCBR66E binding to a binary stBLM containing DOPC with 30 mol% DOPS. Data at cp > 10 μM were corrected for protein contributions to the optical index of the buffer (see 'Materials and methods').
Figure 6
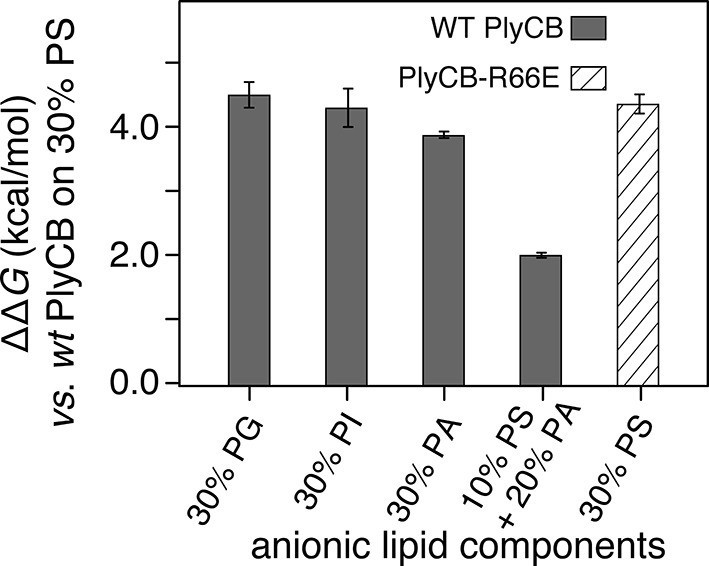
PlyCB affinities for anionic lipid components in terms of free energy of membrane binding.
Membranes with 30 mol% anionic lipids of various compositions are compared to WT PlyCB on 30 mol% PS. This graph visualizes that WT protein was bound to PG, PI, or PA much more weakly than to PS (positive deviations of ΔΔG indicate lower affinities) and that a low concentration of PS with a larger concentration of PA restored some of the protein binding. PlyCBR66E bound to 30 mol% PS with a similarly low affinity as that of WT PlyCB to 30 mol% PI.
Figure 7
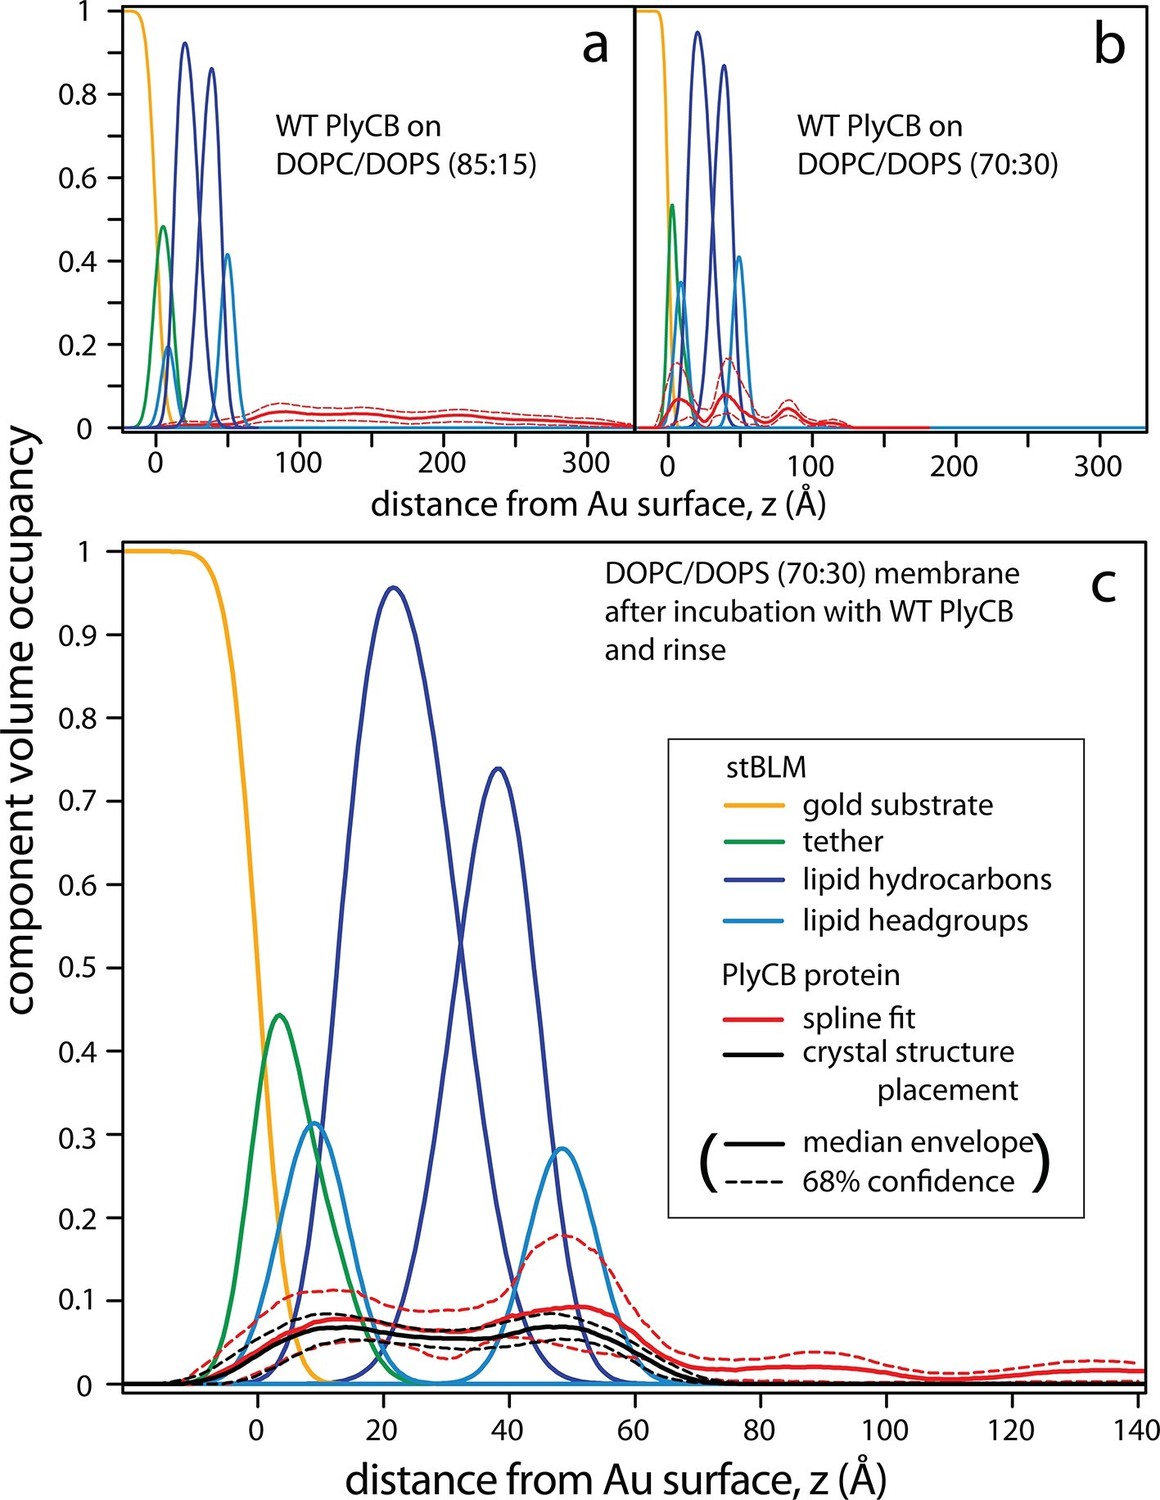
PlyCB forms distinct membrane–protein complexes at high and low PS content of the bilayer.
CVO profiles (Heinrich and Lösche, 2014) of membrane-bound PlyCB on DOPC stBLMs containing (a) 15 mol% and (b,c) 30 mol% DOPS. Neutron reflection experiments were performed on neat bilayers and on bilayers in contact with protein-containing solutions, and co-refined (protein concentration in panels a and b: 5 μM and 600 nM, respectively). Panel (c) shows the same stBLM as in (b) after a buffer rinse to remove loosely associated protein from the membrane surface. Only the structures of the stBLMs in the presence of PlyCB protein are shown. The CVO profile in (a) shows accumulation of protein outside the bilayer, but no incorporation into the membrane. In distinction, the protein inserts deeply into the PS-rich bilayer, as indicated by the CVO profiles in panels b and c. The legend box in (c) applies to all panels. Confidence limits of the CVO profiles (not shown for the lipid components but indicated by dashed lines for the protein distributions) were determined by fitting the experimental data with a Monte Carlo Markov Chain.
Figure 8

Interaction between PlyCB and PS requires structural integrity of a cationic binding groove.
(a) Superimposed crystal structures of WT PlyCB (PDB: 4F87, cyan carbons) and PlyCBR66E (PDB: 4ZRZ, yellow, with green to emphasize the key residues R29, E36 and the mutated E66) in the groove region. These are both high-resolution structures (1.4 Å and 1.7 Å, respectively) of PlyCB alone. The orange sphere shows the location of a putative phosphate site observed in WT PlyCB in the presence of phosphate or phosphate-bearing ligands. This site holds a water molecule in the WT structure, but an empty site was observed in PlyCBR66E, apparently disrupted by the mutation. Mesh shows 2Fo-Fc electron density contoured at 1.6 σ for the three key residues in the mutant structure. The H-bond interaction between R66 and E36 is maintained in the mutant, suggesting that the observed side-chain conformations represent a stable configuration. (b) Local structure around the PS docking pose with lowest interface energy, as determined with Rosetta. The PS (cyan carbons) with partially removed fatty acid tails binds to the putative docking site adjacent to R29, K59, and R66. The headgroup and two α carbons of the fatty acid chains are labeled in cyan. The PlyCB backbone is shown in green, with the side chains in the docking site (sticks with green carbons) together with their superimposed conformations from the holoenzyme crystal structure (PDB: 4F88, magenta carbons). Interestingly, the conformation of PlyCB with a double H-bond between R66 and E36, which is the conformation seen in the PlyCB-alone high-resolution structure PDB: 4F87 (Figure 3a, 6a), is reproduced in the PS docking. Proposed H bonds and salt bridges, in the calculated PS docking, as well as the distances between the corresponding atoms are also shown (dashes and labels).
Figure 9
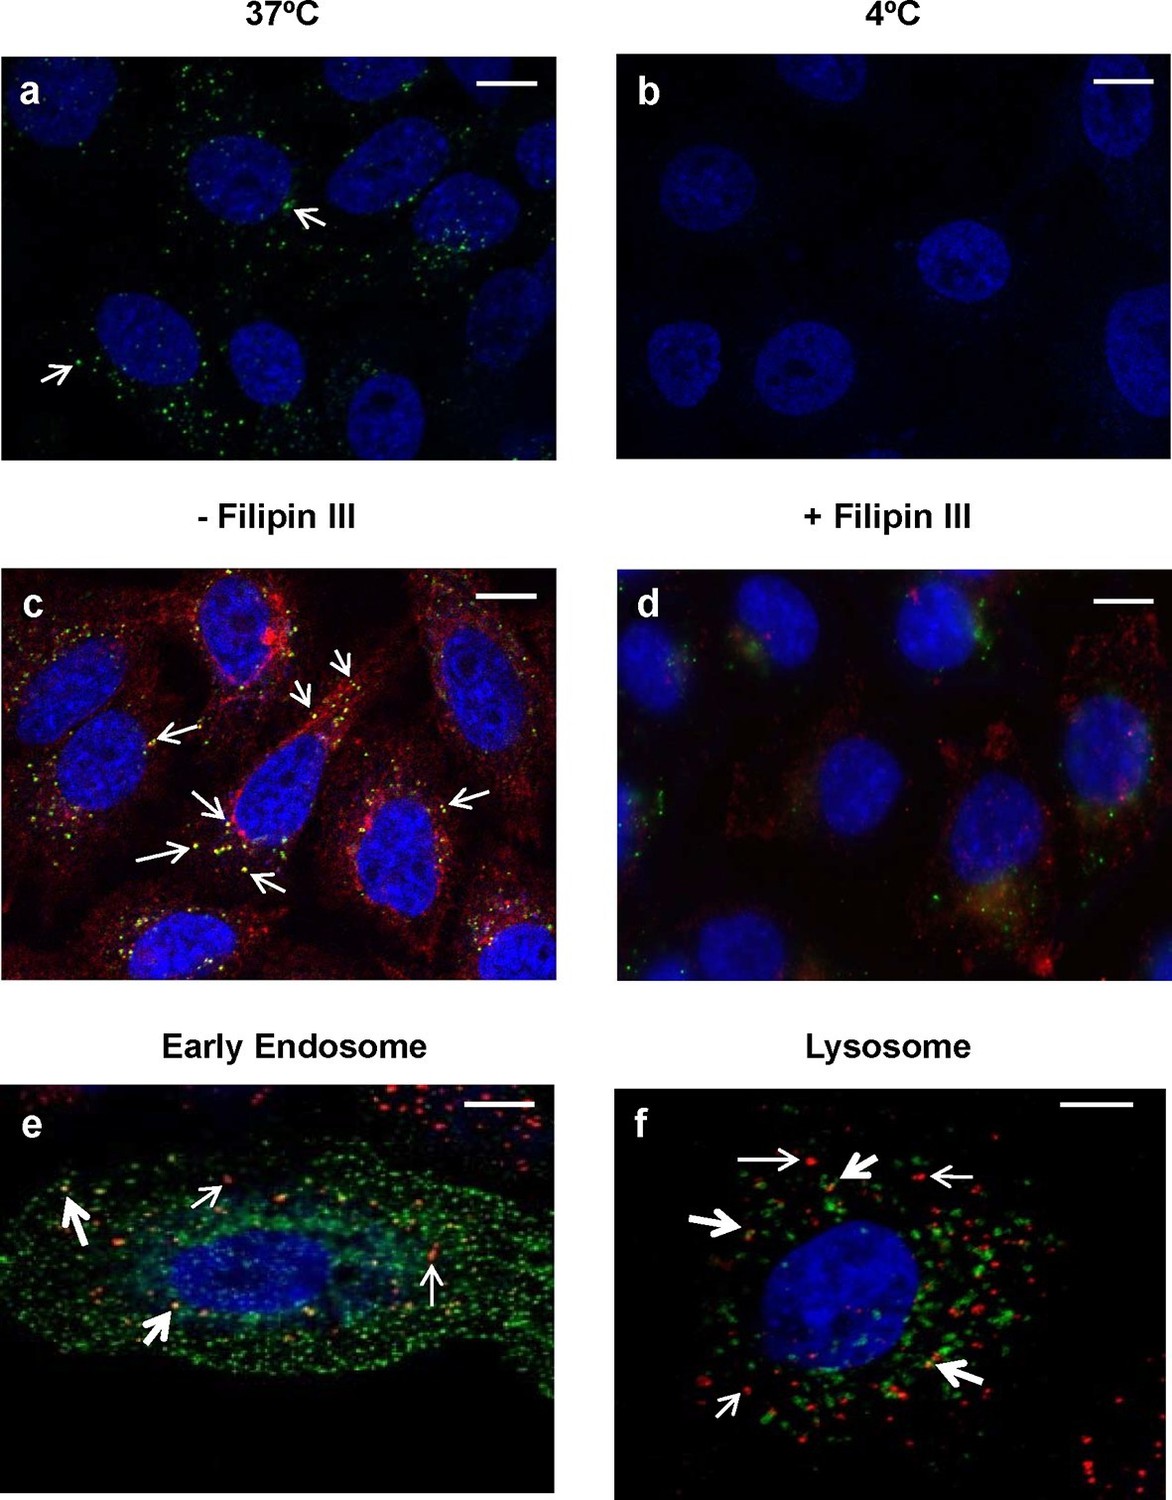
Intracellular trafficking of PlyCB depends on caveolae-mediated endocytosis.
(a) A549 cells were incubated with PlyCB-AlexaFluor488 (green) in serum-free medium F12K for 30 min at 37ºC, fixed by 4% PFA in PBS, and stained with DAPI (nucleus, blue). Arrows indicate intracellular PlyCB vesicles. (b) PlyCB internalization was not observed when incubating PlyCB-AlexaFluor488 with cells at 4ºC. (c) Cells were incubated with PlyCB-AlexaFluor488 (green) and CTxB-AlexaFluor555 (red) in serum-free medium F12K for 30 min at 37ºC, fixed, and subsequently stained with DAPI (blue). Arrows show co-localization (yellow) of PlyCB and CTxB. (d) Cells were pre-treated with Filipin III for 30 min, incubated with PlyCB-AlexaFluor 488 (green) and CTxB-AlexaFluor 555 (red) before being fixed and stained with DAPI. (e) A549 cells were transfected with CellLight early endosome-GFP (green) 24 hr prior to treatment of with PlyCB-AlexaFluor555 (red) and fixed after 60 min incubation with PlyCB. PlyCB-AlexaFluor555 co-localizes (yellow) with early endosome compartments as indicated by the bold arrows. The narrow arrows indicate non-endosomal vesicles containing PlyCB. (f) Cells were transfected with CellLight lysosome-GFP (green) 24 hr prior to treatment with PlyCB-AlexaFluor555 (red) and fixed after 60 min incubation with PlyCB. The bold arrows points to the co-localization (yellow) of PlyCB with lysosomal compartments. The narrow arrows indicate non-lysosomal vesicles containing PlyCB. Scale bars are 10 μm.
Tables
Table 1
Best-fit parameters from fitting the EIS data in Figure 4c to an equivalent circuit model (ECM).
Specific capacitances and resistances were determined after normalization by the geometric electrode surface area (a = 0.32 cm2) and multiplication by the roughness factor (β = 1.4).
| ECM parameters | As-prepared bilayer (DOPC/DOPS = 7:3) | Bilayer + PlyCB (480 nM) |
|---|---|---|
| Rsol (Ω) | 129.0 ± 0.2 | 106.0 ± 0.3 |
| Cstray (nF) | 7.0 ± 0.1 | 13.0 ± 0.3 |
| Cmem (μF/cm2) | 0.710 ± 0.002 | 0.739 ± 0.004 |
| Rdef (kΩ cm2) | 60.20 ± 0.06 | 43.98 ± 0.12 |
| CPEdef (μF/cm2) | 8.17 ± 0.06 | 8.97 ± 0.12 |
| αdef | 0.925 ± 0.003 | 0.870 ± 0.006 |
Table 2
Best-fit parameters from fitting Equation (1) to SPR data shown in Figure 5.
| Protein | stBLM composition | Kd (µM) | R∞(ng/cm2) | N |
|---|---|---|---|---|
| WT PlyCB | DOPC:DOPG 70:30 | >> 50 | n.d. | n.d. |
| DOPC:soy PI 70:30 | > 50 | n.d. | n.d. | |
| DOPC:DOPA 70:30 | 26.9 ± 2.9 | 170 ± 8 | (Langmuir fit) | |
| DOPC:DOPS 90:10 | >> 50 | n.d. | n.d. | |
| DOPC:DOPS 85:15 | 0.49 ± 0.02 | 128.8 ± 2.7 | 1.0 ± 0.1 | |
| DOPC:DOPS 80:20 | 0.04 ± 0.01 | 251.7 ± 0.4 | 1.5 ± 0.1 | |
| DOPC:DOPS 70:30 | 0.04 ± 0.01 | 402.5 ± 0.5 | 2.2 ± 0.2 | |
| DOPC:DOPA:DOPS 70:20:10 | 1.2 ± 0.1 | 134.6 ± 1.2 | (Langmuir fit) | |
| PlyCBR66E | DOPC:DOPS 70:30 | 62.2 ± 22.2 | 331 ± 72 | 2.0 ± 0.05 |
Table 3
Summary of the best set 1 candidate models by interface energy.
| Ligand | Set | Best model by interface energy | |||
|---|---|---|---|---|---|
| Interface energy score (kcal/mol) | Rosetta total energy (kcal/mol) | H-bond and Salt bridges Interactions | Distances between corresponding atom pairs (Å) | ||
| PS | 1A | -6.64 | -1464.65 | Head - R29 | 2.90, 2.77 |
| P - R66 | 2.67 | ||||
| Tail - R66 | 3.45, 2.93 | ||||
| 1B | -3.06 | -1461.49 | Head - R29 | 2.84, 2.90, 3.32 | |
| P - R66 | 2.89, 3.32 | ||||
| 1C | -3.15 | -1461.72 | Head - R29 | 2.87, 3.43 | |
| Head - E36 | 2.95 | ||||
| P - R66 | 2.86 | ||||
| PE | 1A | -2.90 | -1465.81 | Head - E63 | 2.92 |
| P - R66 | 3.19 | ||||
| Tail - R66 | 2.76, 3.24 | ||||
| Tail - R29 | 2.92 | ||||
| 1B | -2.92 | -1464.62 | Head - E63 | 2.95 | |
| P - R66 | 2.88, 3.43 | ||||
| 1C | -2.61 | -1466.02 | Head - E63 | 2.98 | |
| P - R66 | 2.84, 3.61 | ||||
-
Ligand in set 1A has the longest tail construct (kept up to the α carbon). Ligand in set 1B only has head group and phosphate. Ligand in set 1C has one carbon after the ester linkage. Head is the ligand head group. P is the ligand phosphate moiety. Tail includes the ligand glycerol moiety and two fatty acid chains.
Table 4
Good models in set 2 candidates.
| Ligand | Model ID | H-bond and Salt bridges Interactions | Distances between corresponding atom pairs (Å) |
|---|---|---|---|
| PS | gp7_D0145 | Head - R29 | 2.94 |
| P - R66 | 2.91 | ||
| Tail - R66 | 2.92 | ||
| gp7_D0430 | Head - R29 | 2.79 | |
| P - R29 | 2.74 | ||
| P - R66 | 2.85, 2.85 | ||
| Tail - K59 | 2.90 | ||
| gp8_D0131 | Head - R66 | 2.86, 2.94 | |
| P - 29 | 2.83 | ||
| gp1_F0153 | Head - R29 | 2.83, 2.88 | |
| P - R66 | 2.93 | ||
| gp9_F0363 | Head - R29 | 2.61 | |
| P - R66 | 2.96, 3.08 | ||
| Tail - R66 | 2.60 | ||
| PE | gp1_F0391 | Head - E36 | 2.84 |
| P - R29 | 2.89 | ||
| gp9_F0228 | Head - E36 | 2.95 | |
| P - R29 | 2.90 |
-
Head is the ligand head group. P is the ligand phosphate moiety. Tail includes the ligand glycerol moiety and two fatty acid chains.
Download links
A two-part list of links to download the article, or parts of the article, in various formats.
Downloads (link to download the article as PDF)
Open citations (links to open the citations from this article in various online reference manager services)
Cite this article (links to download the citations from this article in formats compatible with various reference manager tools)
A bacteriophage endolysin that eliminates intracellular streptococci
eLife 5:e13152.
https://doi.org/10.7554/eLife.13152


