Lineage mapping identifies molecular and architectural similarities between the larval and adult Drosophila central nervous system
- Janelia Research Campus, Howard Hughes Medical Institute, United States
Figures
Figure 1 with 1 supplement
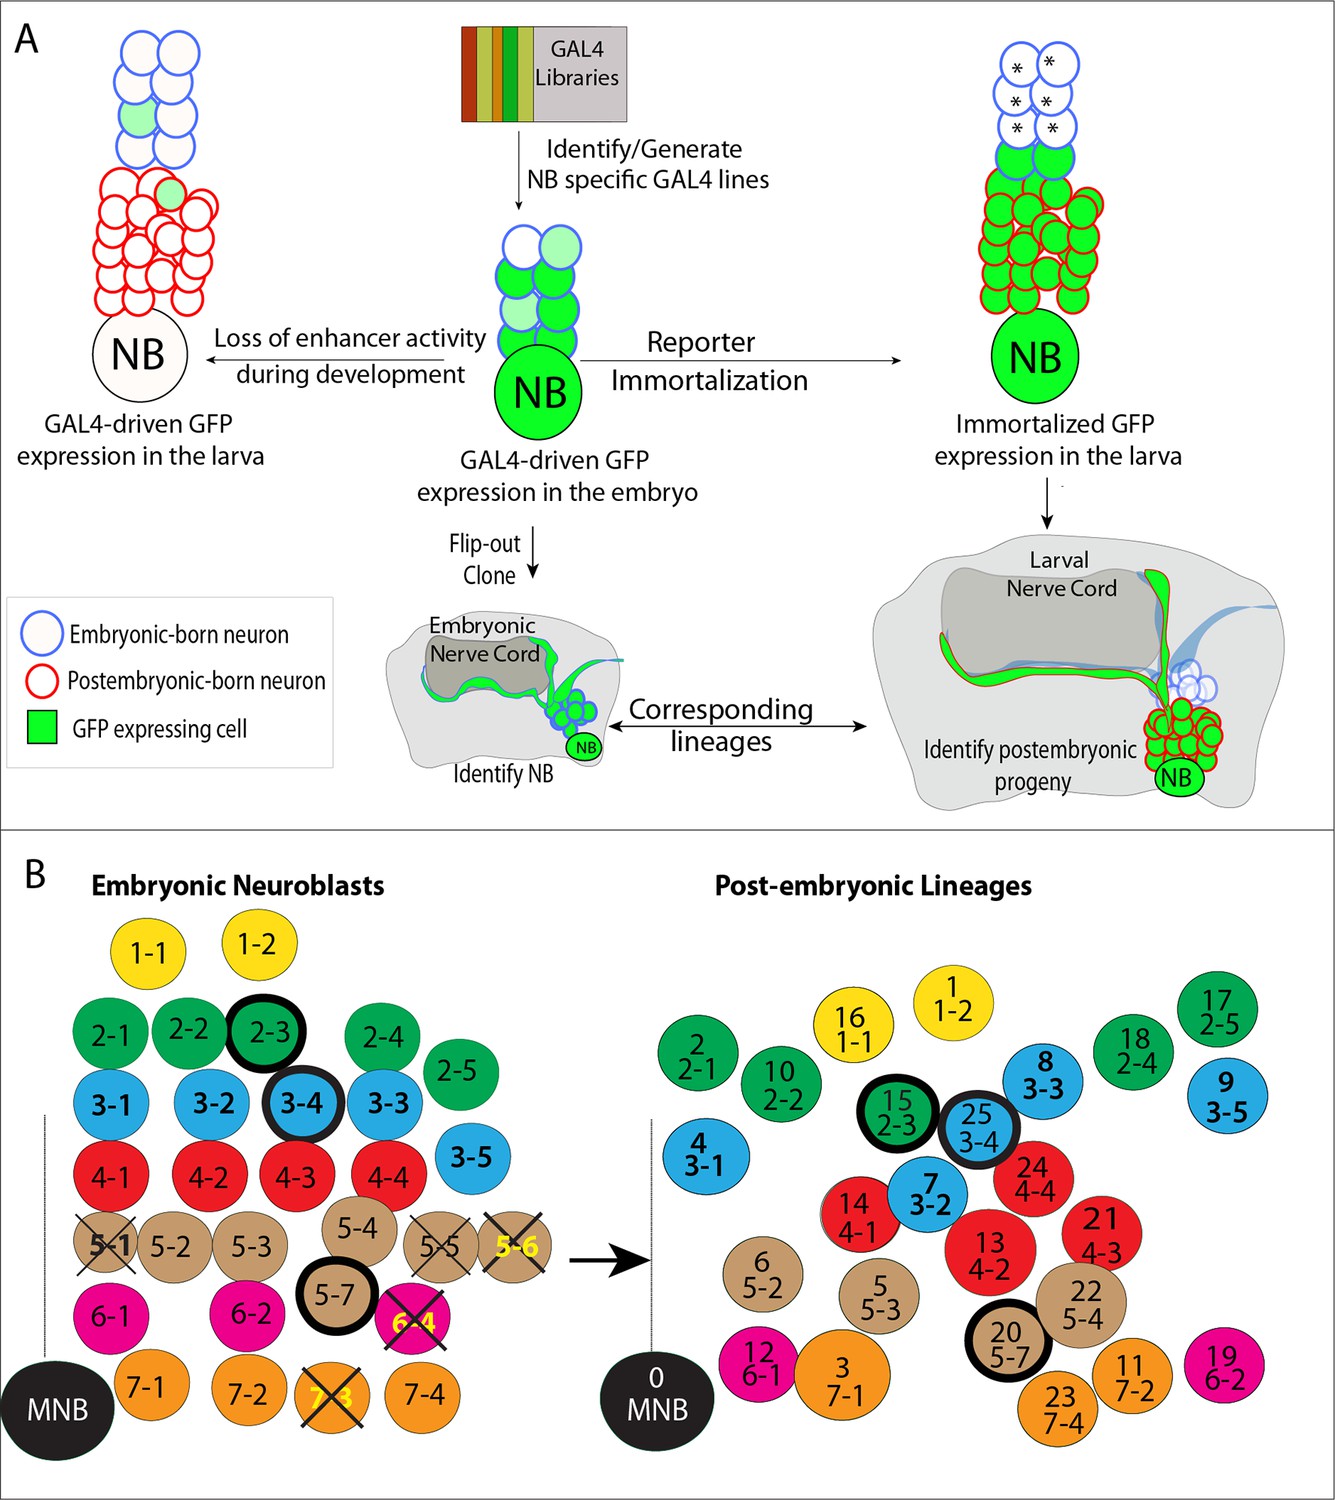
Tracing individual NB lineages identifies postembryonic progeny of NBs.
(A) Schematic illustration of the strategies used in this study to trace NB lineages. Since expression of GAL4 lines is usually not maintained throughout the development, GAL4 expression was immortalized in progeny of the NBs to identify their postembryonic progeny. The “reporter immortalization” technique requires several steps of transcriptions and recombinations (Awasaki et al., 2014). Thus, cells that are born from initial divisions (marked by asterisk) after the GAL4 presence are not labeled with this technique. (B) Schematic representations of embryonic NBs (left) and their corresponding postembryonic lineages (right) for the T2 segment shown. 30 bilaterally symmetric NBs and 1 medial NBs generate 26 postembryonic lineages. For segment specific differences, see Figure 1—figure supplement 1. Row identity of NBs shown in a color code. Three thoracic specific NB lineages are outlined with a thick line. Thick crosses depict NBs, which are eliminated by apoptosis; thin crosses depict NBs, which are present at early stage embryos, but not detected at stage 17 embryos. Dashed line indicates the midline.
Figure 1—figure supplement 1
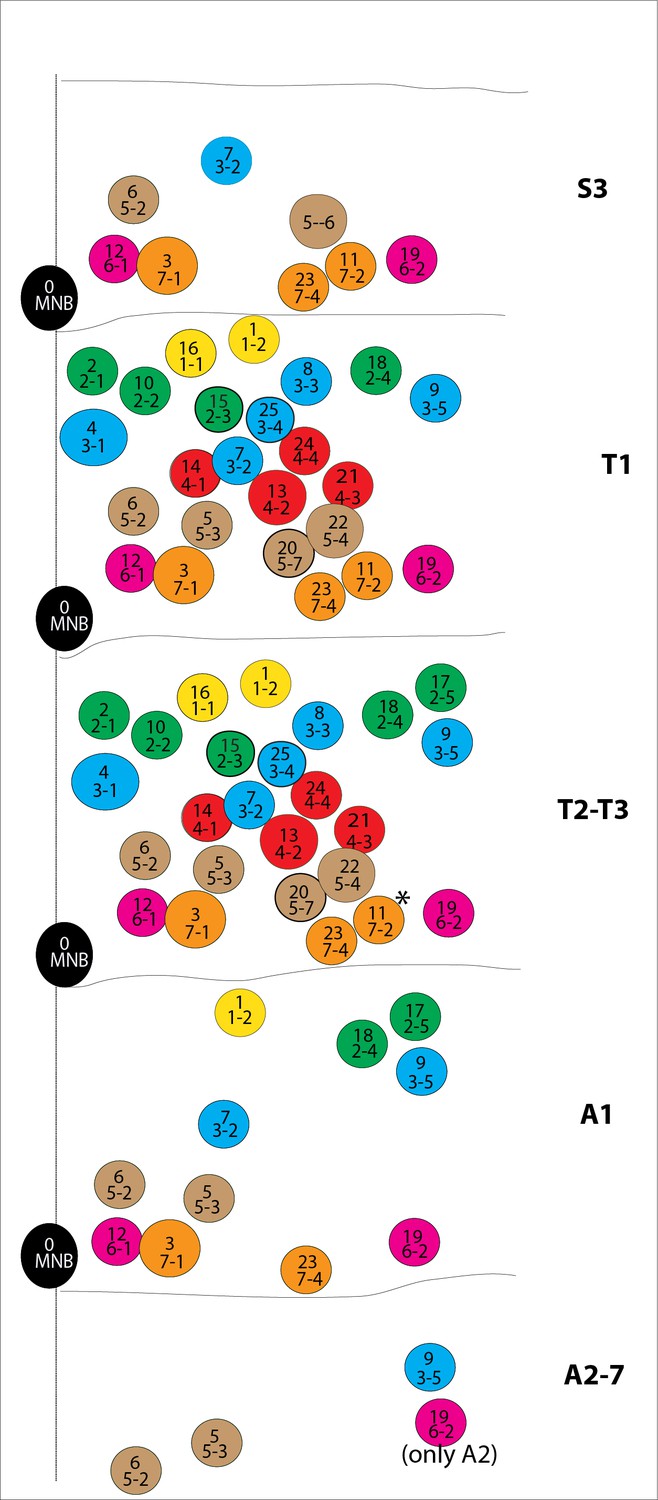
Schematic representations of postembryonic lineages in different segments of the nerve cord shown.
T2 and T3 segments virtually have the same lineages with the exception of lineage 11 (asterisk), which is dramatically reduced in cell number in the T3 segment. Among A2-A7 segments, NB6-2 survives postembryonically and gets reactivated only in the A2 segment (Birkholz et al., 2015).
Figure 2
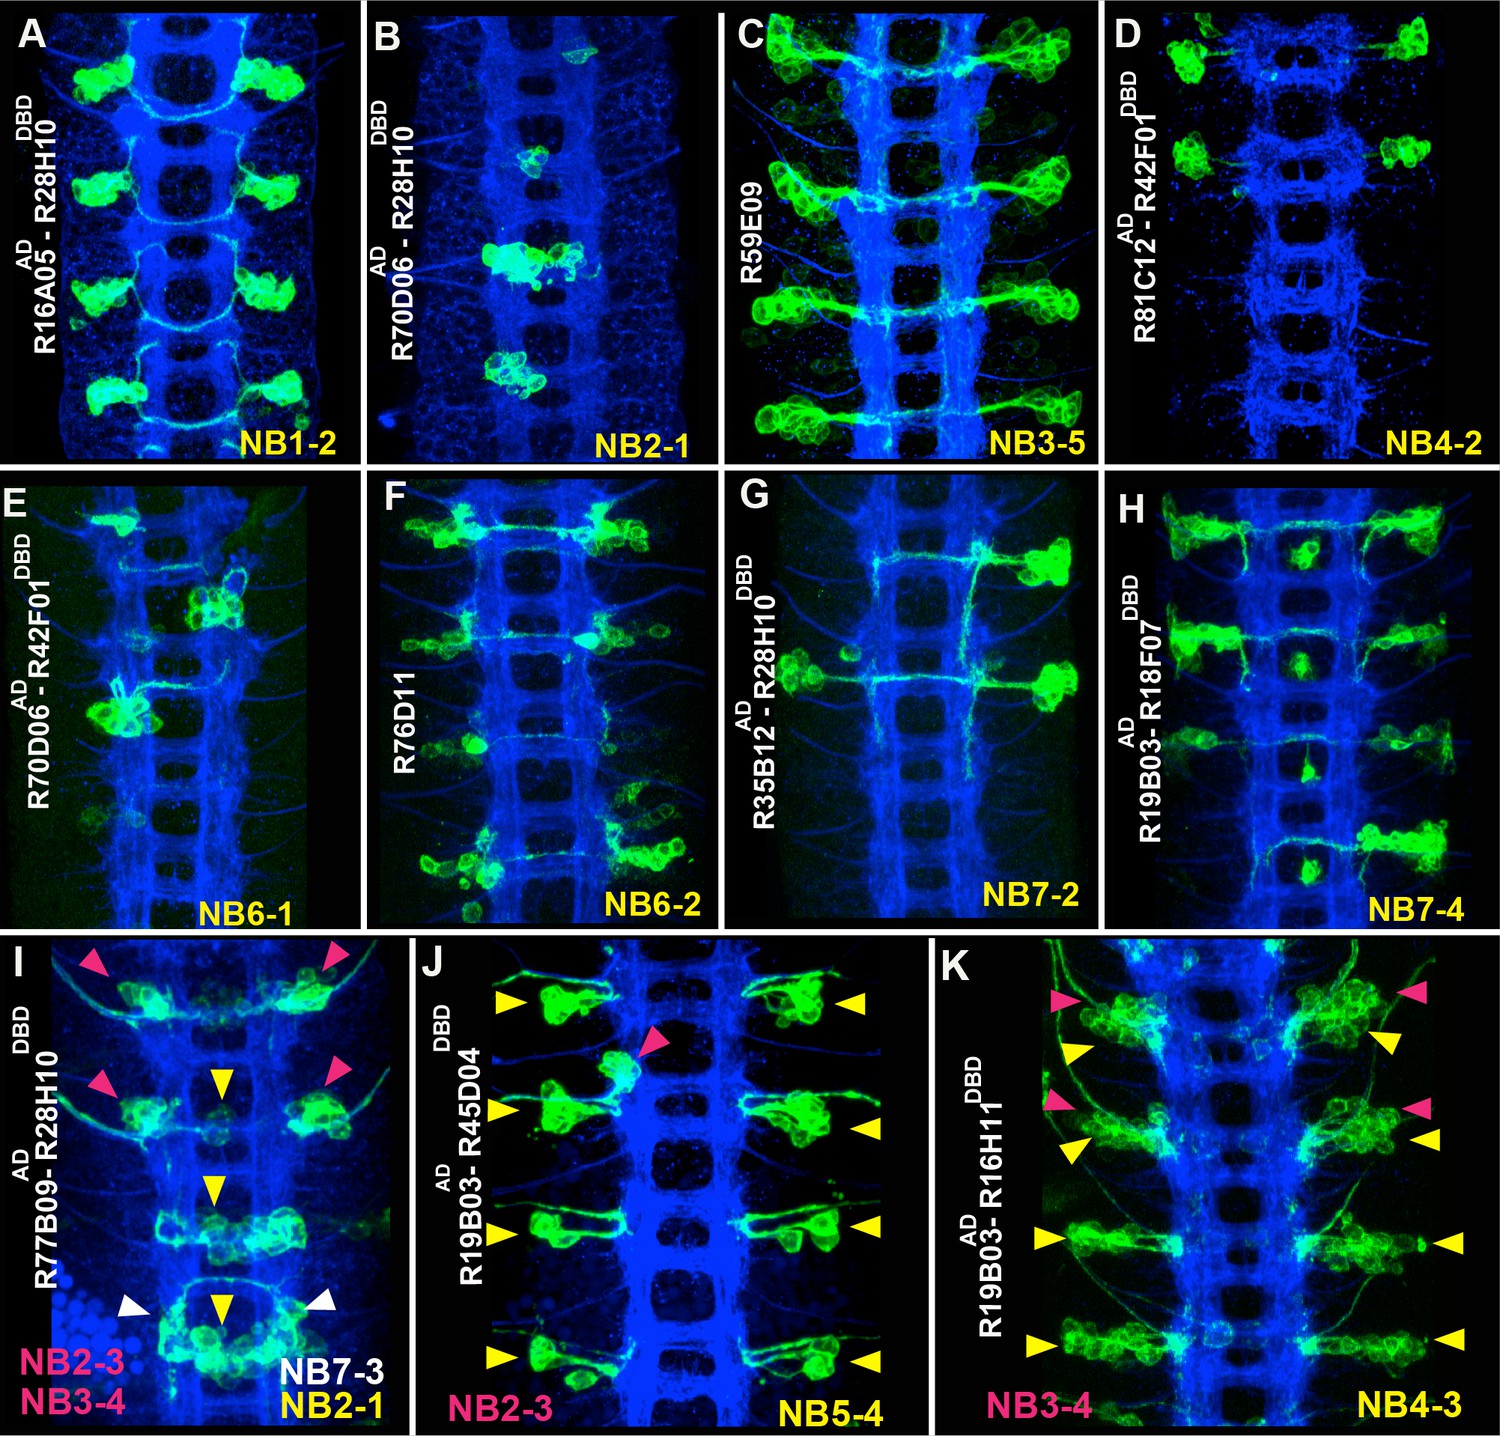
Sample GAL4 lines that mark NBs and their progeny.
(A-K) Expression patterns of selected GAL4 lines in the nerve cords of late-stage embryos were visualized by driving mCD8-GFP (green). Only the T2-A2 segments are shown. (A-H) GAL4 lines uniquely label individual NBs and a subset of their progeny: NB1-2 (A), NB2-1 (B), NB3-5 (C), NB4-2 (D), NB6-1 (E), NB6-2 (F), NB7-2 (G), and NB7-4 (H). Although NB4-2 generates progeny in both thoracic and abdominal segments, R81C12AD-R42F01DBD marks the NB4-2 lineage only in thoracic segments (D). (I-K) Expression of GAL4 lines that sparsely label a few NBs and their progeny. Color-coded arrowheads indicate the location of the NB lineages. See Figures 2–4 for the presence of NBs, which are revealed by Dpn staining in some of these GAL4 lines. FasII+BP102 (blue) visualizes embryonic neuronal architecture; anterior is up.
Figure 3
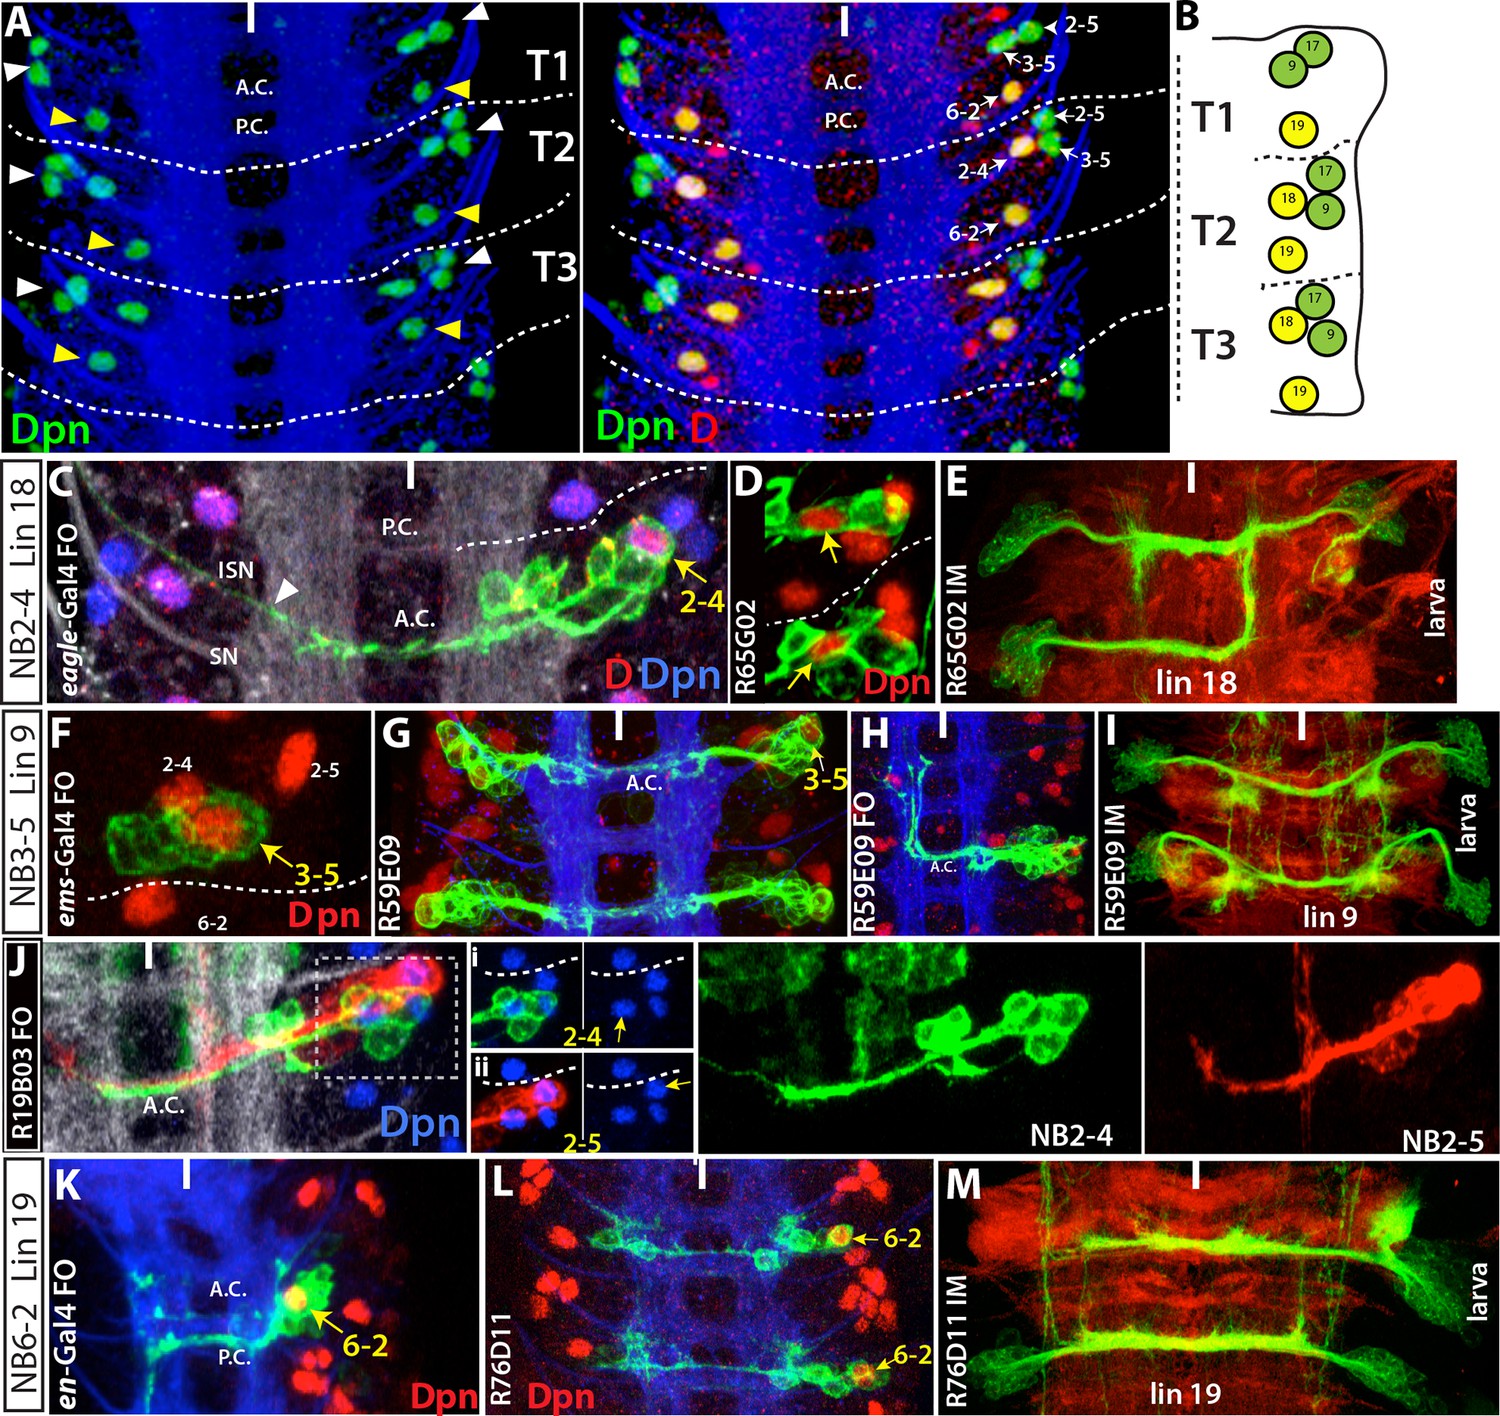
NB2-4, NB2-5, NB3-5 and NB6-2 generate lineage 18, 17, 9 and 19, respectively.
Images on panels B, E, I, and M are from the larval CNS; the rest are from the embryonic CNS. (A) Projection of dorsally located NBs, marked by Dpn (green), in the thoracic segments of a stage-17 embryo. Three NBs (triplet) anteriorly and one NB posteriorly reside in each hemisegment (white and yellow arrowheads in the left panel, respectively). Note the T1 segment is missing a NB in the anterior region. Dichaete (red) marks the medial NB of the anterior triplet and the posterior NB (right panel). NB identities were determined based on lineage clones (see below). (B) Schematic view of the postembryonic lineages in the dorsal part of the larval thoracic nerve cord (depicted based on Truman and Bate, 1988, Truman et al., 2004 and 2010, and Li et al., 2014). Pattern of these postembryonic lineages is the same as that of dorsal embryonic NBs (compare A and B). (C-E) NB2-4 is the progenitor of lineage 18. (C) A NB2-4 lineage clone generated with eg-GAL4 includes the medial D+ NB (D, red; Dpn, blue). A contralateral motor neuron crossing the midline via AC and exiting the CNS via ISN (arrowhead) is a characteristic feature of NB2-4 lineage. (D) R65G02 specifically marks NB2-4 and its progeny, which shows the same morphology as in (C) (not shown). (E) Immortalization of R65G02 in NB2-4 progeny constantly and specifically marks lineage 18 in the larval CNS. (F-I) NB3-5 is the progenitor of lineage 9. (F) ems-GAL4 marks NB3-5 which is the posterior NB in the triplet. (G) R59E09 specifically labels NB3-5 and its progeny. (H) A NB3-5 lineage clone obtained with R59E09. (I) Immortalization of R59E09 uniquely marks lineage 9. (J) R19B03 marks NB2-4 (green clone) and NB2-5 (red clone) lineages in the embryonic CNS. NB2-5 is located anteriorly (J-i) and NB2-4 is located medially (J-ii). (K-M) NB6-2 is the progenitor of lineage 19. (K) The posterior NB is located in a NB6-2 lineage clone obtained with en-GAL4. (L) R76D11 specifically marks NB6-2 and (M) its immortalization in NB6-2 progeny visualizes lineage 19. Wavy dashed lines indicate segment boundaries. White bar indicates the midline. FO, flip-out lineage clone; IM, immortalization; A.C., anterior commissure; P.C., posterior commissure; SN, segmental nerve; ISN, inter segmental nerve. In this and subsequent figures, lineage is abbreviated as "lin".
Figure 4 with 3 supplements
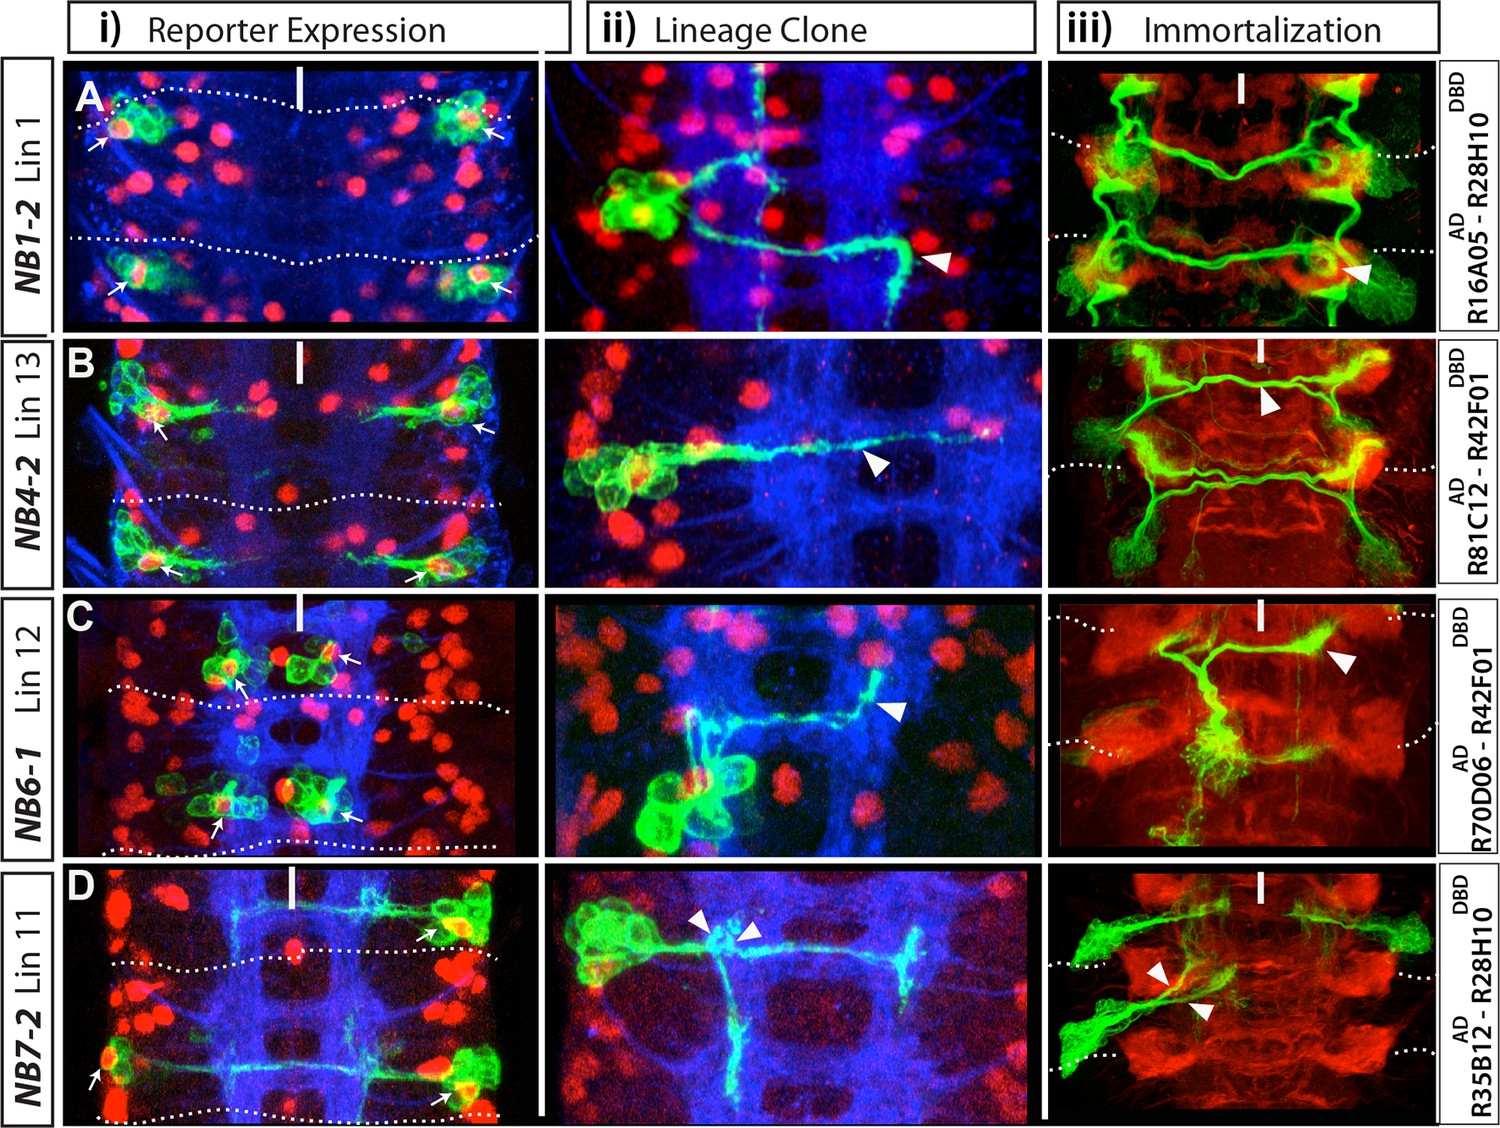
NB1-2, NB4-2, NB6-1 and NB7-2 generate lineages 1, 13, 12 and 11, respectively.
(A-D) Four examples showing identification of postembryonic lineages via reporter immortalization of NB-specific GAL4 lines. (i and ii) Nerve cords dissected from late stage embryos; Dpn (red) marks NBs. (i) Indicated GAL4 lines drive GFP reporter expression in an individual NB (arrows) in each hemisegment in addition to some of its progeny. ii) Flip-out lineage clones showing the morphology of individual embryonic NB lineages were used to find the identity of NBs. (iii) Nerve cords from wandering stage larvae in which reporter expression of the indicated GAL4 lines was immortalized in the progeny of NBs. This technique almost exclusively marks postembryonic progeny and rarely embryonic progeny (see Materials and methods and Figure 1). In each hemisegment, reporter immortalization of NB specific GAL4 lines marks a single postembryonic lineage. Arrowheads (ii and iii) show the similarities in neuronal morphology between embryonic and postembryonic progeny of an individual NB. For example, contralateral axons of lineage 1 turn with a characteristic posterior hook; embryonic neurons of the same lineage also exhibit a similar turn (Aii-iii). NB7-2 postembryonic progeny (lineage 11) extend two ipsilateral axonal bundles; NB7-2 embryonic neurons have similar axonal projections (arrows in Dii-iii). Dashed lines indicate segment boundaries. White bar indicates the midline. HRP (blue) in embryos (i, ii) and Phalloidin (Red) in larvae (iii) visualize neuronal architecture.
Figure 4—figure supplement 1
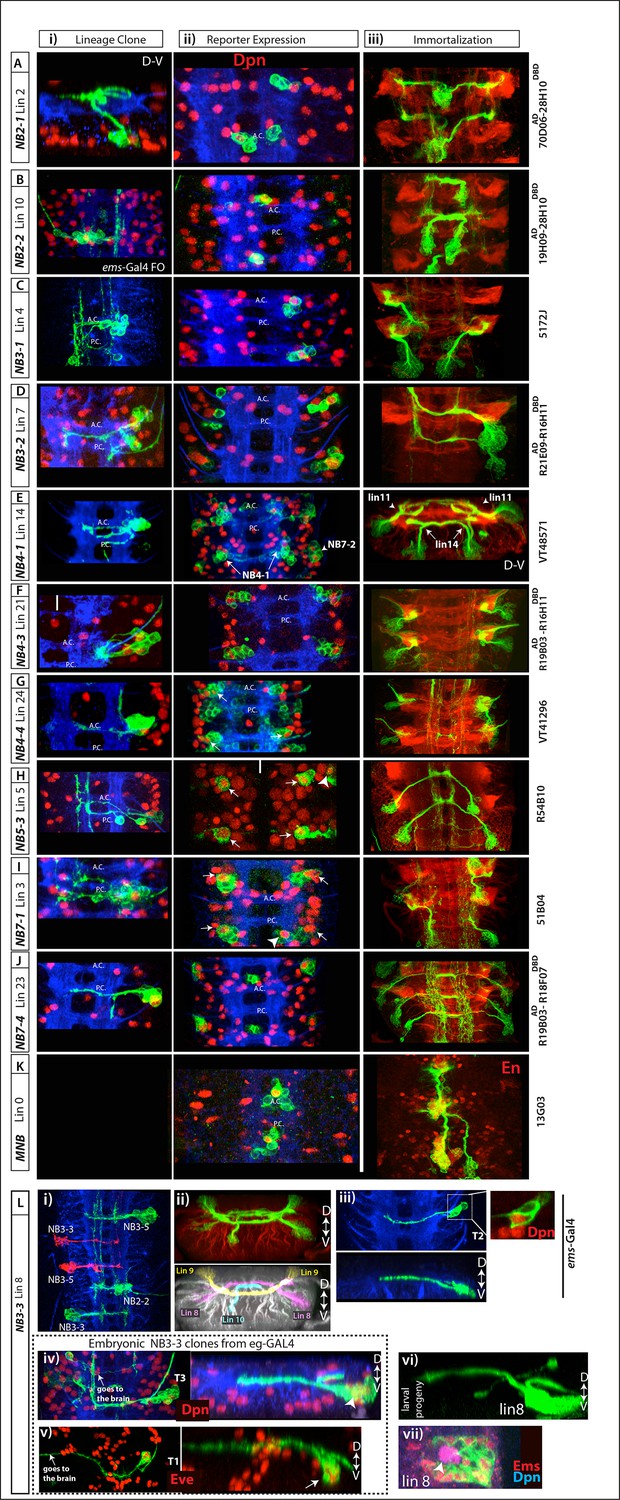
Postembryonic progeny of the remaining NBs.
See Figure 4 legends for more information. See Table 1 for efficiency and specificity of these lines on marking postembryonic lineages. (A-C) R70D06AD-R28H10DBD, R19H09 AD -R28H10DBD, and 5172J specifically and consistently mark NB2-1, NB2-2 and NB3-1 in the embryo, respectively. Reporter immortalization of these lines mark lineages 2, 10, and 4, respectively. (D) R21E09AD-R16H11DBD consistently mark NB3-2 and occasionally NB4-2 in the embryo. Its reporter immortalization marks often lineage 7 and occasionally lineage 13. (E) VT0048571 marks NB4-1 medially and NB7-2 laterally. Its immortalization marks lineage 14 medially and lineage 11 laterally. Since R35B12AD-R28H10DBD immortalization in NB7-2 progeny marks lineage 11 (See Figure 4D), NB4-1 generates lineage 14. (F) R19B03AD-R16H11DBD marks NB4-3 dorsally and NB3-4 ventrally in the embryo (i. ii). The region NB3-4 resides is excluded from this projection (ii). Immortalization of this split combination marks lineage 21 and lineage 25. Lineage 25 is a small lineage; hence it is obscured by the large lineage 21 (iii). (G) VT0041296 marks specifically NB4-4 among embryonic NBs (arrows) in addition to large number of neurons from other lineages (i-ii). Its immortalization consistently marks lineage 24 (iii). (H) R54B10 marks NB5-3 (arrows) and NB5-6 (arrowhead (i-ii). Its immortalization uniquely marks lineage 5 (iii). Note NB5-6 does not generate postembryonic progeny (see the text). (I) 51B04 marks regularly NB7-1 (arrows) and occasionally NB6-1 (arrowhead) and NB6-2 (i-ii). Its immortalization labels lineage 3 and occasionally lineages 19 and 12 (iii; lineages 3 and 19 not labeled in this sample). (J) R19B03AD-R18F07DBD marks uniquely NB7-4 and its immortalization marks only lineage 23. (K) 13G03 marks MNB, the only NB in the midline region. Its immortalization marks lineage 0, which express En (red). (L) NB3-3 generates lineage 8. (i) In the embryo, ems-GAL4 marks NB2-2, NB3-3 and NB3-5 unlike Ems antibody, which marks NB3-3, NB4-4 and NB3-5 (see Figure 5—figure supplement 1D). (ii) Immortalization of ems-GAL4 marks lineage 8 (progeny of NB3-3; see also Figure 5J), lineage 10 (progeny of NB2-2; see also B), and lineage 9 (progeny of NB3-5; see also Figure 3F–I). In the bottom panel, lineages are pseudo-colored for easy lineage identification. (iii) In thoracic segments, ems-GAL4 labels NB3-3 (inset) and a few of its progeny. Transverse view of this clone shown in the bottom panel. (iv-v) Lineage clones by eg-GAL4 labels almost the entire lineage of NB3-3 in embryonic thoracic segments including the NB (arrowhead in iv) and Eve+ neurons (arrow in v). Right panels show transverse views of the same clones. (vi) A postembryonic lineage 8 MARCM clone shown in transverse view. Dorsal is up. When viewed in transverse, note the similarity in the morphologies of embryonic NB3-3 clones (iv and v) and postembryonic lineage 8 neurons (vi). (vii) Lineage 8 NB (arrowhead) express Ems (red).
Figure 4—figure supplement 2
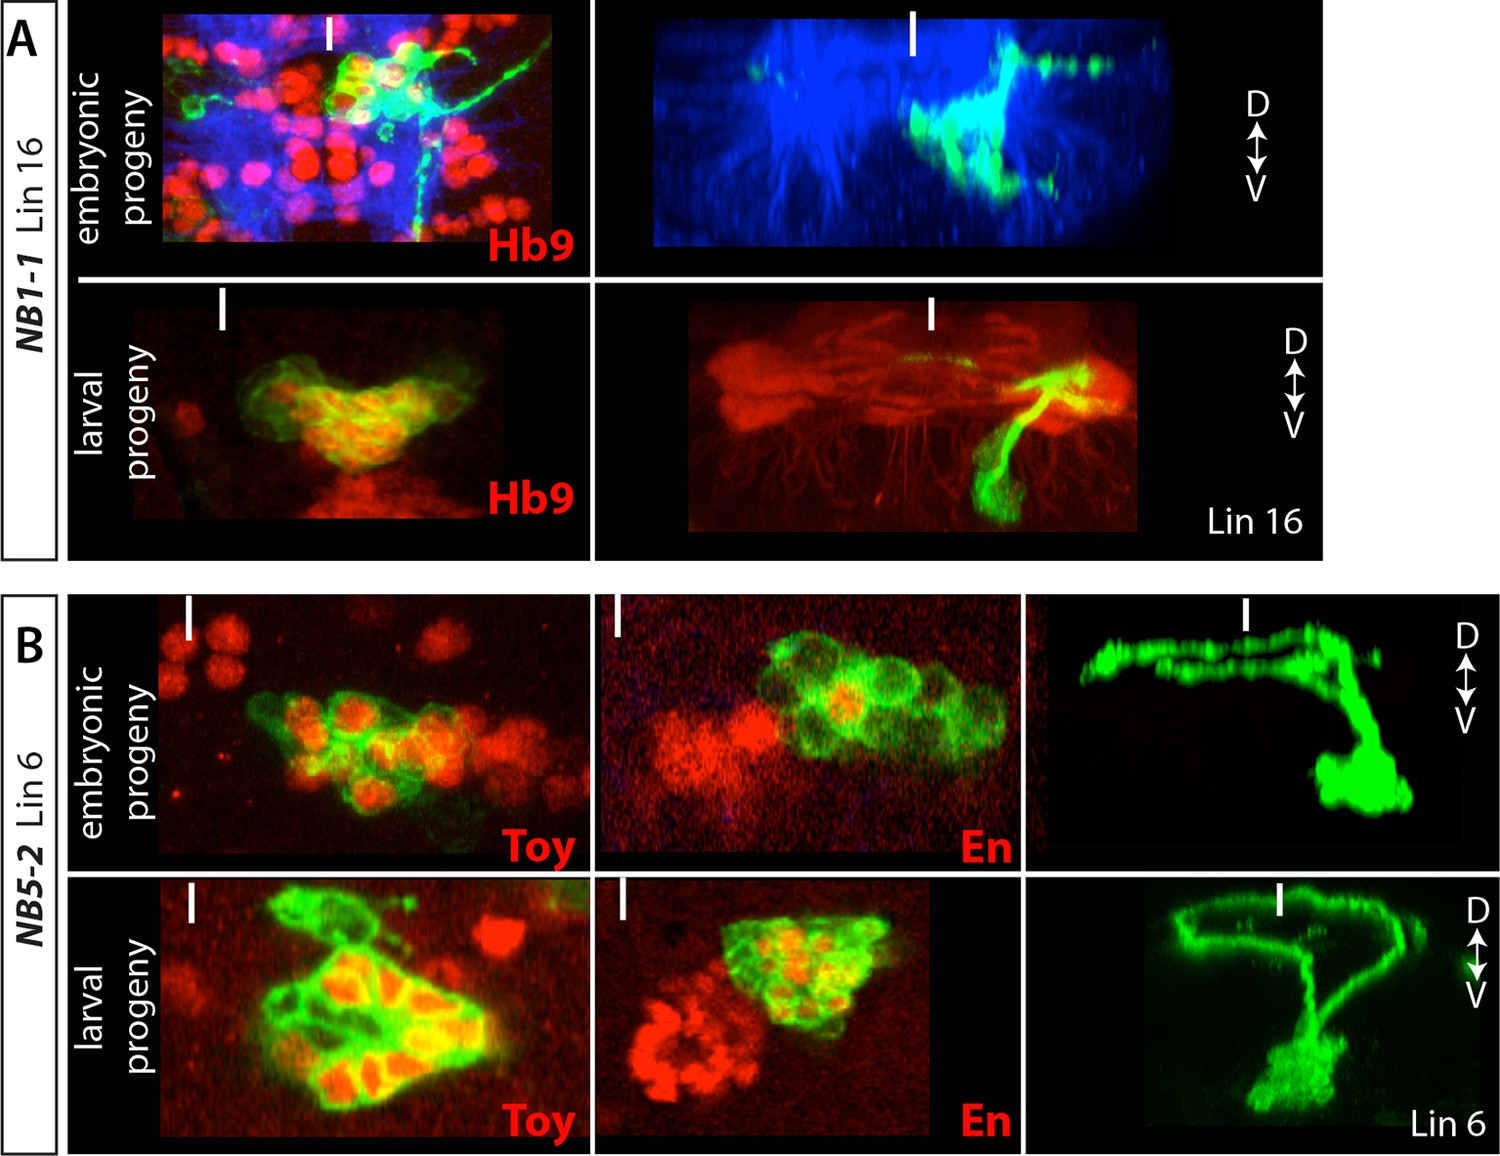
(A) NB1-1 generates lineage 1.
Top panels: A lineage clone generated via R28H10 showing embryonic progeny of NB1-1. Bottom panels: a lineage 16 MARCM clone generated by elav-GAL4. Hb9 (red) is expressed in both neuronal populations and both neuronal populations show similar morphology along the dorso-ventral axis (right panels) (B) NB5-2 generates lineage 6. Top panels: Lineage clones generated via R45D04 showing embryonic progeny of NB5-2. Bottom panels: lineage 6 MARCM clones generated by elav-GAL4. Toy and En (red) are expressed in both embryonic and postembryonic neuronal populations and both neuronal populations show similar morphology along the dorso-ventral axis (right panels).
Figure 4—figure supplement 3
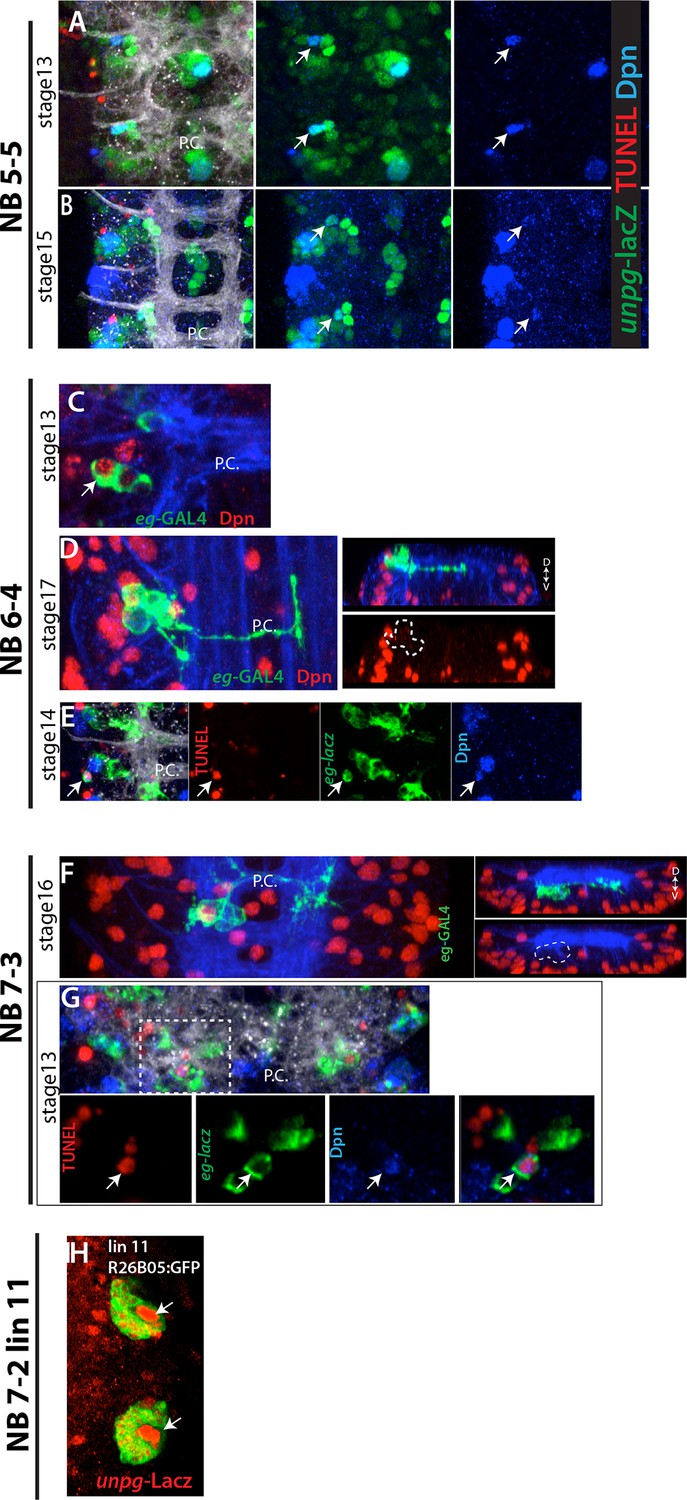
(A-B) NB5-5 disappears in the late stage embryos.
(A) In the stage 13 embryonic nerve cord, unpg-lacZ (green) marks NB5-5 (arrows), which is the most dorsal NB in the nerve cord and isolated from other NBs. (B) In the stage 15 embryonic nerve cord, NB5-5 appears to lose Dpn (blue) expression. No TUNEL activity (red) is detected in NB5-5 (A, B). In the stage 17 embryonic nerve cord, no Dpn+ cell is detected in the region (not shown). (C-E) NB6-4 is eliminated by apoptosis. eg-GAL4 (C-D) or eg-lacZ (E) (green) used to mark NB6-4 lineages. In the stage 17 embryonic nerve cord, NB6-4 lineage clones does not contain Dpn+ NBs (red) (D) whereas stage 13 embryos do (C). TUNEL activity (red) is detected in NB6-4 (arrows) in stage14 embryos (E). (F-G) NB7-3 is eliminated by apoptosis. eg-GAL4(F) or eg-lacZ (G) (green) used to mark NB7-3 lineages. (F) In the stage 16 embryonic nerve cord, NB7-3 lineage clones does not contain Dpn+ NBs (red). (G) TUNEL activity (red) is detected in NB7-3 (arrows) in stage13 embryos. Individual channels from the projection shown in the bottom panel. (H) Lineage 11 NB is labeled by unpg-lacZ. R26B05 was used to mark lineage 11 in the larval CNS (Harris et al., 2015). unplugged, unpg; D-V, dorsal-ventral; A.C., anterior commissure; P.C., posterior commissure.
Figure 5 with 1 supplement
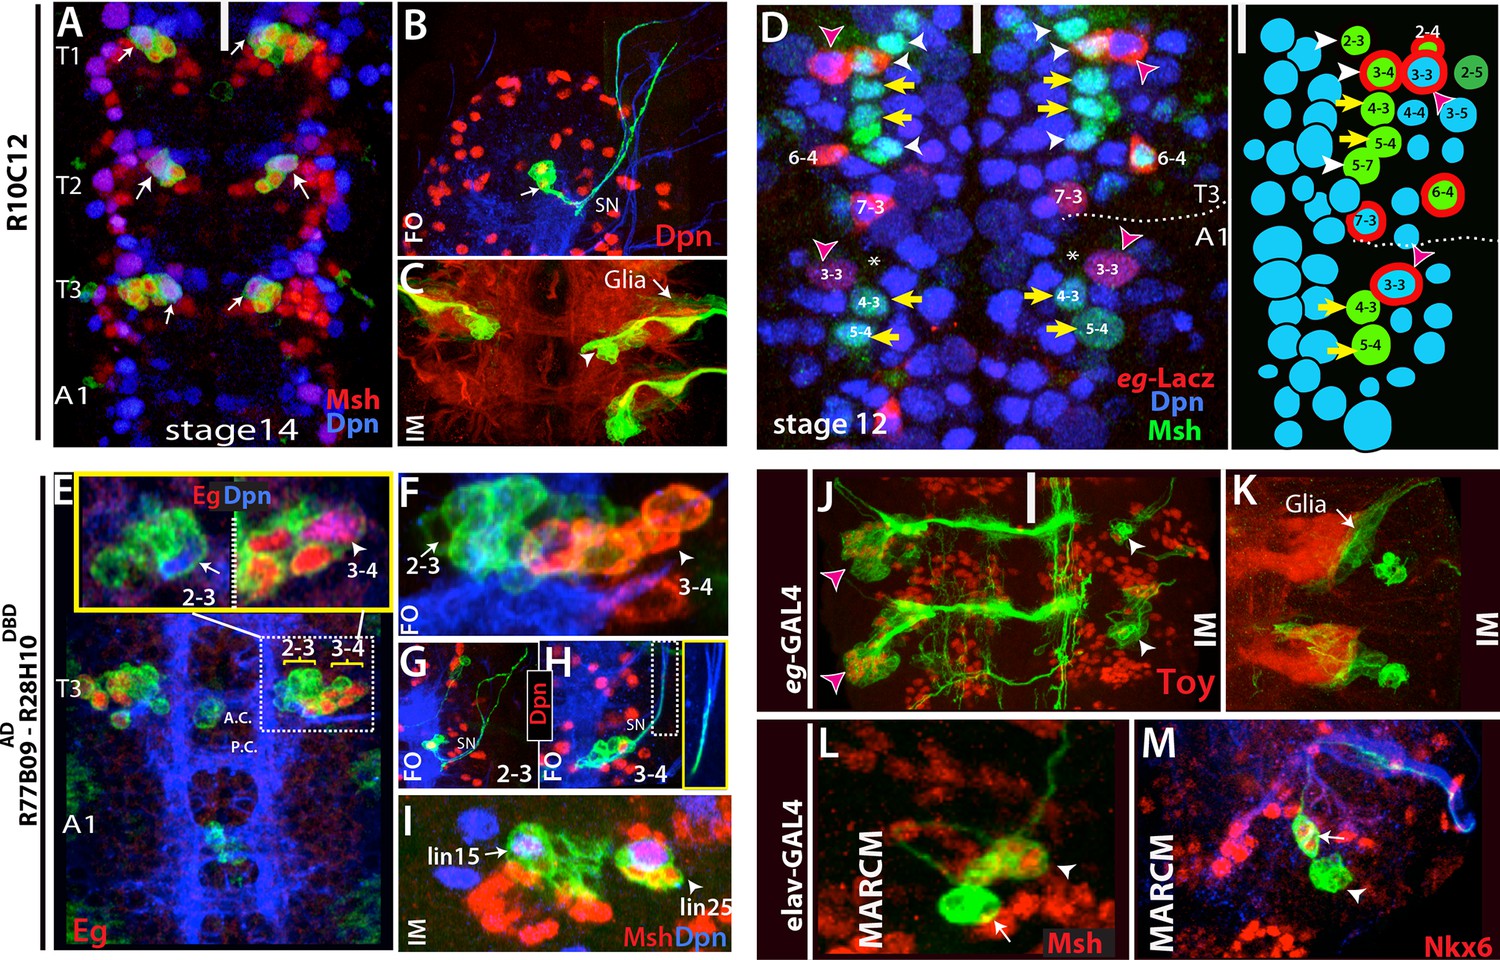
Thoracic-specific NB2-3 and NB3-4 generate lineage 15 and lineage 25, respectively.
(A) R10C12 marks uniquely Msh+ NB2-3 (arrows) in each thoracic hemisegment but not in abdominal ganglia. Dpn, blue; Msh, red (B) A lineage clone containing NB2-3 (arrow) extends only efferent axons, which splits into two bundles after exiting the CNS via the segmental nerve (SN). (C) Immortalization of R10C12 expression in the NB2-3 progeny marks lineage 15, which is composed of motor neurons (arrowhead) and glia (arrow). (D) T3 and A1 segments from a stage 12 embryo shown. eg-lacZ (red) and Msh (green) co-staining reveal differences in NB (blue) pattern of T3 and A1 segments. Schematic representation is shown on the right. Msh marks three thoracic specific NBs (NB2-3, NB3-4, and NB5-7; white arrowheads). NB3-4, which is marked by both eg-lacZ and Msh, resides medial to NB3-3. In abdominal segments, no NB with lacZ and Msh expression is detected medial to NB3-3; note the region immediately medial to NB3-3 does not have any NB (asterisks). (E-I) R77B09AD-R28H10DBD used to identify the postembryonic progeny of NB2-3 and NB3-4. (E-G) Nerve cords from late stage embryos shown. NB3-4 (arrowhead) and its progeny express Eg (red) while NB2-3 (arrow) and its progeny do not. Inset shows the magnified views of NB2-3 (left) and NB3-4 (right) lineages. (F) A lineage clone via R77B09AD-R28H10DBD separates two NB lineages: NB3-4 lineage is marked with red. Progeny of NB3-4 (H) extend axons out of the CNS using the SN route like NB2-3 progeny (G) but do not extend them as far as NB2-3 progeny (see inset H). (I) Nerve cord from a late-stage larva shown. Msh, red; Dpn, blue. Immortalization of R77B09AD-R28H10DBD expression marks lineage 15 (NB2-3 progeny) and lineage 25 (NB3-4 progeny). (J) Immortalization of eg-GAL4 marks Toy expressing lineage 8 (NB3-3 progeny; red arrowheads; see also Figure 4—figure supplement 1L) and lineage 25 (white arrowheads). (K) Lineage 25 contains glial cells (arrow). (L-M) elav-MARCM clones showing lineage 25 have a small cluster of Msh expressing cells (arrowheads) and two Nkx6 expressing motor neurons (arrows). Msh expressing cells reside closely to Msh+ NB3-4, but do not extend any processes (arrowheads in L and M). Note glial cells in lineage 25 are not visible in MARCM clones since elav-GAL4 does not mark glial cells. White bar indicates the midline. FO, flip-out lineage clone; IM, immortalization; A.C., anterior commissure; P.C., posterior commissure; white bar, midline.
Figure 5—figure supplement 1
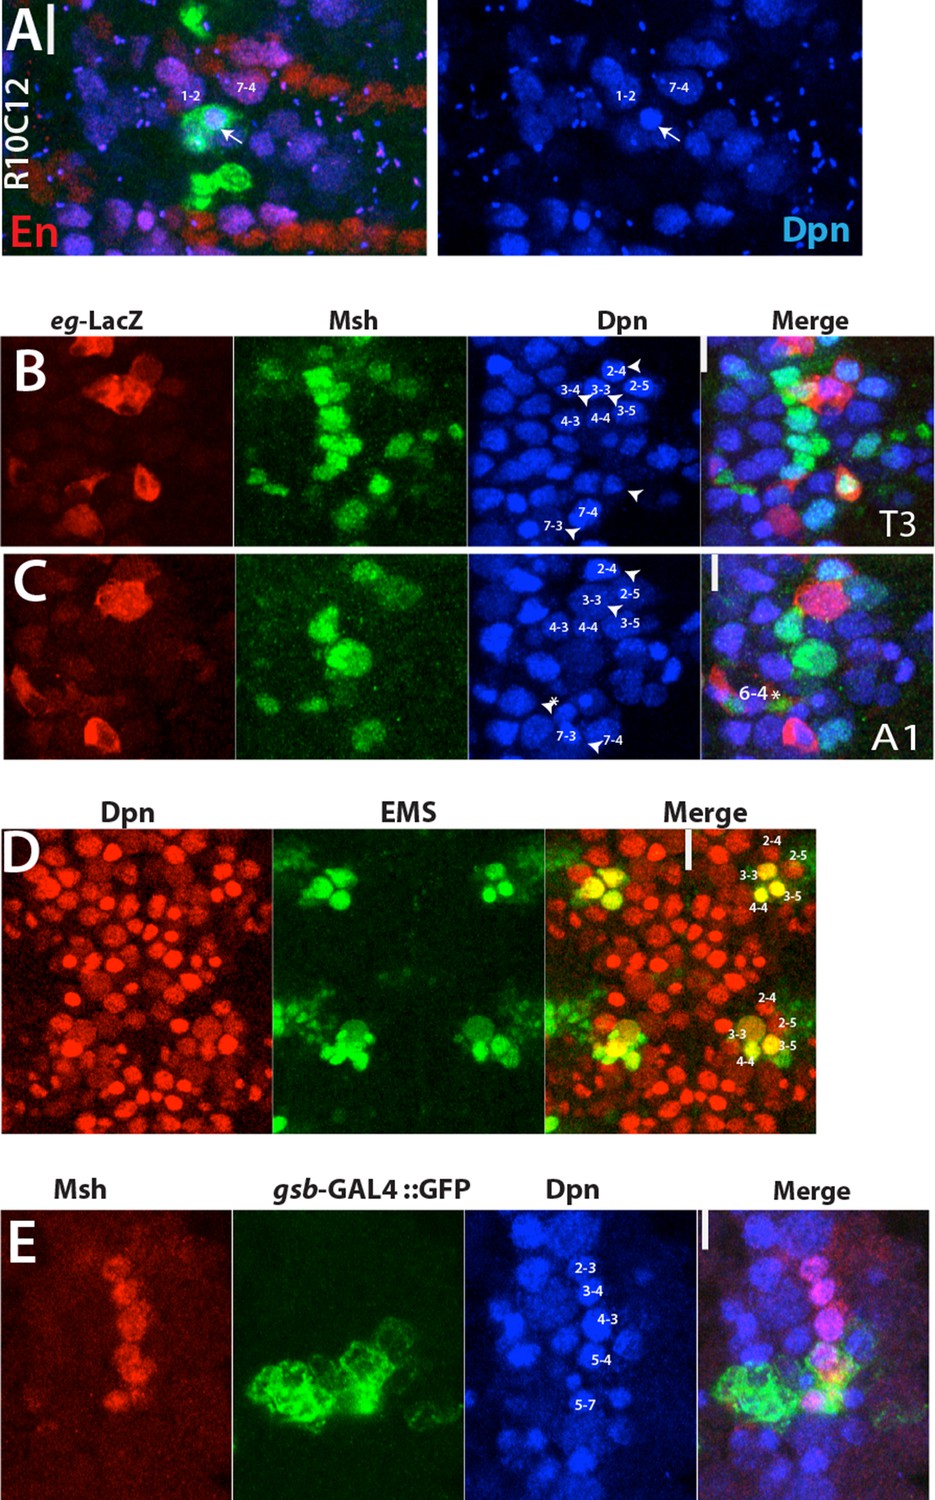
(A) Stage 12 embryonic nerve cord; Engrailed (En; red) marks row 6 and 7 NBs as well as NB1-2.
R10C12 marked NB (arrows) is located immediately posterior and lateral to NB1-2. (B-C) Individual channels for T3 (A) and A1 (B) segments of the nerve cord shown in Figure 4D. These projections include all the NBs. NB marked by eg-lacZ are indicated by arrowheads. Note NB6-4 assume glioblast fate in the abdominal segments (asterisk). eg-lacZ, red; Msh, green; Dpn. Blue. (D) Projection of all NBs (red) in two abdominal segments from a wild-type stage 12 embryo shown. Ems (green) marks NB3-3, 3–5, and 4–4. Only two NBs (NB2-4 and 2–5) reside anterior to NB3-5 in the close proximity. (E) A thoracic segment from stage 12 embryo shown. gsb-GAL4 driven GFP marks two Msh+ NB. Note Msh+ NB6-4 is located dorsally and not visible in this projection.
Figure 6 with 1 supplement
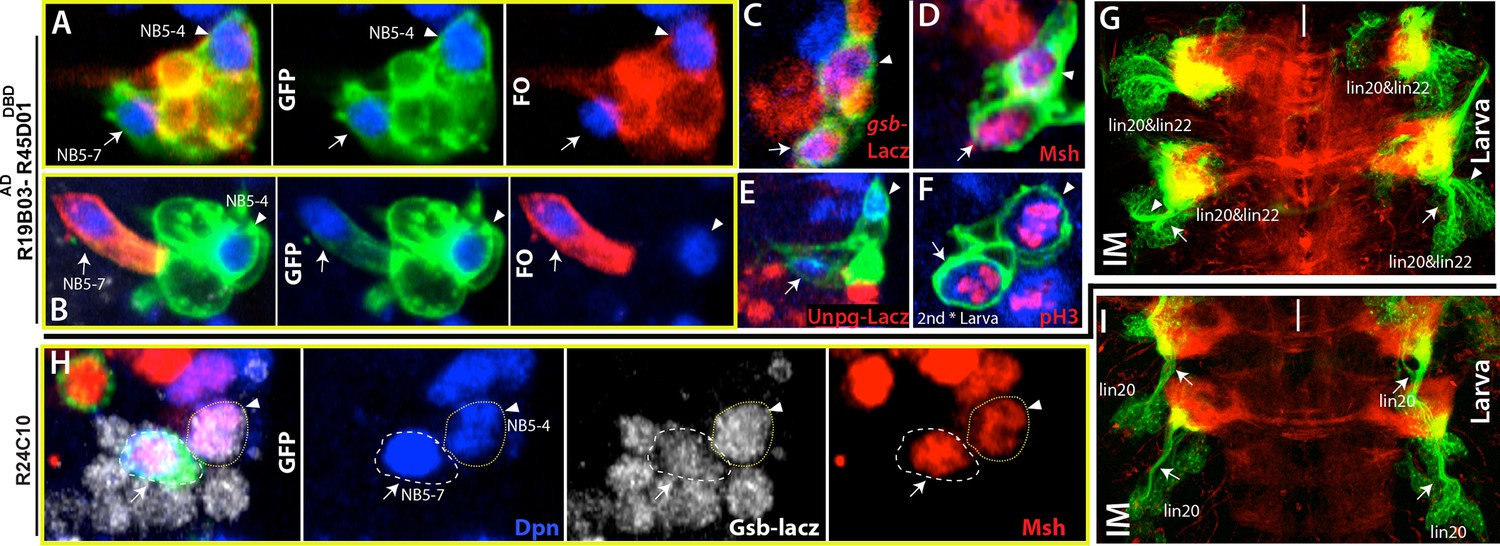
NB5-4 and NB5-7, a novel NB, generate almost identical lineages, lineage 22 and 20, respectively.
(A, F) R19B03AD-R45D04DBD marks two adjacent NB in the embryonic (A-E) and the larval CNS (F). Hemisegments on the right of the midline are shown. (A-B) GFP (green) shows complete GAL4 expression pattern; lineage clones are in red. (A) NB5-4 (arrowheads) resides usually anterior and lateral to the other NB (arrows) and contains several motor neurons in its progeny (red clone). (B) The other NB (arrow), named NB5-7, does not have any progeny (red cell) during embryogenesis. (C-E) Molecular characterization of NB5-4 and NB5-7: gsb-lacZ (C) and Msh (D) co-label both NBs and unpg-lacZ, which marks NB5-5 dorsally (not shown), spares both NBs. (F) pH3, a mitotic marker, labels both NBs in the second instar larva. (G) Immortalization of R719B03AD-R45D04DBD marks lineage 20 and lineage 22 as postembryonic progeny of these NBs. Arrow and arrowheads indicate two separate bundles coming from two different lineages. (H) R24C10 marks medially located NB5-7 (arrows) but not NB5-4 (arrowhead). gsb-lacz (gray) and Msh (red) co-expression labels both NBs (G) Immortalization of R24C10 expression in NB5-7 progeny visualizes lineage 20, which extends a single bundle (arrows).
Figure 6—figure supplement 1
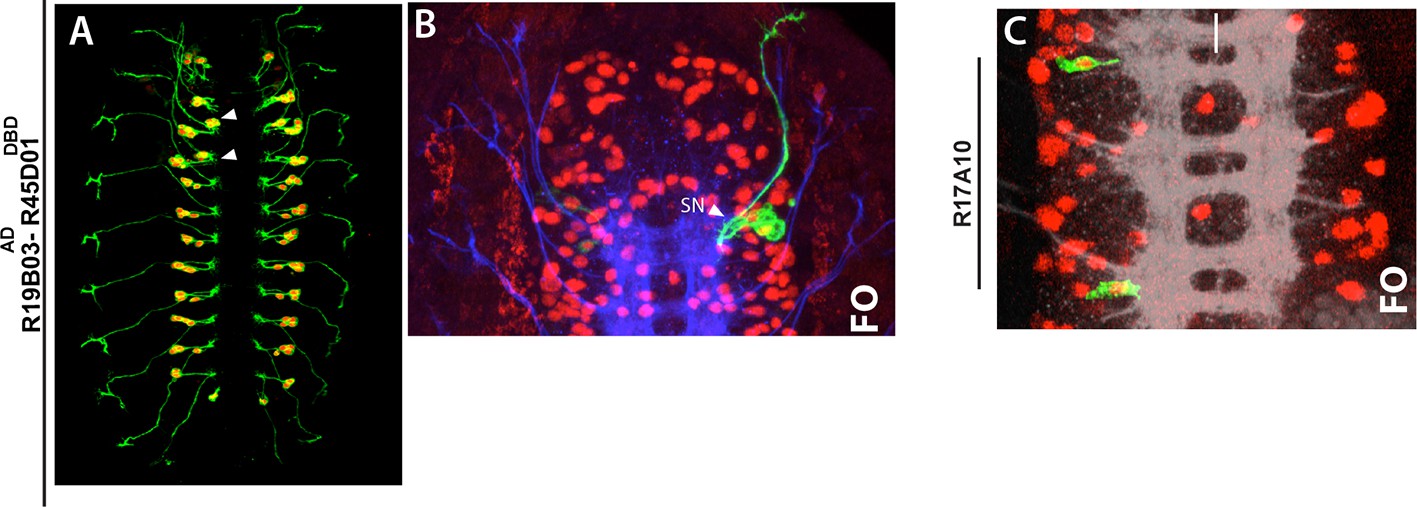
(A-C) Late stage embryos shown.
(A) Expression pattern of R719B03AD-R45D04DBD whole mount-embryo. Green, mcd8-GFP; red, nls-tdTomato. (B) A NB5-4 lineage clone, which was generated with R719B03AD-R45D04DBD in a thoracic segment, exits the CNS via SN route. (C) Two separate lineage clones (generated via R17A10) in T1 and T3 segments contains only NB5-7 without any progeny.
Figure 7 with 1 supplement
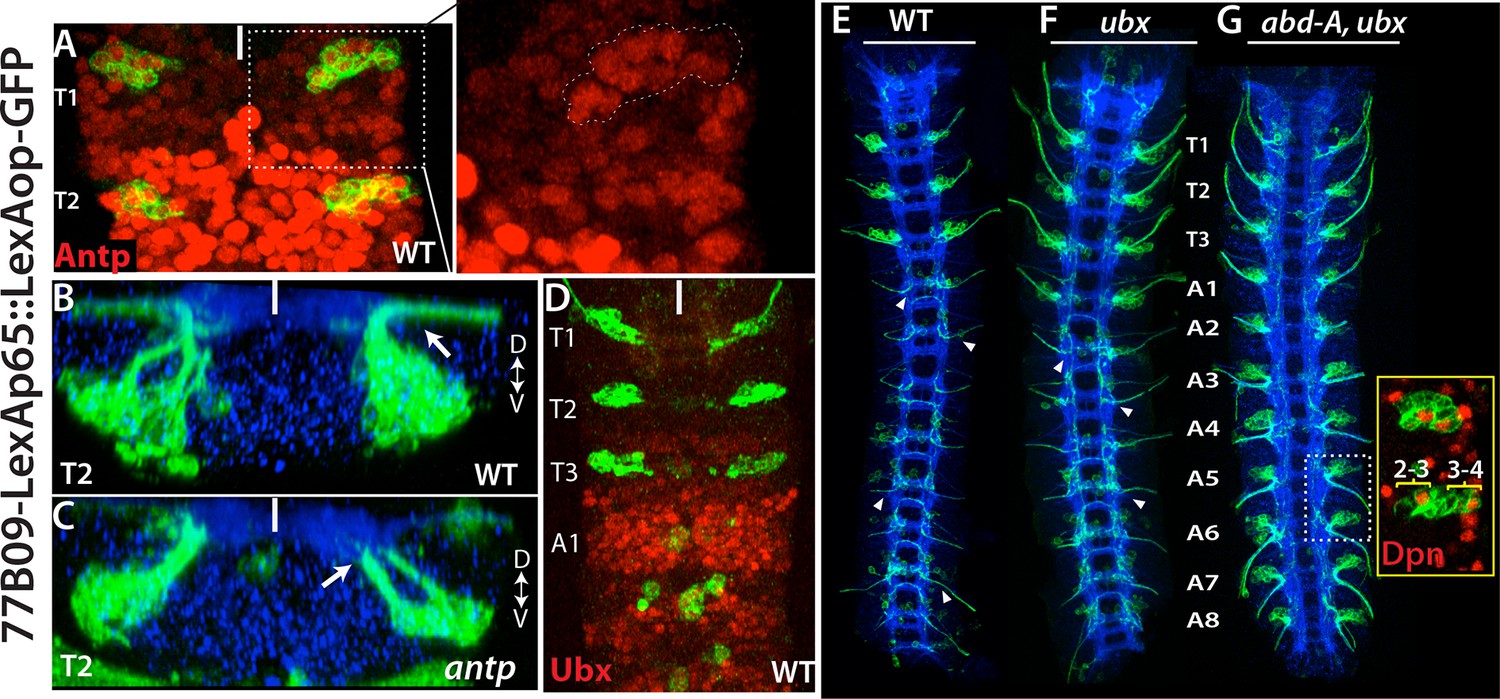
Hox genes restrict NB2-3 and NB3-4 lineages to the thoracic segments.
(A-G) 77B09-lexAp65 driven GFP marks NB2-3 and NB3-4 lineages in wild type embryos (A, B, D and E) and embryos mutant for antp (C), ubx (F), and double mutant for abd-A and ubx (G). All embryos are at stage 16. (A) Antp expression (red) is significantly higher in T2-T3 segments than T1 segments (only T1 and T2 segments shown). (Inset) in the T1 segment, NB2-3 and NB3-4 progeny (outlined by dashed lines) express Antp at higher levels compared to other lineages. (B-C) Transverse view of the T2 segment showing that axons of NB2-3 and NB3-4 progeny exit the CNS in a wild type embryo (B) but fail to do so in an antp mutant embryo (C). (D) Highest Ubx expression (red) in a wild type embryo is detected around the A1 segments and thoracic segments virtually lack Ubx expression. (F-G) whole nerve cords from embryos with indicated genotypes shown. (E) 77B09-lexAp65 marks thoracic specific NB2-3 and NB3-4 lineages and in the abdominal segments it marks neurons of NB2-1 and NB7-3. Note also axons of sensory neurons entering the nerve cord in all abdominal segments (some marked by arrowheads) and these axons are thinner compared to exiting motor axons in the thoracic segments. (F) In embryos that are mutant for ubx, ectopic NB2-3 and NB3-4 lineages form in the A1 segment. (G) In embryos that are double mutant for ubx and abd-A, ectopic NB2-3 and NB3-4 lineages form in all abdominal segments except the terminal segment. Inset shows a magnified view of hemisegments of A5-A6 where Dpn (red) marks ectopic NB2-3 and NB3-4. WT, wild type; White bar, midline.
Figure 7—figure supplement 1
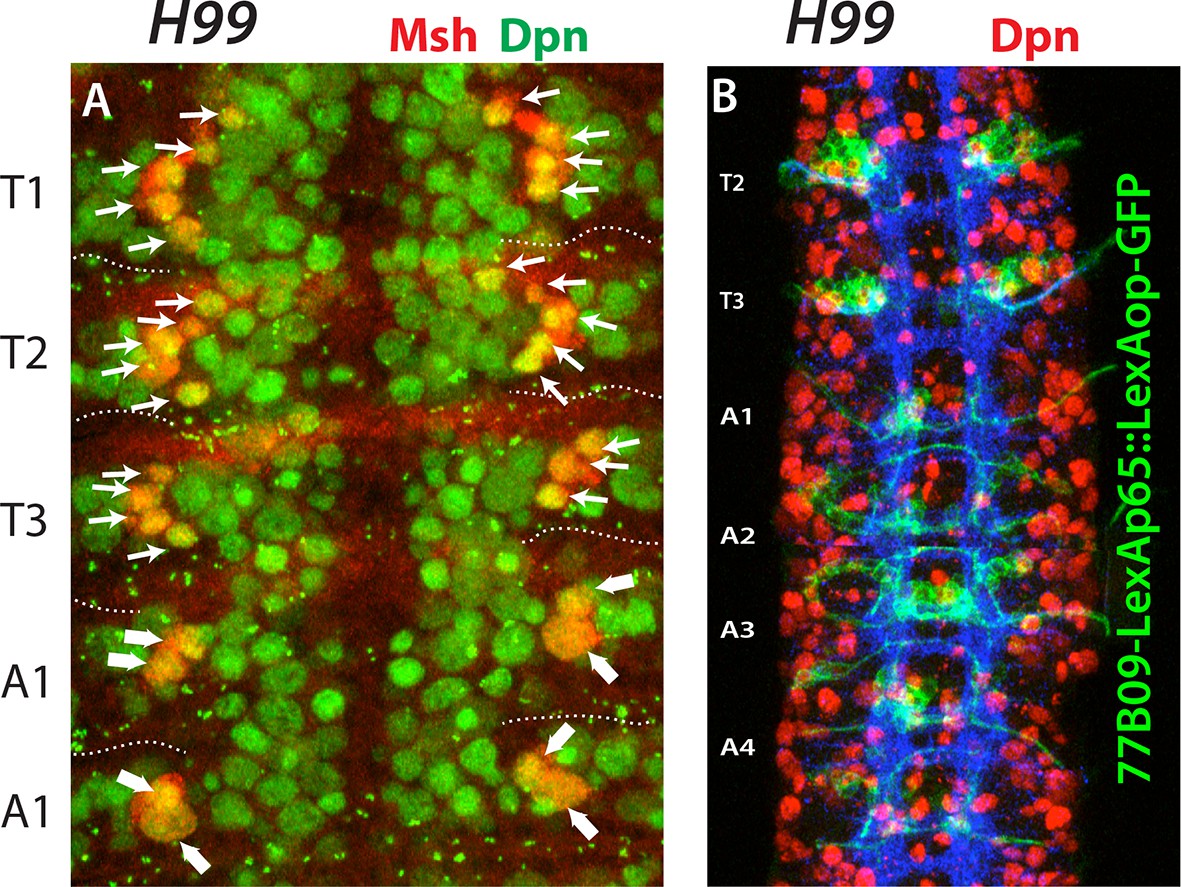
Apoptosis is not responsible for the lack of NB2-3, NB3-4 and NB 5–7 in the abdominal segments.
Nerve cords from H99 mutant embryos at stage 12 (A) and stage 16 (B). (A) Blocking apoptosis does not introduce new Msh+ NBs in the abdominal segments (compare to Figure 4D). No additional NBs are visible in the vicinity of NB4-3 and NB5-4 (thick arrows) in the abdominal segments. (B) 77B09-lexAp65 marked NB2-3 and NB3-4 lineages do not form in the abdominal segments.
Figure 8
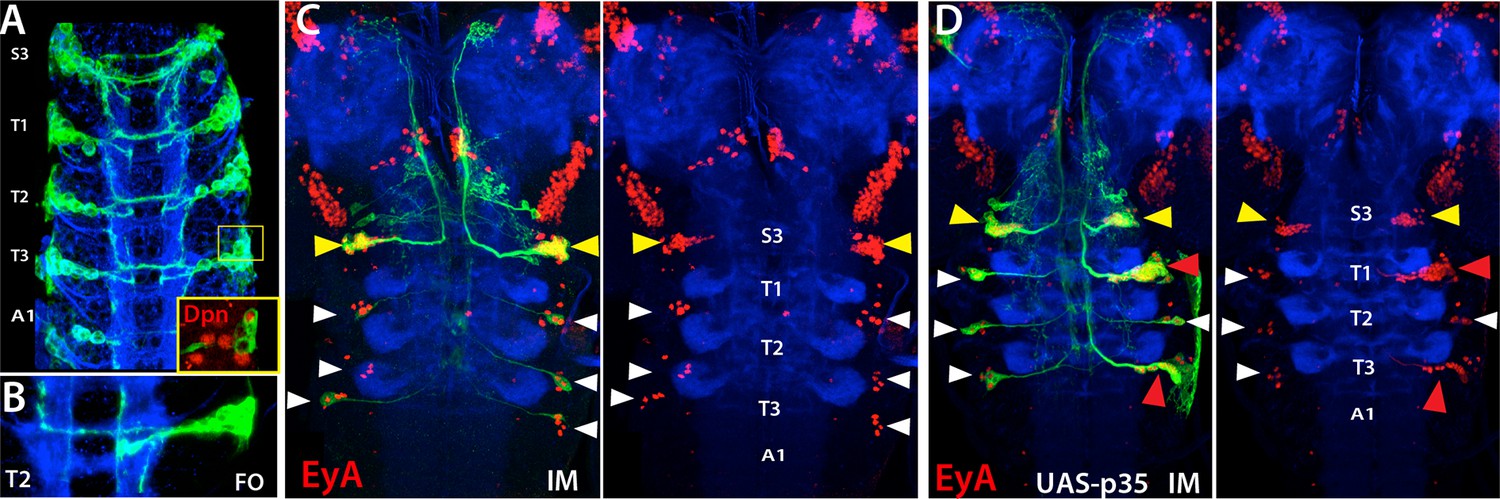
NB5-6 generates postembryonic progeny only in the S3 segments.
Expression of lbe-K-Gal4 in the embryonic nerve cord (A-B) and immortalization of its expression in NB5-6 progeny with (C) or without p35 in the larval CNS (B). (A) S3-A1 segments of stage 16 embryos showing lbe-K-Gal4 driven GFP expression, which specifically marks Dpn+ NB5-6 (red in inset) and its progeny. (B) NB5-6 lineage clone from a stage 17 embryo extend axons in several different directions. (C) Immortalization of lbe-K-Gal4 expression marks NB5-6 postembryonic lineage (yellow arrowhead) in S3 segments and late-born embryonic neurons (white arrowhead) of NB5-6 in thoracic segments; NB5-6 does not generate a postembryonic lineage in thoracic segments. (D) When apoptosis is blocked by p35 misexpression, NB5-6 generates ectopic postembryonic progeny (red arrowheads). Both endogenous S3 and ectopic thoracic postembryonic progeny of NB5-6 express EyA (red) and extend axons in a similar manner to EyA+ neurons that are born in the embryonic “Cas” window of NB5-6 (Baumgardt et al., 2009; white arrowheads). HRP (blue) in embryos (A, B) and Phalloidin (Red) in larvae (C, D) visualize neuronal architecture. FO, flip-out lineage clone; IM, Immortalization.
Figure 9
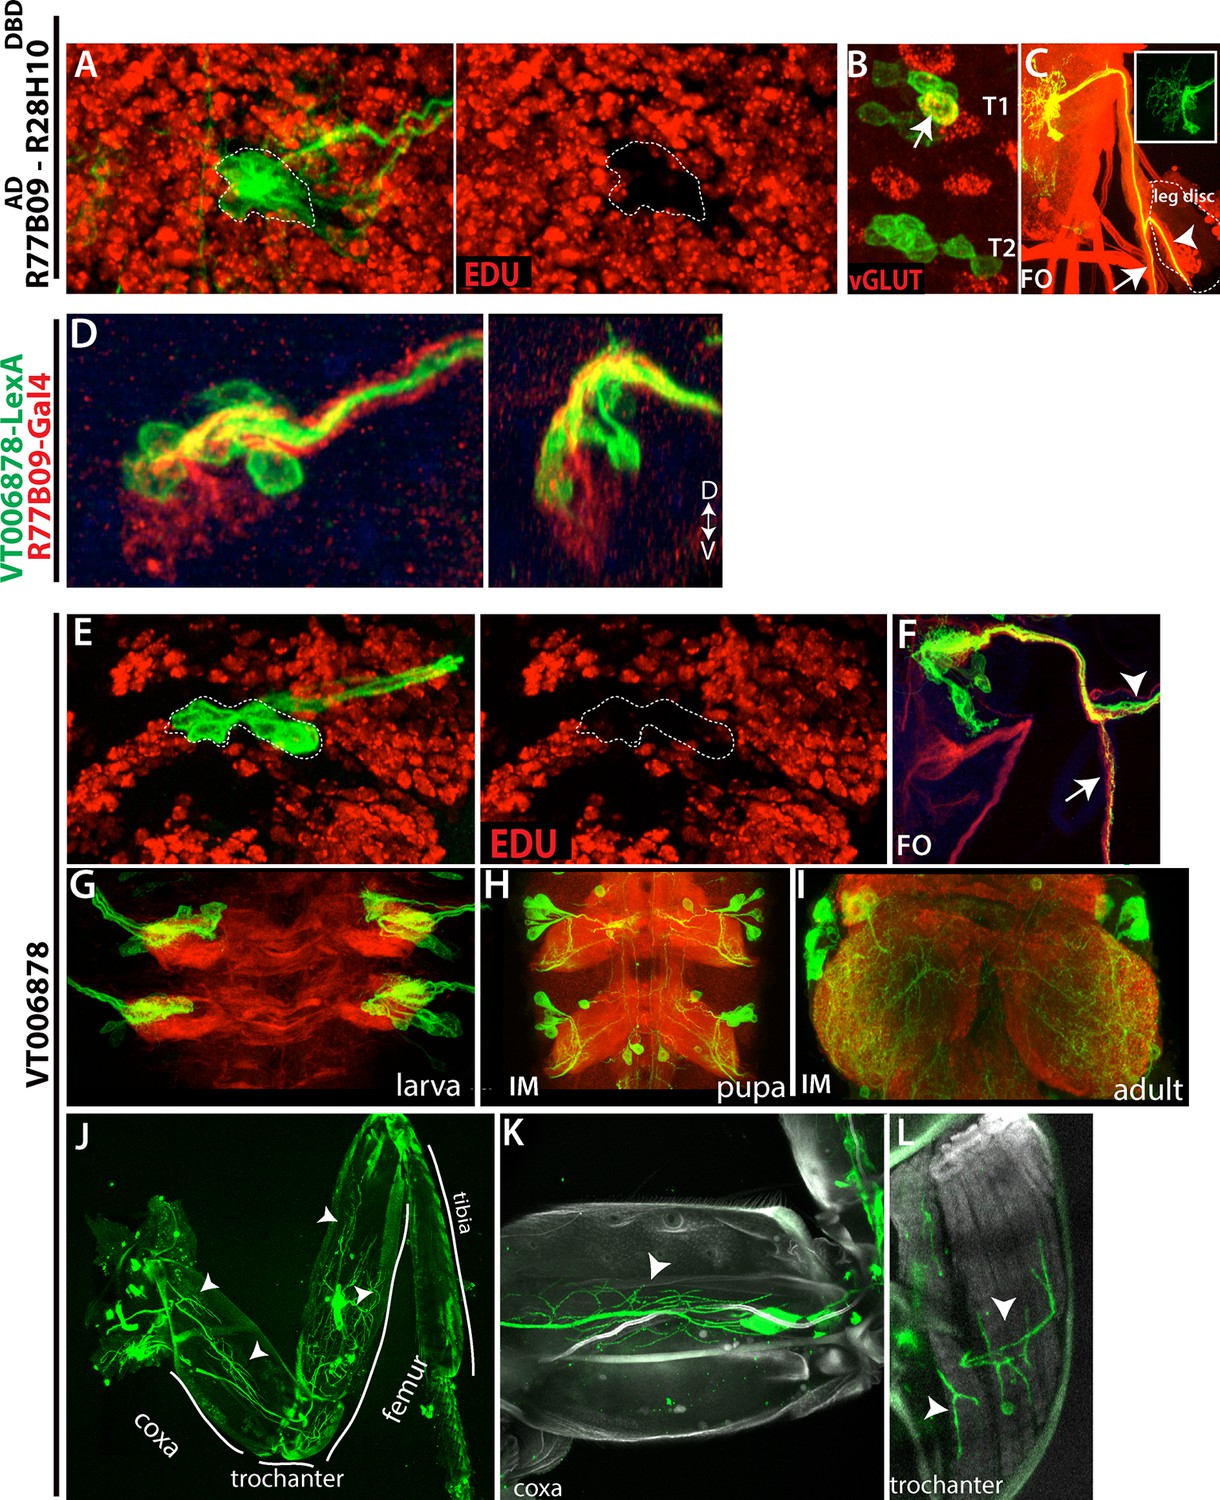
Embryonic progeny of NB2-3 are developmentally arrested during larval life, but differentiate during metamorphosis to be leg motor neurons.
(A, E) R77B09AD-R28H10DBD (A) and VT006878 (E) expression in T2 hemisegments from a late stage larva shown. EDU (red) labels all of the postembryonic neurons but not NB2-3 progeny (outlined with dashed lines); hence outlined cells are born embryonically. (B) None of these embryonic-born cells marked by R77B09AD-R28H10DBD express vGLUT (indicator of mature motor neurons) with the exception of a motor neuron in the T1 segment (arrow). VT006878 marked neurons do not express vGLUT either (not shown). (D) R77B09 (red) and VT006878-LexA (green) mark ventral and dorsal embryonic progeny of NB2-3, respectively. Transverse view shown on the right; dorsal up. (C, E) T2 lineage clones, which are generated via R77B09AD-R28H10DBD(C) and VT006878 (E) are induced in an early embryo and visualized in the late-stage larva. Like in the embryo (see Figure 5), axons of NB2-3 embryonic progeny split into two bundles after exiting the CNS. One of these bundles extends toward the leg disc (arrowheads). (E) VT006878 expression in T2-T3 segments in the larval CNS. (H-L) Immortalization of VT006878 expression visualizes these neurons in the pupal (H) and adult nerve cord (I) and innervation pattern of their axons in the adult leg (J-L). (J) VT006878 marked neurons innervate muscles in the coxa, trochanter, and femur parts of the leg but not the tibia. High magnification views from coxa (K) and trochanter (L).
Figure 10 with 1 supplement
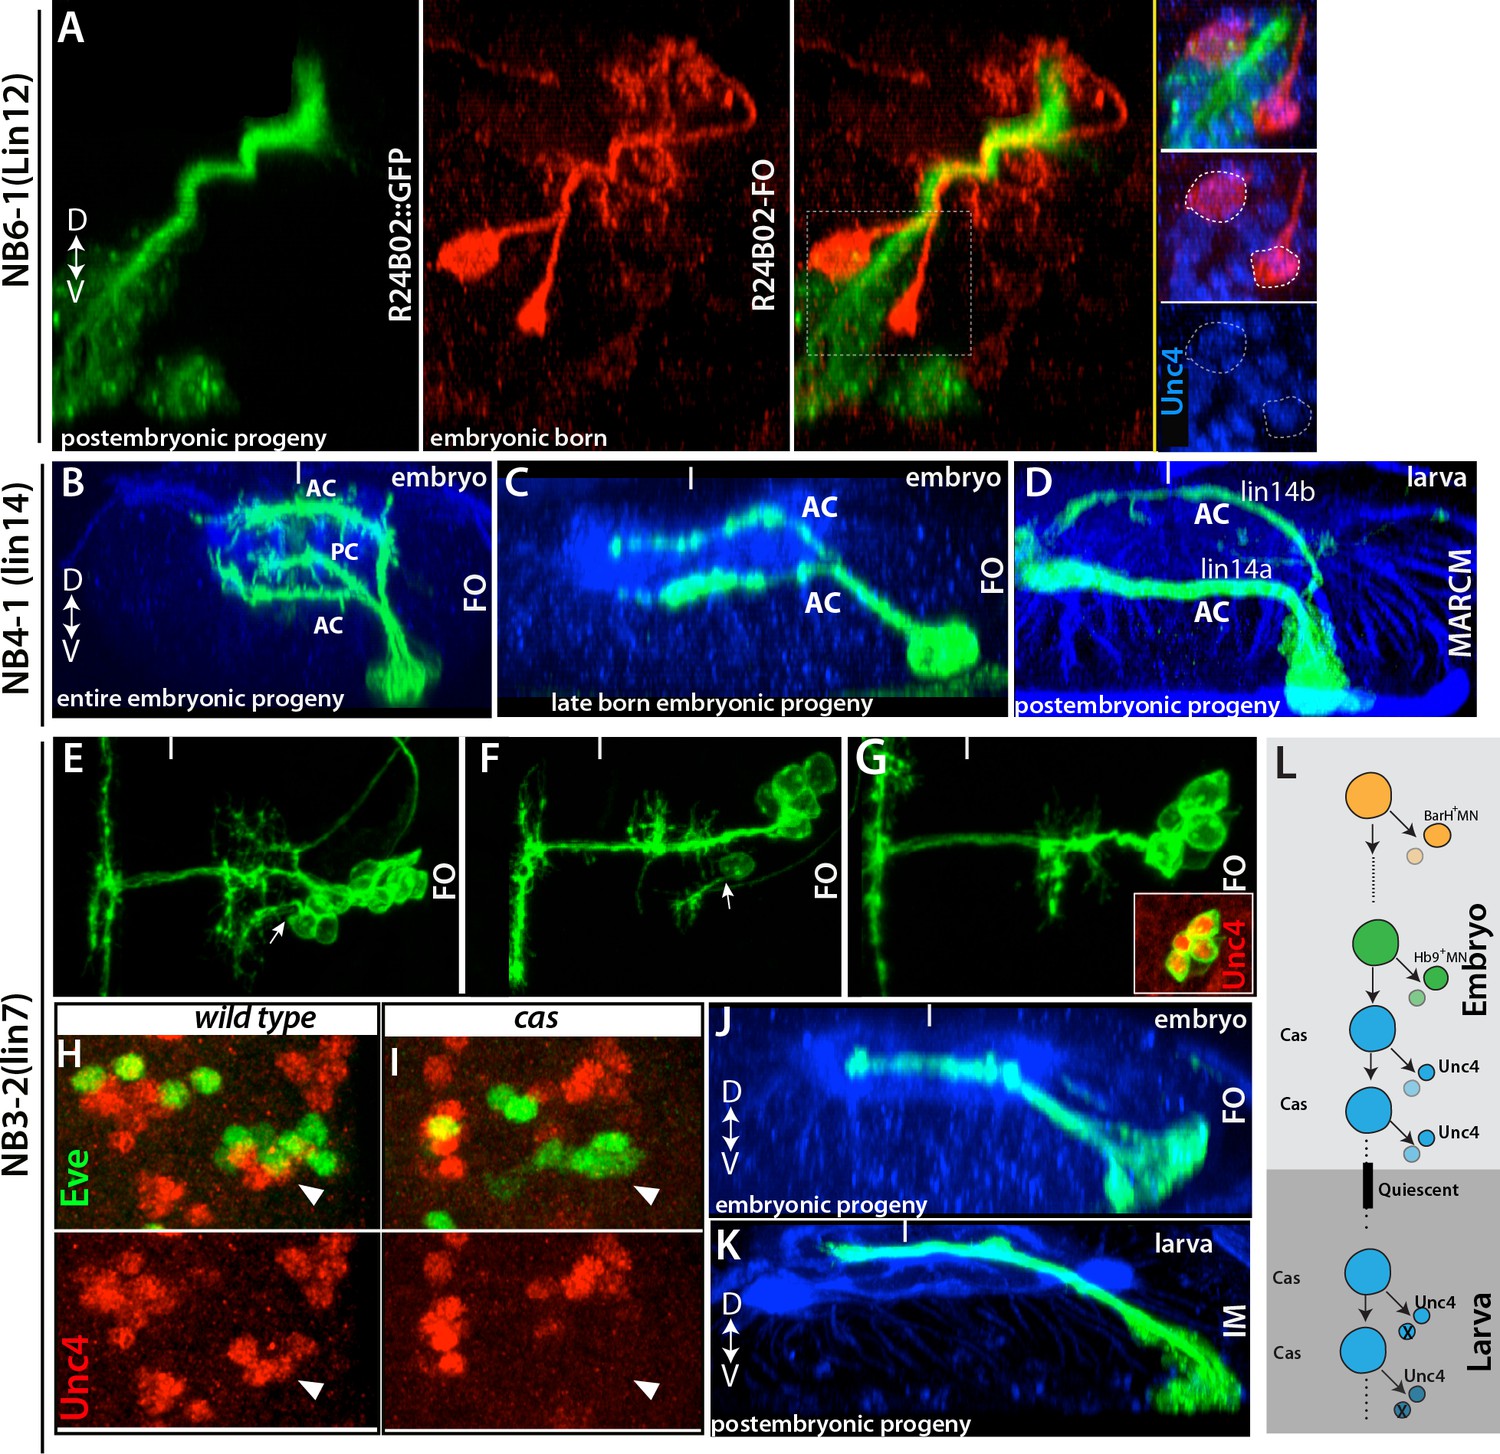
Late-born embryonic neurons and postembryonic neurons show significant similarities.
(A) A transverse view of the larval thoracic nerve cord. R24B02 driven GFP is in green; flip-out clones, which are induced in the embryo via R24B02, are in red. Within the NB6-1 lineage, mature axons of the embryonic-born neurons (red cells) bundle with the immature axons of the larval-born neurons (lineage 12A neurons; green cells). Both embryonic and postembryonic-born neurons express Unc-4 (blue; inset). Note that the reporter driven via flip-out shows stronger signal than R24B02 driven GFP; thus, it visualizes embryonic progeny of NB6-1. (B, C) Transverse views from stage 17 embryos shown. R78A08 used to generate embryonic NB4-1 lineage clones. (B) An early-induced lineage clone showing the entire embryonic progeny of NB4-1. (C) Late induced lineage clone showing late-born embryonic progeny of NB4-1. (D) A MARCM clone from a larva showing that postembryonic progeny of NB4-1 extend their axons contralaterally in the ventral anterior commissure (lineage 14A) or dorsal anterior commissure (lineage 14B) in a similar manner to late born embryonic neurons in the lineage. (E-G) Nerve cords from stage 17 embryos shown. R21E09 used to generate embryonic NB3-2 lineage clones, which were induced at different time points (E, earliest; G, latest). (E-F) Earlier induced clones contain motor neurons (arrows). (G) The late induced clone contains only interneurons, which express Unc-4 (inset) and extend contralateral axons. (H-I) A single thoracic hemisegment from wild-type (H) and cas mutant (I) embryos shown. Both embryos are at stage17. (H) Unc-4 + neurons of NB3-2 (red) reside adjacent to Eve+ NB3-3 neurons (green). (I) In a cas mutant embryo, Unc-4+ neurons of NB3-2 are not detected. (J-K) Transverse views of embryonic and postembryonic progeny of NB3-2 shown. Late-born Unc-4+ embryonic neurons in the embryonic CNS (J) and Unc-4+ postembryonic neurons in the larval CNS (K) use the same route to cross the midline, anterior intermediate commissure. (E-G, J); immortalization of R21E09AD-R16H11DBD marks lineage 7 (K). (L) Schematic representation of NB3-2 neurogenesis from embryonic to larval stages. NB3-2 generates motor neurons and presumably sibling interneurons in early cell divisions. NB3-2 later produces Unc-4+ contralateral interneurons in the Cas window. At the end of embryogenesis, it enters quiescent state. At the beginning of second larval stage, NB3-2 resumes cell division and generates more Unc-4+ contralateral interneurons in the Cas window. FO, lineage clone; IM, immortalization. Dorsal is up for images showing transverse views; for the rest anterior is up. HRP (blue) visualizes embryonic neuronal architecture (A, C, and J). BP104 (blue; D) and Phalloidin (blue; K) visualize larval neuronal architecture. FO, flip-out lineage clone; IM, Immortalization; White bars mark the midline.
Figure 10—figure supplement 1
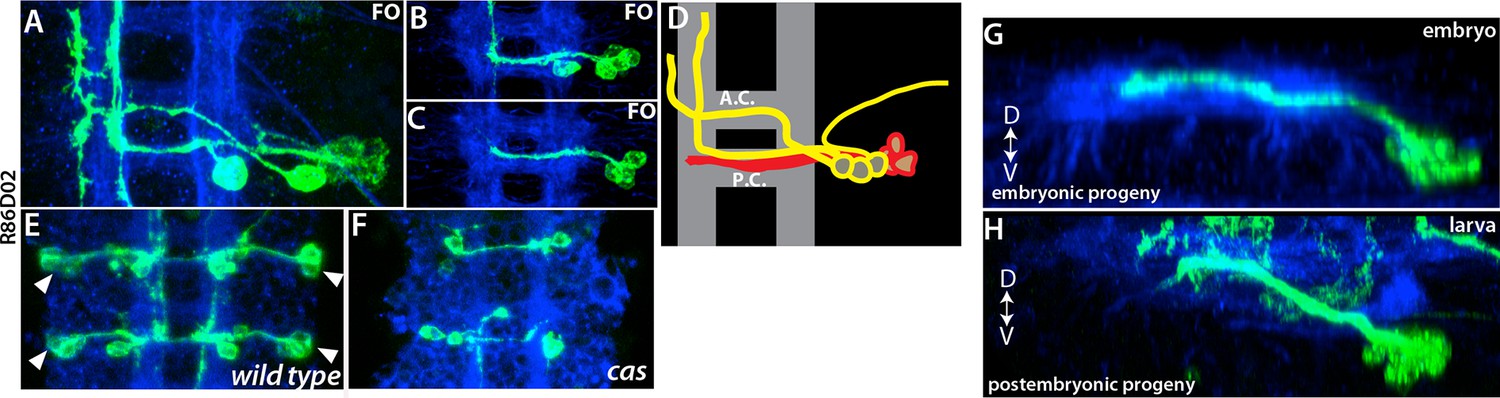
(A-C) NB5-3 lineage clones, which were induced at different time points (A, earliest; C, latest).
All embryos at stage 17. Clones generated with R86D02. Late born neurons extend contralateral axons locally. (D) Birth order in NB5-3 lineage is shown in a color code. Red cells are born last. (E-F) NB5-3 embryonic progeny from stage 17 wild type (E) and cas mutant (F) embryos. Late-born neurons disappear in the cas mutant. (G-H) embryonic (G) and postembryonic (H) progeny of NB5-3 use intermediate posterior neuropil to cross the midline. Immortalization of R54B10 marks lineage 5 (H).
Figure 11
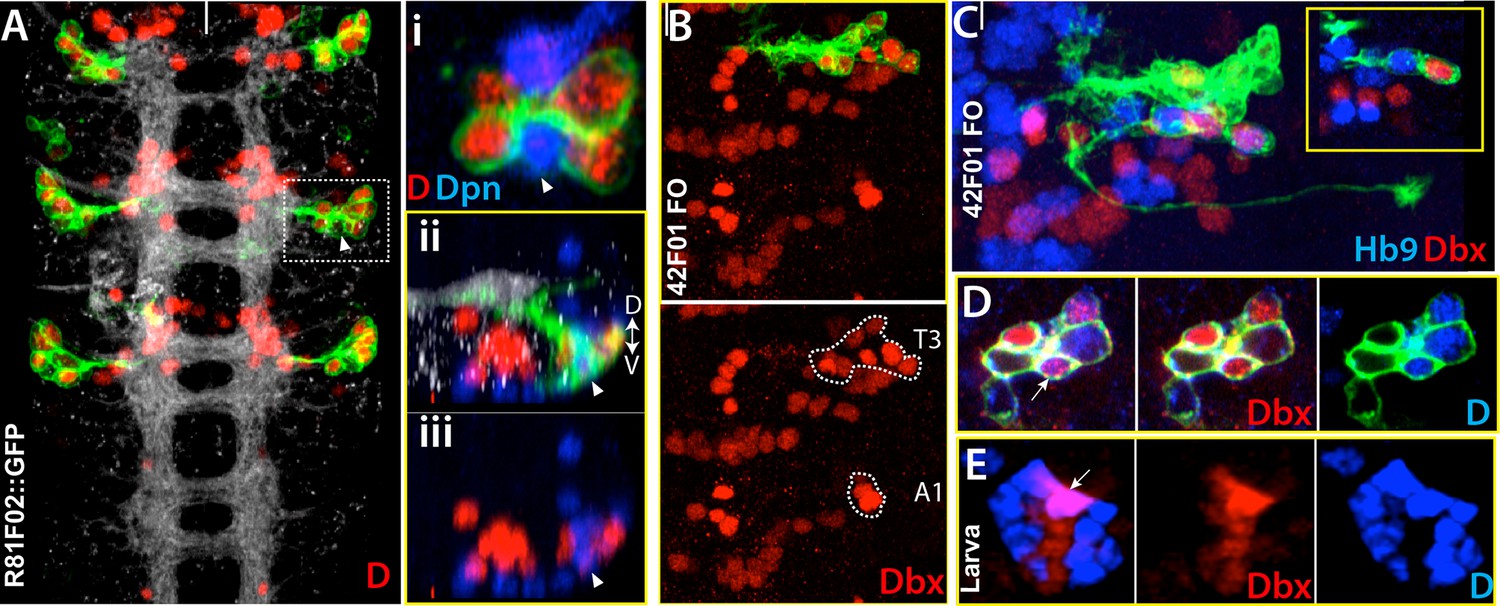
Dicheaete and Dbx marks both embryonic ands postembryonic NB4-2 progeny.
Nerve cord images from the embryo (A-D) and larva (E). (A) R81F02 drives reporter expression only in thoracic segments. R81F02 marks D+ neurons (red) of NB4-2; abdominal segments do not have these D+ cells. (i) A single confocal section from the outlined region. D+ cells reside adjacent to its stem cell, NB4-2 (arrowhead). (ii, iii) A transverse view of the same region. The NB and D+ cells are on the ventral surface of the nerve cord. (B-D) NB4-2 lineage clones in the thoracic embryonic nerve cord. R42F01 used to generate the clones (B) Dashed lines outline Dbx+ cells of NB4-2 lineage in T3 and A1 segments. Like D+ cells, some of these Dbx+ cells are present only in thoracic segments. (C) Hb9+ motor neurons are adjacent to Dbx+ neurons. (D-E) Dbx (red) and D (blue) are expressed in NB4-2 embryonic progeny (D) and postembryonic progeny, lineage 13 (E). FO, flip-out lineage clone. White bars mark the midline. Anterior is up. Dorsal is up in transverse view.
Tables
Table 1
GAL4 lines used to mark NBs and for reporter immortalization.
| Line | NB expression | Immortalization* | Figure |
|---|---|---|---|
| R16A05AD-R28H10DBD | NB1-2 | lin1 (30/30) | Figure 2, Figure 4 |
| R70D06AD-R28H10DBD | NB2-1 | lin 2 (18/ 30), lin10 (7/ 30) | Figure 2, Figure 4—figure supplement 1 |
| R19H09AD-R28H10DBD | NB2-2 | lin10 (16/30), lin7 (4/30) | Figure 4—figure supplement 1 |
| R10C12 | NB2-3 | lin15 (30/30), lin25(7/30) | Figure 5 |
| R65G02 | NB2-4 | lin 18 (21/30), lin20-22 (9/30), lin5 (5/30) | Figure 3 |
| 5172J-Gal4 | NB3-1 | lin4 (12/18) | Figure 4—figure supplement 1 |
| R21E09AD-R16H11DBD | NB3-2, | lin7 (18/24), | Figure 4, Figure 4—figure supplement 1 |
| R21E09AD-R28H10DBD | NB1-2, | lin1 (15/24), | |
| ems-Gal4 | NB2-2, , | lin10(10/30), , | Figure 3, Figure 4—figure supplement 1 |
| R59E09 | NB3-5 | lin9 (30/30) | Figure 2, Figure 3 |
| R77B09AD-R28H10DBD | NB2-3, , | lin15 (30/30), ; | Figure 1, Figure 4 |
| VT0048571 | NB4-1, | lin14 (34/36), | Figure 4—figure supplement 1 |
| R81C12AD-R42F01DBD | NB4-2 | Lin13 (30/30) | Figure 2, Figure 4 |
| R19B03AD-R16H11DBD | NB4-3, , | lin21 (30/30), , , | Figure 2, Figure 4—figure supplement 1 |
| VT0041296 | NB4-4 | Lin24 (20/24); lin18 (5/18) | Figure 4—figure supplement 1 |
| R54B10 | NB5-3, NB5-6 | lin5 (17/30) | Figure 4—figure supplement 1 |
| R19B03AD-R45D04DBD | NB5-4, , | lin20 (30/30), , | Figure 2, Figure 6 |
| R24C10 | NB5-7 | lin20 (23/30), lin18(6/24) | Figure 6 |
| R81F01 | NB6-1 | lin12 (13/30), lin18 (5/30) | |
| R70D06AD-R42F01DBD | NB6-1 | lin12 (12/24), lin13(7/24) | Figure 2, Figure 4 |
| R76D11 | NB6-2 | lin19 (16/30) | Figure 2; Figure 3 |
| R51B04 | NB7-1, | lin3 (22/30), | Figure 4—figure supplement 1 |
| R35B12AD-R28H10DBD | NB7-2 | lin11 (12/30) | Figure 2, Figure 4 |
| R35B12 | NB7-1, , | lin3(10/30), , | |
| R19B03AD-R18F07DBD | NB7-4 | lin23 (26/30) | Figure 2, Figure 4—figure supplement 1 |
| R19B03** | NB2-5, | lin17 (20/24), | Figure 3 |
| R13G03 | MNB | lin0 (10/18) | Figure 4—figure supplement 1 |
| lbe-K-GAL4*** | NB5-6 | lin5-6 (20/20) | Figure 8 |
| R45D04 | NB5-2, NB5-3, NB5-4, NB5-7, NB6-2 | lin6 (30/30), lin5(30/30), lin20 (30/30), lin22(30/30), lin19 (18/30) | |
| eg-GAL4 | NB2-4, , , NB6-4, NB7-3 | lin18 (19/30), | Figure 5, Figure 4—figure supplement 1 |
-
* The number of immortalized lineage per hemisegment shown in paranthesis. Corresponding NBs and lineages are color matched.
-
** Only dorsal part VNC scored
-
***NB5-6 generate postembryonic progeny only in S3 segments Lineages marked less than 15% of the time are not included. “lin” refers to postembryonic lineage.
Table 2
Expression profile of transcription factors in NBs and their corresponding embryonic and postembryonic progeny.
| NBs | lin | Embryonic progeny* | Postembryonic lin** | NB Marker*** |
|---|---|---|---|---|
| MNB | lin 0 | En, FoxD, Vg | En | En, unpg-Lacz |
| NB1-1 | lin16 | Hb9, Lim3, Isl, D, Eve, | Hb9, Lim3 | mirr-Lacz |
| NB1-2 | lin1 | Msh, Nmr1, Hb9, Nkx6 | Nmr1, Msh | mirr-Lacz |
| NB2-1 | lin2 | Toy | mirr-Lacz | |
| NB2-2 | lin10 | Hb9, Lim3, Nkx6, | Hb9, Lim3, Nkx6 | mirr-Lacz, Run |
| NB2-3 | lin15 | Lim3, Nkx6, Isl, | Isl, Lim3, Nkx6 | mirr-Lacz, Msh, Run |
| NB2-4 | lin18 | Unc-4, Eg, Toy, Msh | Unc-4 | mirr-Lacz, Msh |
| NB2-5 | lin17 | Unc-4, Isl | Unc-4, Isl | mirr-Lacz |
| NB3-1 | lin4 | Hb9, Msh | Hb9 | Nkx6, Run |
| NB3-2 | lin7 | Hb9, Toy, Barh, Unc-4 | Unc-4 | Ey, Dbx |
| NB3-3 | lin8 | Toy, Lim3, Ems, Acj6, Eg, Eve | Lim3, Ems, Acj6, Toy, | Ems,Run |
| NB3-4 | lin25 | Toy, Ey, Msh, Eg | Toy, Nkx6 | Msh, Run, Ey, Eg-Gal4 |
| NB3-5 | lin9 | Ems, Msh, Islet, Unc-4 | Ems, Msh, Islet | Ems |
| NB4-1 | lin14 | Msh, Unc-4 | Msh | unpg-Lacz |
| NB4-2 | lin13 | Dbx, D, Vg,Ey, Eve | Dbx, D, Vg | Ey |
| NB4-3 | lin21 | Msh, Ey | Msh, Ey | Ey, Msh |
| NB4-4 | lin24 | Ems, Toy | Ems, Toy | Ems, Ey, |
| NB5-1 | - | gsb-Lacz | ||
| NB5-2 | lin6 | Toy, En, Vg, Hb9 | Toy, En, Vg | gsb-Lacz, Run |
| NB5-3 | lin5 | Vg, Toy, Ey, En | Vg, Toy, | gsb-Lacz, Ey, Run |
| NB5-4 | lin22 | BarH | BarH | gsb-Lacz, Msh |
| NB5-5 | - | unpg-Lacz | ||
| NB5-6 | - | EyA, Toy | EyA (S3 segments) | gsb-Lacz,lbe-Gal4 |
| NB5-7 | lin20 | - | gsb-Lacz, Msh | |
| NB6-1 | lin12 | Unc-4, Nmr1, Dbx | Dbx, Unc-4, Nmr1 | gsb-Lacz, En, Dbx |
| NB6-2 | lin19 | Unc-4, Dbx | Dbx, Unc-4 | gsb-Lacz, En, D |
| NB6-4 | - | Eg, Toy, Msh | gsb-Lacz, Eg-lacz | |
| NB7-1 | lin3 | Unc-4, Dbx, Eve | Dbx, Nkx6, | gsb-Lacz, En |
| NB7-2 | lin11 | Unc-4, Nkx6 | Unc-4, Nkx6, | En, unpg-Lacz, Dbx |
| NB7-3 | - | Hb9, Isl, Eg, Ey | En, eg-GAL4 | |
| NB7-4 | lin23 | Unc-4, Acj6 | Unc-4, Acj6 | En, Msh, D |
-
* Transcription factors that are also expressed in the postembryonic neurons are highlighted in bold.
-
** We failed to detect transcription factors in red in the corresponding embryonic progeny.
-
*** Expression of these markers is maintained from embryonic to postembryonic stages. “lin” refers to postembryonic lineage.
Table 3
Lineages that are assigned to different NBs by this study and Birkholz et al. (2015).
| Lin | Findings on lineage tracing supporting assignments of this study | Findings on molecular markers supporting assignments of this study |
|---|---|---|
| lin7 NB3-2* NB4-2** | Immortalization of R21E09AD-R28H10DBD, which marks lin7, labels NB3-2 in the embryo, but not NB4-2. | NB3-2 and NB of lin7 are Dbx+versus NB4-2 is Dbx-. Embryonic progeny of NB3-2 and lin7 neurons are Unc4+ versus NB4-2 progeny are Unc4-. |
| lin8 NB3-3* NB2-4** | Immortalization of ems-GAL4, which marks lin8, labels NB3-3 in the embryo, but not NB2-4 (Figure 4—figure supplement 1). | NB3-3 and NB of lin8 are Ems+versus NB2-4 is Ems-. Embryonic progeny of NB3-3 and lin8 neurons are Acj6+ versus NB2-4 progeny are Acj6-. |
| lin11 NB7-2* NB6-4** | Immortalization of R35B12AD-R28H10DBD, which specifically marks lin11, labels only NB7-2 in the embryo, but not NB6-4 (Figure 4). NB6-4 dies (TUNEL+) in late stage embryos (Figure 4—figure supplement 3). | NB7-2 and NB of lin11 are marked by unpg-LacZ versus NB6-4 is not. NB6-4 is Msh+ versus NB of lin11 is Msh-. Embryonic progeny of NB7-2 and lin11 neurons are Unc4+ versus NB6-4 progeny are Unc4-. |
| lin13 NB4-2* NB3-3** | Immortalization of R81C12AD-R42F01DBD, which specifically marks lin13, labels only NB4-2 in the embryo, but not NB3-3 (Figure 4). | NB4-2 and NB of lin13 are Ey+ versus NB3-3 is Ey-. Embryonic progeny of NB4-2 and lin13 neurons are Dbx+/D+/Vg+ versus NB3-3 progeny are Dbx-/D-/Vg- (Figure 11). |
| lin15 NB2-3* NB3-2** | Immortalization of R10C12, which specifically marks lin15, labels only NB2-3 in the embryo, but not NB3-2 (Figure 5). | Lineage 15 NB and NB2-3 are Msh+ versus NB3-2 is Msh-. |
| lin18 NB2-4* NB3-4** | Immortalization of R65G02, which specifically marks lin18, labels only NB2-3 in the embryo, but not NB3-4 (Figure 5). Dorsal location of NB2-4 correlates with lineage 18. | Embryonic progeny of NB2-4 and lin18 neurons are Unc4+ versus NB3-4 progeny are Unc4-. |
| lin20 NB5-7* NB5-4** | Immortalization of R24C10, which marks lin20, labels NB5-7 in the embryo, but not NB5-4 (Figure 6). | NB5-7 shares similar molecular markers with NB5-4. |
| lin25 NB3-4* -** | Lineage tracing via eg-GAL4, R77B09AD-R28H10DBD, and R19B03AD-R16H11DBD lines, all of which mark lin25, label NB3-4 in the embryo (Figure 5). | Lineage 25 is first described here and assigned to NB3-4, which has not been previously characterized in detail. |
-
*NB assignment by this study
-
** NB assignment by Birkholz et al. (2015) “lin” refers to postembryonic lineage
Download links
A two-part list of links to download the article, or parts of the article, in various formats.
Downloads (link to download the article as PDF)
Open citations (links to open the citations from this article in various online reference manager services)
Cite this article (links to download the citations from this article in formats compatible with various reference manager tools)
Lineage mapping identifies molecular and architectural similarities between the larval and adult Drosophila central nervous system
eLife 5:e13399.
https://doi.org/10.7554/eLife.13399


