Mixed-mode oscillations and population bursting in the pre-Bötzinger complex
- Drexel University College of Medicine, United States
- National Institutes of Health, United States
- University of Pittsburgh, United States
Figures
Figure 1
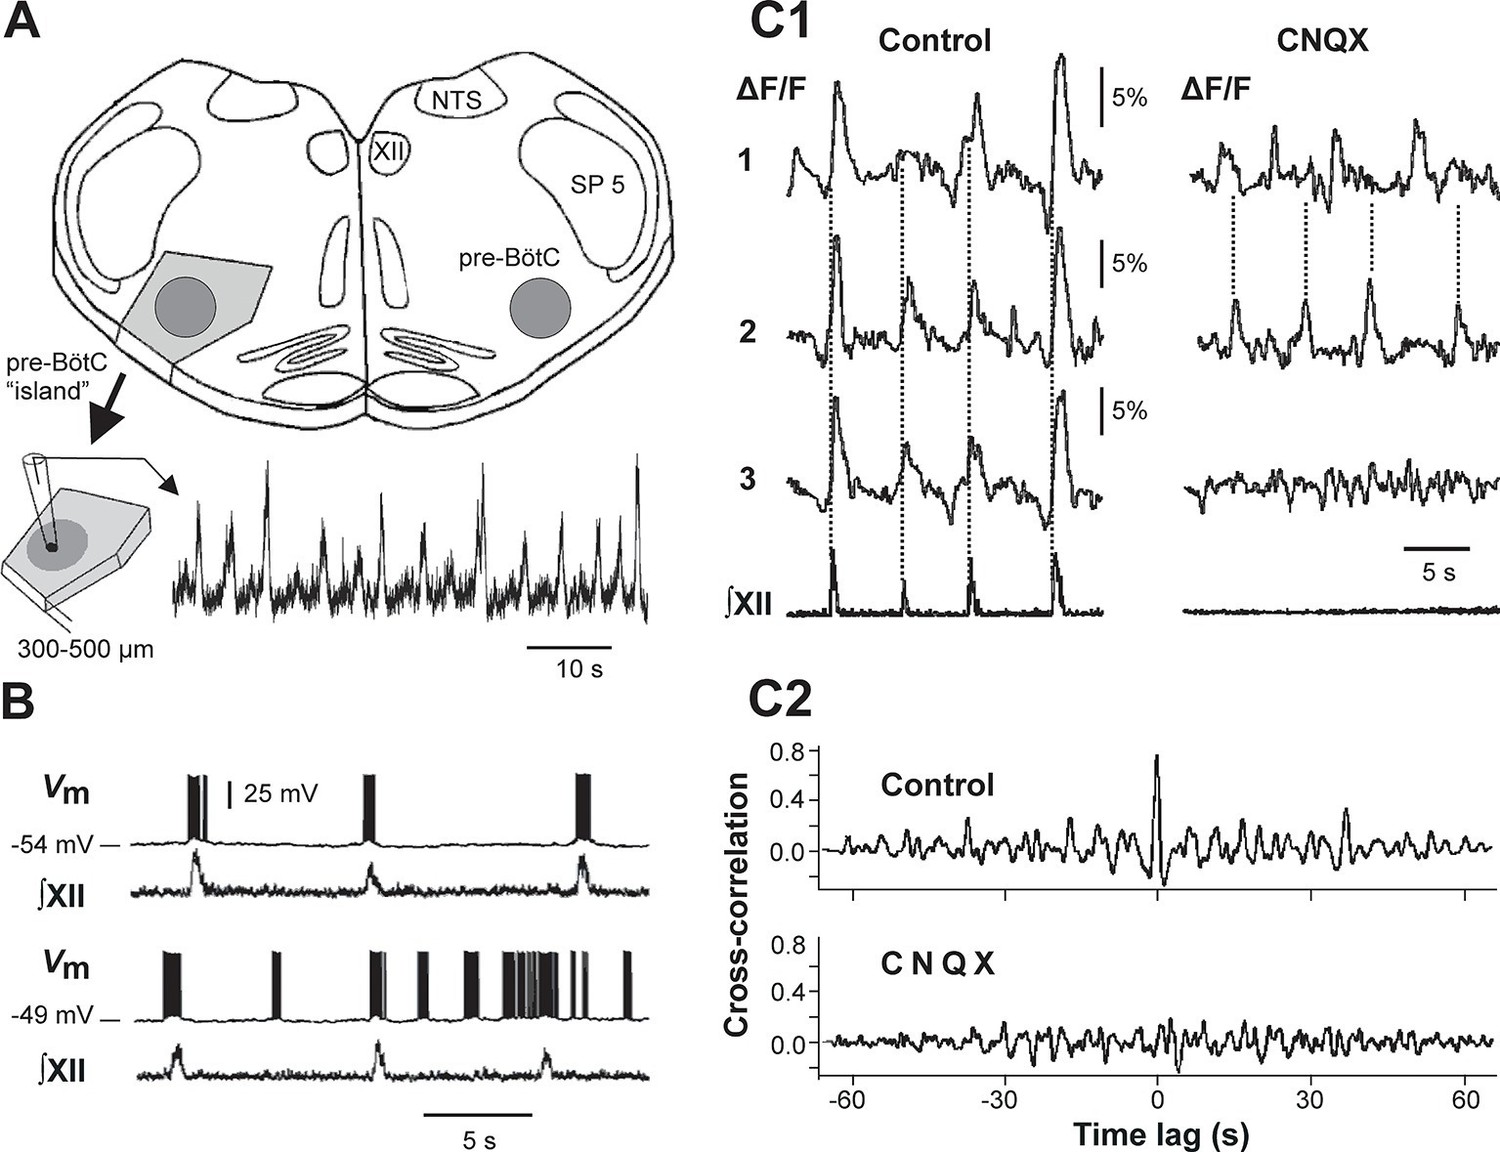
Mixed-mode and endogenous oscillations in the pre-Bötzinger complex in vitro.
(A) Top: medullary slice showing 'pre-BötC island' (shaded dark gray) and labeled structures: XII, hypoglossal motor nucleus; NTS, nucleus tractus solitarius; SP 5, spinal trigeminal tract. Bottom: Excised pre-BötC island with extracellular recording from the pre-BötC that demonstrates MMOs (i.e., interleaved large and small amplitude bursts). Modified from Johnson et al. (2001). (B) Intracellular recording from pre-BötC neuron with baseline membrane potential of -54 mV (top trace) and -49 mV (bottom trace). The corresponding integrated hypoglossal motor output (∫XII) is shown below each neuronal recording. In the top trace, each neuronal burst coincided with the activity in the hypoglossal motor output. At the more depolarized baseline potential, bursting occurred at higher frequency and several ectopic bursts did not correspond to ∫XII output. (C1) Optical recording from pre-BötC neuron activity (Ca2+ imaging). Left: three inspiratory neurons (1–3) show synchronized Ca2+ activities (ΔF/F) and corresponding ∫XII output (synchronization marked with dotted lines). Right: Application of CNQX (6-cyano-7-nitroquinoxaline-2,3-dione, blocking fast glutamatergic synaptic transmission, 50 µM) caused a loss of bursting in ∫XII and neurons 1 and 2 showed desynchronized bursting activity (see dotted lines). (C2) Cross-correlograms for neurons 1 and 2 in C1. The loss of a peak at 0 time lag after CNQX indicates loss of synchronization. B, C1, and C2 were adapted from Koshiya and Smith (1999).
Figure 2
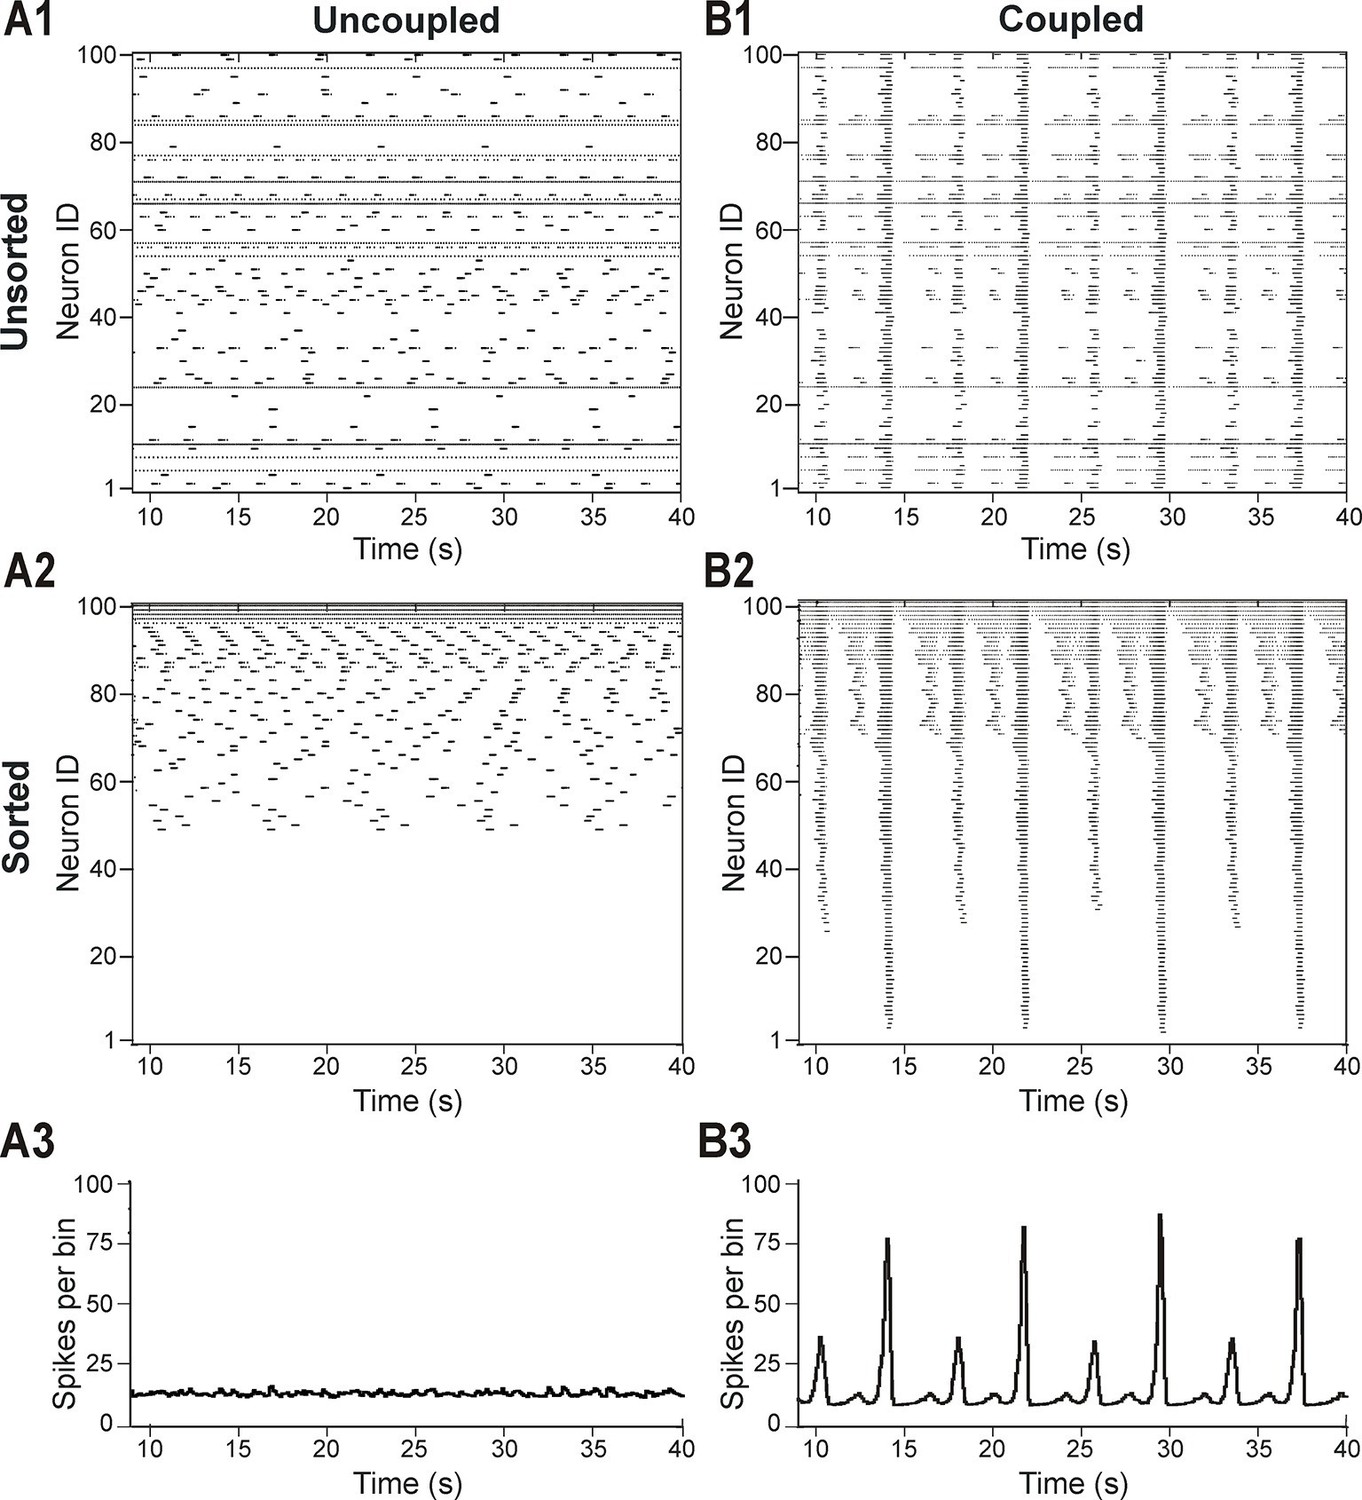
Distribution of neural excitability in a sparsely connected network causes mixed-mode oscillations.
(A1-A3) Network simulation when excitatory interactions between neurons were removed (w=0, 'uncoupled' network). (B1-B3) Simulation of network activity with sparse excitatory synaptic interconnections at w=2.5 and p=0.15. (A1, B1) Unsorted raster plots depicting the timing of action potentials in neurons with randomly distributed EL values. (A2, B2) Raster plots with neurons sorted by EL values such that the lowest Neuron ID was assigned to the neuron with the most negative EL. (A3, B3) Histogram of population activity. No phasic component is observed in A3 due to the desynchronized bursting in the uncoupled population. B3 shows a typical MMO pattern including LA bursts alternating with SA bursts of varying amplitudes.
Figure 3
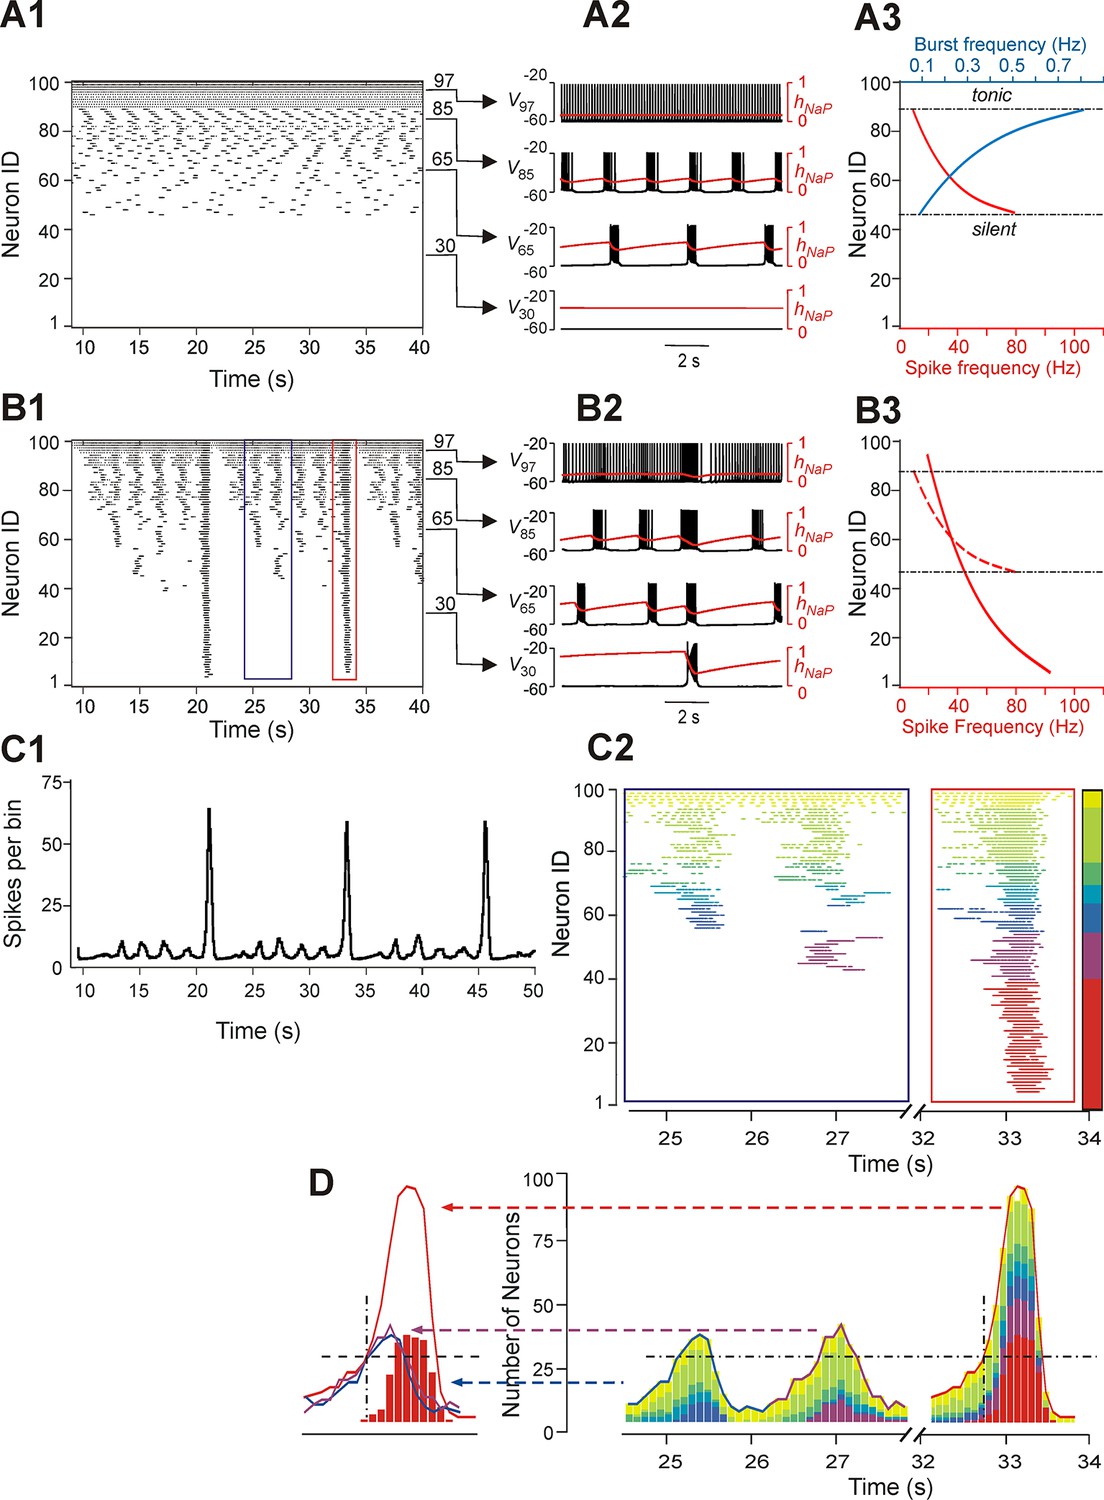
Neurons with similar excitabilities activate in clusters within a heterogeneous network with sparse connectivity.
(A1–A3) Simulation results for uncoupled network, w=0. (A1) Sorted raster plot showing silent (most negative EL, lowest Neuron IDs), bursting, and tonic (least negative EL, highest Neuron IDs) neurons. (A2) Endogenous activity of four individual neurons (Neuron IDs: 30, 65, 85 and 97) showing membrane potential (black) and inactivation, hNaP, of the persistent sodium current (red). (A3) Burst frequencies (blue) and intra-burst spike frequencies (red) were calculated for each neuron in the uncoupled case. Boundaries separating bursting from silent and tonic neurons are marked (black, dot-dashed lines). (B1–B3) Simulation results for w=1.8 and p=0.15. (B1) Raster plot sorted by EL (Neuron ID). Two SA bursts (blue rectangle) and one LA burst (red rectangle) were selected for the inset in C2. (B2) Membrane potential (black) and hNaP (red) are shown for the four neurons originally selected in A2. (B3) Spike frequency of neurons sorted by excitability in the coupled (w=1.8) case (the dashed red curve shows spike frequencies for the uncoupled (w=0) case in A3, for comparison). (C1) Histogram of population activity corresponding to B1. (C2) Insets depicting magnified raster plots from the selected bursts in B1. Different color families were used to identify neurons that belong to different clusters, with each cluster defined as a group of neurons that participated in the same set of bursts. The clusters of neurons with lowest excitability (LE), contributing to only LA bursts, were highlighted by red; on the other side of the 'color spectrum', the neurons with the highest excitability, exhibiting sustained activity, were colored yellow. (D, right) The color-coding scheme from C2 was used in conjunction with a histogram depicting the number of active neurons within a 100 ms window. The vertical dot-dashed black line marks the time of onset of LE neuron activation in an LA burst and the horizontal dot-dashed line intersects this onset time to show the total number of neurons already active at the time of LE activation. The horizontal dot-dashed line is extended to the two SA bursts and demonstrates that LE activation failed despite the presence of a sufficient number of active neurons in the network. (D, left) Comparison of number of neurons active over time from two SA bursts (purple and blue curves) and one LA burst (red curve). The intersection of the two dashed, black lines compares the SA and LA burst amplitudes when the LE neurons (red bars) first start to activate in an LA burst.
Figure 4
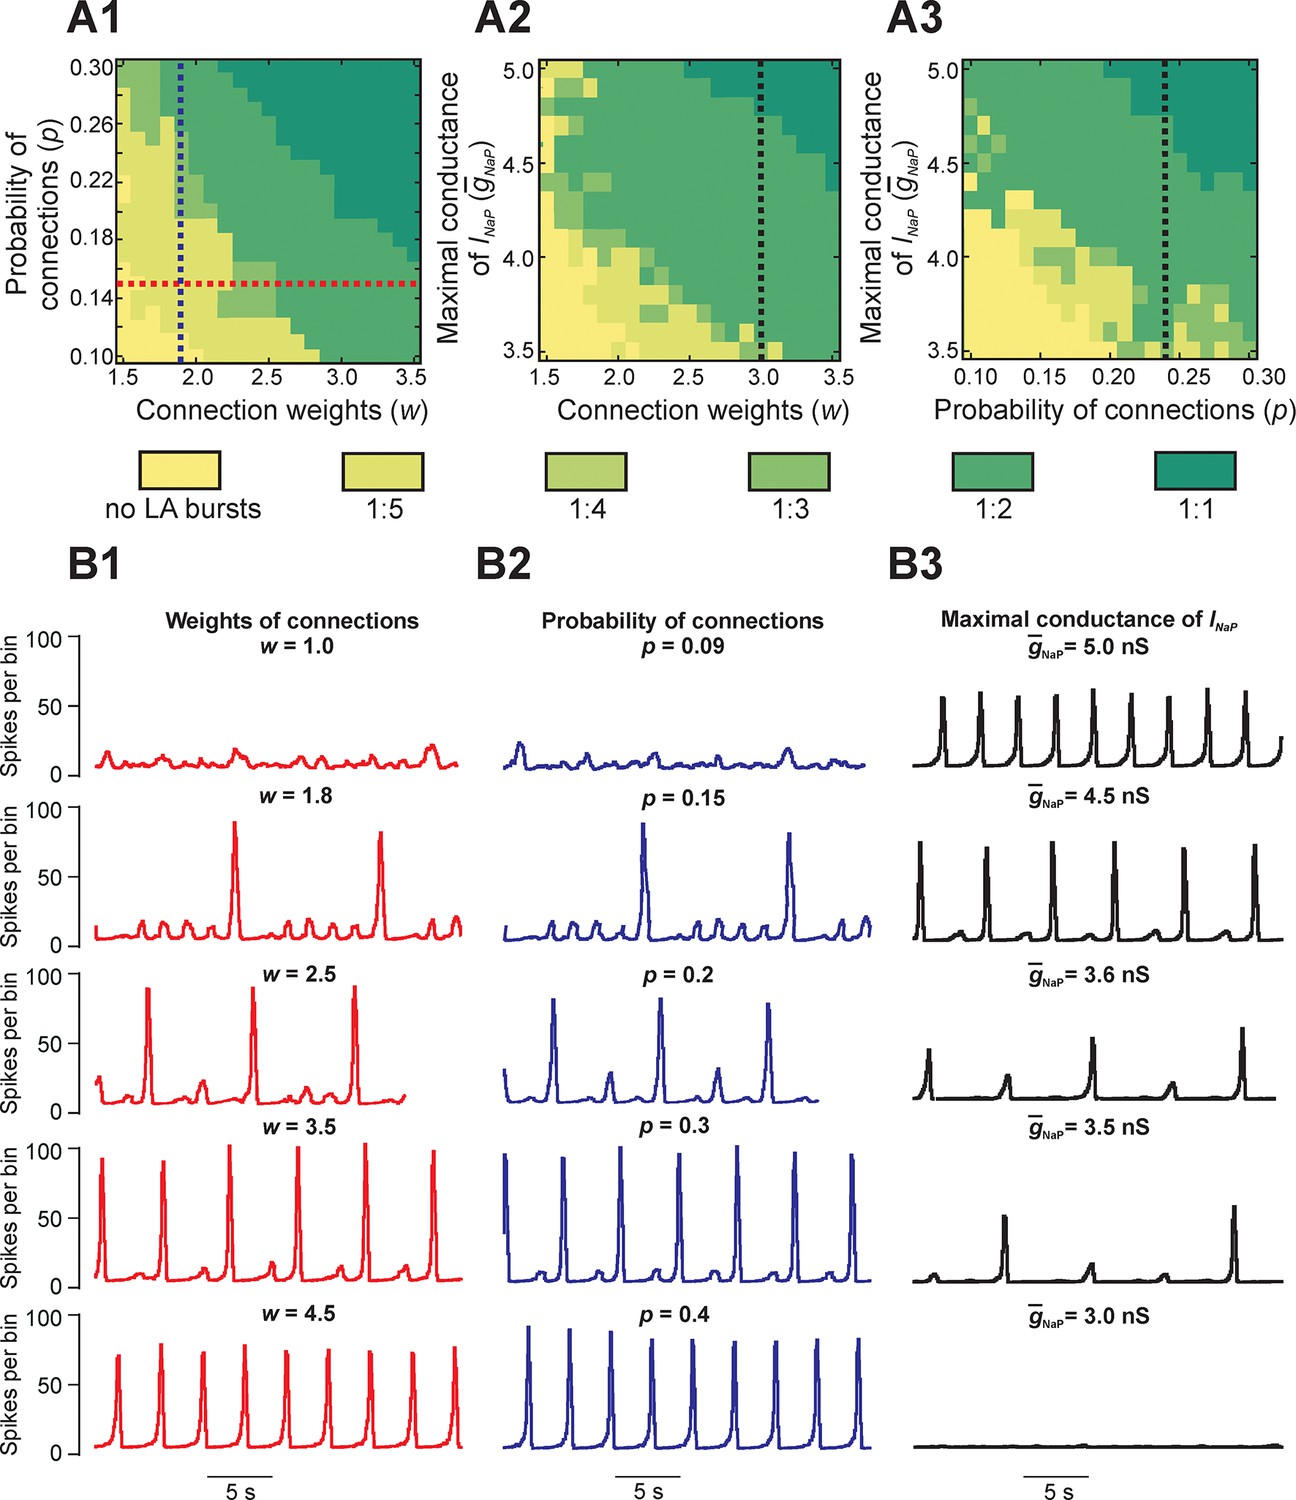
Parameter dependence of mixed-mode oscillations.
(A1–A3) Heat maps depicting quantal changes in the ratio of LA to SA bursts, representing quantal MMO regimes calculated with variation of the connection weights (w), probability of connections (p), and maximal conductance of the persistent sodium channel (). In A1, w and p were iteratively varied at = 5 nS. In A2, w and were varied at p=0.24, and in A3, p and were varied at w=3. (B1–B3) Histograms of population activity (spikes/10ms) were calculated as a parameter of interest was varied. In B1, w was varied between 1.0 and 4.5 at p=0.15 and = 5 nS; these changes correspond to the horizontal red, dashed line in A1. Progressive increase of w caused the frequency of LA bursts to increase and the number of SA bursts between LA bursts to decrease. In B2, p was varied from 0.09 to 0.4 at w=1.8 and = 5 nS; these changes correspond to the vertical blue, dashed line in A1. Similarly to changes of w, increasing p caused an increase in frequency of LA bursts and decrease in the number of SA bursts between LA bursts. In B3, was decreased from 5.0 to 3.0 nS, with fixed values w=3.0 and p=0.24, corresponding to the black, dashed lines in A2 and A3, respectively. This progressive decrease caused a decline in LA burst frequency, and an emergence of SA bursts, until all network activity stopped at =3.0 nS.
Figure 5
Reproduction and analysis of mixed-mode oscillations in a reduced model.
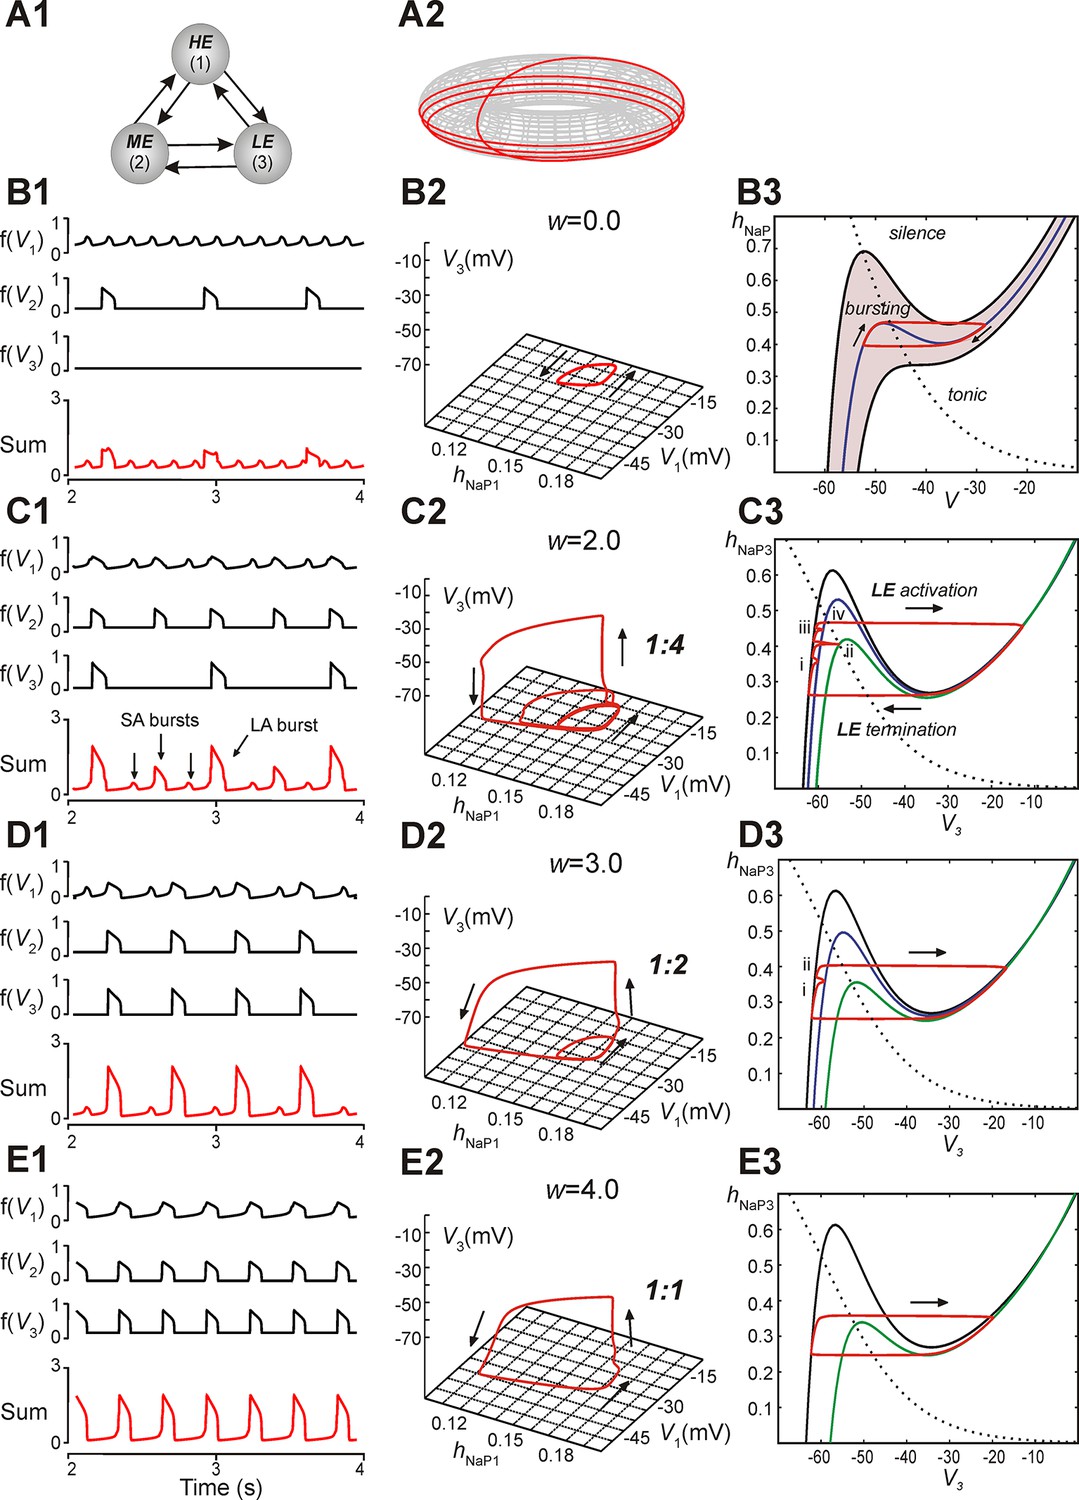
(A1) Schematic of reduced model with mutual excitatory connections between all neurons. Indices correspond to (1) high-excitability (HE), (2) medium-excitability (ME), and (3) low-excitability (LE) neurons. (A2) 1:4 regime represented in toroidal state space (product of two cyclical variables). Four rotations around the larger cycle, corresponding to SA bursts, occur during a single rotation in the smaller cycle, corresponding to an LA burst. Adapted from Rubin et al., 2011. (B1–B3) Simulation results when w=0. (B1) Output activity, f(Vi), was calculated for each neuron. The 'Sum' trace depicts aggregate network output and is asynchronous when w=0 (uncoupled network). (B2) A trajectory (red trace) in the (hNaP1,V1,V3)-plane depicts endogenous HE oscillations (cyclical movement in the (hNaP1,V1)-plane), and a silent LE neuron (no movement in V3). (B3) In the (hNaP,V)-plane an endogenously bursting neuron’s trajectory (red trace) travels around the local minima and maxima of a V-nullcline (blue curve) that intersects the hNaP-nullcline (black, dotted curve). A band of V-nullclines was calculated for the range of EL ∈ [-59.0, -53.8] mV where endogenous bursting occurred (gray band). EL values above and below this range caused tonic activity and silence, respectively. (C1–C3) Simulation results when w=2. (C1) Output activity showed a pattern of three SA bursts between two LA bursts (1:4 quantal regime). LA bursts occurred when all three neurons were active, low amplitude SA bursts occurred when only the HE neuron was active, and higher amplitude SA bursts occurred when both HE and ME neurons were synchronously active. (C2) The system’s trajectory (red curve) projected into (hNaP1,V1,V3). Four rotations in (hNaP1,V1) occurred along with only a single rotation in (V1,V3), denoting an LA burst. (C3) The LE neuron’s trajectory (red curve) is projected into the (V3,hNaP3)-plane. The hNaP3-nullcline (black, dotted curve) intersects three V3-nullclines: the black nullcline curve corresponds to LE neuron's resting state (no excitatory input), and the blue and green nullcline curves correspond to excitatory inputs from the HE neuron and both HE and ME neurons, respectively. The LE neuron receives four inputs, marked (i)-(iv), while at rest. Only input (iv) results in a successful LE activation, and therefore an LA burst. (D1–D3) Simulation results when w=3. (D1) Two SA bursts occurred between pairs of LA bursts (1:2 quantal regime). (D2) In (hNaP1,V1,V3) the trajectory makes two rotations in (hNaP1,V1) during one rotation in (V1,V3). (D3) In (V3,hNaP3), the LE neuron receives two excitatory inputs, at points marked (i) and (ii). Nullcline colors are consistent with B3. (E1–E3) Simulation results when w=4. (E1) Only LA bursts were observed (1:1 quantal regime). (E2) In (hNaP1,V1,V3), one rotation occurs in (hNaP1,V1) for each rotation in (V1,V3). (E3) The LE trajectory is projected into (V3,hNap3) for the 1:1 regime. The LE neuron activates when it receives an excitatory input from the other neurons.
Figure 6
Emergence of quantal regimes and analysis of interburst intervals.
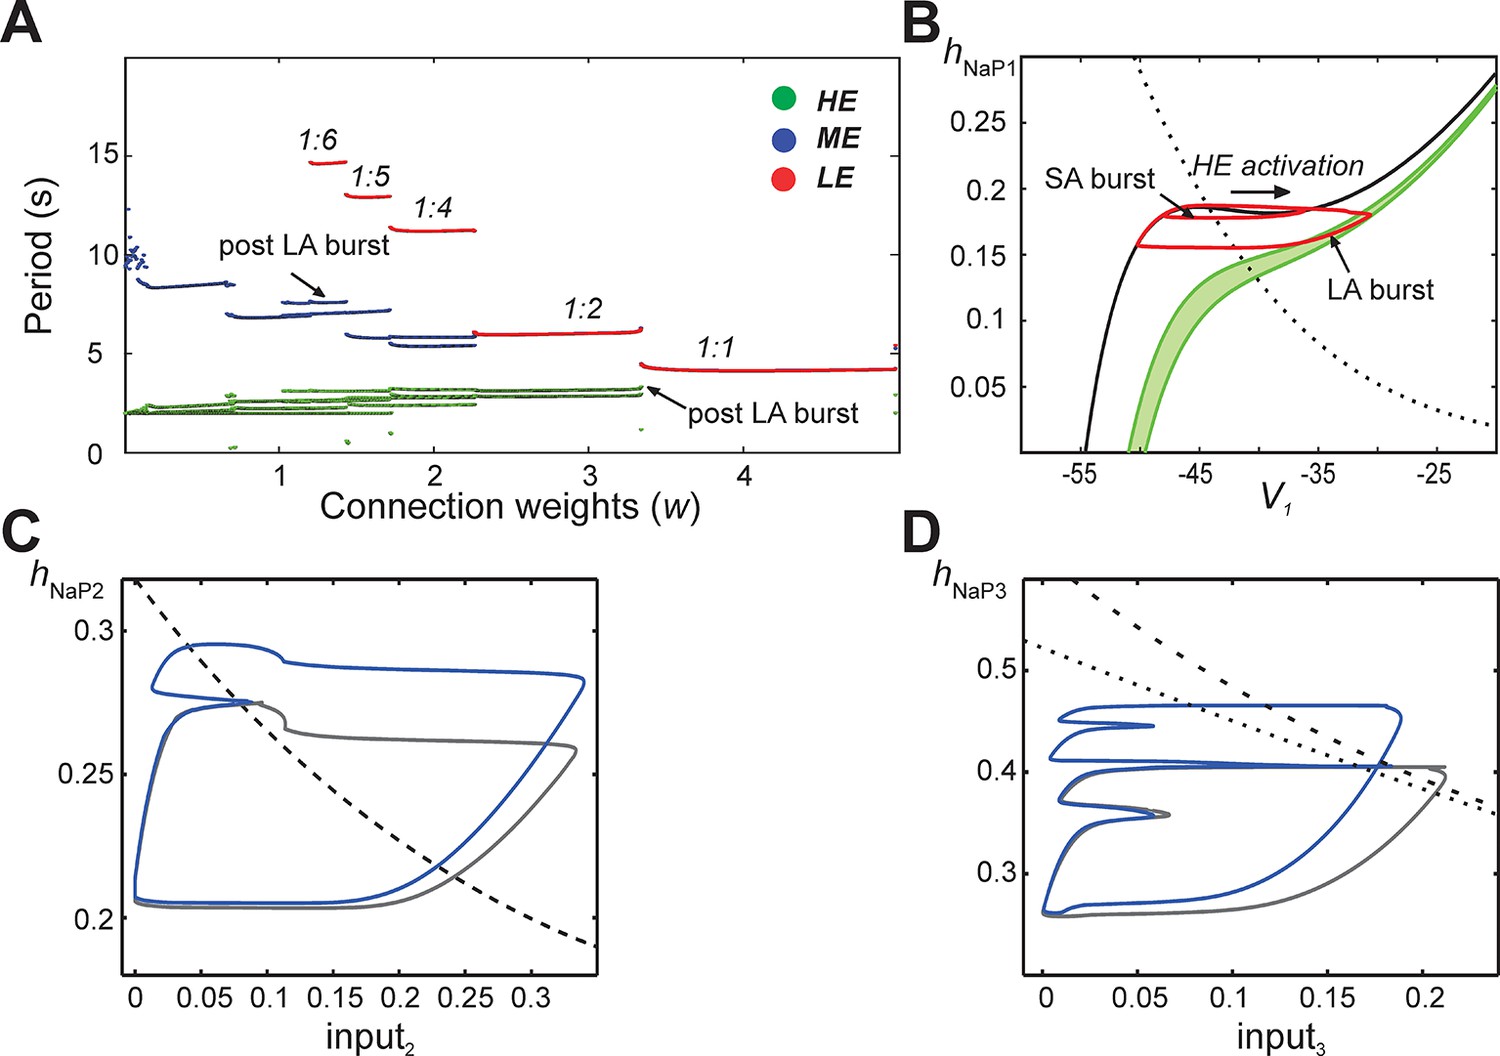
(A) The burst period of each neuron was continuously calculated as the connection weights (w) were increased and neuronal periods on each cycle were plotted. LA bursts occurred at w>1.4 (LE emergence, red dots). The quantal regime was determined by the ratio of LE and HE periods. Transitions between stable regimes, i.e. bifurcations, occurred when the LE period 'jumped' to progressively lower integer ratios of the HE period. The ME and HE neurons had longer periods following LA bursts than SA bursts. This phenomenon creates multiple branches in the ME and HE periods for a given quantal regime (see the pair of HE period branches at w=3 in the 1:2 quantal regime, for example). (B) The HE neuron's trajectory (red curve) is projected into the (hNaP1,V1)-plane when w=3.0 (1:2 regime). Distinct oscillations arise in the HE neuron's trajectory for SA and LA bursts. The black V1-nullcline governs HE activity when it is endogenously bursting during an SA burst. The green V1-nullclines govern HE activity during network-wide activation (LA burst) and are depicted as a band because of the progressive decay of output from LE and ME neurons (resulting from the decrease in f(V) as their voltages decreased, see Equation 14, following LA burst onset. (C) Projection of 1:1 trajectory (grey, w =3.4) and trajectory at the transition to the 1:2 regime (blue, w=3.2) to the (input2, hNaP2) plane. The latter exhibits a tangency to the curve of knees (black dashed) of the V2-nullcline, where it fails to activate and thus 1:1 regime is lost. (D) Projection of 1:2 trajectory (grey, w =2.4) and trajectory at the transition to the 1:4 regime (blue, w =2.1) to the (input3, hNaP3) plane. The latter exhibits a tangency to the curve of knees (black dashed) of the V3-nullcline, where it fails to activate and thus 1:2 regime is lost. The curve of fixed points, where the V3-nullcline and h3-nullcline intersect, is also shown (black dotted).
Figure 7
Modulation of excitability and connection weights alters reduced model activity pattern.
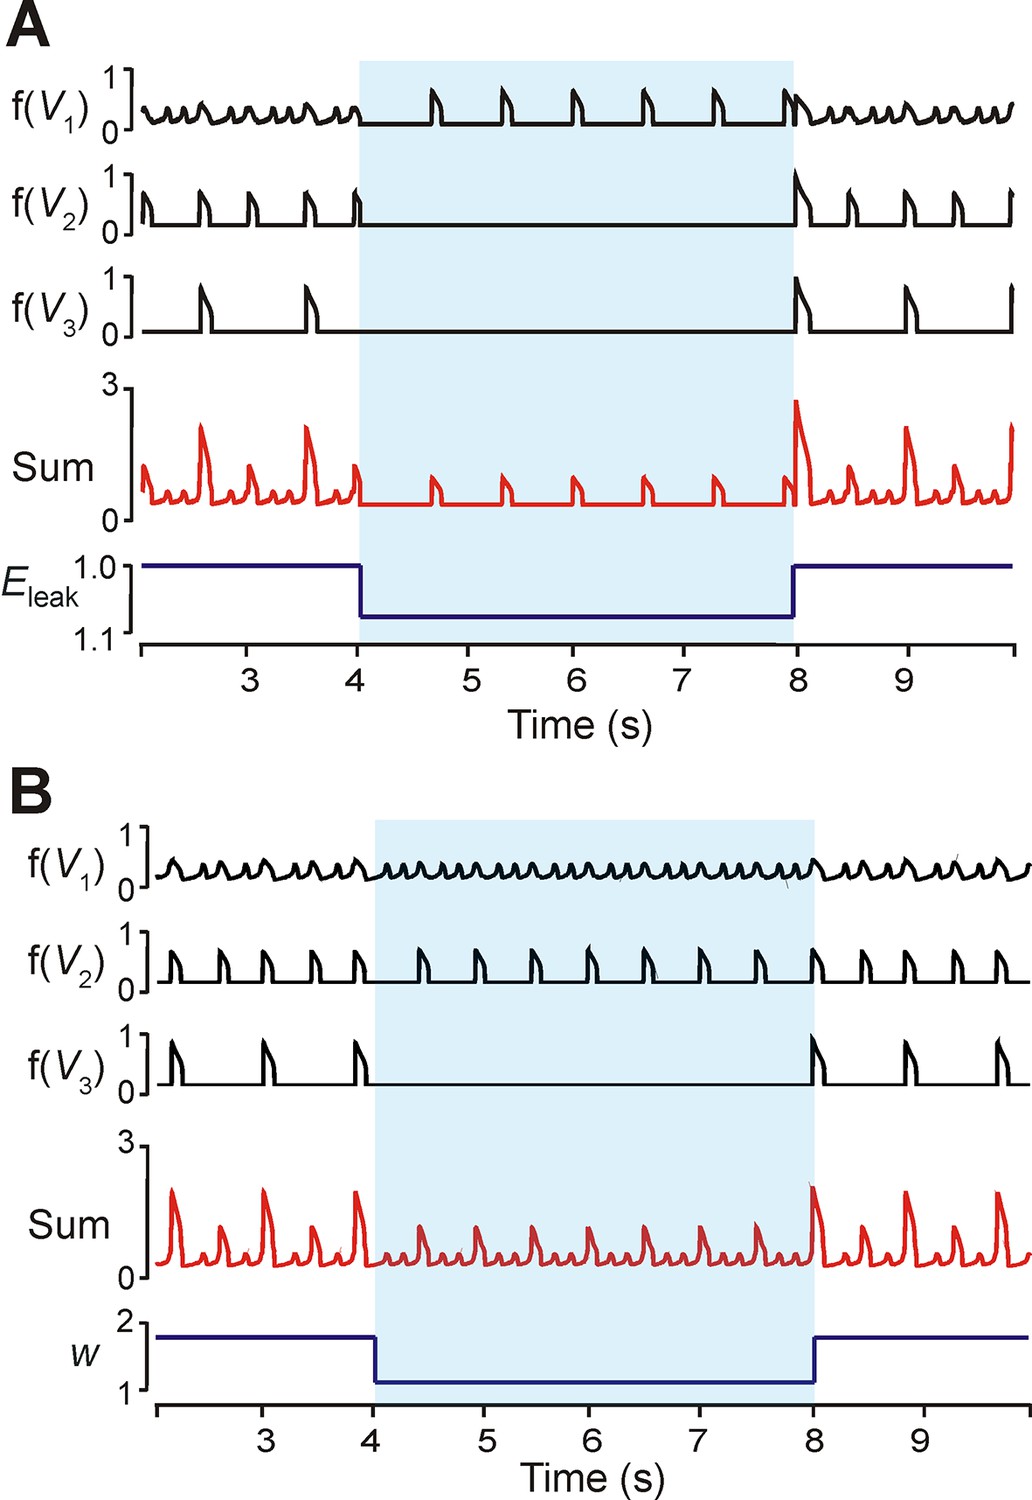
(A) Output levels, f(Vi), for all three neurons with w=1.7. A transient decrease of 10% in EL was implemented between 4 and 8 s (blue shaded region), causing the 1:5 quantal regime to transition to a regime with only HE active. (B) Output levels, f(Vi), for all three neurons with w=2.0, producing the 1:4 quantal regime. A transient reduction of w by 50% between 4 and 8 s (blue shaded region) caused a loss of LA bursts. Resulting SA bursts featured activation of HE alone (lower amplitude SA bursts) or synchronized HE and ME activity (higher amplitude SA bursts).
Tables
Table 1
Steady-state functions for voltage-dependent activation and inactivation of ionic channels and other parameter values of the large-scale model.
| Ionic channels | |
| Fast sodium (Na) | ; |
| Persistent sodium (NaP) | |
| Delayed-rectifier potassium (K) | where |
| Leak (L) | |
| Neuron parameters | |
| Reversal potentials | |
| Membrane capacitance | |
| Synaptic/network parameters | |
| Synaptic connections | |
Table 2
Parameter values for the reduced model.
| Ionic channels | |
| Persistent sodium (NaP) | |
| Leak (L) | |
| Synaptic Current (SynE) | |
| Neuron parameters | |
| Potentials | |
| Membrane capacitance | |
| Synaptic/network parameters | |
| Synaptic connections | |
| Parameters of output function, f(V) |
Download links
A two-part list of links to download the article, or parts of the article, in various formats.
Downloads (link to download the article as PDF)
Open citations (links to open the citations from this article in various online reference manager services)
Cite this article (links to download the citations from this article in formats compatible with various reference manager tools)
Mixed-mode oscillations and population bursting in the pre-Bötzinger complex
eLife 5:e13403.
https://doi.org/10.7554/eLife.13403


