A century of trends in adult human height
Figures
Figure 1
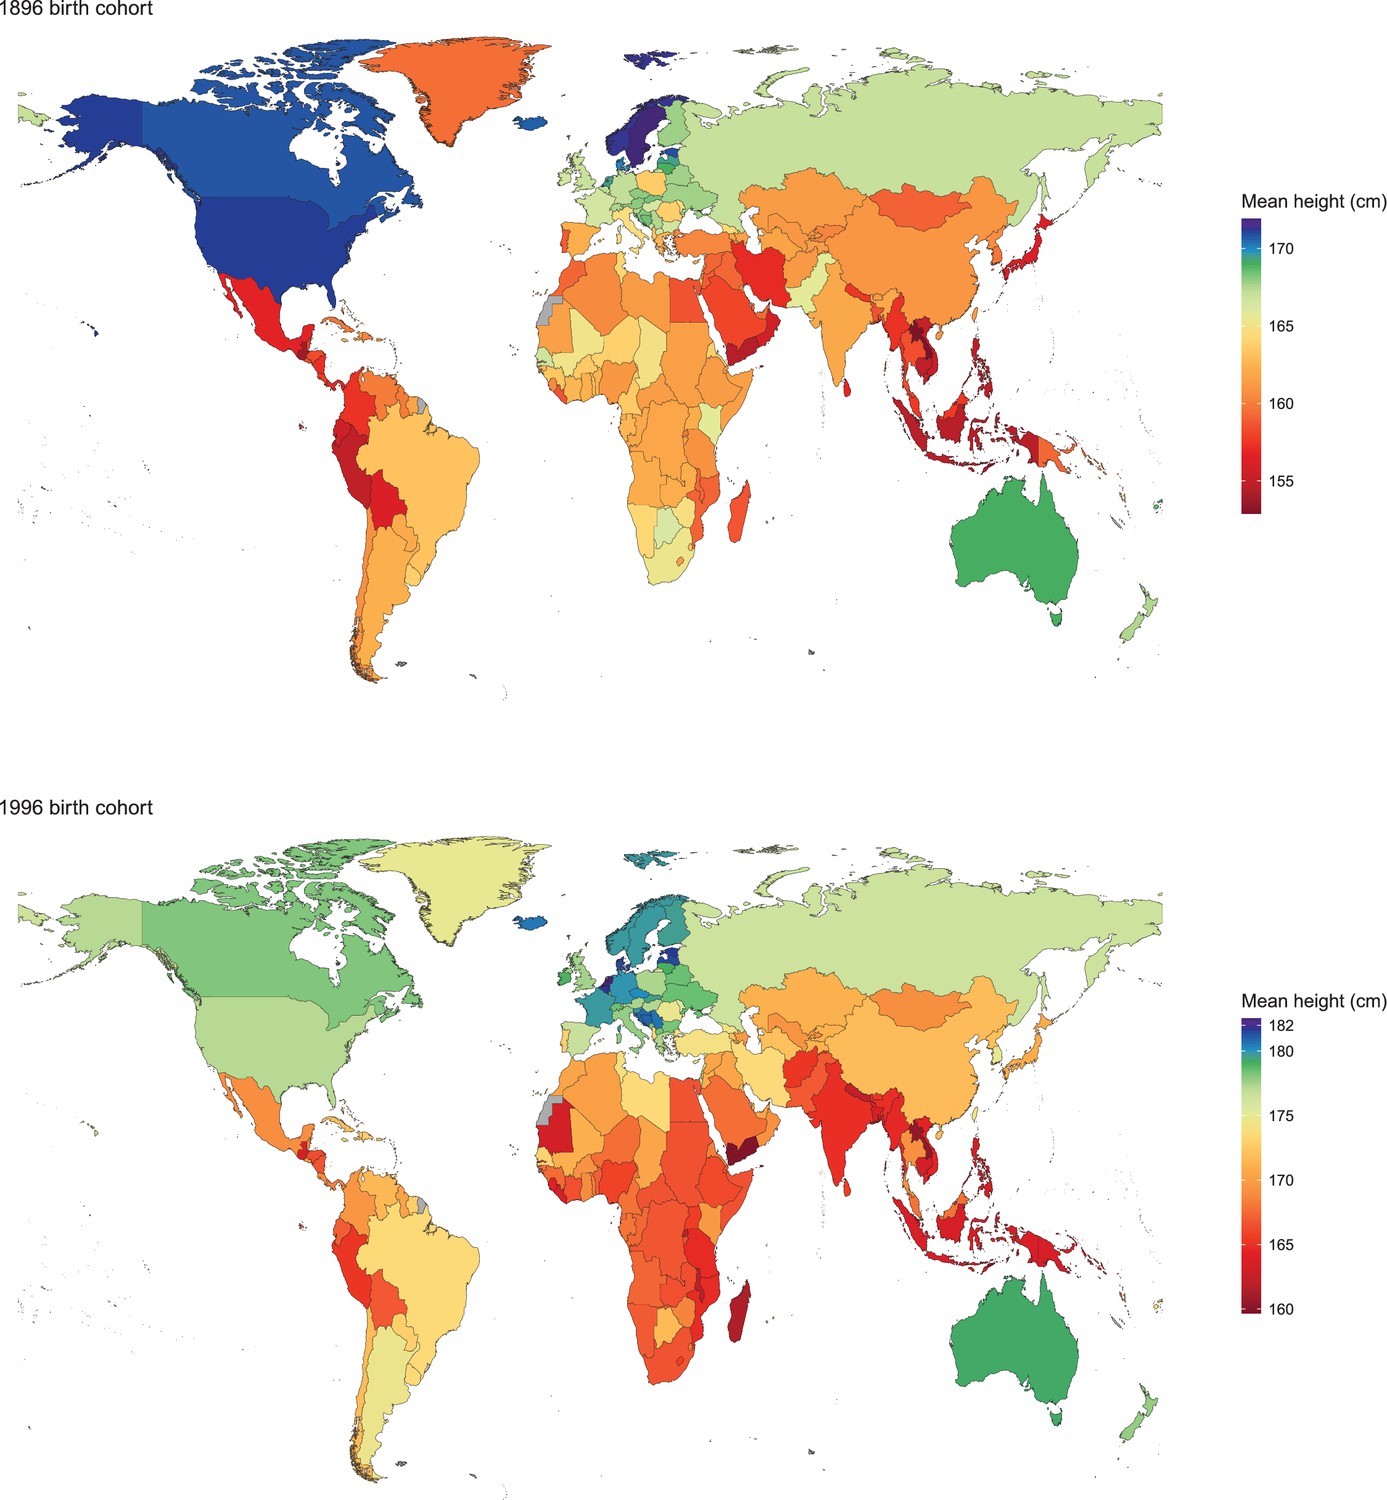
Adult height for the 1896 and 1996 birth cohorts for men.
See www.ncdrisc.org for interactive version.
Figure 2
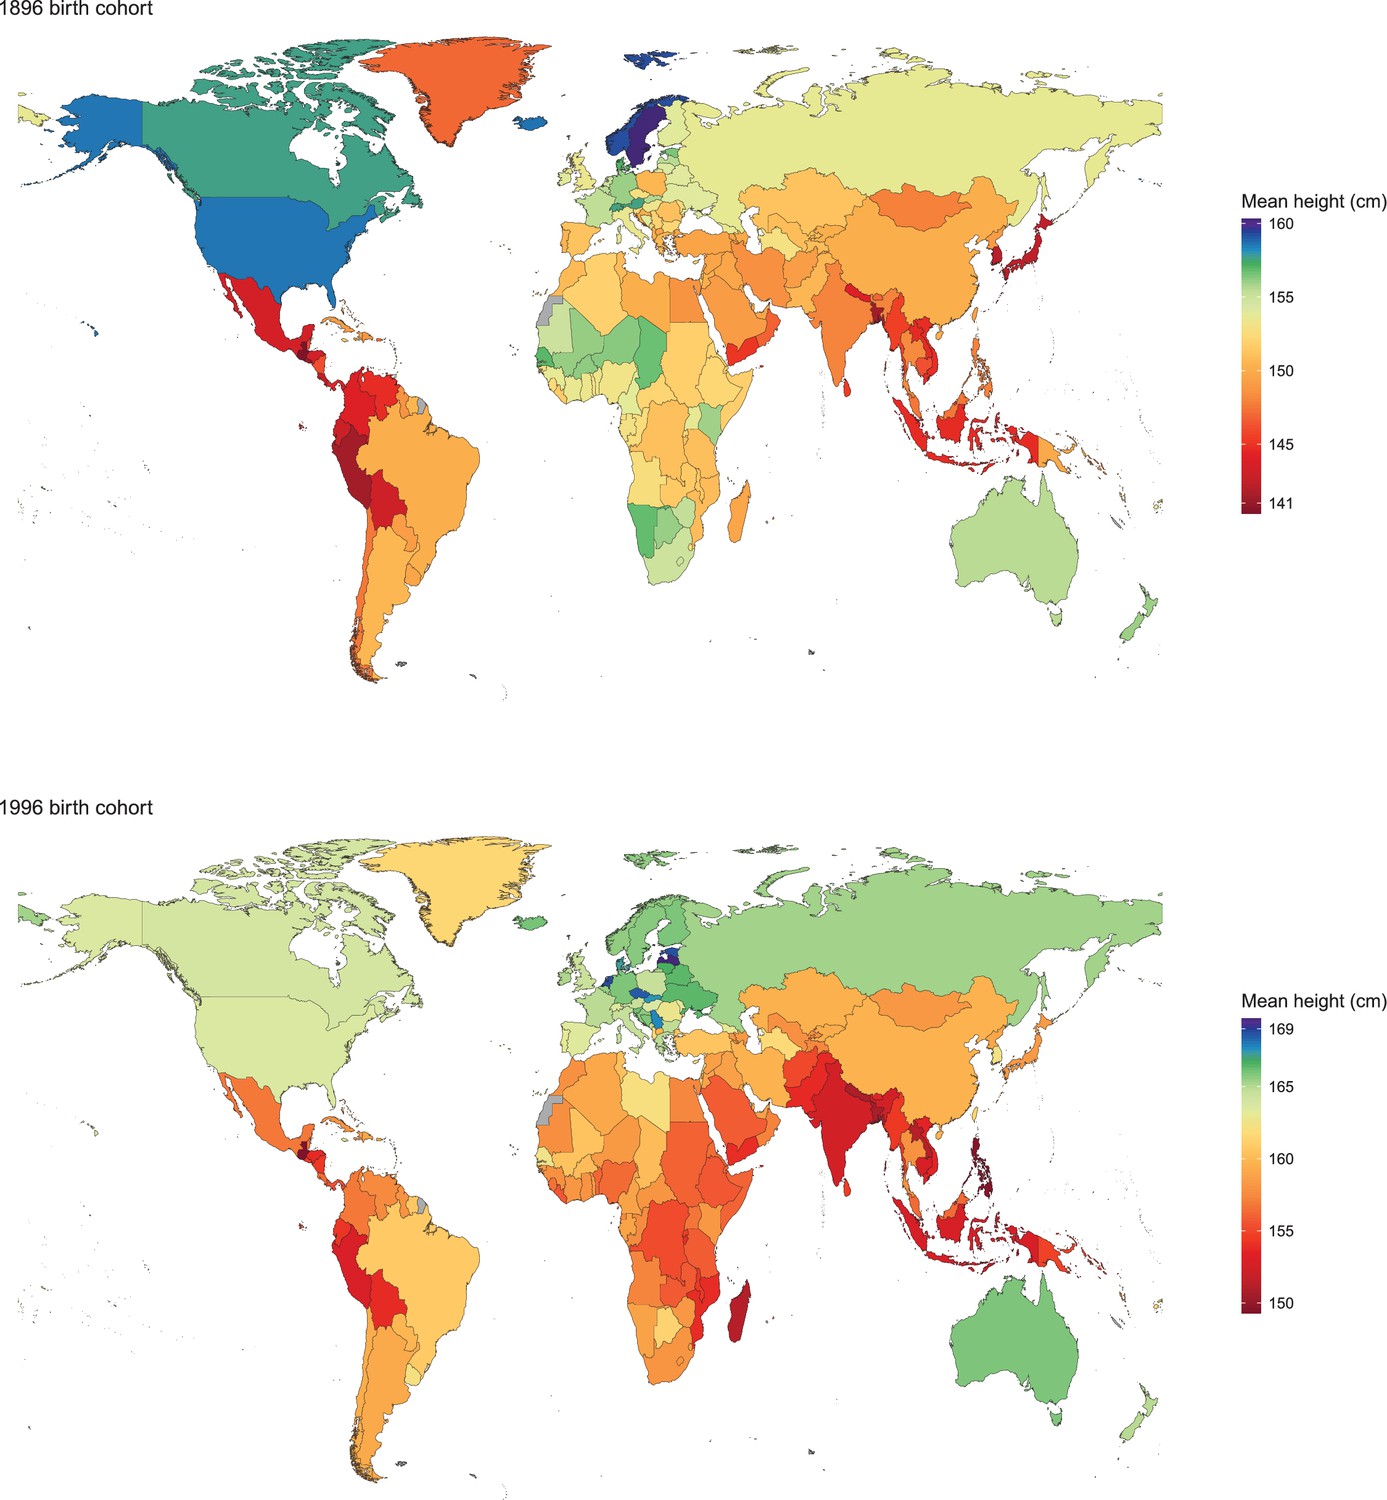
Adult height for the 1896 and 1996 birth cohorts for women.
See www.ncdrisc.org for interactive version.
Figure 3
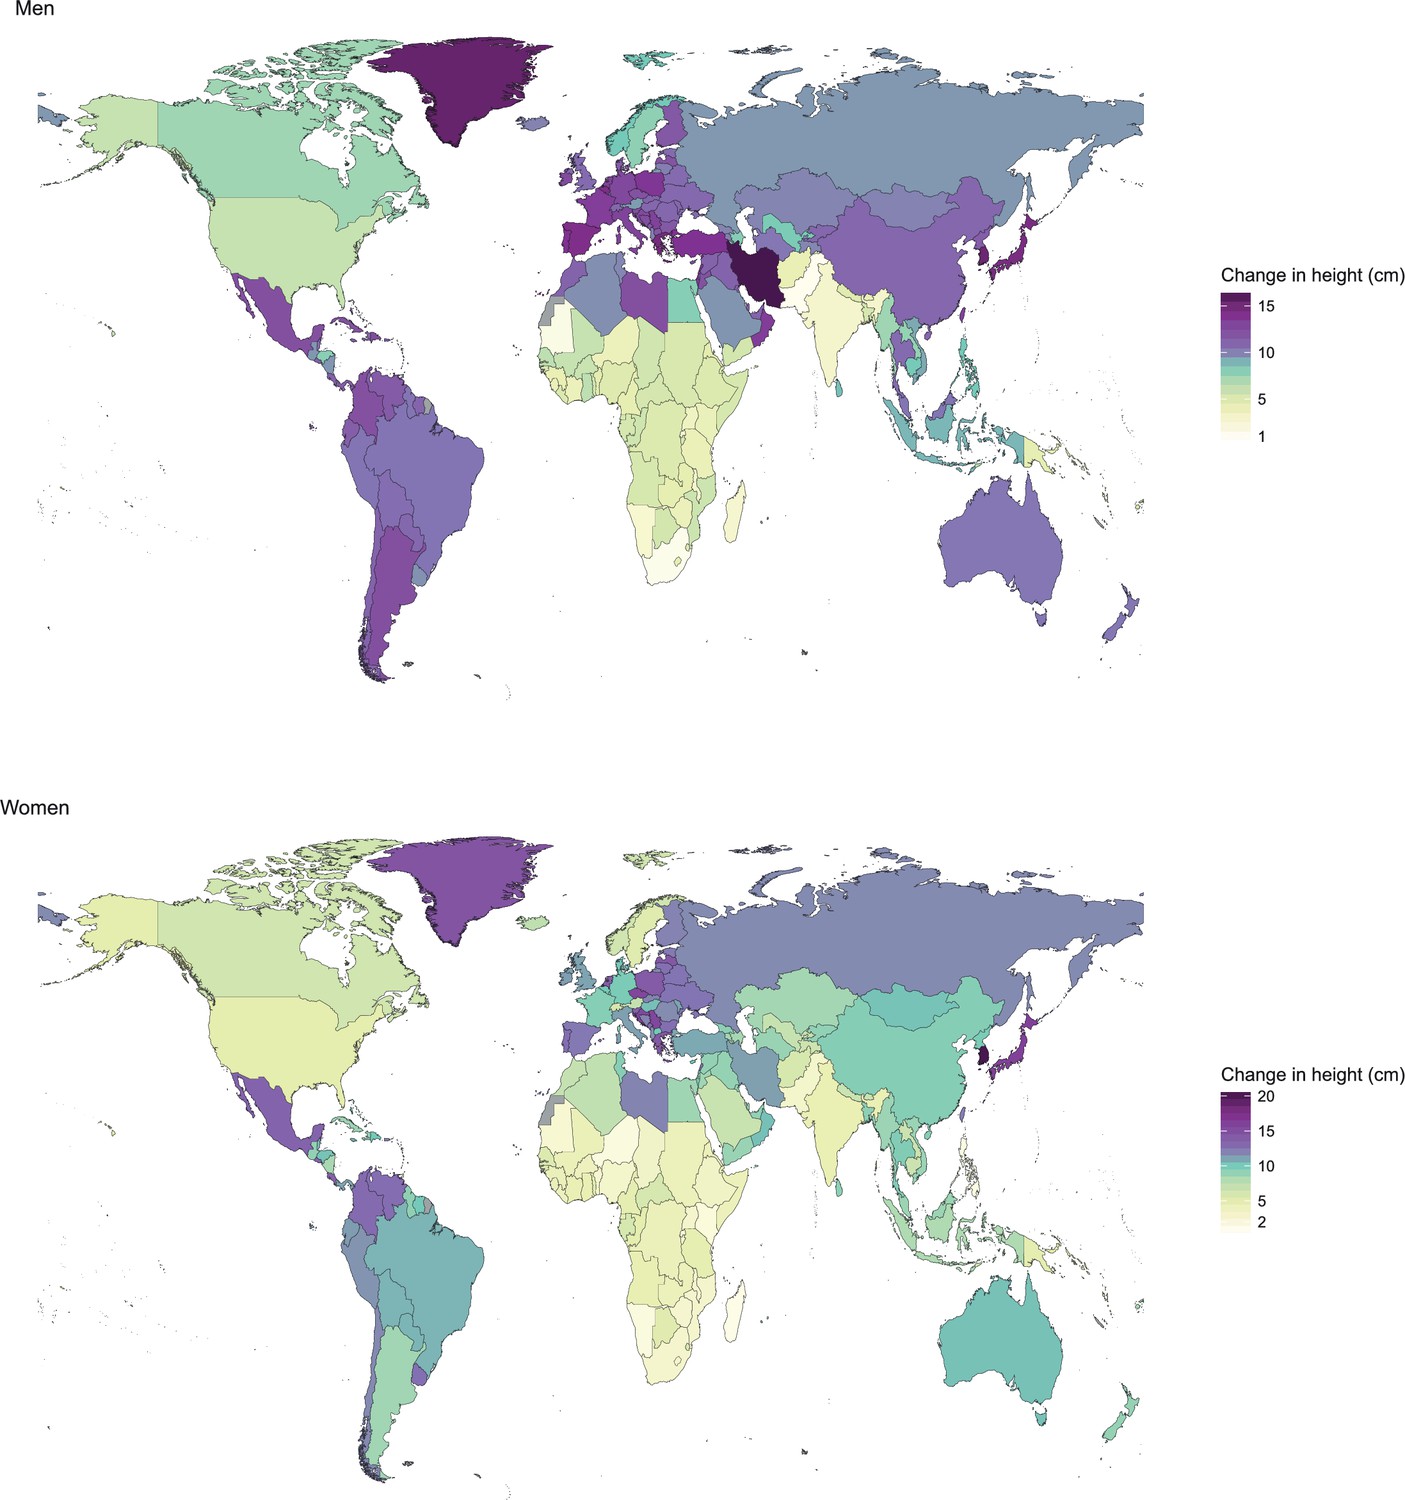
Change in adult height between the 1896 and 1996 birth cohorts.
https://doi.org/10.7554/eLife.13410.005
Figure 4

Height in adulthood for the 1896 and 1996 birth cohorts for men.
The open circle shows the adult height attained by the 1896 birth cohort and the filled circle that of the 1996 birth cohort; the length of the connecting line represents the change in height over the century of analysis. The numbers next to each circle show the country’s rank in terms of adult height for the corresponding cohort. See www.ncdrisc.org for interactive version.
Figure 5
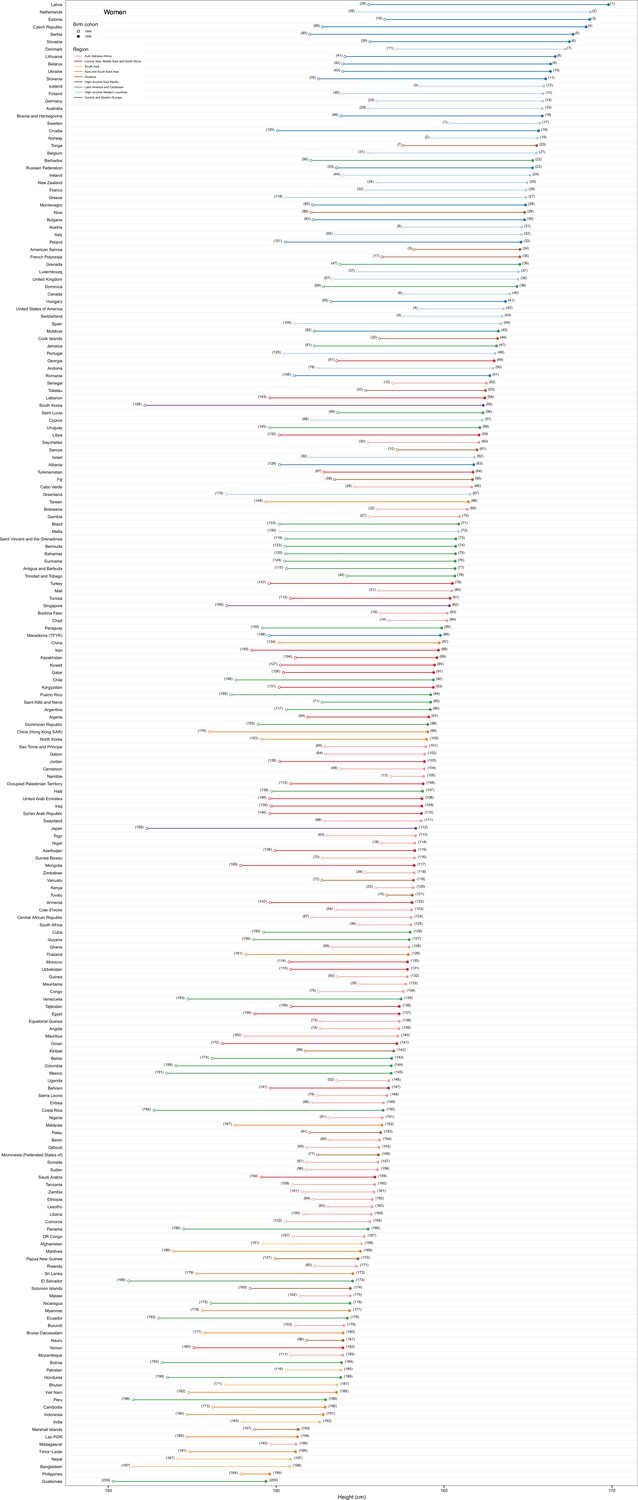
Height in adulthood for the 1896 and 1996 birth cohorts for women.
The open circle shows the adult height attained by the 1896 birth cohort and the filled circle that of the 1996 birth cohort; the length of the connecting line represents the change in height over the century of analysis. The numbers next to each circle show the country’s rank in terms of adult height for the corresponding cohort. See www.ncdrisc.org for interactive version.
Figure 6

Trends in height for the adult populations of selected countries in Asia.
The solid line represents the posterior mean and the shaded area the 95% credible interval of the estimates. The points show the actual data from each country, together with its 95% confidence interval due to sampling. The solid line and shaded area show estimated height at 18 years of age, while the data points show height at the actual age of measurement. The divergence between estimates and data for earlier birth cohorts is because participants from these birth cohorts were generally older when their heights were measured.
Figure 7
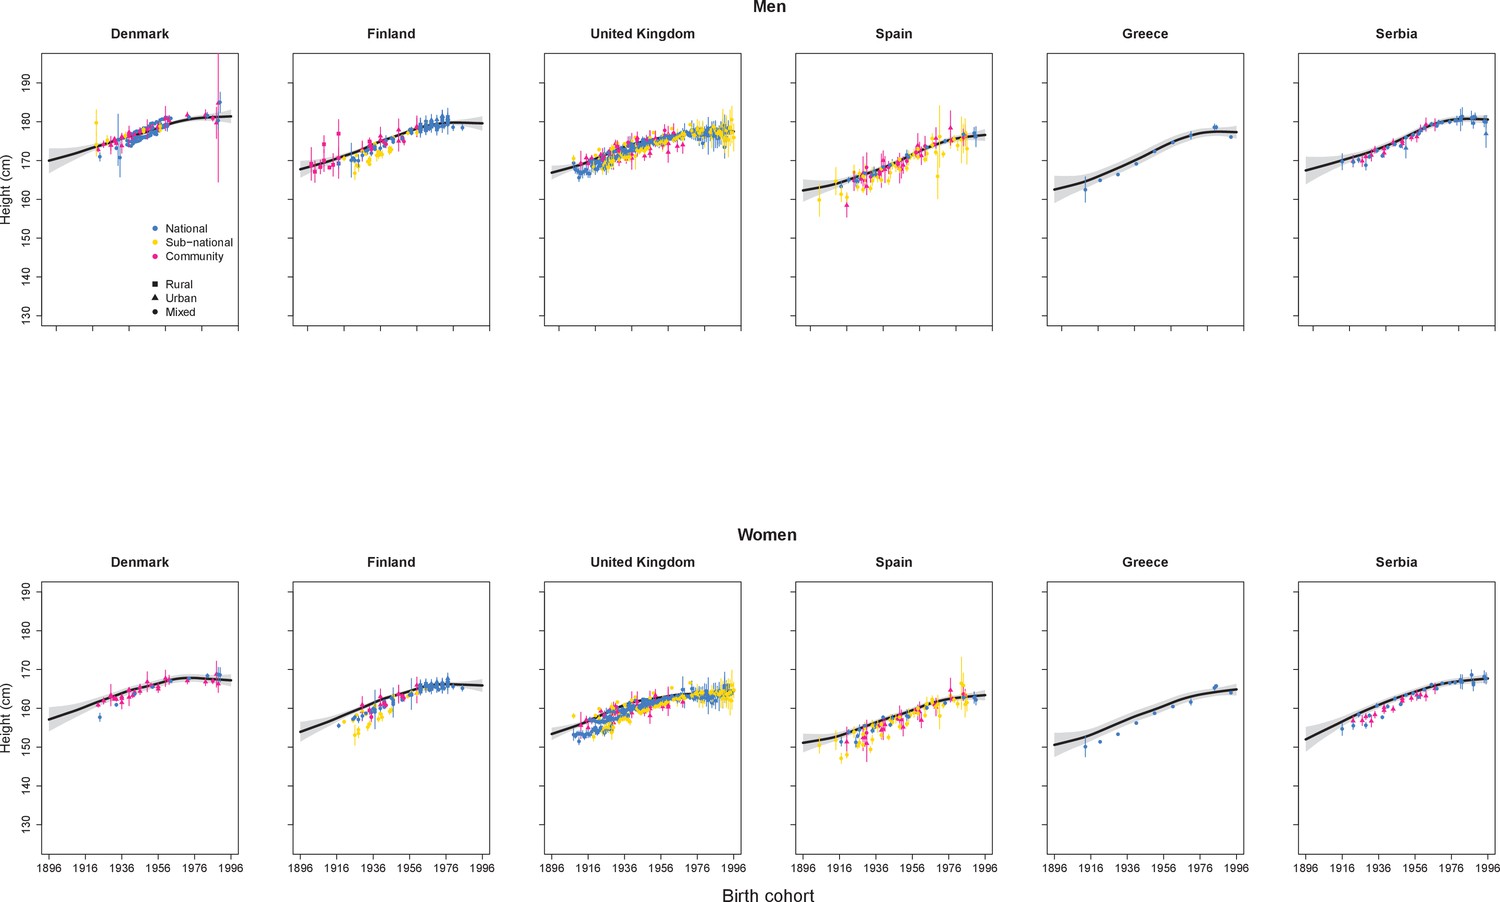
Trends in height for the adult populations of selected countries in Europe.
The solid line represents the posterior mean and the shaded area the 95% credible interval of the estimates. The points show the actual data from each country, together with its 95% confidence interval due to sampling. The solid line and shaded area show estimated height at 18 years of age, while the data points show height at the actual age of measurement. The divergence between estimates and data for earlier birth cohorts is because participants from these birth cohorts were generally older when their heights were measured.
Figure 8
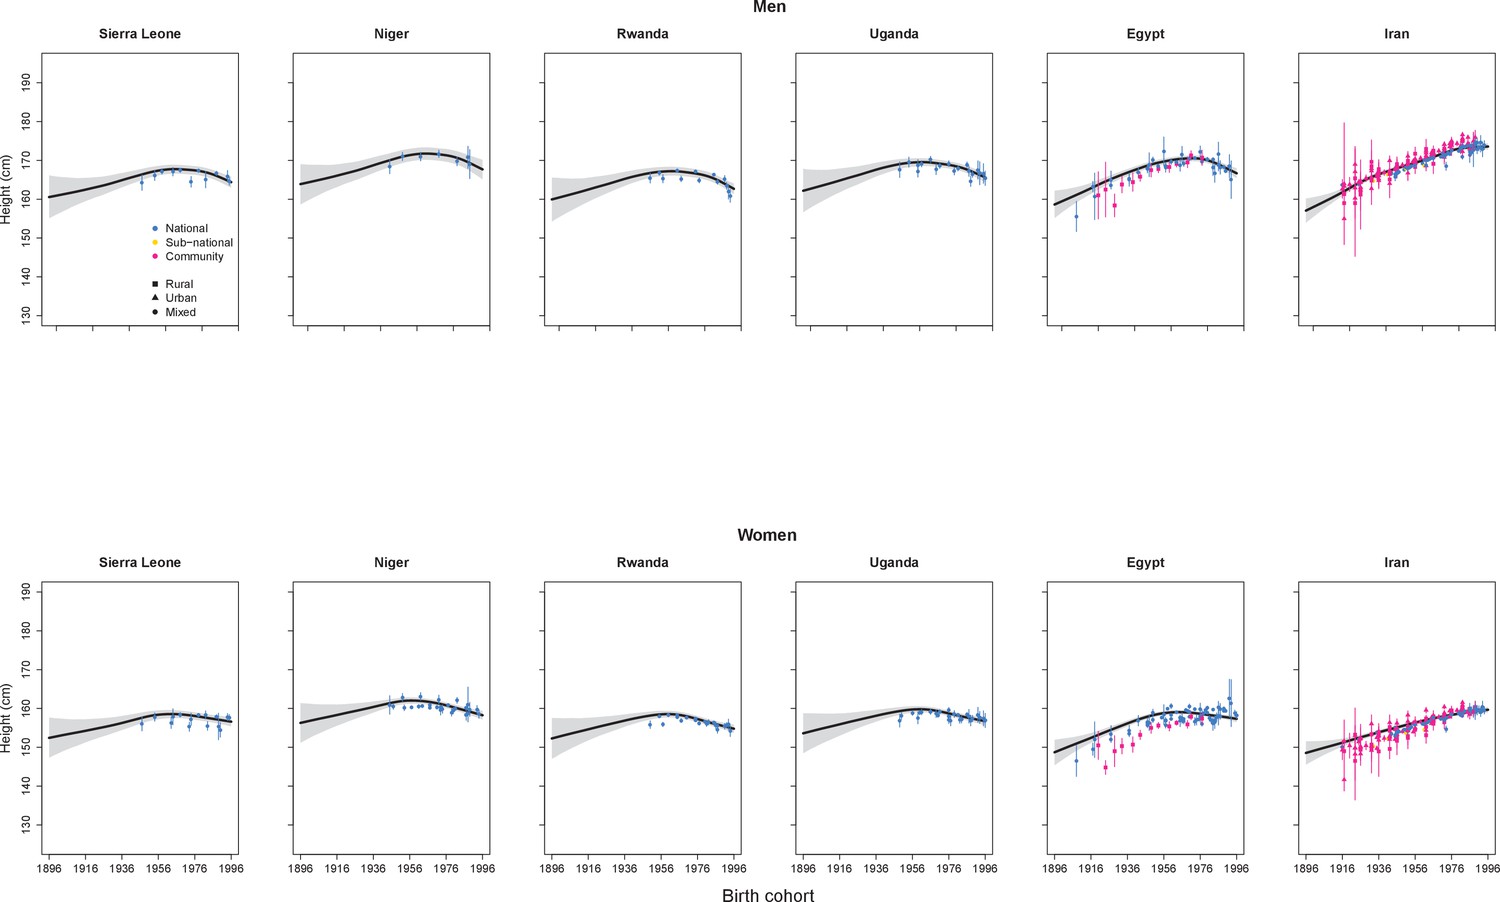
Trends in height for the adult populations of selected countries in the Middle East, North Africa, and sub-Saharan Africa.
The solid line represents the posterior mean and the shaded area the 95% credible interval of the estimates. The points show the actual data from each country, together with its 95% confidence interval due to sampling. The solid line and shaded area show estimated height at 18 years of age, while the data points show height at the actual age of measurement. The divergence between estimates and data for earlier birth cohorts is because participants from these birth cohorts were generally older when their heights were measured.
Figure 9
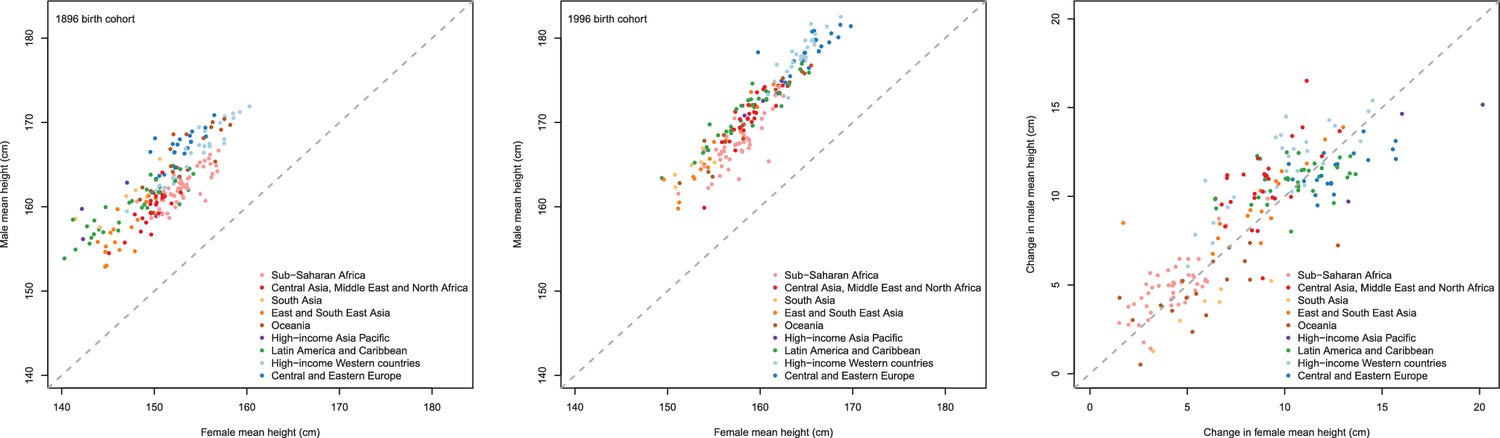
Height in adulthood for men vs. women for the 1896 and 1996 birth cohorts, and change in men’s vs. women’s heights from 1896 to 1996.
https://doi.org/10.7554/eLife.13410.011
Figure 10
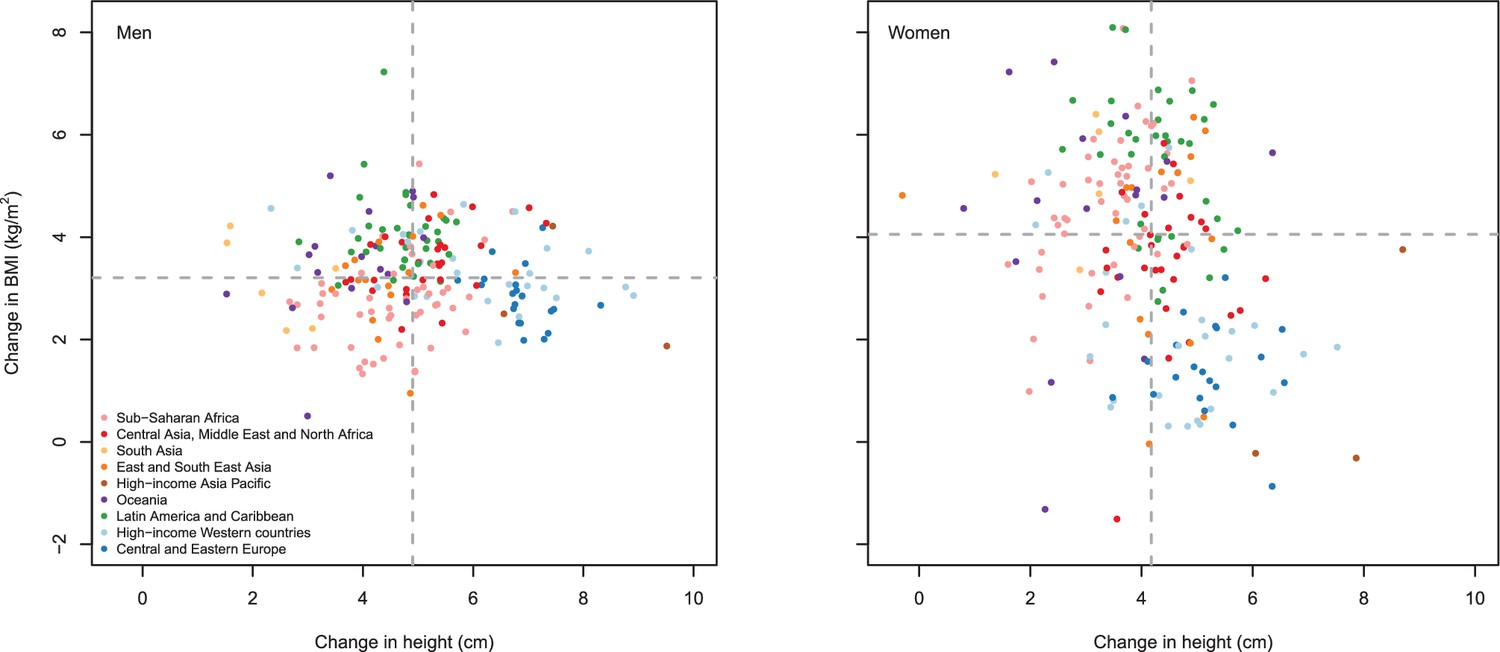
Change, over the 1928–1967 birth cohorts, in mean BMI vs. in mean height.
Each point shows one country. BMI change was calculated for mean BMI at 45–49 years of age – an age when diseases associated with excess weight become common but weight loss due to pre-existing disease is still uncommon. BMI data were available for 1975–2014 (NCD Risk Factor Collaboration, 2016); 45–49 year olds in these years correspond to 1928–1967 birth cohorts. BMI data were from a pooled analysis of 1698 population-based measurement studies with 19.2 million participants, with details reported elsewhere (NCD Risk Factor Collaboration, 2016).
Figure 11
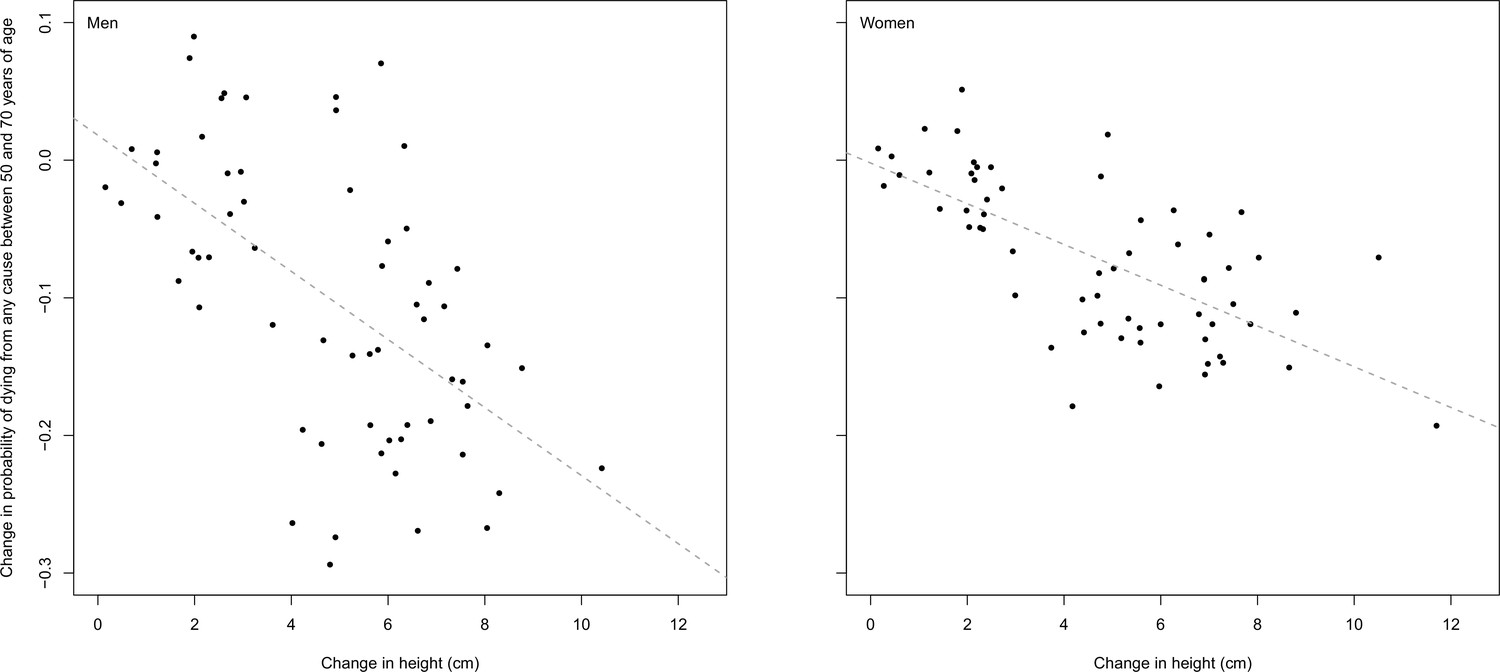
Association between change in probability of dying from any cause between 50 and 70 years of age and change in adult height by country for cohorts born between 1898 and 1946.
Probability of death was calculated using a cohort life table. Mortality data were available for 1950 to 2013. The 1898 birth cohort is the first cohort whose mortality experience at 50–54 years of age was seen in the data, and the 1946 birth cohort the last cohort whose mortality experience at 65–69 years of age was seen in the data. The dotted line shows the linear association. The 62 countries included have vital registration that is >80% complete and have data on all-cause mortality for at least 30 cohorts. The countries are Argentina, Australia, Austria, Azerbaijan, Belarus, Belgium, Belize, Brazil, Bulgaria, Canada, Chile, China (Hong Kong SAR), Colombia, Costa Rica, Croatia, Cuba, Czech Republic, Denmark, Estonia, Finland, France, Germany, Greece, Guatemala, Hungary, Iceland, Ireland, Israel, Italy, Japan, Kazakhstan, Kyrgyzstan, Latvia, Lithuania, Luxembourg, Macedonia (TFYR), Malta, Mauritius, Mexico, Moldova, Netherlands, New Zealand, Norway, Poland, Portugal, Puerto Rico, Romania, Russian Federation, Slovakia, Slovenia, South Korea, Spain, Sweden, Switzerland, Trinidad and Tobago, Turkmenistan, Ukraine, United Kingdom, United States of America, Uruguay, Uzbekistan and Venezuela.
Additional files
-
Supplementary file 1
Regions used for the Bayesian hierarchical model such that information was shared among countries within each region, among regions in a super-region, and among super-regions in the world.
Numbers in brackets show number of countries in each region or super-region.
- https://doi.org/10.7554/eLife.13410.014
-
Supplementary file 2
Flowchart of secondary search for data sources.
- https://doi.org/10.7554/eLife.13410.015
-
Supplementary file 3
Data sources used in the study, by country.
- https://doi.org/10.7554/eLife.13410.016
-
Supplementary file 4
Results of model validation.
The validation procedure is described in the main text.
- https://doi.org/10.7554/eLife.13410.017
Download links
A two-part list of links to download the article, or parts of the article, in various formats.
Downloads (link to download the article as PDF)
Open citations (links to open the citations from this article in various online reference manager services)
Cite this article (links to download the citations from this article in formats compatible with various reference manager tools)
A century of trends in adult human height
eLife 5:e13410.
https://doi.org/10.7554/eLife.13410


