Microbiota-driven transcriptional changes in prefrontal cortex override genetic differences in social behavior
- Icahn School of Medicine at Mount Sinai, United States
- BERG, United States
- Virginia Commonwealth University, United States
Figures
Figure 1 with 3 supplements
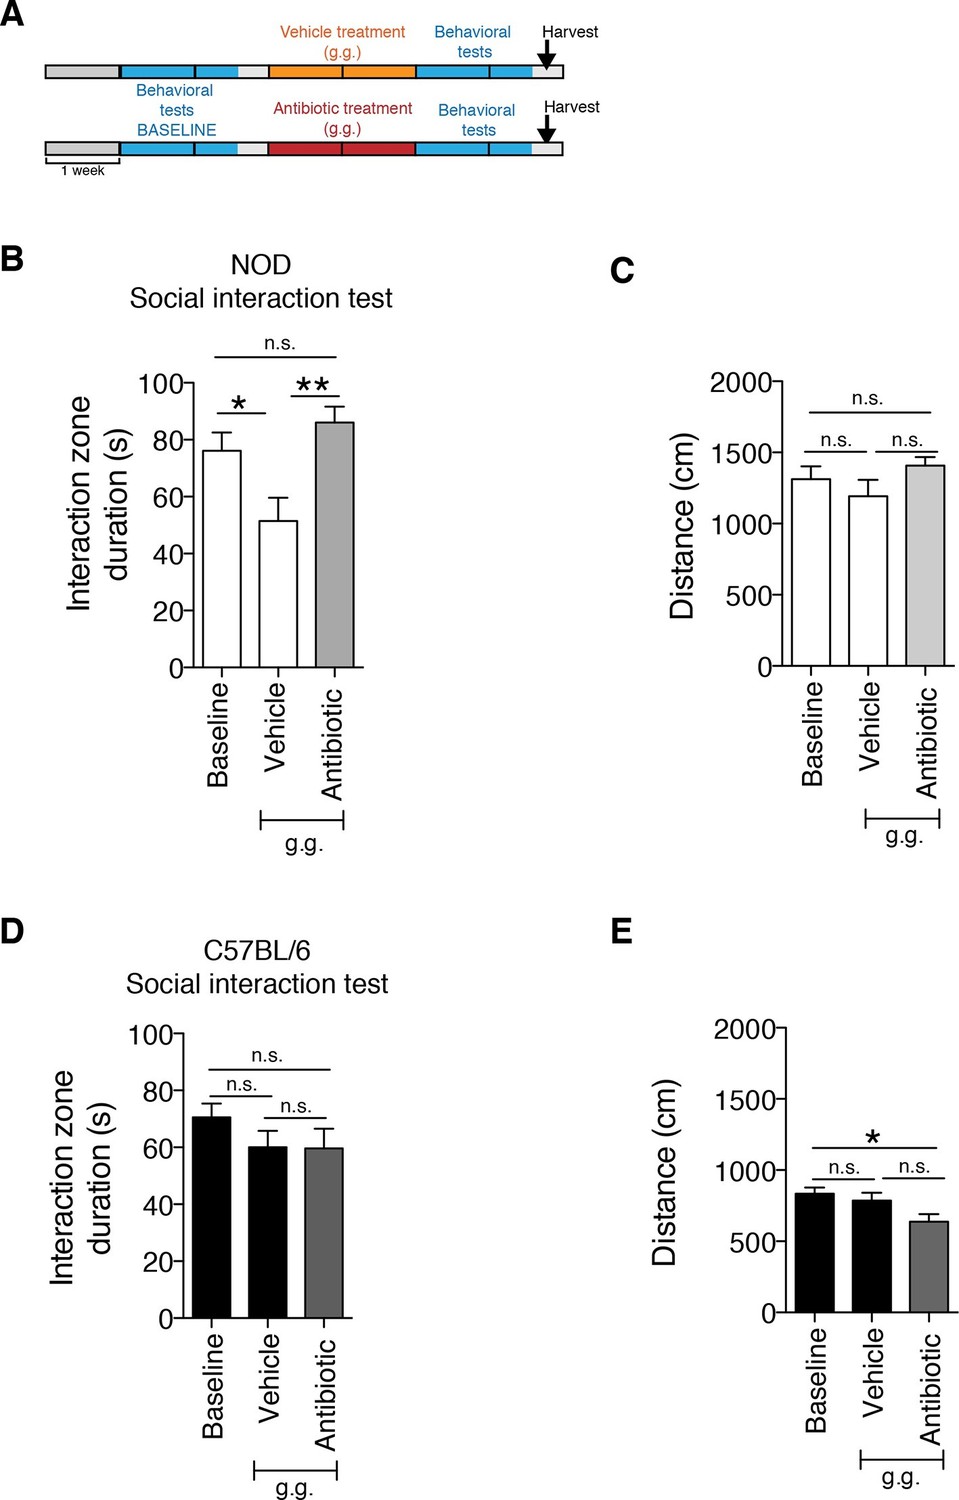
The strain-specific social avoidance behavioral response to daily gavage is affected by oral antibiotic treatment.
(A) Experimental timeline: vehicle or antibiotic mix were administered daily by gastric gavage (g.g.) for 14 days. Behavioral testing was performed before (baseline) and after treatment. (B–D) Results of the Social Interaction (SI) test for NOD (B) and C57BL/6 (D) mice. Oral antibiotic treatment did not affect locomotor activity measured during the social interaction test (C,E) (3 independent experiments with 8 mice per group/experiment for a total of n=23–24 mice per condition). Data are mean ± S.E.M; *p<0.05, **p<0.01 based on one-way ANOVA with Bonferroni’s post hoc test; n.s. indicates not significant.
Figure 1—figure supplement 1
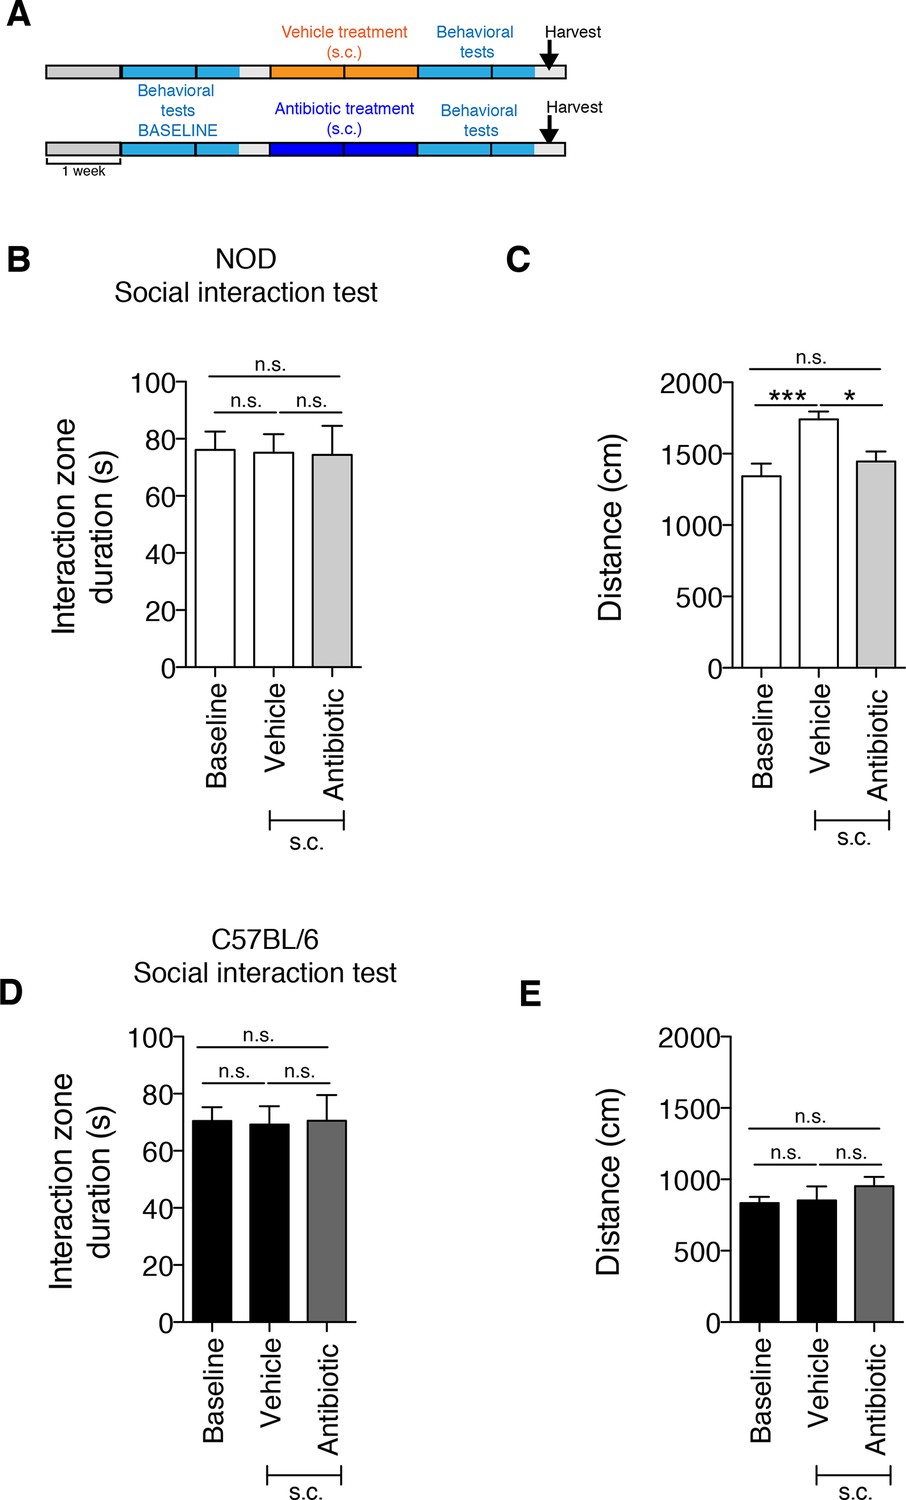
The subcutaneous delivery of vehicle or antibiotic did not induce social avoidance behavior.
(A) Experimental timeline: vehicle or antibiotic mix were administered daily (s.c.) for 14 days. Behavioral testing was performed before (baseline) and after treatment. (B–C). Results of the Social Interaction (SI) test for NOD (B) and C57BL/6 (C) mice. (D–E) Locomotor activity measured during the Social interaction test (2 independent experiments with 10 mice per group/experiment for a total of n=20 mice per condition). Data are mean ± S.E.M; *p<0.05, ***p<0.001 based on one-way ANOVA with Bonferroni’s post hoc test; n.s. indicates not significant.
Figure 1—figure supplement 2
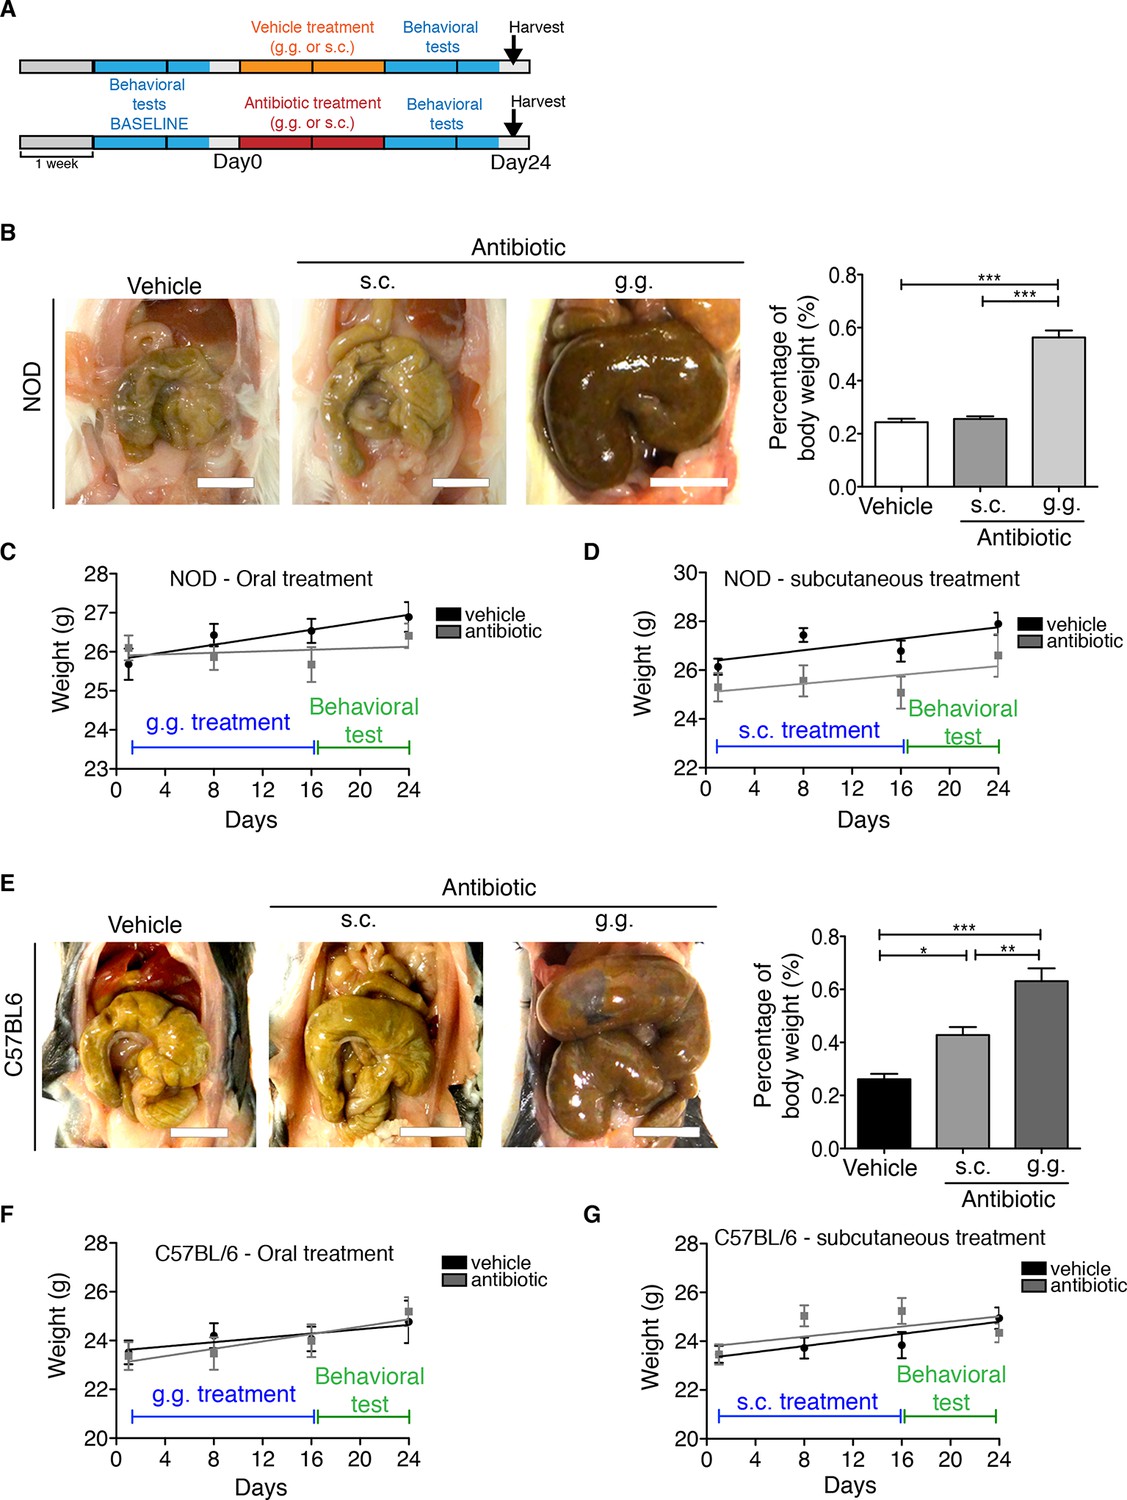
Effect of subcutaneous or oral antibiotic treatment on body weight and macroscopic appearance of large intestine.
(A) Experimental timeline. (B,E) Representative pictures of the intestine from NOD and C57BL/6 mice treated with vehicle or antibiotic (subcutaneous [s.c.] or oral administration [g.g.]); scale bar: 1 cm. Graphs represent the gut weight relative to the mouse total body weight. (C,D,F,G) Body weight monitoring in NOD (C,D) and C57BL/6 (F,G) mice (n=10 per group). Data are mean ± S.E.M; *p<0.05, **p<0.01, ***p<0.001 based on one-way ANOVA followed by Bonferroni’s post hoc test. n.s. indicates not significant.
Figure 1—figure supplement 3
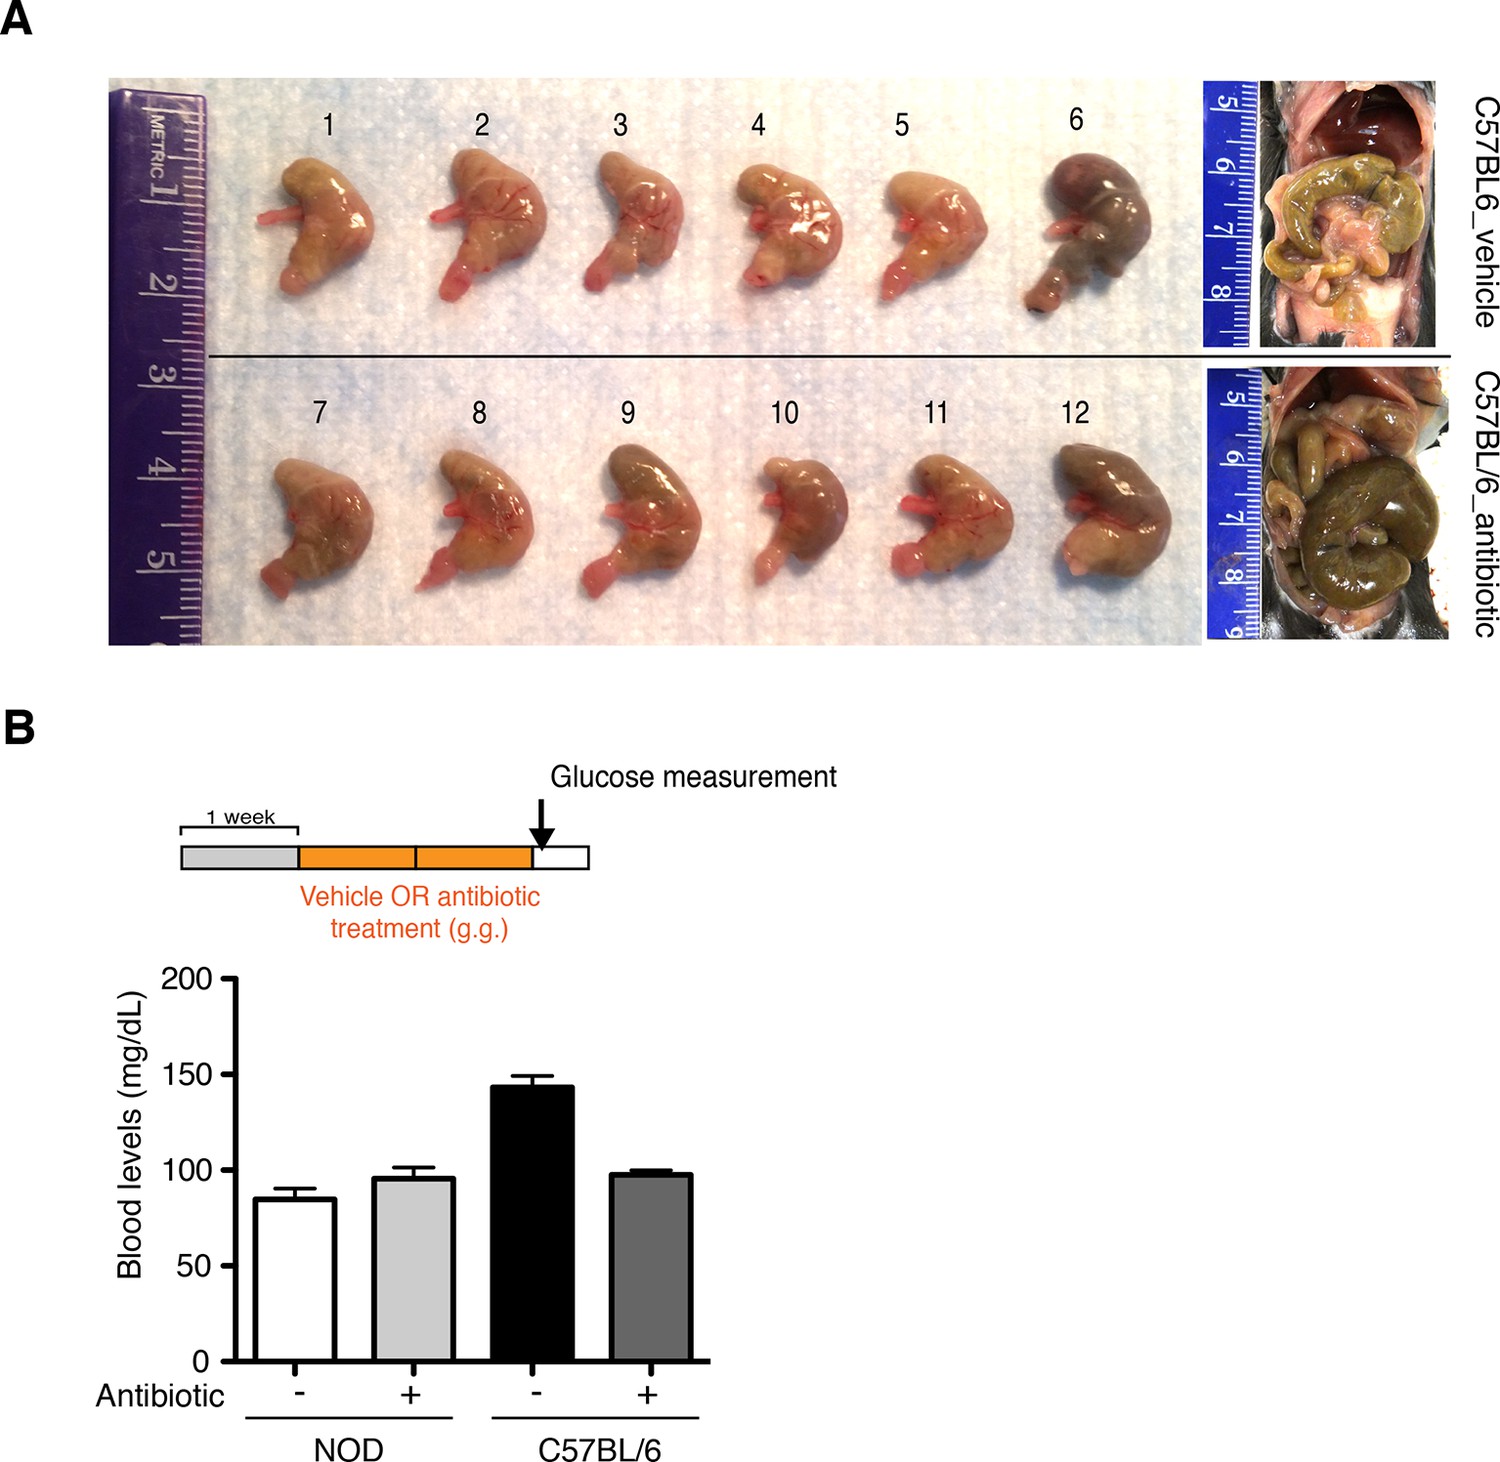
Oral antibiotic treatment is well tolerated by recipients.
(A) Representative pictures of stomachs from C57BL/6 mice treated with vehicle or antibiotic. (B) Blood glucose levels were measured after 14 days of oral treatment (antibiotic or vehicle) (n=6 per group). Normoglycemic levels were considered below 220 mg/dL.
Figure 2 with 1 supplement
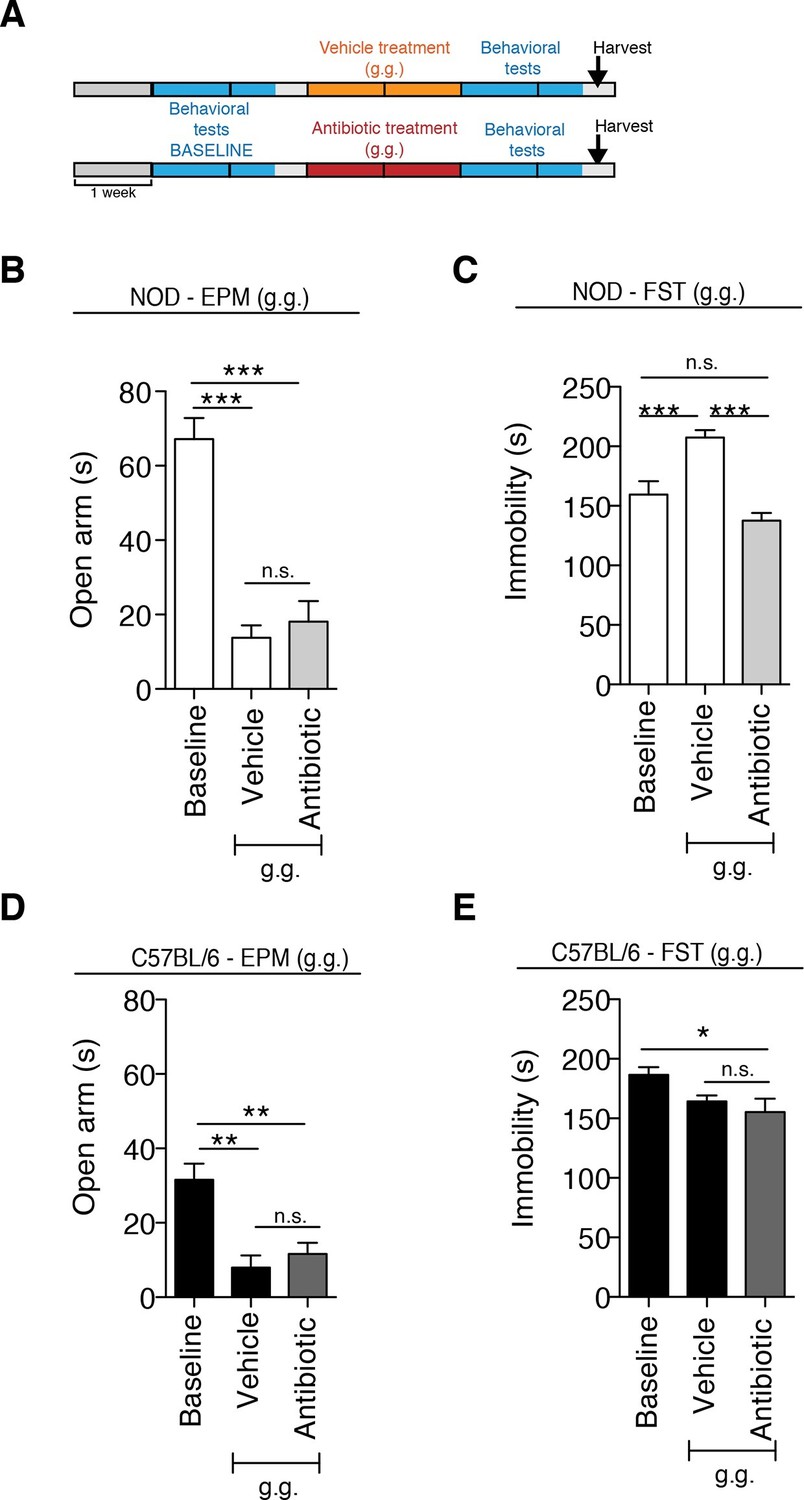
The strain-specific anxiety- and despair-like behavioral responses to daily gavage are differentially affected by oral antibiotic treatment.
(A) Experimental timeline: vehicle or antibiotic mix were administered daily by gastric gavage (g.g.) for 14 days. Behavioral testing was performed before (baseline) and after treatment. Figure shows the results for the Elevated Plus Maze (EPM) and Forced Swim Test (FST) for NOD (B, C) and C57BL/6 (D, E) mice after oral treatment (g.g.). Baseline measurements for FST were performed in a separate cohort of mice (n=10) to avoid carryover effects (3 independent experiments with 8 mice per group/experiment for a total of n=24 mice per condition). Data are mean ± S.E.M; *p<0.05, **p<0.01, ***p<0.001 based on one-way ANOVA followed by Bonferroni’s post hoc test; n.s. indicates not significant.
Figure 2—figure supplement 1

Anxiety and despair-like behaviors after subcutaneous (s.c.) vehicle or antibiotic treatment.
(A) Experimental timeline: vehicle or antibiotic mix were administered daily (s.c.) for 14 days. Behavioral testing was performed before (baseline) and after treatment. Figure shows the results for Elevated plus maze (EPM) and Forced Swim Test (FST) for NOD (B–C) and C57BL/6 (D–E) mice after s.c. treatment. Baseline measurements for FST were performed in a separate cohort of mice (n=10) to avoid carryover effects of the FST (2 independent experiments with 10 mice per group/experiment for a total of n=20 mice per condition). Data are mean ± S.E.M; *p<0.05, ***p<0.001 based on one-way ANOVA followed by Bonferroni’s post hoc test; n.s. indicates not significant.
Figure 3 with 1 supplement
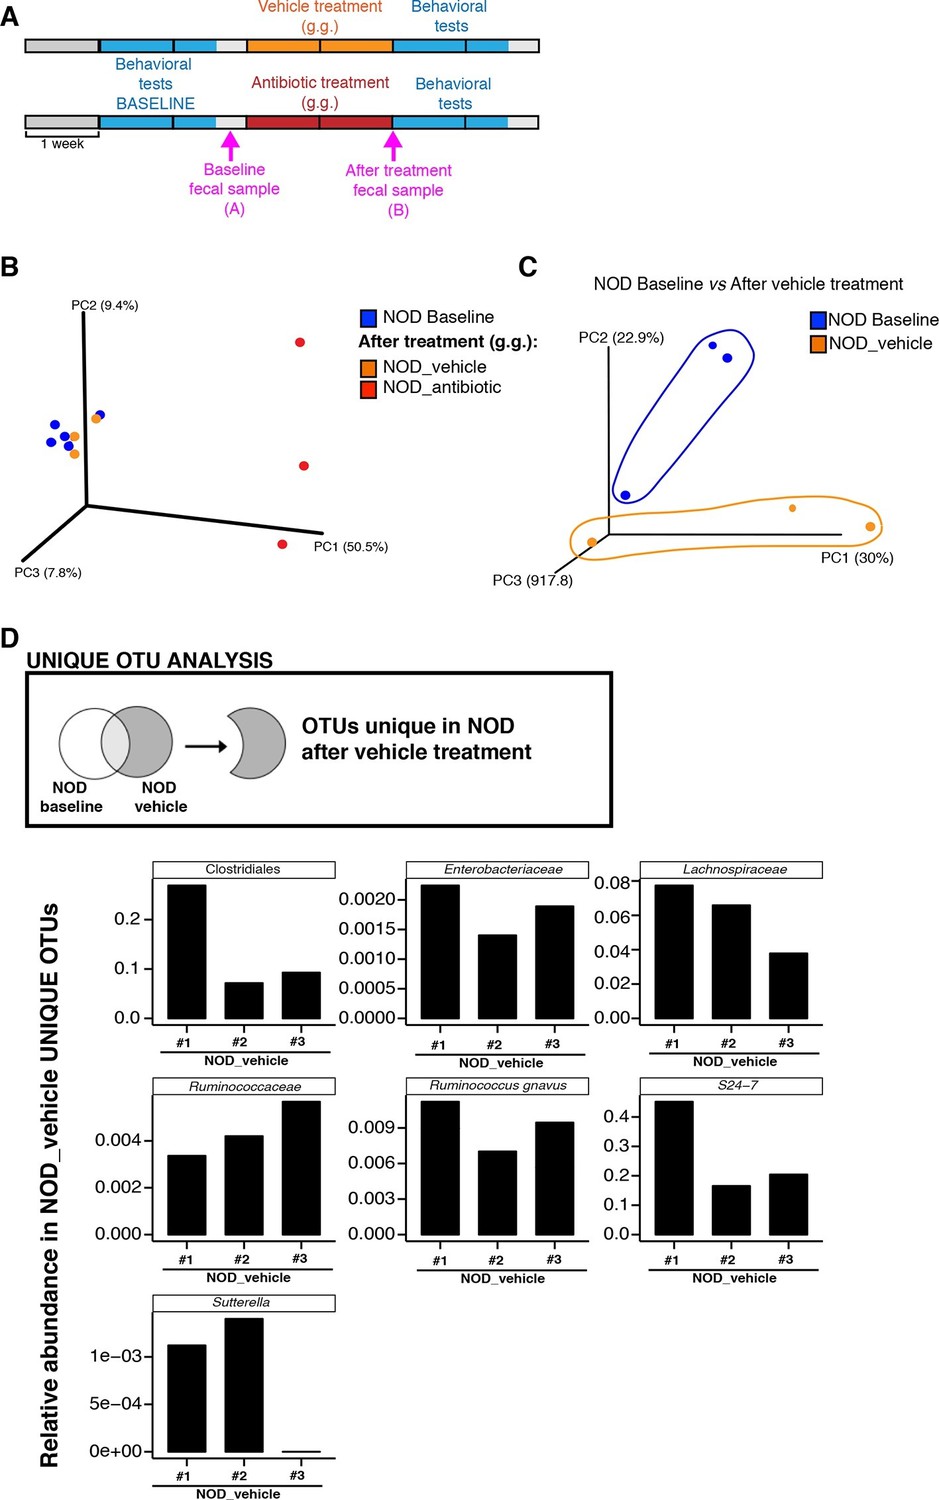
Enrichment of bacterial OTUs induced by gastric gavage (g.g.) in NOD mice.
(A) Experimental timeline indicating time points of fecal collection (arrows) relative to behavioral testing and treatment. (B,C) Principal coordinate analysis plots of unweighted UniFrac distances of microbiota in fecal samples at baseline and after 14 days of daily g.g. of antibiotics or vehicle in NOD mice. Each dot represents the microbiota of a sample (1 sample = feces pooled from 3–5 mice), color-coded by treatment (vehicle or antibiotic) and time-point. The percentage of variation explained by each principal coordinate (PC) is shown in parentheses. All samples were rarefied at 5000 sequences. (D) Analysis of unique Operational Taxonomic Units (OTUs) present in NOD vehicle-treated mice compared to their fecal microbiota at baseline. Figure shows representative taxa enriched in fecal samples of NOD vehicle-treated mice compared to their baseline samples. Each bar represents the microbiota of an individual sample (1 sample = 3–5 mice per cage). See Gacias et al. (2016).
Figure 3—figure supplement 1

Oral antibiotic treatment effectively modifies the microbiota composition in NOD and C57BL/6 mice.
(A) Principal coordinate analysis plots of unweighted UniFrac distances of microbiota from the fecal samples after 14 days of daily gastric gavage (g.g.) in NOD (left) and C57BL/6 (right) mice. Each dot represents the microbiota of a sample (1 sample = feces pooled from 3–5 mice), colored and shaped by treatment (vehicle or antibiotic). The percentage of variation explained by each principal coordinate (PC) is shown in parentheses. All samples were rarefied at 5000 sequences. (B,D) Cladogram generated from LEfSe analysis showing the most abundant taxa enriched in antibiotic- (green) or vehicle-treated (red) NOD (B) and C57BL/6 (D) mice. (C,E) Linear discriminant analysis (LDA) scores of the differentially abundant taxa in fecal pellets after oral antibiotic treatment compared to vehicle for NOD (C) and C57BL/6 (E) mice. Graphs show taxa-enriched microbiota from mice treated with antibiotic (green) or vehicle (red) with a positive or negative LDA score, respectively (significant taxa [p<0.05, Kruskal–Wallis] with LDA score >2 are shown).
Figure 4 with 2 supplements
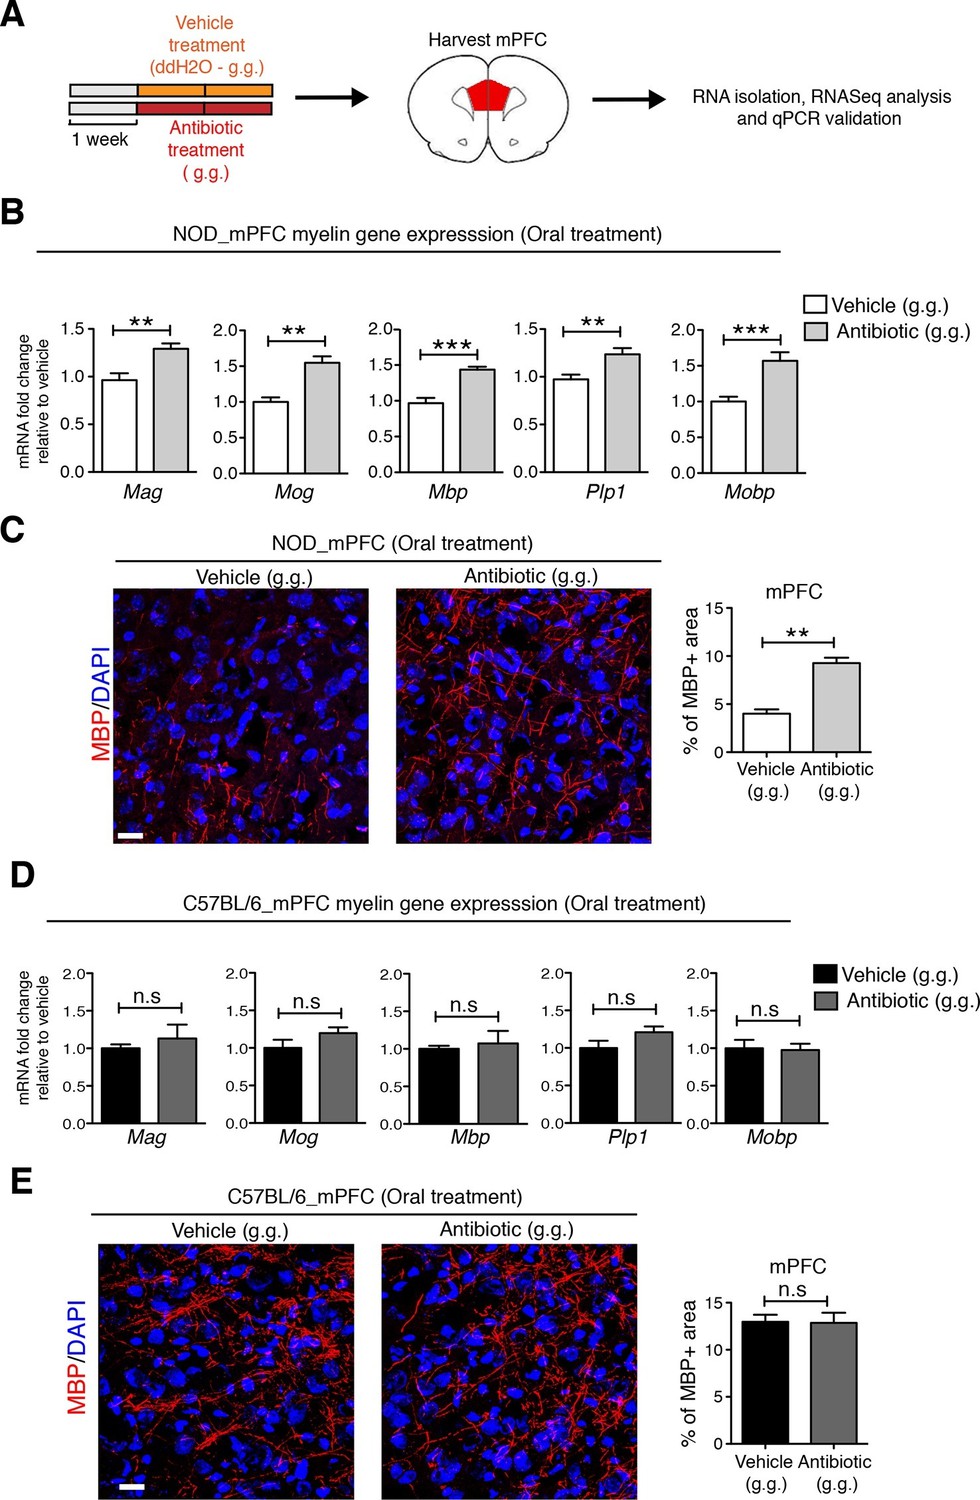
Myelin transcripts and myelinated fibers in the medial prefrontal cortex (mPFC) of adult NOD mice with social avoidance behavior.
(A) Experimental timeline: vehicle or antibiotic mix were administered daily by gastric gavage (g.g.) for 14 days and mPFC was harvested for RNA extraction and quantitative real-time qPCR or immunohistochemsitry (B,D) qPCR of myelin transcripts after vehicle or antibiotic treatment of NOD (B) and C57BL/6 (D) mice. Values were normalized to 36b4 mRNA levels and are referred as fold change relative to vehicle-treated values (n=6 mice per group). (C,E) Representative confocal images and quantification of MBP+ fibers (red) in mPFC of NOD (C) and C57BL/6 (E) mice after vehicle or antibiotic treatment. DAPI (blue) was used as nuclear counterstain. Scale bar, 50 μm. Graph represents quantification of MBP+ fibers per surface area (n=3 for NOD; n=4 for C57BL/6). Data are mean ± S.E.M; **p<0.01, ***p<0.001 based on unpaired t test. n.s. indicates not significant.
Figure 4—figure supplement 1
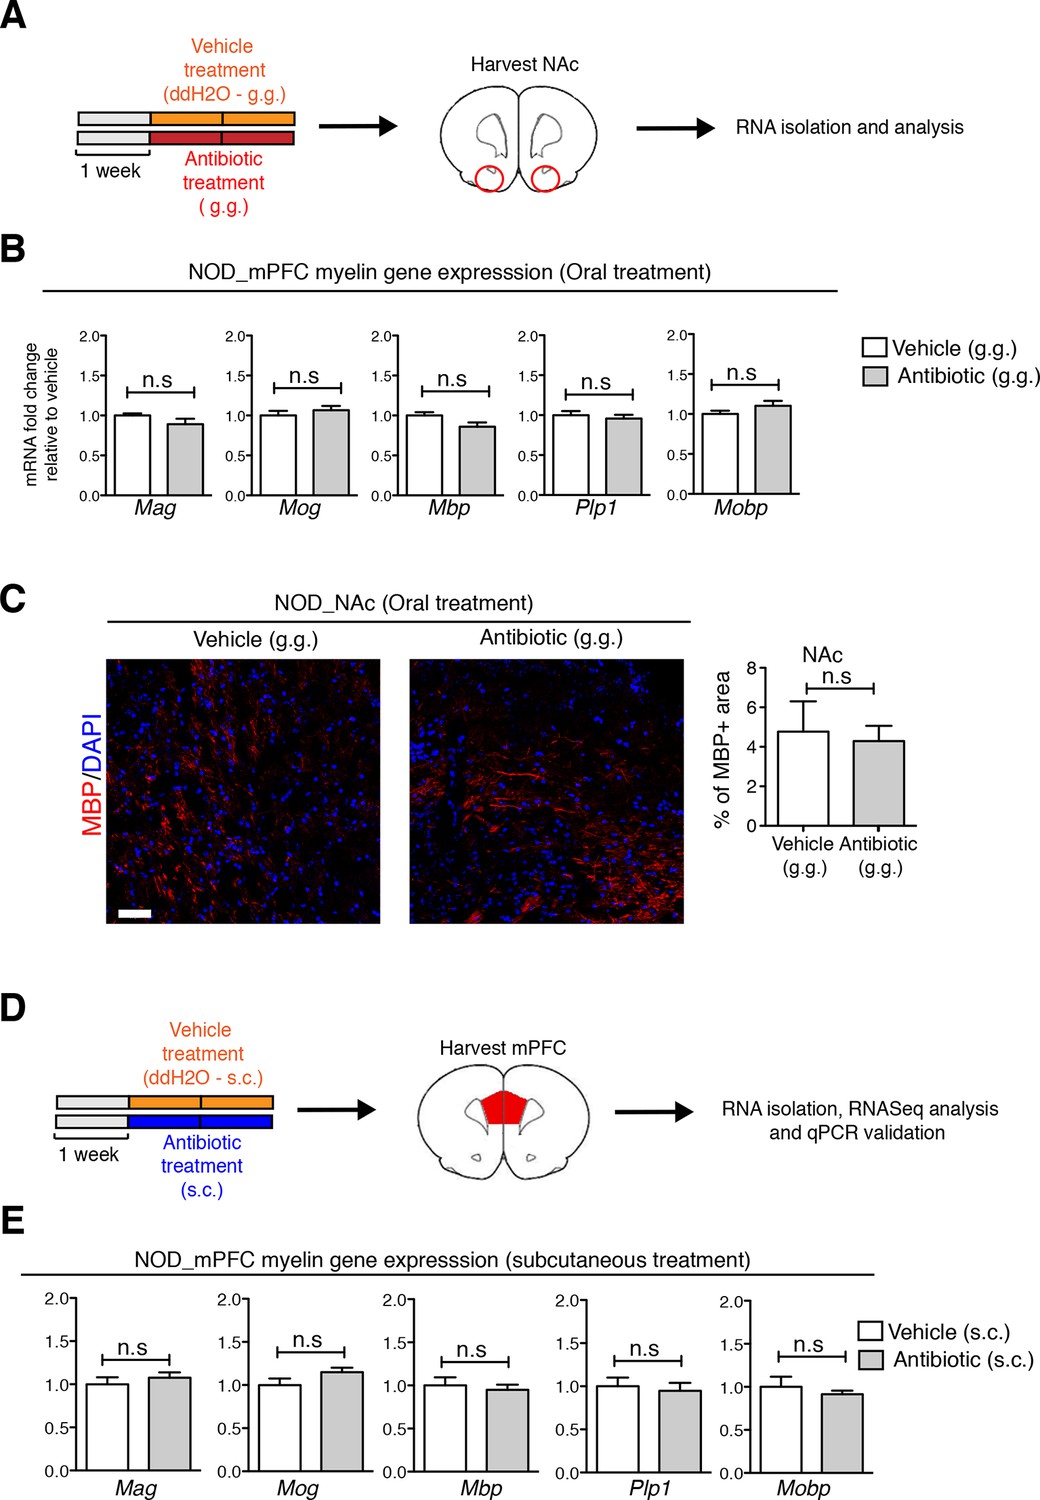
Regional specificity of myelin changes in response to antibiotic treatment.
(A) Experimental timeline: vehicle or antibiotic mix were administered daily by gastric gavage (g.g.) for 14 days and nucleus accumbens (NAc) was harvested for RNA extraction and quantitative real-time qPCR or immunohistochemsitry. (B) qPCR of myelin transcripts in the NAc after oral treatment in NOD mice. Values were normalized to 36b4 mRNA levels and are referred as fold change relative to vehicle-treated values (n=6 mice per group). (C) Representative confocal images and quantification of MBP+ myelinated fibers (red) in the NAc of NOD mice after vehicle or antibiotic treatment. DAPI (blue) was used as nuclear counterstain. Scale bar, 20 μm. Graph represents quantification of MBP+ fibers per surface area (n=3 mice per group). (D) Experimental timeline of subcutaneous treatment (vehicle or antibiotic). (E) qPCR of myelin transcripts in the mPFC after 14 days of subcutaneous treatment (s.c.). Values were normalized to 36b4 mRNA levels and referred as fold change relative to vehicle-treated values (n=6 mice per group). Data are mean ± S.E.M; statistical differences were determined using unpaired t tests. n.s. indicates not significant.
Figure 4—figure supplement 2
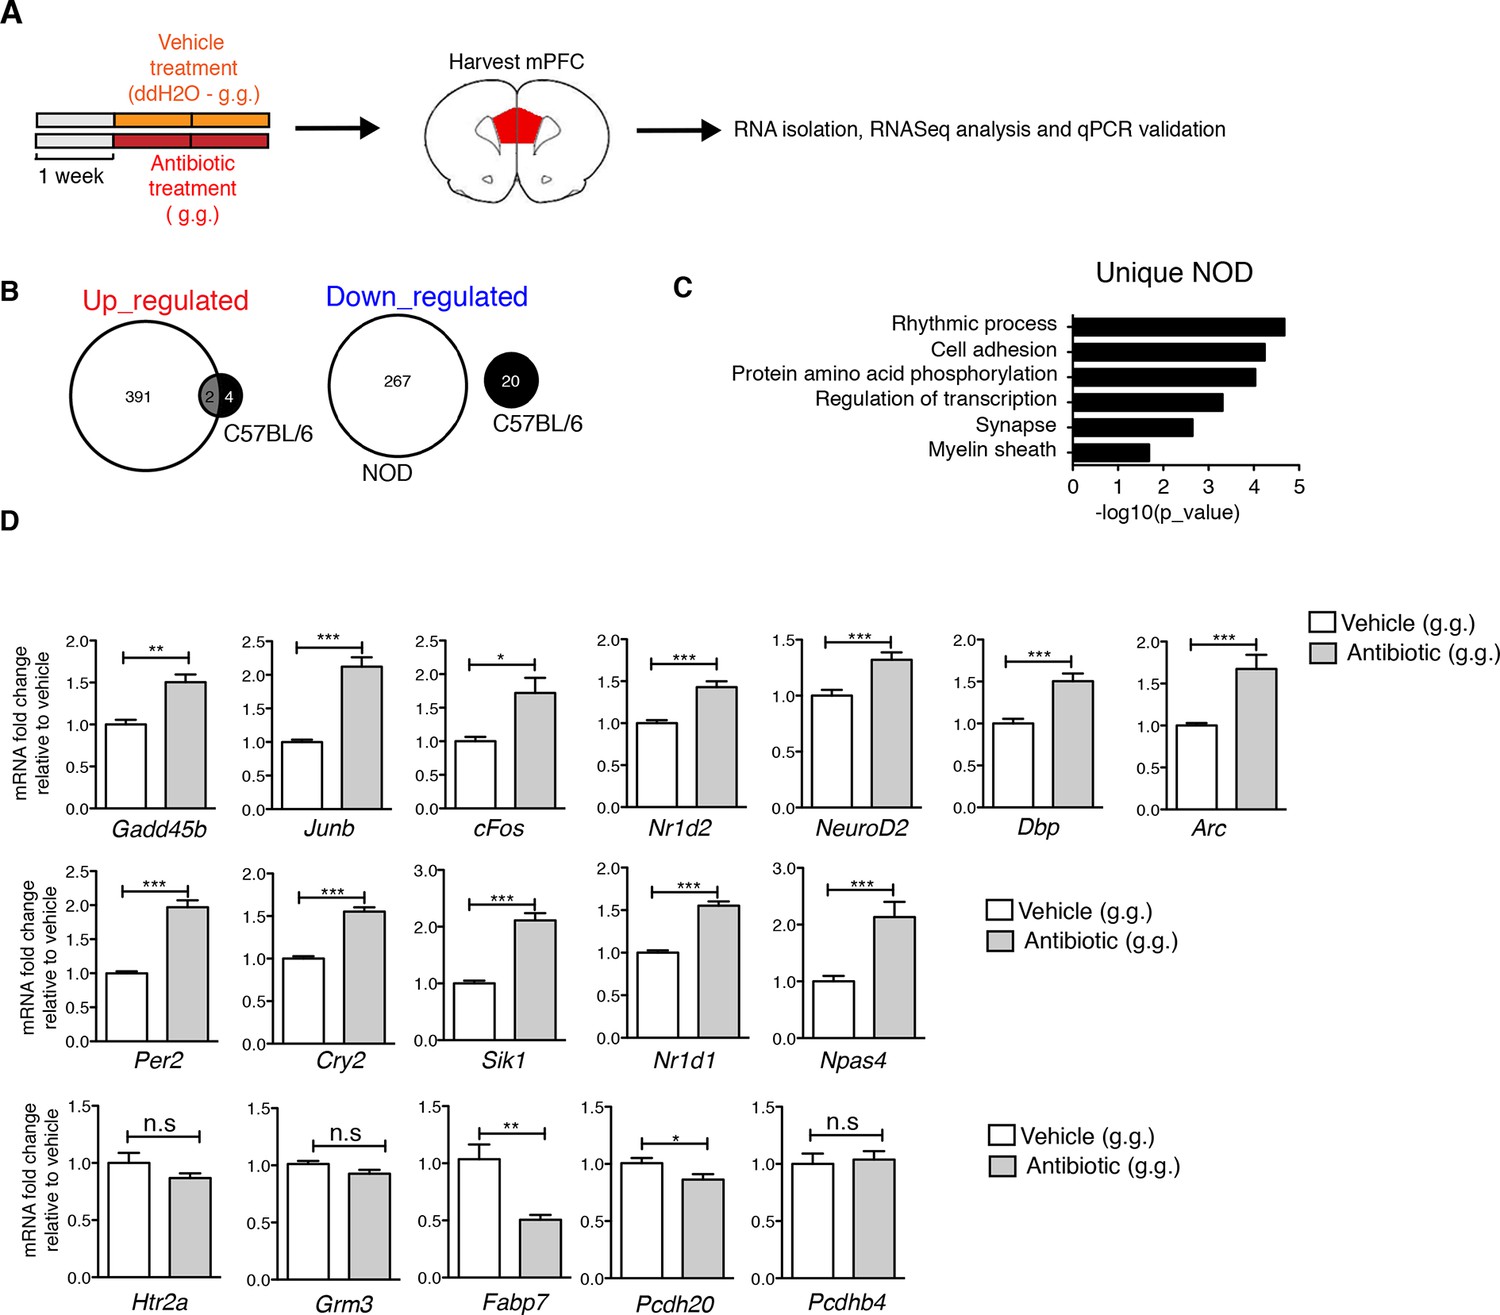
Effect of oral antibiotic treatment on the transcriptional profile in medial prefrontal cortex (mPFC).
Unbiased genome-wide transcriptomic analysis of mPFC was performed after 14 days of either oral antibiotic or vehicle treatment (NOD and C57BL/6; n=2 mice per group). (A) Experimental timeline: vehicle or antibiotic mix were administered daily by gastric gavage (g.g.) for 14 days. (B) Venn diagram representing up- and downregulated genes after antibiotic treatment in both mouse strains. (C) Graph shows the results of DAVID gene ontology analysis using uniquely differentially expressed genes between vehicle and antibiotic treated NOD mice. (D) qPCR validation of the transcriptional changes detected by RNA-sequencing. Values were normalized to 36b4 mRNA levels and are referred as fold change relative to vehicle-treated values (n=6 mice per group). Data are mean ± S.E.M; *p<0.05, **p<0.01, ***p<0.001 based on unpaired t test. n.s. indicates not significant. See Gacias et al. (2016).
Figure 5 with 1 supplement
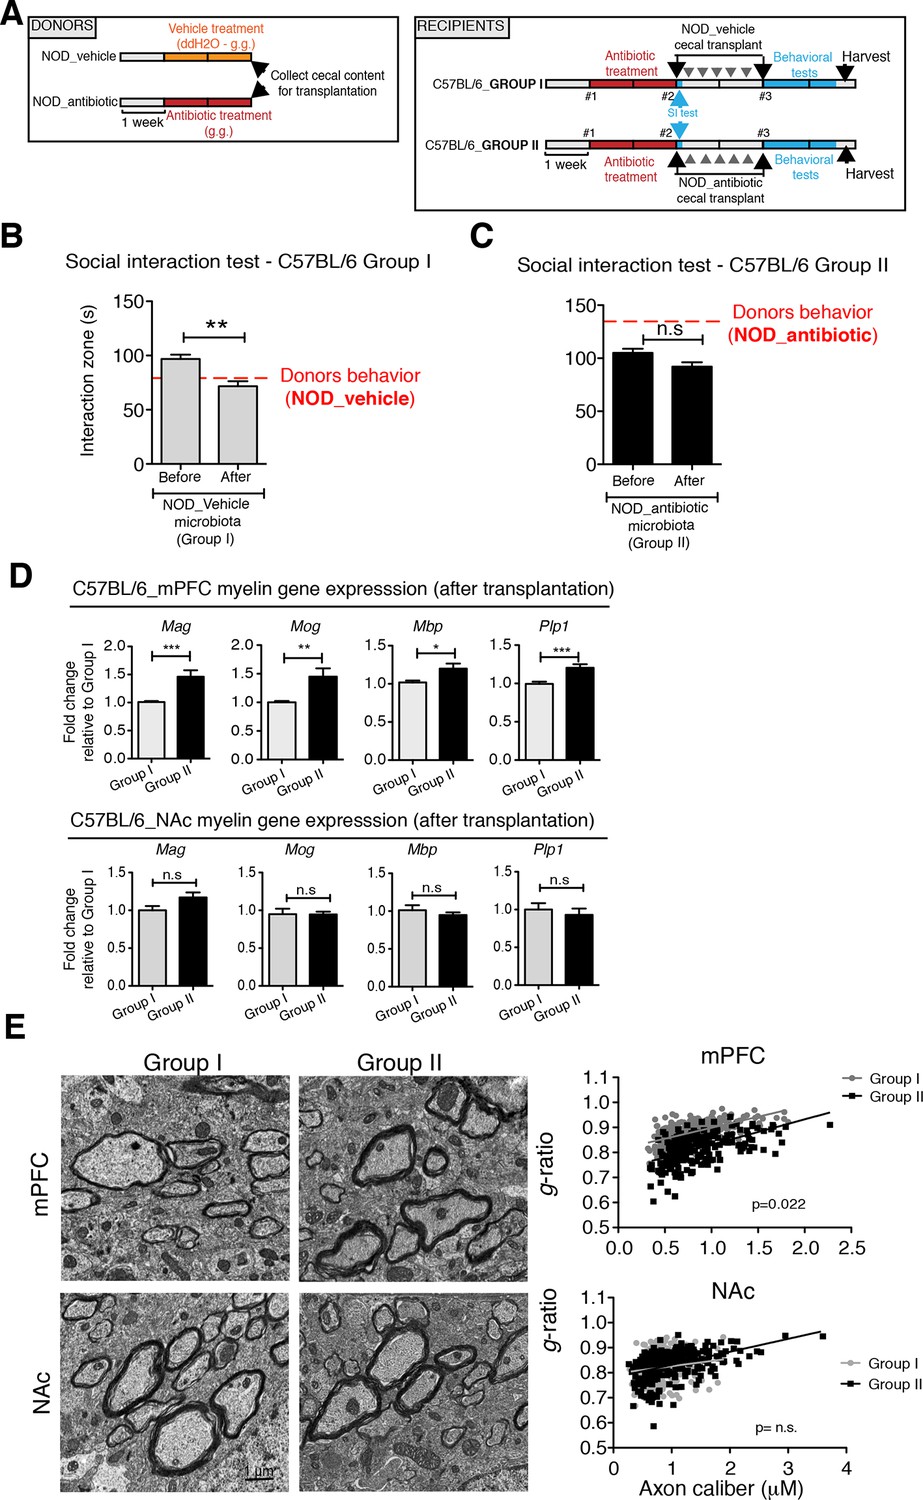
Social avoidance behavior transfer from NOD donors to microbiota depleted C57BL/6 by fecal transplantation.
(A) Experimental timeline for donor (NOD) and transplant-recipient (C57BL/6) mice. (B,C) Results from Social Interaction (SI) tests conducted in C57BL/6 recipients before and after transplantation with either microbiota from vehicle-treated (Group I; B) or antibiotic-treated (Group II, C) NOD mice. Graphs represent the amount of time spent (seconds) in the interaction zone when a target is present. Red dashed bar represents the interaction time of the NOD donors. Data are mean ± S.E.M; *p<0.05, **p<0.01 based on a two-way ANOVA (n=12 mice per experiment, 2 replicates of 12 for a total of 24 mice per condition). (D) Graphs indicate the relative levels of myelin gene transcripts in mPFC and NAc of C57BL/6 recipients displaying (Group I) or not displaying (Group II) social avoidance behavior after transplantation with NOD microbiota (n=6–8 mice per group; *p<0.05, **p<0.01, ***p<0.001 based on unpaired t test). (E) Electron micrographs and quantified g-ratios of myelinated axons in mPFC and NAc in Group I and Group II C57BL/6 recipients after transplantation with the NOD microbiota. Scale bar, 1 μm. (n=3 per treatment and condition; statistical differences between groups were determined using two-tailed t-test; n.s. indicates not significant).
Figure 5—figure supplement 1
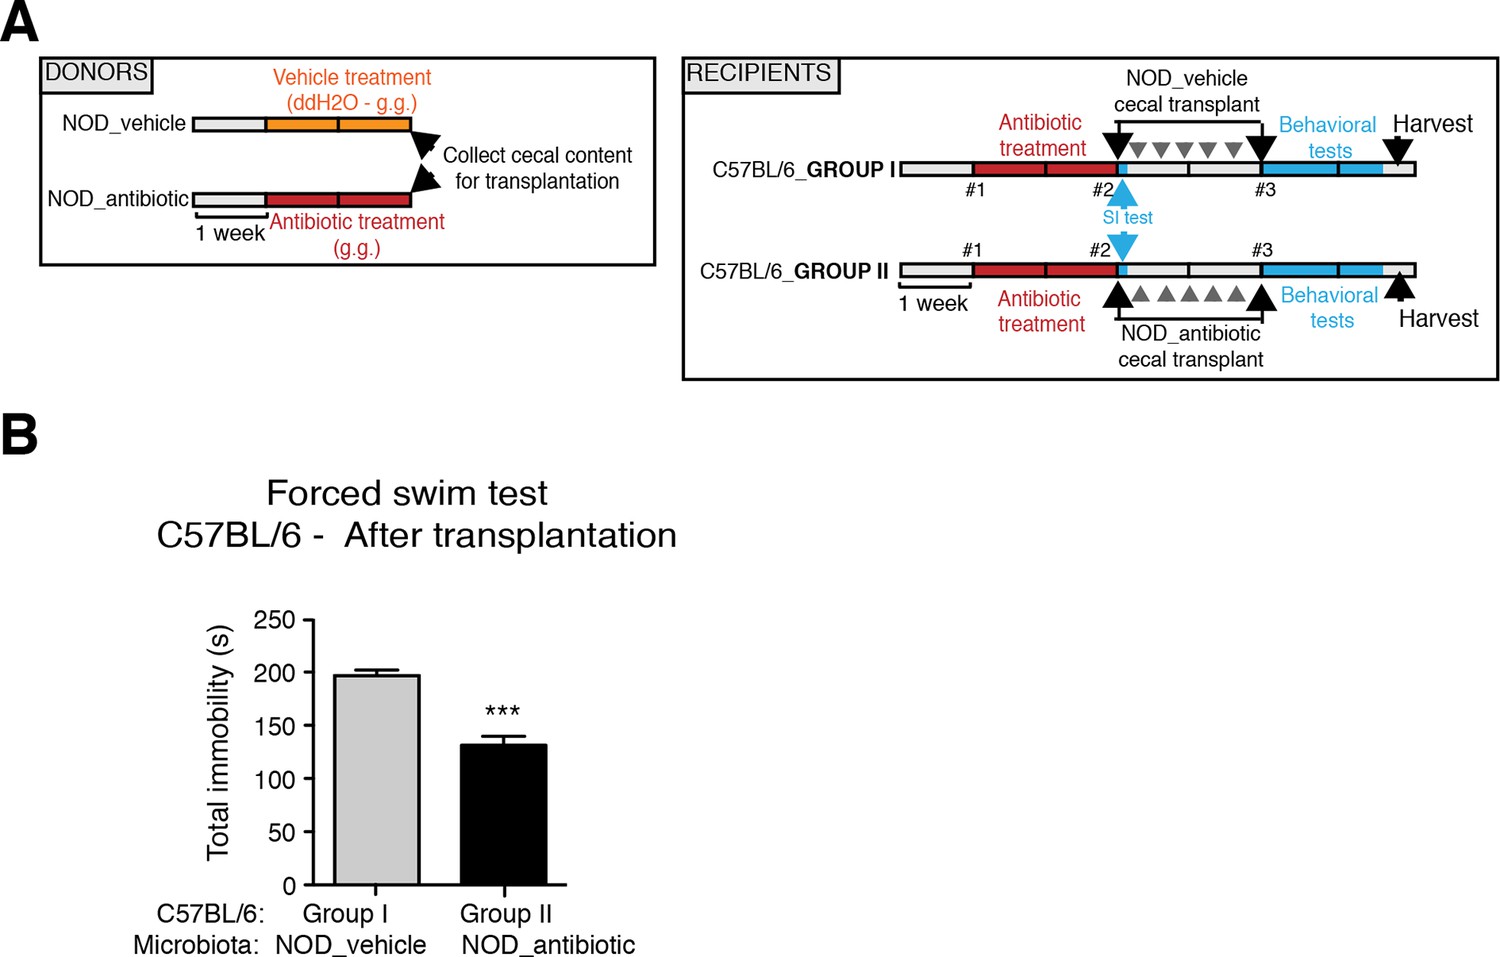
Effect of NOD vehicle-treated microbiota on the despair-like behavior of C57BL/6 recipients.
(A) Experimental timeline for donor (NOD) and transplanted recipient mice (C57BL/6). Despair-like behavior in colonized C57BL/6 mice was tested after transplantation. (B) Effect of NOD cecal microbiota transfer on despair-like behavior measured as immobility time in the Forced Swim Test (FST) after transplantation. Data are mean ± S.E.M; ***p<0.001 based on a unpaired t-test (n=12 mice per experiment, 2 replicates of 12; total of 24 mice per condition).
Figure 6 with 3 supplements
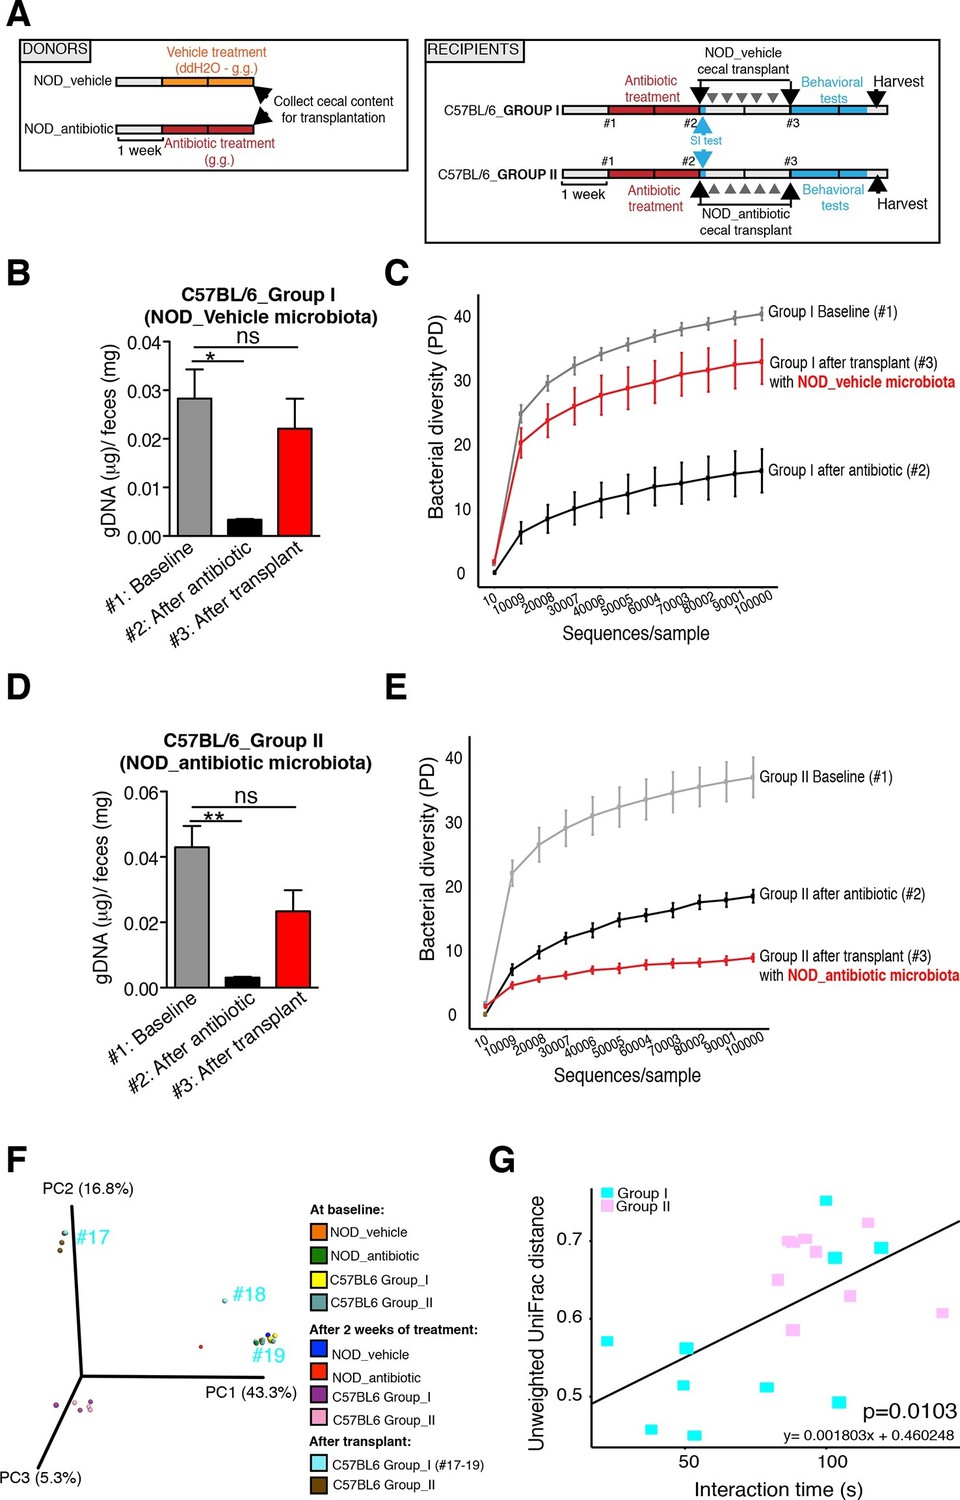
Effect of fecal transplantation on bacterial mass and biodiversity in microbiota depleted C57BL/6 recipients.
(A) Experimental timeline for donors (NOD) and transplanted recipients (C57BL/6). (B,C) Graphs represent fecal biomass (µg of gDNA relative to total fecal weight) of C57BL/6 recipients prior to transplantation (#1 before and #2 after 14 days of antibiotic treatment) and at end point after-transplantation (#3) with donor microbiota (n=3 pooled samples per time-point, each sample represents 1 sample = pooled feces from 3–5 mice. Data are mean ± S.E.M; *p<0.05, **p<0.01 based on one-way ANOVA with Bonferroni’s post hoc test). (C,E) Rarefaction curves comparing alpha diversity of fecal microbiota samples from C57BL/6 recipients at different experimental time-points (#1, #2, and #3). (F) Principal coordinate analysis plot of unweighted UniFrac distances of fecal samples from NOD donors and C57BL/6 mice at different time-points. (#1, #2, and #3). Each dot represents the microbiota of a sample, colored by group, treatment, and time-point (n=3 pooled samples per time-point; each sample corresponds to pooled feces from 3–5 mice). The percentage of variation explained by each principal coordinate (PC) is shown in parentheses. (E) Relationship between social interaction time and unweighted UniFrac distance to NOD donor mice (n=3) for all C57BL/6 recipients (n=10). Each point represents a single C57BL/6 animal, colored by group (light blue: Group_I, transplanted with NOD-vehicle microbiota; pink: Group_II, transplanted with NOD-antibiotic microbiota). Linear regression analysis indicates a significant correlation (p=0.0103) between the variables.
Figure 6—figure supplement 1
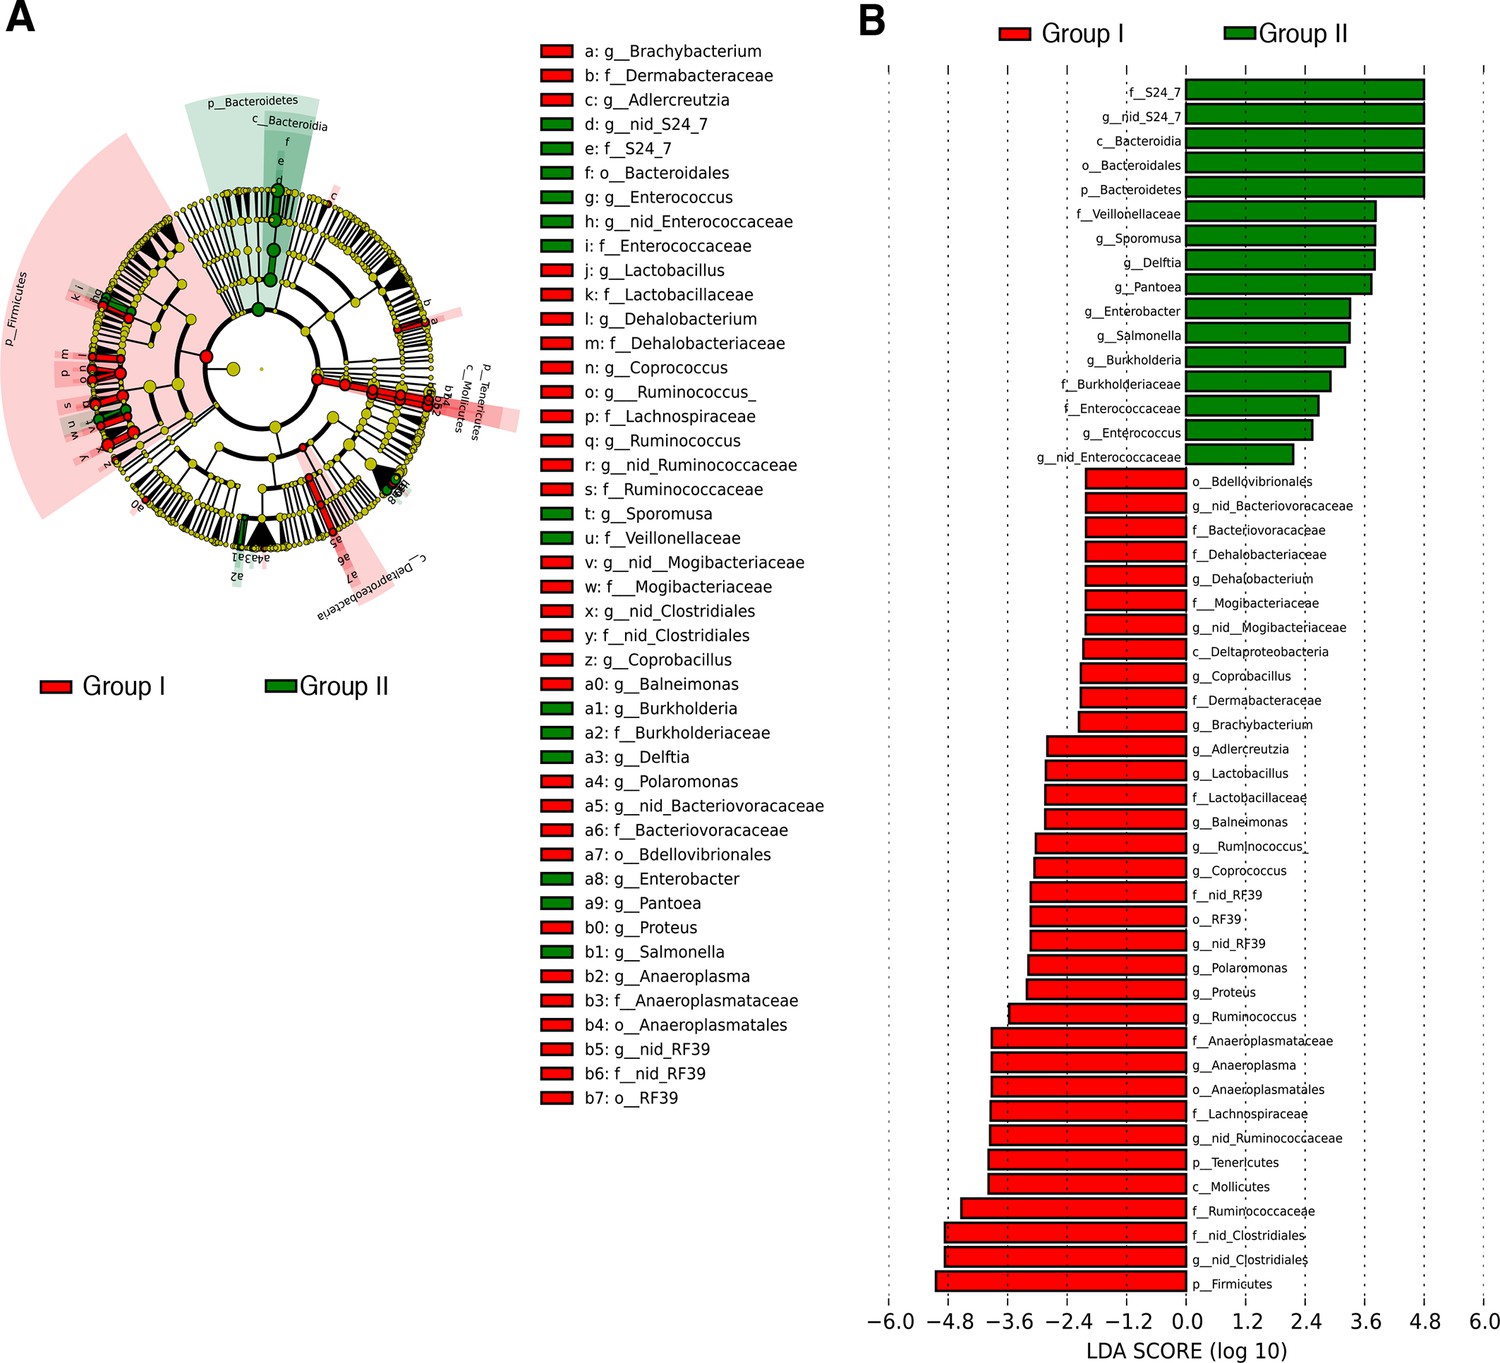
Transfer of social avoidance behavior is associated with altered colonic composition of the microbiota.
(A) Cladogram generated from LEfSe analysis showing the most differentially abundant taxa enriched in C57BL/6 recipients with (Group I, red) or without (Group II, green) social avoidance behavior. (B) Linear discriminant analysis (LDA) scores of the differentially abundant taxa in cecal tissue from C57BL/6 recipients with (Group I, red) or without (Group II, green) social avoidance behavior. Graphs shows taxa enriched with a positive or negative LDA score (significant taxa [p<0.05, Kruskal–Wallis] with LDA score >2 are shown) (n=10–12 samples per group). See Gacias et al. (2016).
Figure 6—figure supplement 2
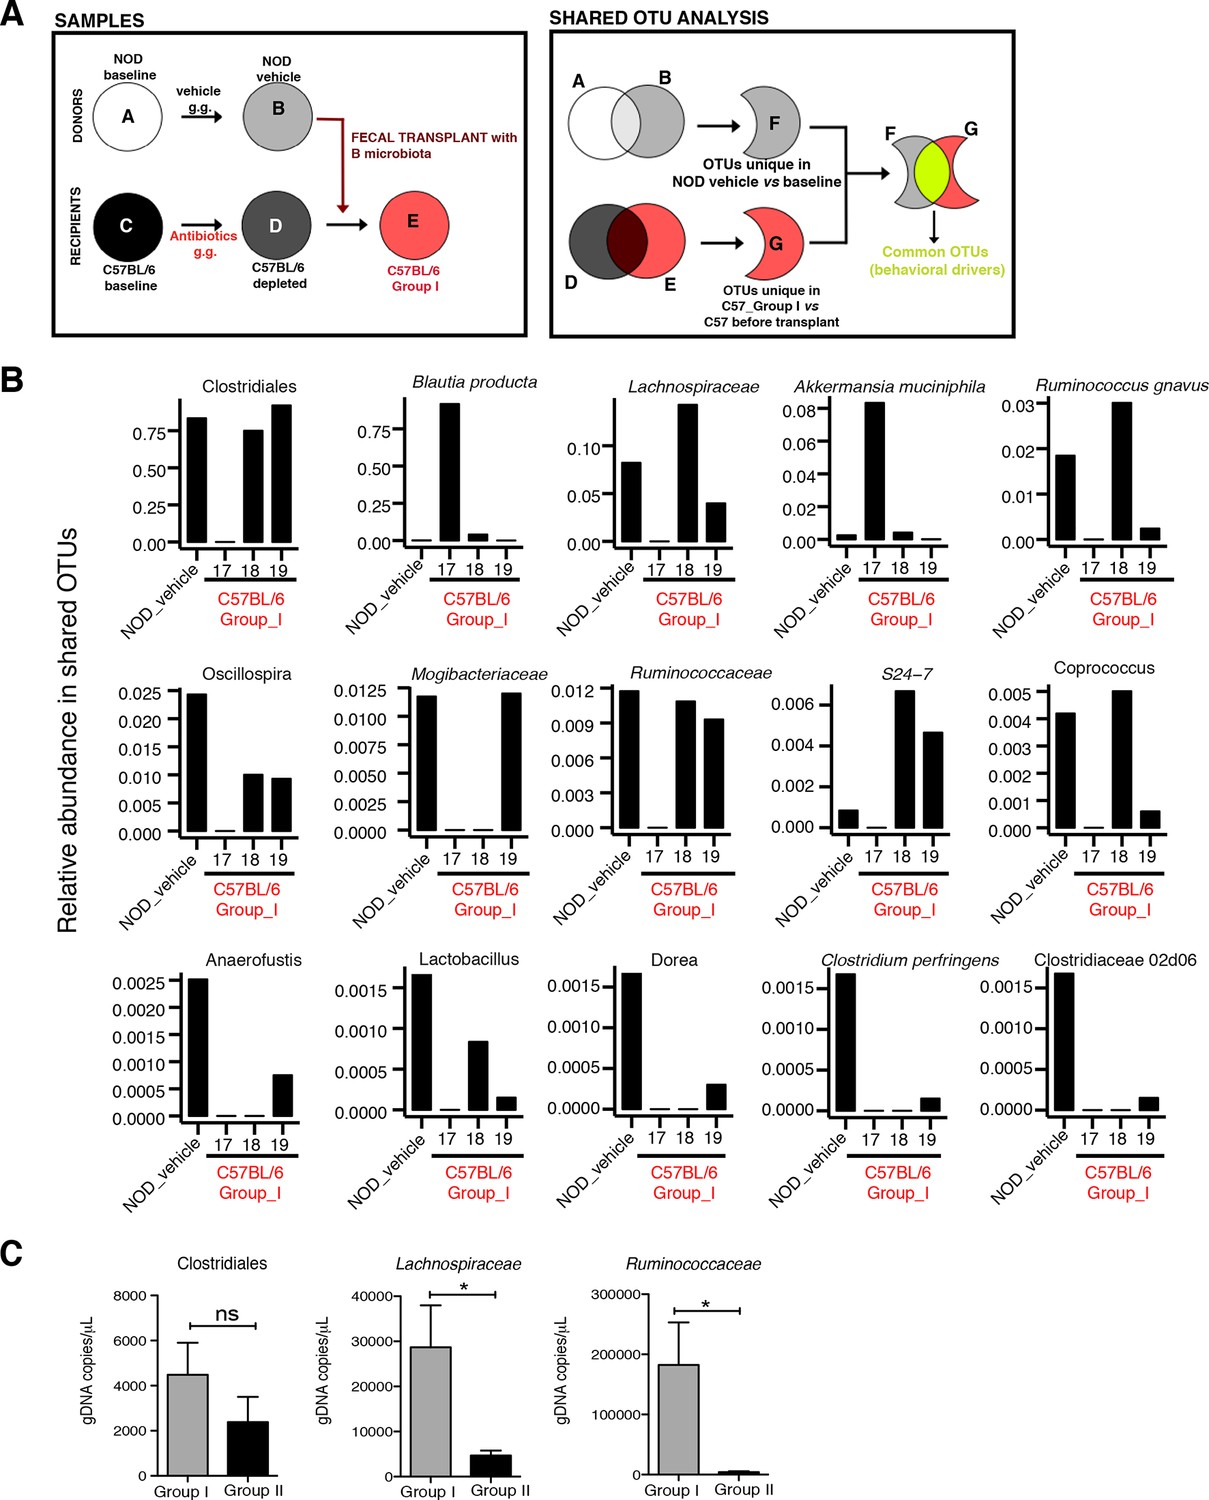
Social avoidance behavior is associated with enrichment of specific OTUs.
(A) Schematic representation of microbiota and Operational Taxonomic Unit (OUT) analysis. (B) Relative abundance of the OTUs enriched in mice with social avoidance behavior (vehicle-treated NOD donors) and C57BL/6 Group I recipients (samples #18–19). Note that the sample #17 was from mice without the behavioral phenotype. See Gacias et al. (2016). (C) Quantitative real-time PCR analysis of genomic DNA extracted from gut tissue of C57BL/6 mice transplanted with microbiota from vehicle- or antibiotic-treated NOD mice (Group I and Group II, respectively) to quantify total bacteria of the order Clostridiales, and the families of Lachnospiraceae and Ruminococcaceae (n=6 mice per group). Data are mean ± S.E.M; *p<0.05 based on unpaired t test; n.s. indicates not significant.
Figure 6—figure supplement 3
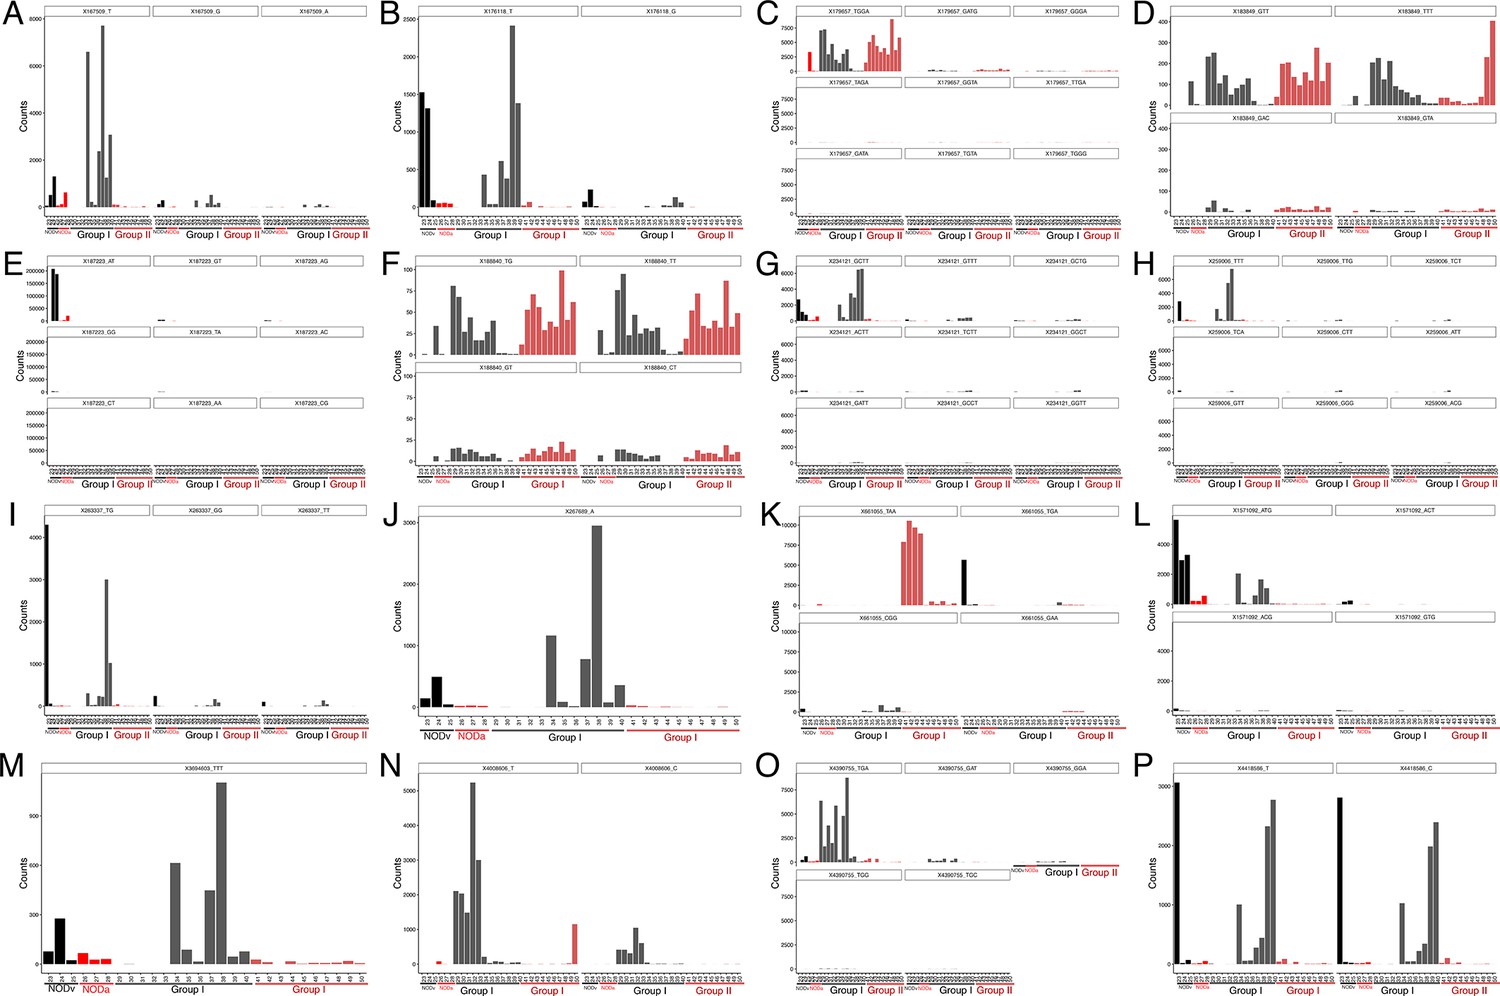
Oligotype analysis of gut tissue samples.
Each panel represents the counts per sample for different oligotypes, identified by nucleotide sequence, within a specific Operational Taxonomic Unit (OTU), named by its Greengenes 13–8 identifier. Individual samples are represented in x axis and colored by group; Black: NOD_vehicle donors (NODv), Red: NOD_antibiotic donord (NODa); Gray: C57BL/6 Group I (transplanted with NOD vehicle-treated microbiota); light red: C57BL/6 Group II (transplanted with NOD antibiotic-treated microbiota) (A) OTU 167509 g__Oscillospira; s__ (B) OTU 176118 g__Oscillospira; s__ (C) OTU 179657 f__Lachnospiraceae; g__; s__ (D) OTU 183849 g__Blautia; s__producta (E) OTU 187223 g__Ruminococcus; s__ (F) OTU 188840 f__Lachnospiraceae; g__; s__ (G) OTU 234121 o__Clostridiales; f__; g__; s__ (H) OTU 259006 o__Clostridiales; f__; g__; s__ (I) OTU 263337 g__Oscillospira; s__ (J) OTU 267689 f__Ruminococcaceae; g__; s__ (K) OTU 661055 o__Clostridiales; f__; g__; s__ (L) OTU 1571092 o__Clostridiales; f__; g__; s__ (M) OTU 3694603 f__Lachnospiraceae; g__; s__ (N) OTU 4008606 f__Lachnospiraceae; g__; s__ (O) OTU 4390755 g__Anaeroplasma; s__ (P) OTU 4418586 o__Clostridiales; f__; g__; s__.
Figure 7
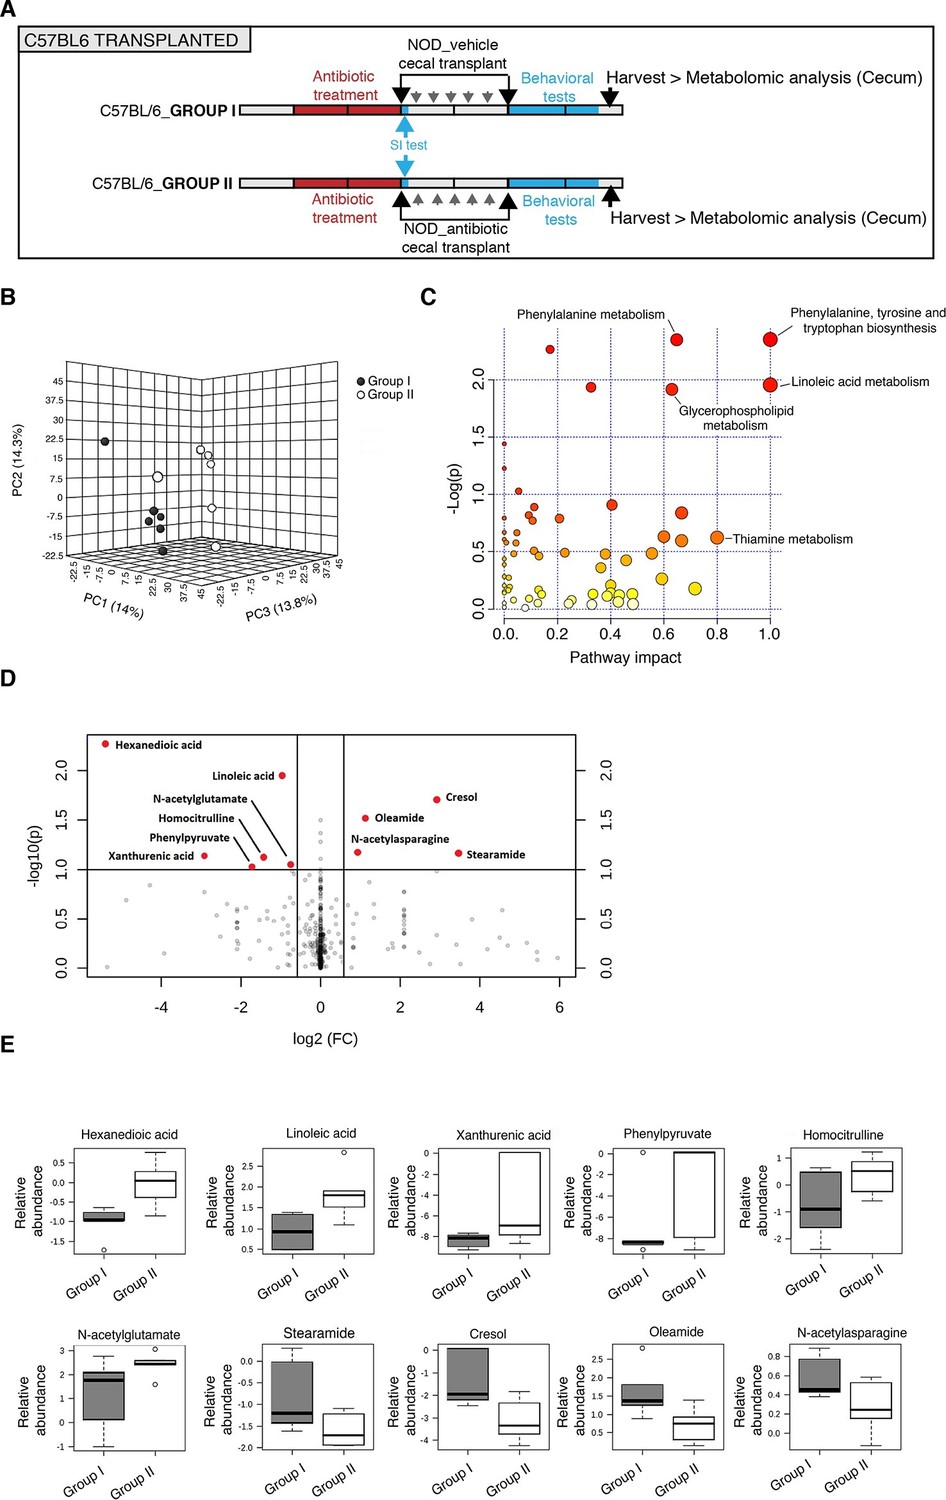
Metabolomic analysis of gut tissue from microbiota-transplanted C57BL/6 mice.
(A) Experimental timeline. (B) 3D plot of scores between selected components generated by PLS-DA analysis comparing Group I (transplanted with microbiota from vehicle-treated NOD mice; filled circles) and Group II (transplanted with microbiota from antibiotic-treated NOD mice; open circles). (C) Metabolic pathway impact overview generated with MetaboAnalyst 3.0. Unaltered pathways have a score of 0, and the most impacted pathways have higher scores. Pathways having the least statistical significance score are uncolored, whereas pathways having a high statistical significance score are colored in red. See Gacias et al. (2016). (D) Metabolites with the greatest differential between mice with (Group I) and without (Group II) behavioral phenotype, were selected by volcano plot with a fold-change threshold of 1.5 (x axis) and t test threshold of 0.1 (y axis). Red circles represent metabolites above the threshold (Group II vs Group I); see Table 1. (E) One-way analysis of variance box and whisker plots illustrating the metabolite changes observed in Groups I and II. The y axis illustrates normalized, log transformed, and scaled peak area. Horizontal lines within the boxes represent the group means. Open circles represent excluded levels (outliers) (n=6 mice per group).
Figure 8

Cresol treatment decreases myelin gene expression.
(A) Transcript levels of oligodendrocyte lineage (Olig2), progenitor (Pdgfrα, Cspg4) and differentiation (Mag, Mog, Mbp, Cnp, Sox10) markers in oligodendrocyte progenitors cultured in differentiating conditions and treated with increasing concentrations of cresol (0, 10, 50 μM). DMSO was used as vehicle and negative control. Values were normalized to 36b4 mRNA levels and are referred as fold change relative to the control group (n=3 independent primary cultures). (B,C) Representative confocal images and quantification of early differentiated oligodendrocytes (CNP+/OLIG2+) after treatment with increasing concentrations of cresol (0, 10, 50 μM) for 24 hr. (D,E) Representative confocal images and quantification of oligodendrocytes (OLIG2+/DAPI+) treated with increasing concentrations of cresol (0, 10, 50 μM) for 24 hr. Scale bars, 20 μm; 10–15 fields (20×) per condition/experiment; n=2 independent primary cultures. Data are mean ± S.E.M; *p<0.05, ***p<0.001 based on one-way ANOVA with Dunnett's Multiple Comparison Test; n.s. indicates not significant
Tables
Table 1
Summary of trends in levels of cecal metabolites in C57BL/6 transplanted mice (Group II vs Group I).
| Super Pathway | Sub-pathway | Metabolite | Fold change (Group II vs I) | p value |
|---|---|---|---|---|
| Amino acid | Phenylalanine metabolism | Benzoic Acid | 1.01 | 0.031786 |
| Amino acid | Alanine, aspartate and Glutamate metabolism | N-acetylasparagine | 0.52 | 0.066953 |
| Amino acid | Tryptophan metabolism | Xanthurenic acid | 7.55 | 0.072748 |
| Amino acid | Urea cycle | Homocitrulline | 2.7 | 0.075261 |
| Amino acid | Arginine and proline metabolism | N-acetyl-glutamate | 1.68 | 0.08886 |
| Amino acid | Phenylalanine metabolism | phenylpyruvate | 3.3 | 0.094054 |
| Carbohydrate | Pentose phosphate pathway | Sedoheptulose-7- phosphate | 0.99 | 0.05242 |
| Cofactors and vitamins | Microbial metabolism in diverse environments | cresol | 0.13 | 0.019692 |
| Lipid | Fatty acids | Hexanedioic acid | 42.32 | 0.0053711 |
| Lipid | Long chain fatty acid | Linoleic acid | 1.95 | 0.011101 |
| Lipid | Long chain fatty amide | Oleamide | 0.46 | 0.030305 |
| Lipid | Long chain fatty acid | dihydroxystearic acid | 1.02 | 0.042845 |
| Lipid | Long chain fatty amide | Stearamide | 0.09 | 0.068105 |
| Nucleotide | Purine metabolism | cAMP | 0.99 | 0.077892 |
-
Data were analyzed using comprehensive global mass spectrometry-based metabolomics analysis. Additional details are provided in Experimental Procedures.
Download links
A two-part list of links to download the article, or parts of the article, in various formats.
Downloads (link to download the article as PDF)
Open citations (links to open the citations from this article in various online reference manager services)
Cite this article (links to download the citations from this article in formats compatible with various reference manager tools)
Microbiota-driven transcriptional changes in prefrontal cortex override genetic differences in social behavior
eLife 5:e13442.
https://doi.org/10.7554/eLife.13442


