An ancient yet flexible cis-regulatory architecture allows localized Hedgehog tuning by patched/Ptch1
- University of Michigan Medical School, United States
- University Of Michigan Medical School, United States
- Harvard University, United States
- The Jackson Laboratory, United States
- National Institutes of Health, United States
- University of Southern California Keck School of Medicine, United States
Figures
Figure 1

The promoter-proximal Hedgehog/Gli-responsive enhancer of patched is not sufficient to respond to Hh signaling in the embryo.
(A) Summary of the conserved Hh-Gli-Ptc pathway feedback loop. (B) Promoter-proximal region of D. melanogaster patched (ptcprox). Optimal Ci/Gli binding sites are shown as red bars; sequence conservation among Drosophila species is indicated by the histogram at bottom. (C) Wing imaginal disc from a ptc-lacZ enhancer-trap larva, showing the ptc wing expression pattern. (D–E) Larval wing discs carrying ptcprox-GFP reporter transgenes with the minimal hsp70 promoter and either intact (D) or mutated (E) Gli sites. Sequences can be found in Supplementary file 1. (F) Stage 12 ptc-lacZ embryo. (G) The ptcprox enhancer is unresponsive to Hh in the embryonic ectoderm.
Figure 2 with 1 supplement
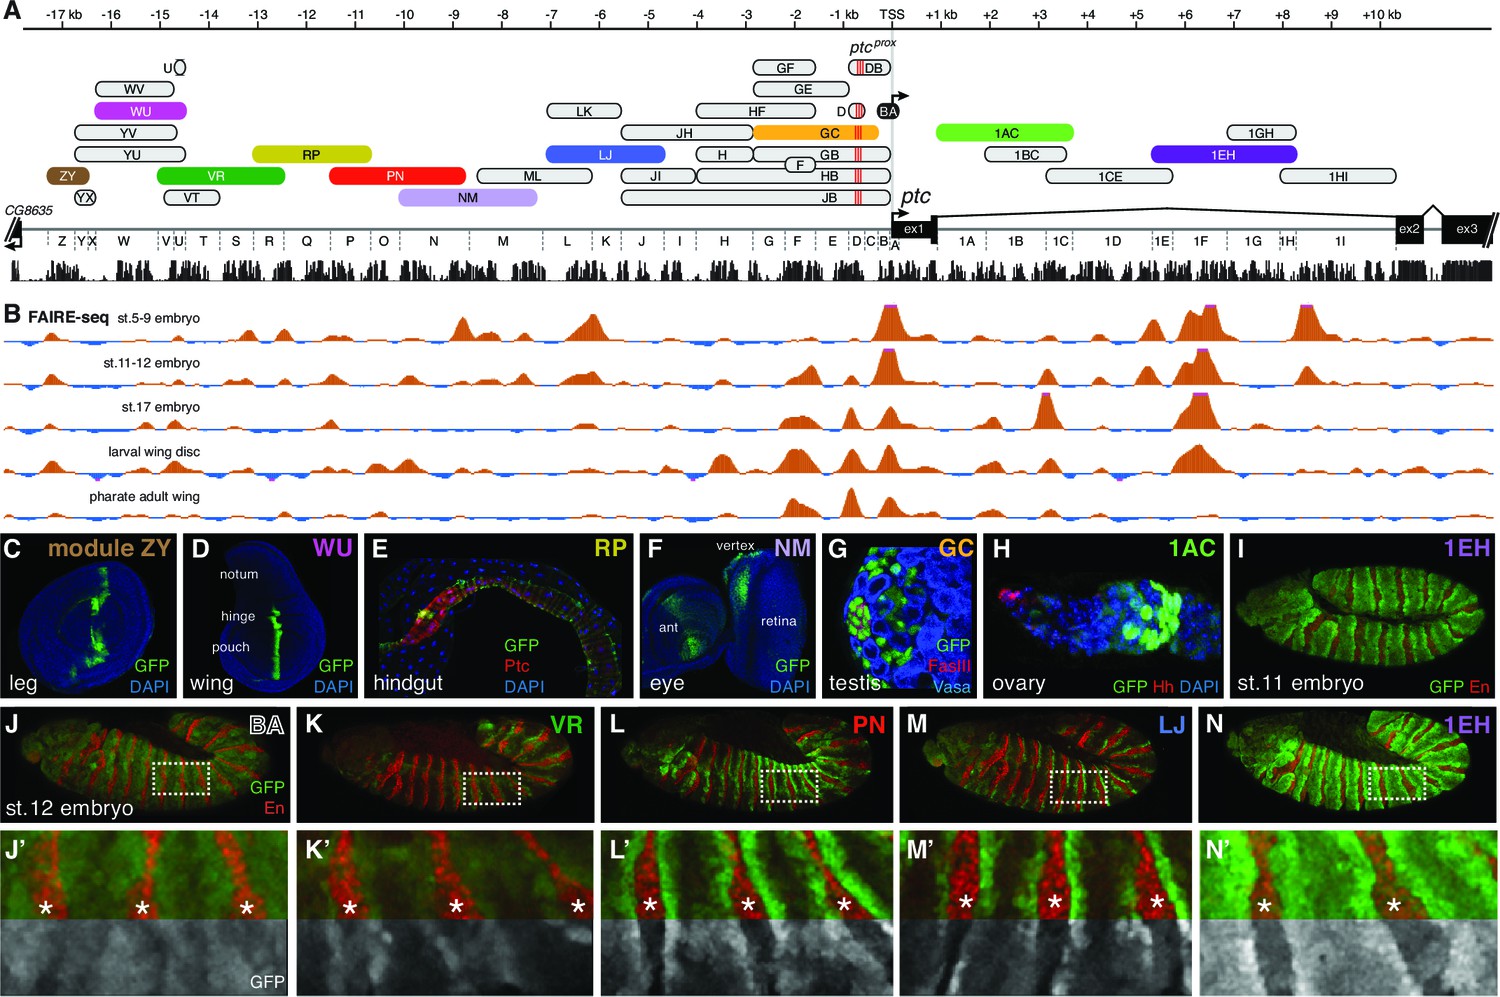
The universal Hedgehog response of patched is mediated by a large array of tissue- and stage-specific enhancers.
(A) The ptc genomic locus. DNA regions tested for in vivo enhancer activity are shown as oblong shapes; a sequence conservation histogram is shown below the exon map. (B) In vivo DNA accessibility at the ptc locus, as determined by FAIRE-seq across various developmental stages and tissues (McKay and Lieb, 2013); DNAse-seq data are shown in Figure 2—figure supplement 1. (C–I) Selected larval, adult, and embryonic tissues from GFP transgenic animals. Enhancer names are as in (A). (J) Activity of the ptcBA promoter region in a stage 12 embryo, driving broad, low expression in the anterior (En-negative) compartment of each segment. (K–N) ptc-like ectodermal stripes driven by four separate ptc enhancers in cis to the ptcBA promoter. (J’–N’) Enlarged views of dashed boxes in (J–N); asterisks show stripes of En-positive, Hh-producing cells in the posterior compartment of each segment. GFP signals are isolated (greyscale) in the lower half of K'–N' to show the lack of stripe enhancer activity in the posterior (En-positive) compartment. Annotated enhancer sequences and PCR primers are provided in Supplementary file 1 and Figure 2—source data 1.
-
Figure 2—source data 1
PCR primers used to amplify Drosophila genomic sequences.
The promoter analysis primers A_F and B_F contain a 5’ tag of CACCctcgag – CACC is used to facilitate TOPO cloning (Life Technologies; see Materials and methods) for ease of sequencing, and a XhoI site (ctcgag) for cloning purposes. The A_R primer contains a 5’ tag of GTAaccggt. The GTA serves as a buffer for ease of restriction digest and an AgeI restriction site (accggt) for cloning purposes. The B_R primer contains a 5’ tag of GTActcgag. The GTA serves as a buffer for ease of restriction digest and a XhoI restriction site (ctcgag) for bidirectional cloning purposes. All other primers were designed for TOPO cloning of enhancer sequences: Each enhancer’s forward primer contains a 5’ tag of CACCCCGCGG. CACC was used for TOPO cloning while CCGCGG is a SacII restriction site for screening purposes. Each Reverse primer contains a 5’ tag of GTACCGCGG, the GTA again serves as a buffer for ease of restriction digest and a SacII restriction site (CCGCGG) was used for cloning purposes.
- https://doi.org/10.7554/eLife.13550.004
Figure 2—figure supplement 1
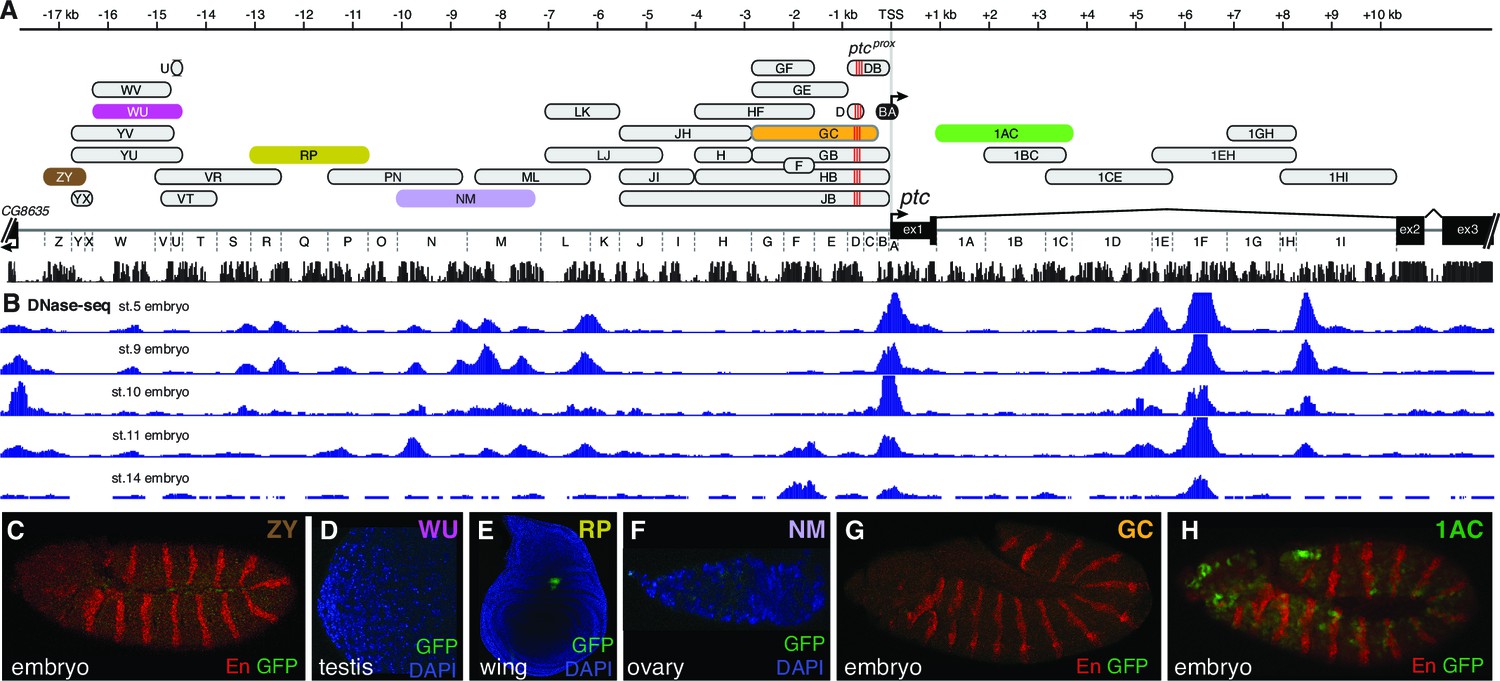
Individual patched enhancers exhibit tissue-restricted responses to Hedgehog signaling.
(A) Map of the ptc locus. Enhancers described in this figure are colored; all other tested enhancers are grey. Sequence conservation among 12 drosophilids is shown in black. (B) DNAse-seq different embryonic stages in the ptc locus (Thomas et al., 2011) (B to H) enhancer reporter constructs, all of which are Hh/Gli-responsive in other contexts (see Figure 1), shown here in a developmental context in which they fail to drive a ptc-like response to Hh/Gli.
Figure 3 with 3 supplements
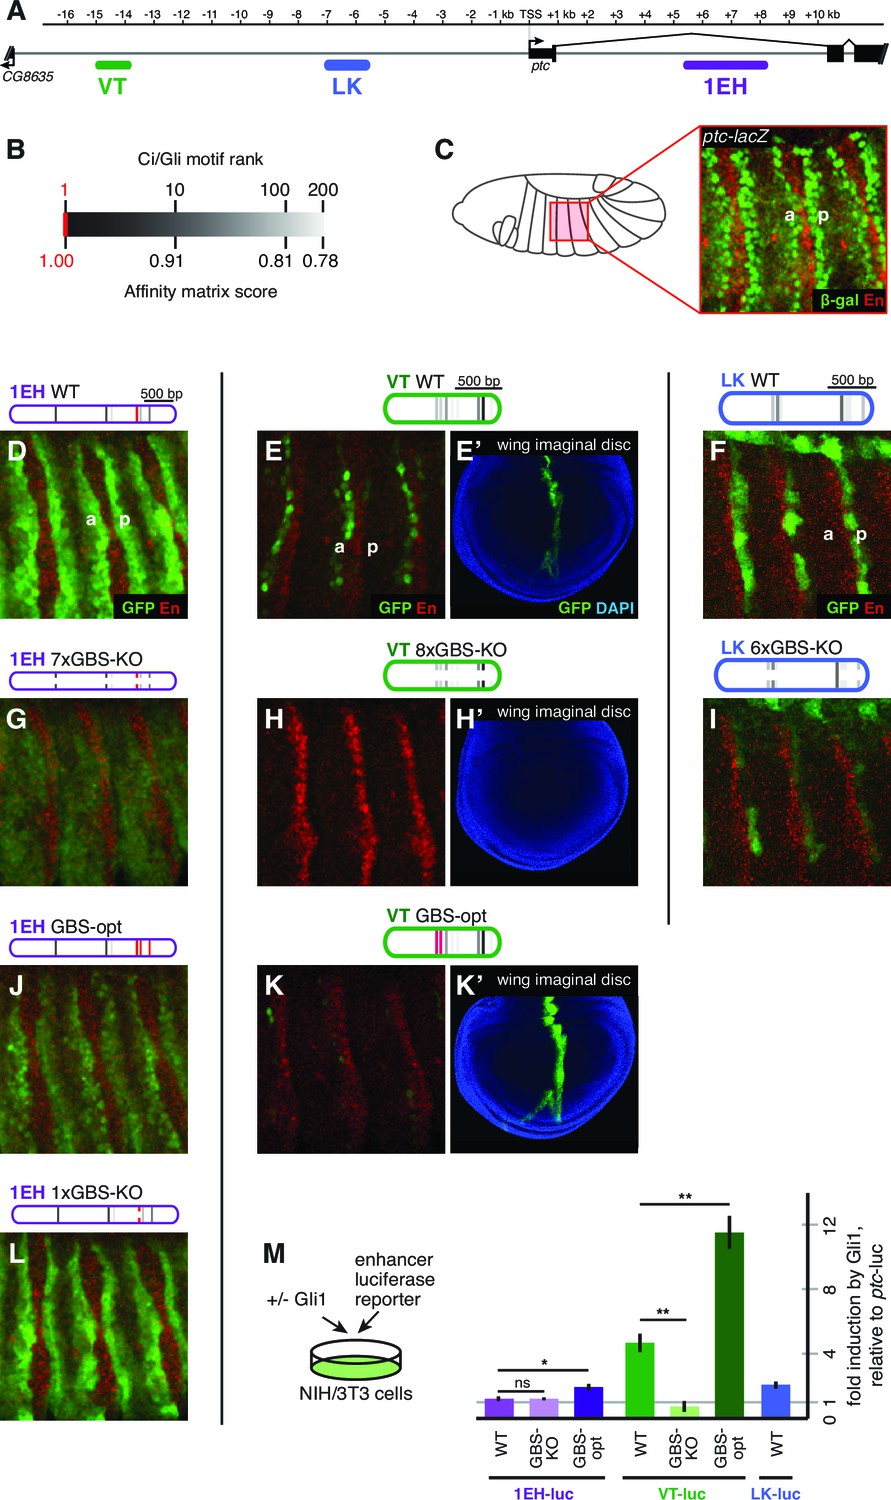
Embryonic ectoderm enhancers of patched require suboptimal Gli sites to respond to Hh signaling.
(A) Map of the ptc locus showing enhancers tested in this figure. (B) Scale of predicted relative binding affinity for Ci, used to label predicted Ci/Gli motifs in enhancer diagrams; the optimal motif (in red) is GACCACCCA. (C) Cartoon depiction of the embryo with the representative region in this figure highlighted in red, left. Stage 13 embryo carrying the ptc-lacZ enhancer-trap, right. (D,H,K) Expression of wild-type (WT) 1EH, VT and LK enhancers in embryos (wing imaginal disc displayed in H’). Full embryos for all panels can be seen in Figure 3—figure supplement 1. (E,I,L) Gli binding site knockout (GBS-KO) versions of those enhancers, (wing imaginal disc displayed in I’). In addition, enhancer LK also responds to Hh signaling via overexpression (Figure 3—figure supplement 2) (F,J) Optimization of two non-consensus Gli mofits (GBS-opt) in enhancers 1EH and VT (wing imaginal disc displayed in J’) (G) The single optimal consensus motif is mutated in the 1EH module (1xGBS-KO). The relative affinity of GBS were assessed by competitive EMSA analysis (Figure 3—figure supplement 3, Figure 3—source data 1). All enhancer and Gli sites can be found in Supplementary file 1. (M) Gli1 responsiveness of embryonic enhancers in NIH/3T3 cells, error bars indicate s.d. Student’s t-test; *p<0.05; **p<0.005.
-
Figure 3—source data 1
EMSA oligonucleotides used in GBS competition binding assays.
The top strand of each double stranded oligonucleotide is shown. The GBS being tested is marked in bold.
- https://doi.org/10.7554/eLife.13550.007
Figure 3—figure supplement 1

Embryonic ectoderm enhancers of patched require nonconsensus, suboptimal Gli sites to respond to Hh signaling.
These are whole-embryo views of the enhancer expression patterns presented in Figure 3.
Figure 3—figure supplement 2
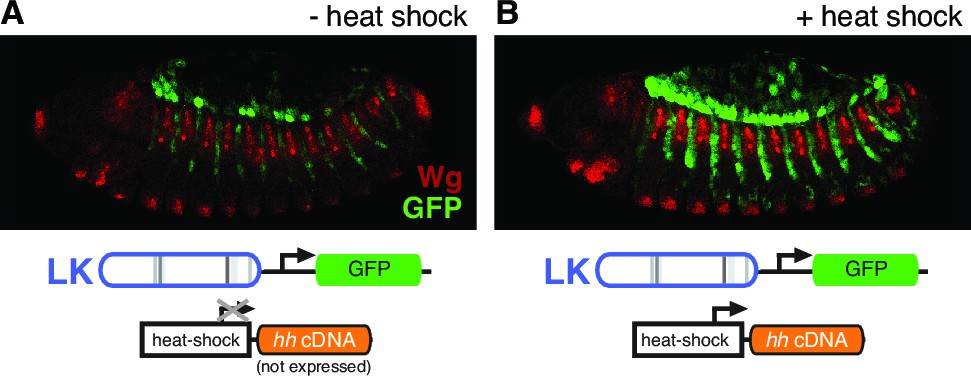
patched enhancer LK responds to Hh signaling in the embryonic ectoderm.
(A) GFP expression (green) shows expression of a wild-type LK enhancer reporter in doubly transgenic embryos containing a hedgehog cDNA under the control of the heat-inducible Hsp70 promoter, in the absence of heat shock. (B) Embryo of the same genotype as (A), but with heat shock. Hh pathway activation causes an intensification and expansion of enhancer activity in segment-polarity stripes to the posterior of stripes of normal Hh signaling, but does not produce ectopic expression in the anterior stripes of Hh-responsive, ptc-positive cells (labeled in red with the Hh/Gli target Wingless, which also maintains its restricted expression pattern).
Figure 3—figure supplement 3
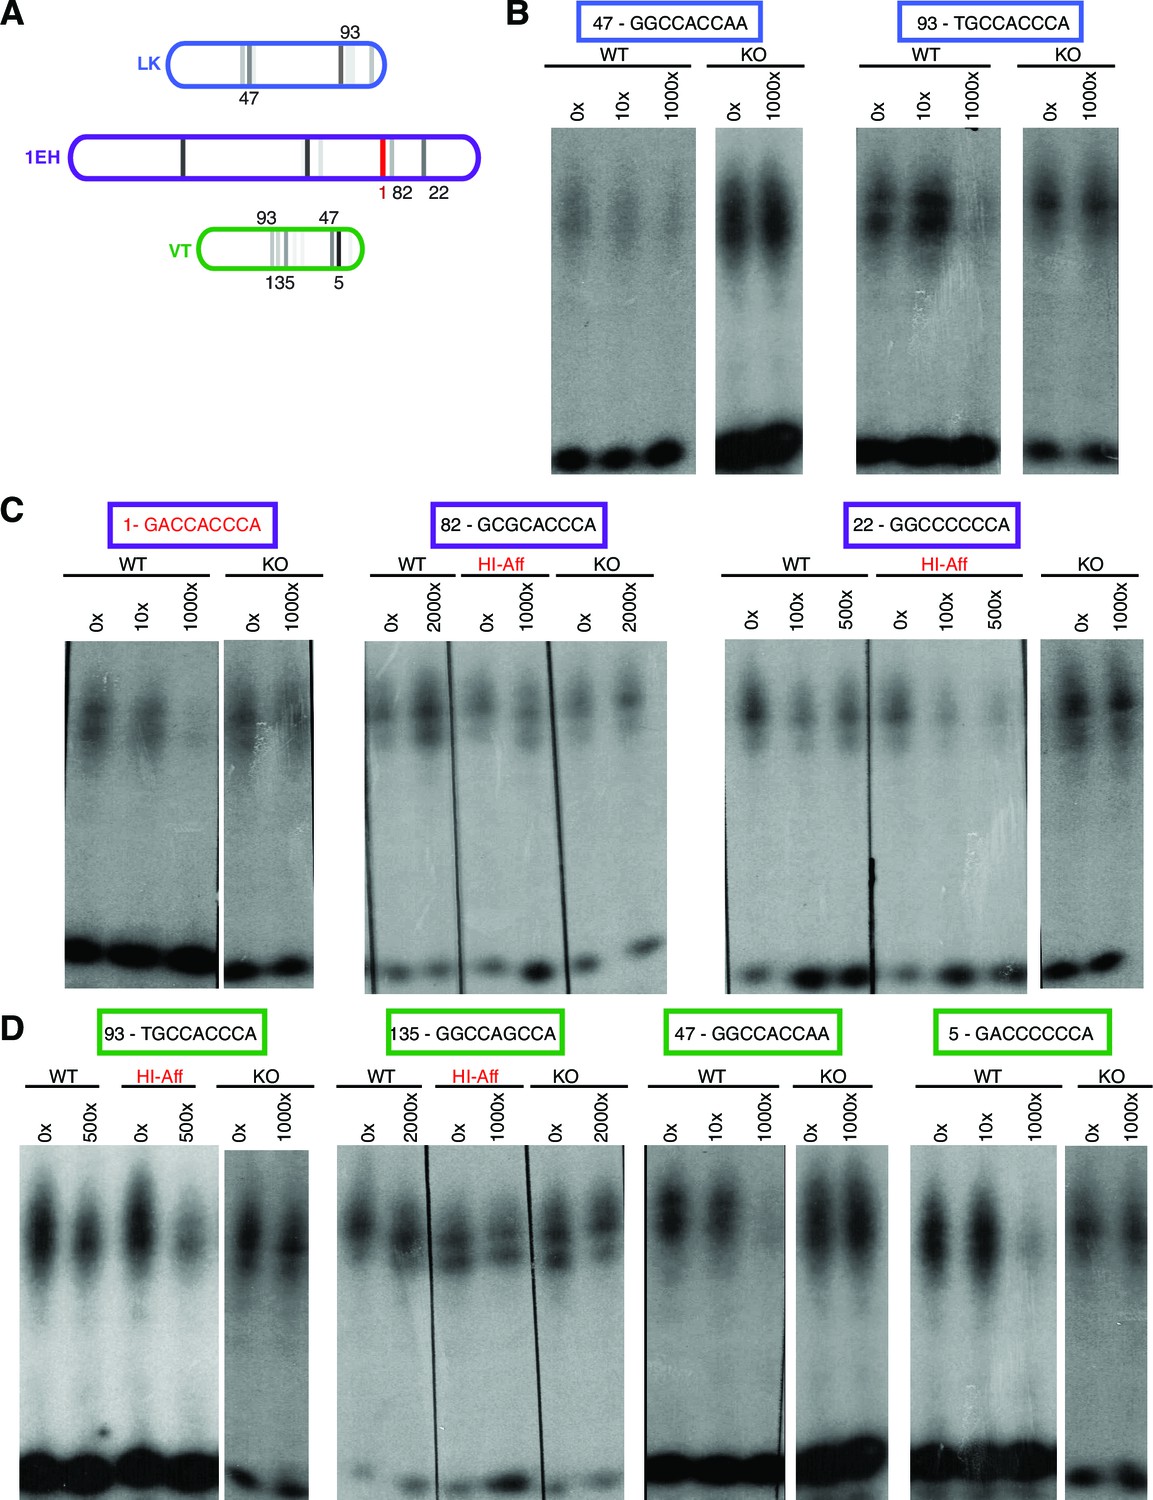
Ci binds to non-consensus Gli motifs in patched embryonic ectoderm enhancers in vitro.
(A) Diagram showing three embryonic-ectoderm enhancers of ptc and their predicted GBS (using the same affinity rank scale (2) as in (Figure 2). GBS noted with an affinity score were tested in these experiments. (B–D) EMSA competition assays in which cold (unlabeled) probes bearing GBS of noted rank compete with a radiolabeled probe containing the consensus GBS (GACCACCCA, rank 1) for binding to the Ci DNA-binding domain. GBS sequences and affinity ranks are in colored boxes and the concentrations of competitor oligonucleotides, relative to the concentration of radiolabeled.
Figure 4 with 1 supplement
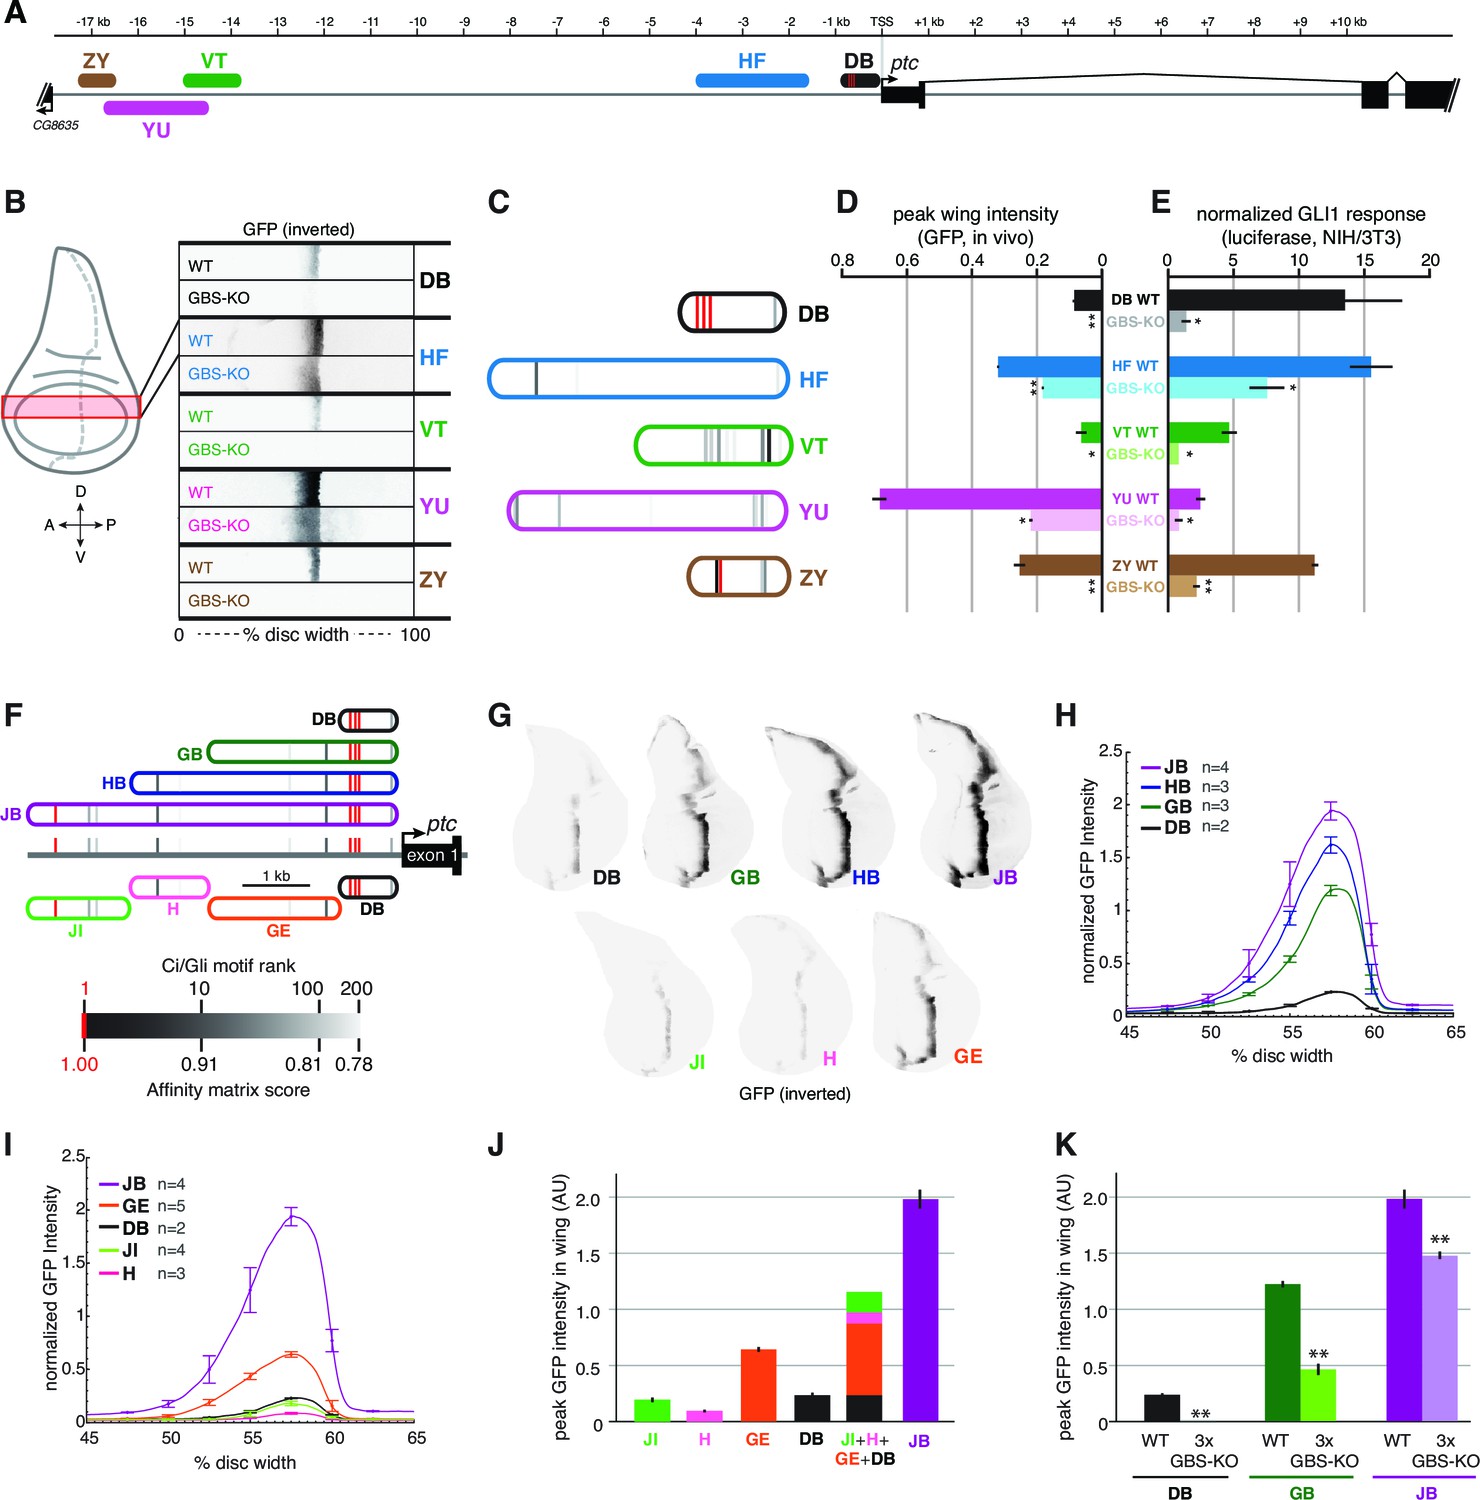
Wing enhancers of patched synergize to respond to Hh/Gli, largely via low-affinity GBS.
(A) Map of the ptc locus showing enhancers tested in this figure. (B) Activity of WT and GBS-KO versions of five ptc enhancers across the wing imaginal disc. Color-inverted grayscale images of disc segments spanning the anterior-posterior axis; GFP fluorescence appears black. The relative affinities of GBS were assessed by competitive EMSA analysis (Figure 4—figure supplement 1). (C) Diagrams of five wing enhancers and their GBS; all enhancers are color-coded as in (A). (D) Peak wing disc GFP intensity driven by WT and GBS-KO wing enhancers. (E) Gli1 responsiveness of the same enhancers in NIH/3T3 cells, error bars indicate s.d. Student’s t-test; *p<0.05; **p<0.005. (F) Tested enhancers ≤6 kb upstream of the patched promoter are mapped to the ptc locus with best predicted high- and low-affinity GBS in red and gray, see GBS affinity color scale, bottom. (G) Promoter-proximal enhancer activity in wing imaginal discs of transgenic larvae (inverted grayscale represents GFP expression). (H,I) Quantitation of GFP enhancer activity across the wing disc. (J–K) Quantitation of peak GFP fluorescence in transgenic wing discs carrying enhancer-GFP reporters. All enhancer sequences and Gli binding sites can be found in Supplementary file 1.
Figure 4—figure supplement 1
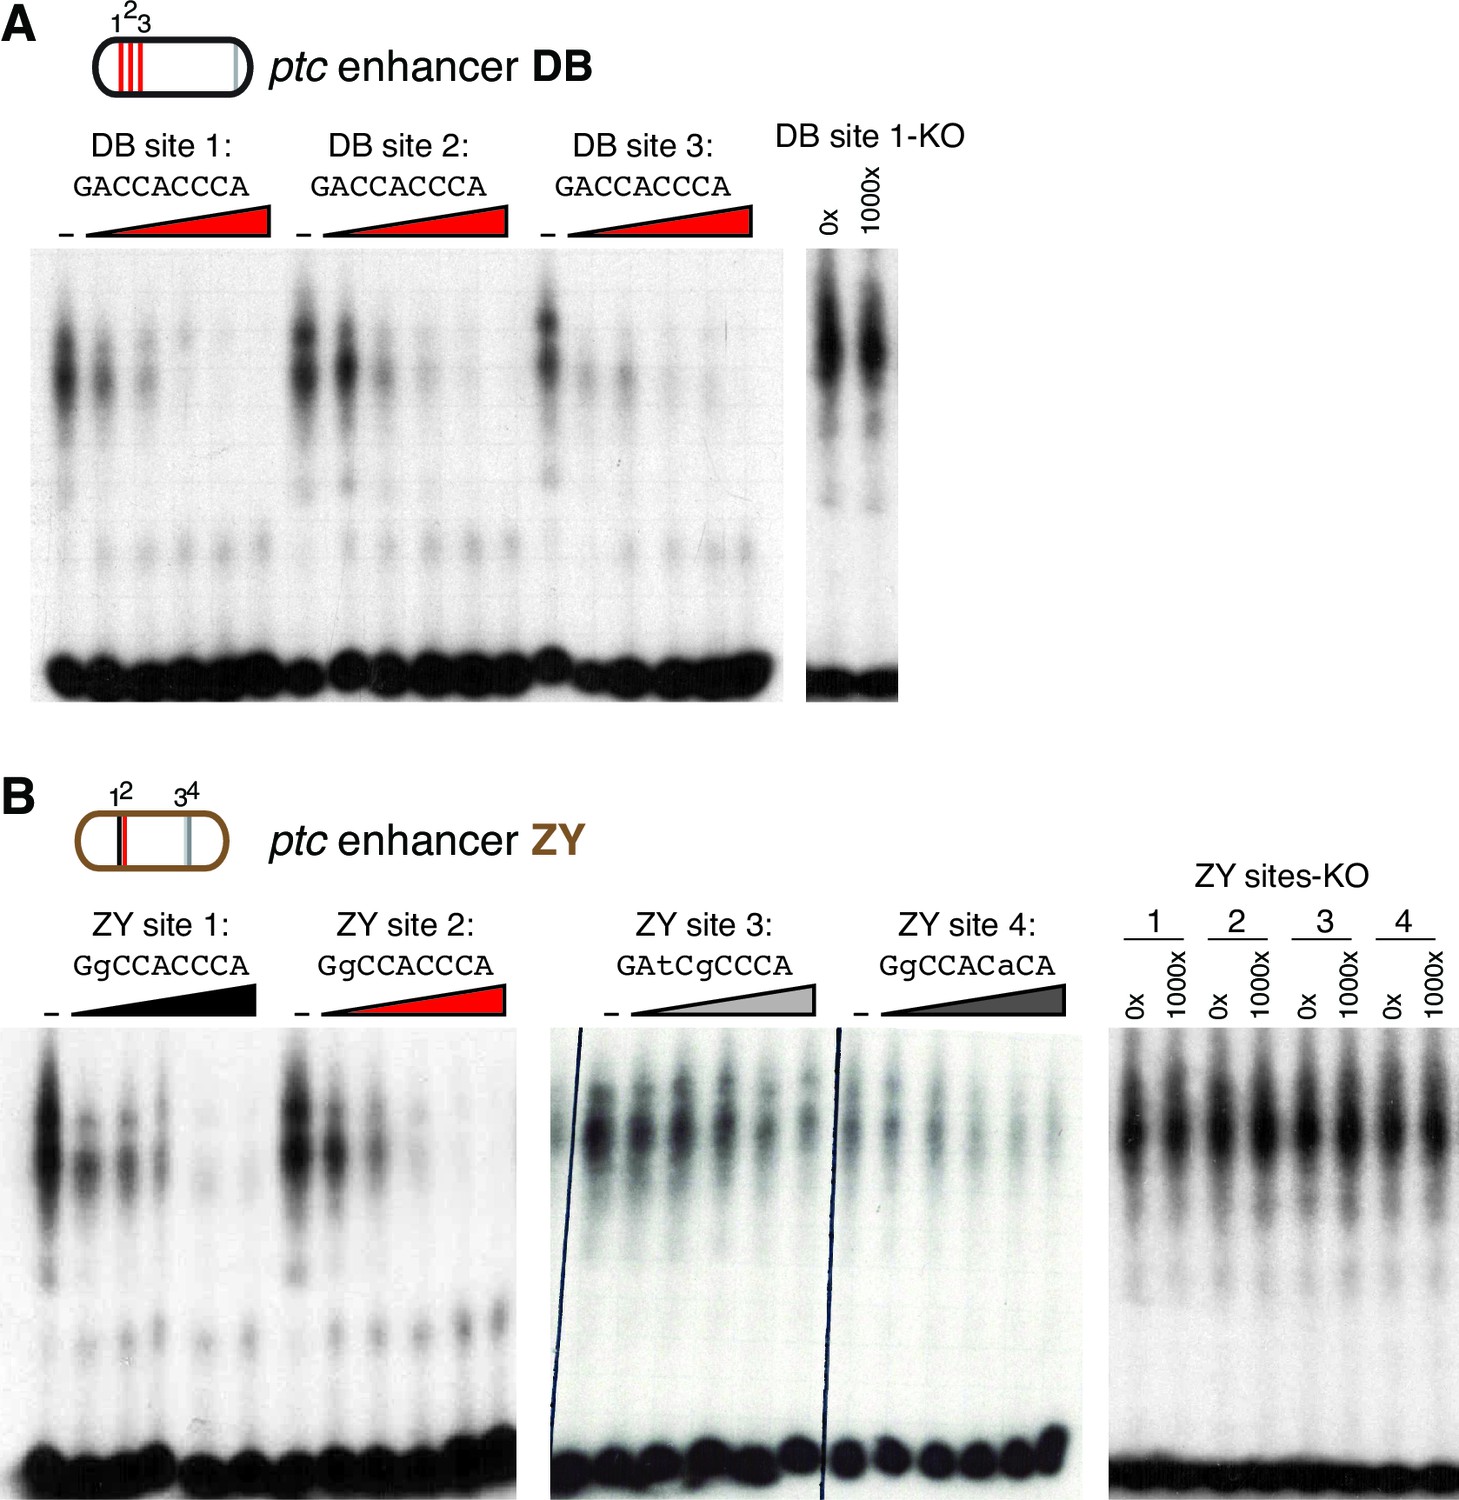
Gli binds to low affinity motifs in wing enhancers.
(A) EMSA competition assays in which increasing concentrations of unlabeled oligonucleotides containing the optimal GBS from the ptcDB enhancer compete with a radiolabeled probe containing the consensus GBS (specifically, DB site 1) for binding to the Ci DNA-binding domain. Unlabeled competitor concentrations, relative to labeled probe, are 0x, 50x, 100x, 250x, 500x, and 1000x, from left to right. Far right, an unlabeled probe containing the mutated motif used in GBS-KO enhancers does not compete with the labeled probe for Ci binding. (B) Four GBS from the ptcZY enhancer (colored according to the affinity scale in Figure 2), tested as unlabeled competitors against a labeled probe containing an optimal GBS (DB site 1, tested in the far left of panel [A]). Oligonucleotide concentrations are the same as in (A). Far right, GBSKO mutated versions of the four ZY GBS examined to exhibit Ci binding in vitro
Figure 5 with 3 supplements
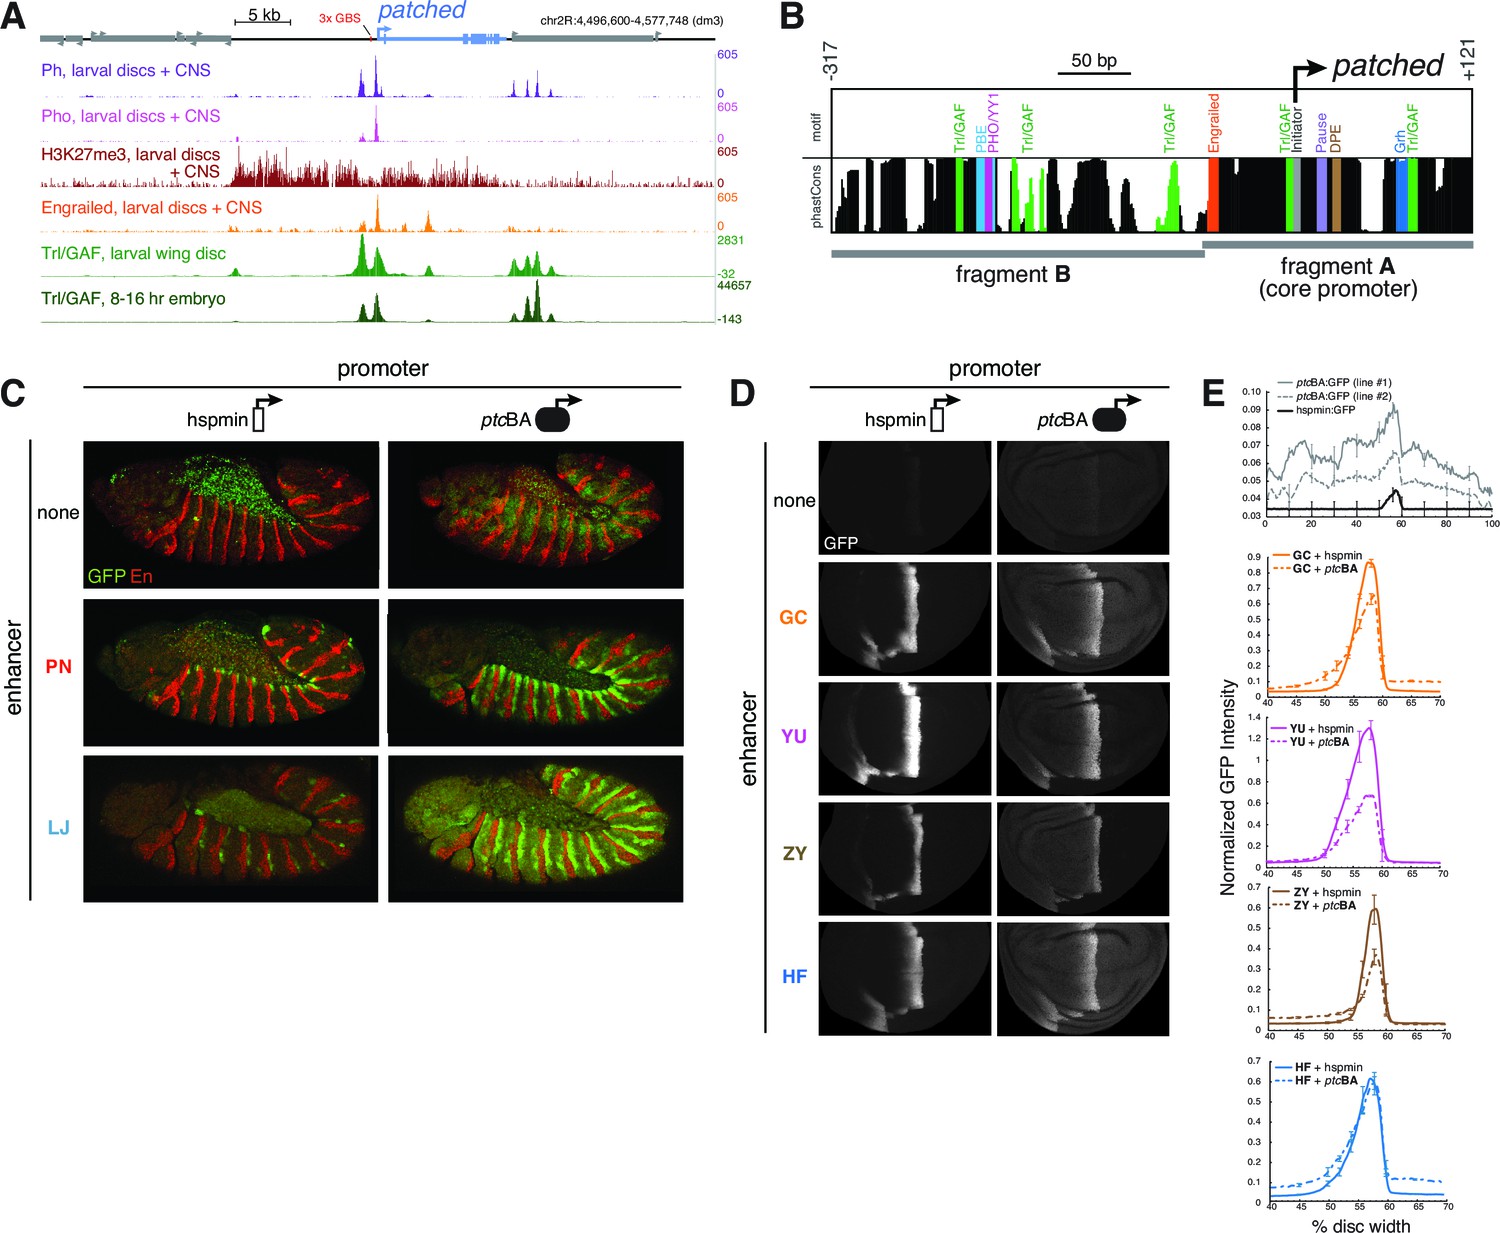
Developmentally dynamic Polycomb/Trithorax Response Elements (PREs) near the patched promoter modulate enhancer activity differently in the embryo and developing wing.
(A) ChIP-seq data from larval tissues showing binding of PcG proteins, the H3K27me3 histone mark, Engrailed, and Trithorax-like(Trl)/GAF in the neighborhood of ptc. Embryonic Trl/GAF binding data (bottom) are taken from Oh et al., 2013. For comparison with larval PcG/TrxG binding, see embryonic ChIP-seq data in Figure 5—figure supplement 1. (B) DNA motif analysis of the ptcBA promoter. Additional 5' flanking sequence is analyzed in Figure 5—figure supplement 2. (C) Two embryonic ectodermal enhancers of ptc (rows) tested on different promoters (columns) in stage 12 transgenic embryos. Related experiments are presented in Figure 5—figure supplement 3. (D) Four wing enhancers of ptc tested on a minimal TATA+Inr promoter (hspmin) or the native ptc promoter (fragment BA; -317 to +121). (E) Quantitation of wing GFP expression across wing imaginal discs carrying the transgenes shown in panel D.
-
Figure 5—source data 1
Conserved TF motifs identified in ptc enhancer sequences.
Consensus motifs were obtained from the CIS-BP database (Weirauch et al., 2014). Enhancer nomenclature is given in Figure 2A. IUPAC naming is used in the 'Consensus Binding Motif' colu mn (R = A/G; Y = C/T; S = G/C; W = A/T; K = G/T; M = A/C; B = C/G/T; D = A/G/T; H = A/C/T; V = A/C/G; N = A/C/G/T).
- https://doi.org/10.7554/eLife.13550.014
Figure 5—figure supplement 1
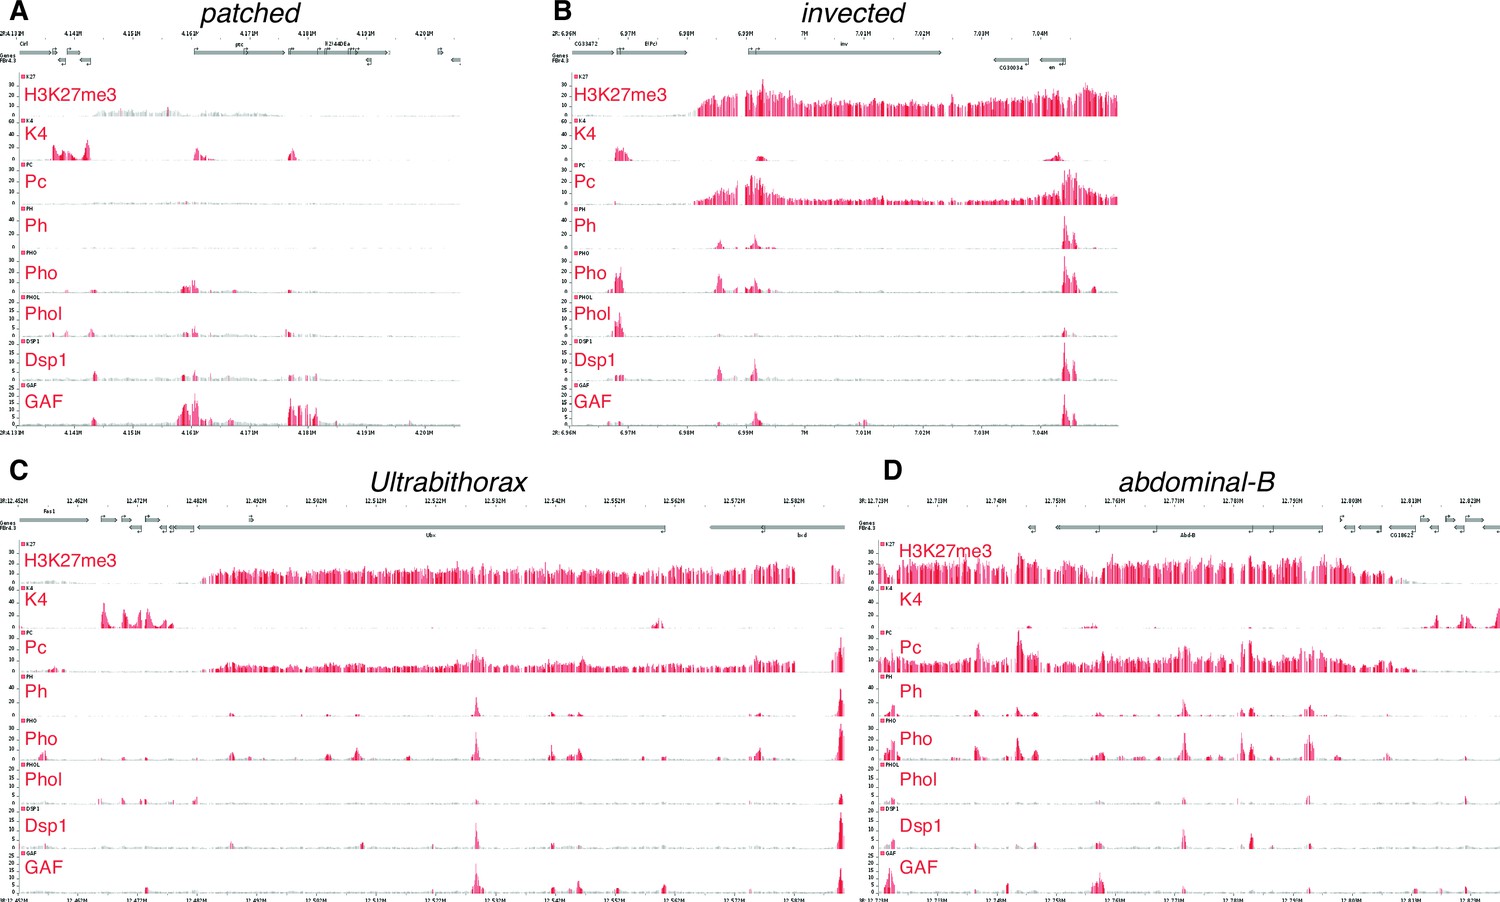
The patched promoter region, which is heavily bound by PcG proteins and H3K27me3-marked in larval discs, does not show PRE signatures in the embryo.
(A) Embryo ChIP-seq binding data are taken the Cavalli group’s Polycomb and Trithorax Genome Browser (Schuettengruber et al., 2009)and show the H3K4me3 mark (which is associated with active or potentially active promoters), the TrxG factor Trl/GAF (Oh et al., 2013), and the PcG protein Pho are present at the ptc promoter in the embryo. (B–D) Classic PREcontaining loci such as en/inv, Ubx and Abd-B. Embryonic patched (in A) has low levels of H3K27 trimethylation and poor occupancy of the PRE-associated proteins Polycomb (Pc) and Polyhomeotic (Ph) compared to these examples of PRE associated genes.
Figure 5—figure supplement 2
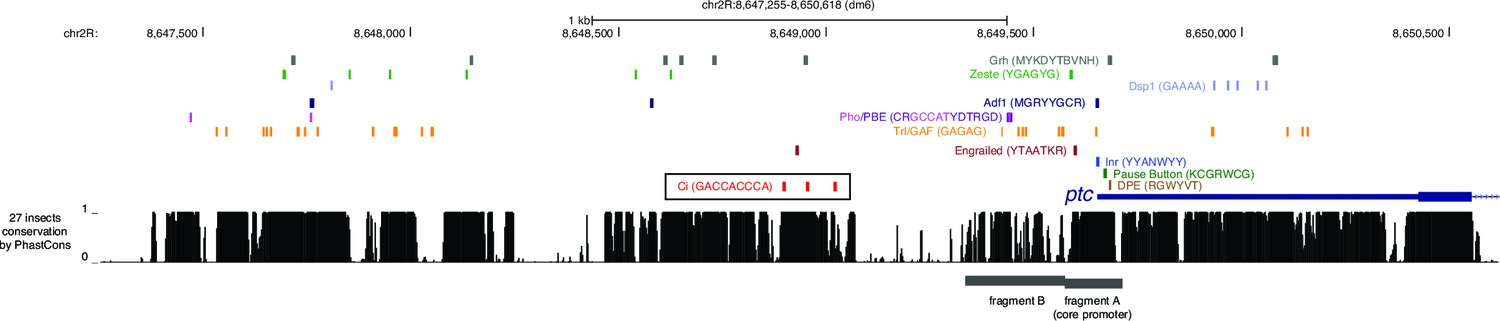
Conserved PRE-associated transcription factor binding motifs in promoter-proximal sequences of the patched gene.
Gene map and sequence conservation histogram are taken from the UCSC Genome Browser (genome.ucsc.edu). The cluster of optimal GBS is outlined in a black box; various PREassociated transcription factor binding motifs and core promoter motifs are shown as colored boxes. The patched promoter lacks a TATA motif in all species.
Figure 5—figure supplement 3
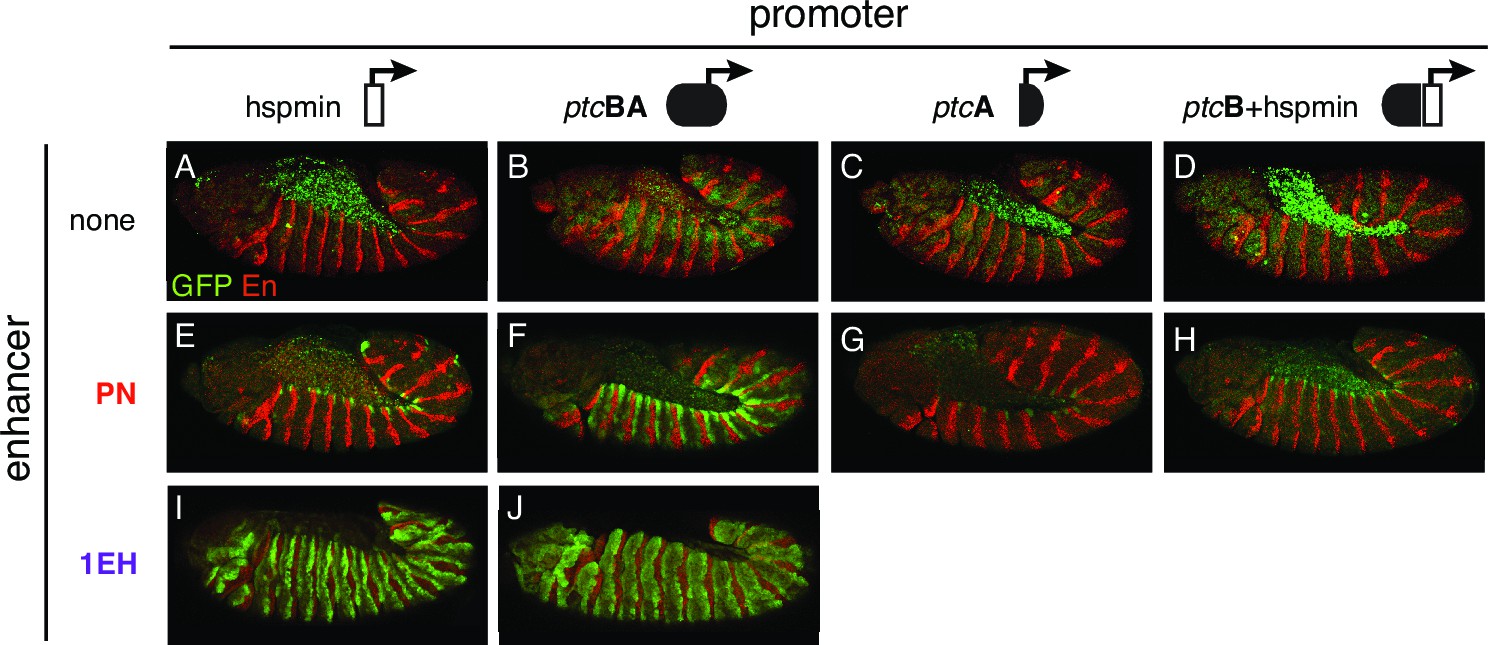
Polycomb/Trithorax Response Elements (PRE) near the patched promoter modulates enhancer activity.
(A–J) Two embryonic ectodermal enhancers of ptc (PN, 1EH in rows) tested on different promoters (columns) in stage 12 transgenic embryos
Figure 6 with 1 supplement
Drosophila and vertebrate patched orthologs share a similar cis-regulatory architecture and gene regulatory strategy.
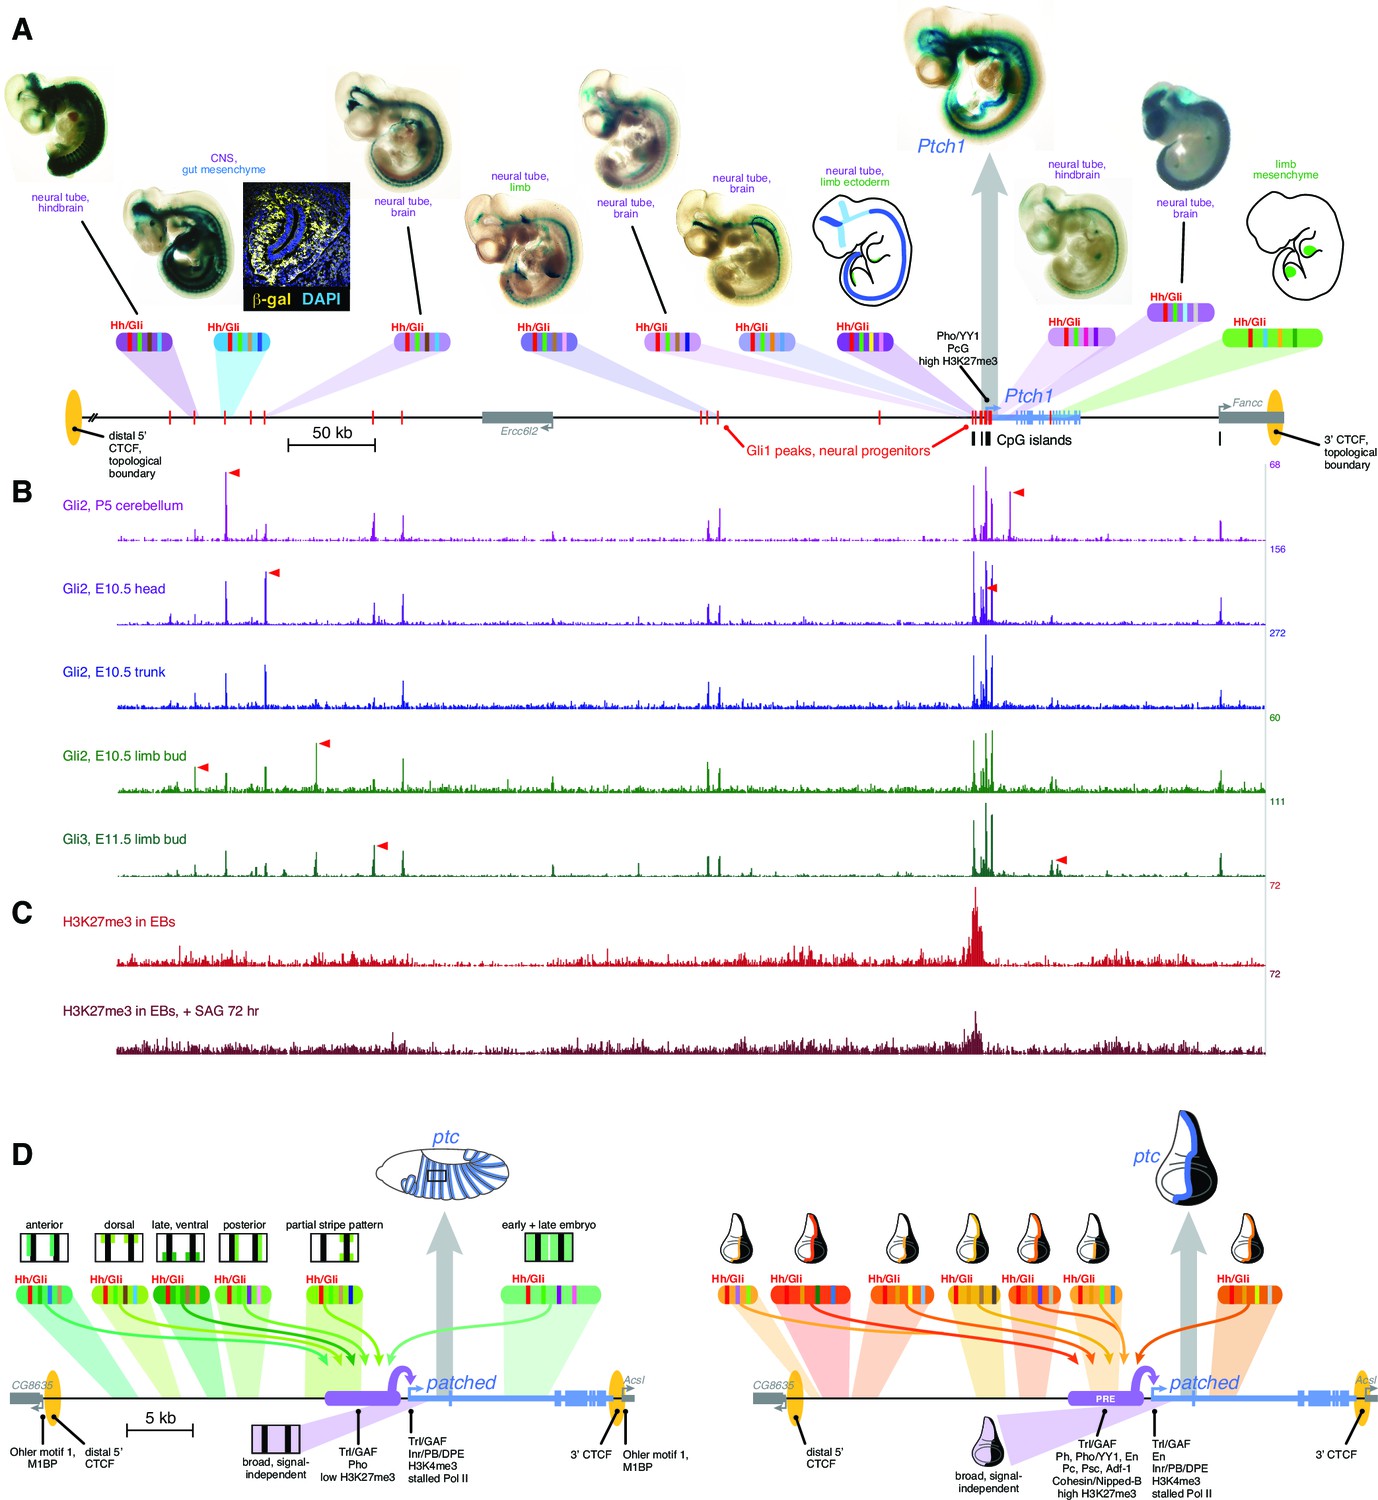
(A) X-gal-stained E10.5 mouse embryos carrying novel Ptch1 enhancers as transient-transgenic lacZ reporters (Figure 6—source data 1) are shown above a map of the mouse Ptch1 region. Known Ptch1 enhancers (Vokes et al., 2007; Lopez-Rios et al., 2014) are shown as cartoons. Red boxes along the gene locus schematic represent Gli1 occupancy in neural progenitors near Ptch1 (as identified by ChIP-seq; Peterson et al., 2012). (B) ChIP-seq of Gli2 and Gli3 near Ptch1. Red arrowheads highlight tissue-specific Gli binding. (C) ChIP-seq shows H3K27me3 is enriched at the proximal promoter but reduced upon pathway stimulation, consistent with relief of Polycomb-mediated repression. (D) Left, summary of the ptc response to Hh in the Drosophila embryonic ectoderm. Multiple Hh-responsive enhancers combine Ci/Gli sites (red bands) and tissue-specific inputs (colored bands), generating overlapping subsets of the embryonic ptc response which are integrated and amplified by the promoter-proximal region, resulting in a complete segment-polarity stripe pattern (top). The promoter-proximal region also generates the basal signal-independent ptc expression (bottom, purple). Right, summary of the Hh response of ptc in the wing disc. A large battery of tissue-specific Gli-responsive enhancers, driving wing stripes of different widths, intensities, and dorso-ventral extents, interact with a Polycomb/Trithorax-bound promoter-proximal region to provide a complete wing stripe pattern (top). The PRE-containing promoter-proximal region also produces signal-independent ptc expression in the anterior (bottom, purple). Identification of flanking CTCF insulator sites for both fly and mouse patched were determined using ChIP-seq and ChIP-CHIP analyses available from the UCSC genome browser and modENCODE databases (Figure 6—figure supplement 1).
-
Figure 6—source data 1
Mouse Ptch1 enhancer coordinates.
Sequence coordinates, corresponding to the mm9 build of the Mus musculus genome, are provided for all enhancers tested as lacZ reporters in E10.5 mouse embryos in Figure 6A. Enhancers are named for their position relative to the Ptch1 promoter. References are provided for previously published enhancers.
- https://doi.org/10.7554/eLife.13550.019
Figure 6—figure supplement 1
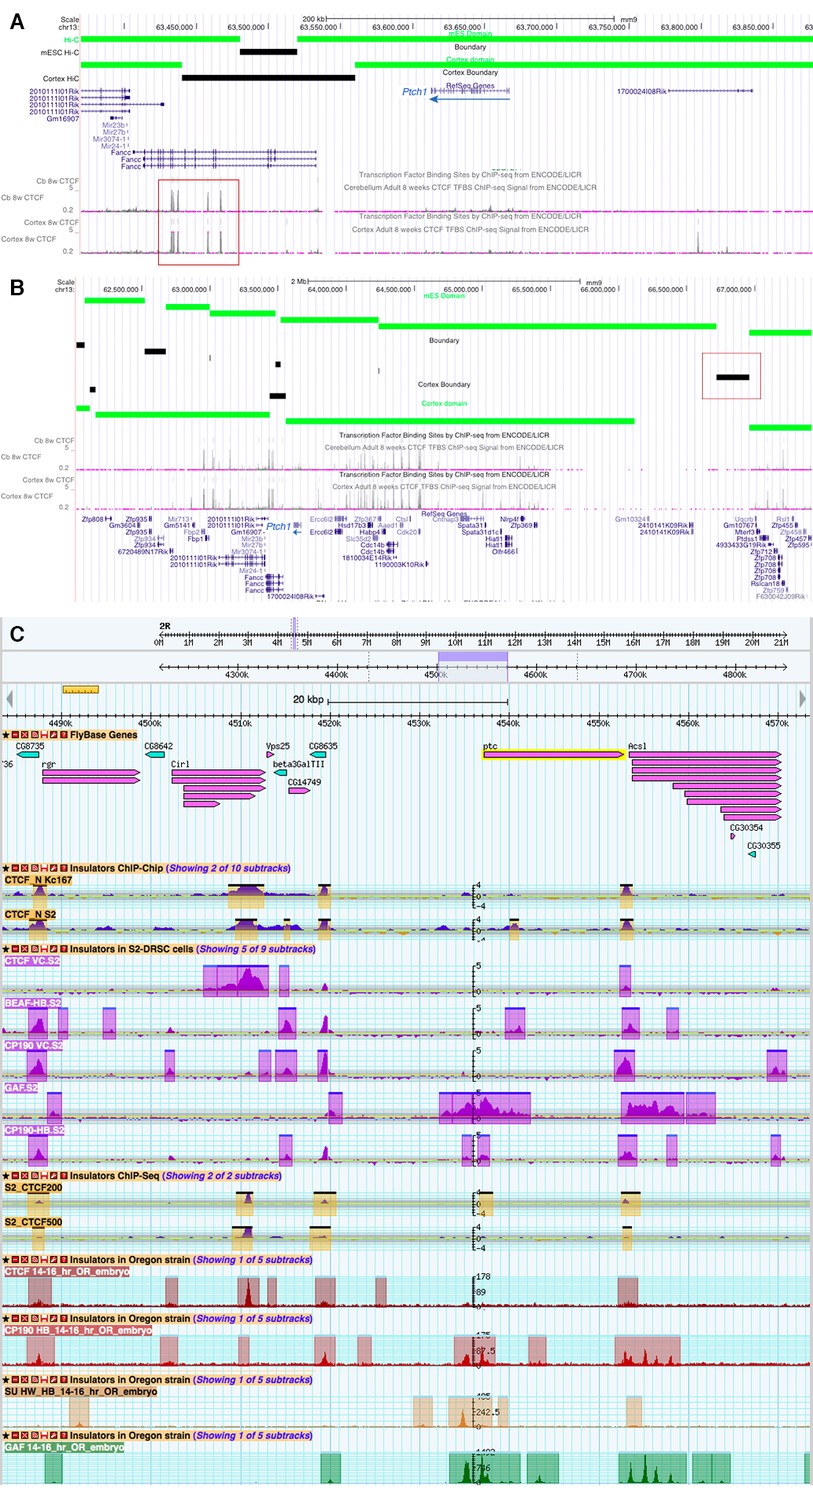
Topological boundaries and chromatin insulators at mouse PTCH1 and fly patched.
(A) Map of the immediate vicinity of mouse Ptch1, displayed in the UCSC Genome Browser (genome.ucsc.edu), showing the topological domains and boundary regions in mouse ES cells and cortex, as determined by Hi-C chromatin interactions (Dixon et al., 2012), and ChIP-seq binding data for the chromatin insulator/boundary factor CTCF in embryonic mouse brain (Wang et al., 2012). Red box indicates a cluster of CTCF peaks in the Fancc gene, downstream of Ptch1. (B) Larger-scale view (~5.5 Mb) of a chromosomal region including Ptch1. Red box shows a boundary region far upstream of Ptch1. The topological domain containing Ptch1 extends from Fancc over 2 Mb to the 5’ of Ptch1 (to the right in this view). (C) Summary of modENCODE Drosophila genomic data (Celniker et al., 2009) in the vicinity of the ptc locus (~90 kb), showing binding of CTCF and other insulators and boundary-associated factors. As in the mouse, the nearest 3’ CTCF boundary to fly ptc is nearby (between the 3’ end of ptc and the promoter of the adjacent gene Ascl), while the nearest 5’ boundary is further away (~18 kb upstream, at the CG8635 gene promoter). All characterized ptc enhancers fall between these two CTCF sites.
Author response image 1
Additional files
-
Supplementary file 1
patched enhancer sequences with targeted Gli/Ci binding site mutations.
Sequences were taken from the dm3 build of the UCSC genome browser. Optimal Ci binding sites are highlighted in red, low affinity Ci binding sites are highlighted in gray and further annotated with a numerical ranking corresponding to the affinity predictions previously defined (Hallikas et al. 2006). Blue text indicates how each Ci binding site was mutated, for example in ptc-prox enhancer DB, the optimal Ci-1 binding site of GACCACCCA was mutated to GACaCaaCA.
- https://doi.org/10.7554/eLife.13550.021
-
Supplementary file 2
Sequence conservation of selected TF binding motifs in enhancers of patched.
Sequence alignments were obtained from the UCSC Genome Browser, dm6 build. Selected conserved Tango/Spineless (Tgo/Ss) motifs are in gray; Distaless (Dll) in light blue; Engrailed (En) in green; Pannier (Pnr/dGATAe) in purple; Scalloped (Sd) in blue; Cubitus interruptus (Ci) in red; Odd-Skipped (Odd) in dark red; Forkhead (Fkh) in dark yellow; Sloppy-paired (Slp) in blue-green; Pleiohomeotic (Pho) in pink, GAGA Factor (GAF/Trl) in yellow. Blocks of sequence separated by line breaks are not necessarily contiguous.
- https://doi.org/10.7554/eLife.13550.022
Download links
A two-part list of links to download the article, or parts of the article, in various formats.
Downloads (link to download the article as PDF)
Open citations (links to open the citations from this article in various online reference manager services)
Cite this article (links to download the citations from this article in formats compatible with various reference manager tools)
An ancient yet flexible cis-regulatory architecture allows localized Hedgehog tuning by patched/Ptch1
eLife 5:e13550.
https://doi.org/10.7554/eLife.13550


