RNA Polymerase II cluster dynamics predict mRNA output in living cells
- Massachusetts Institute of Technology, United States
- Janelia Research Campus, Howard Hughes Medical Institute, United States
Figures
Figure 1 with 3 supplements
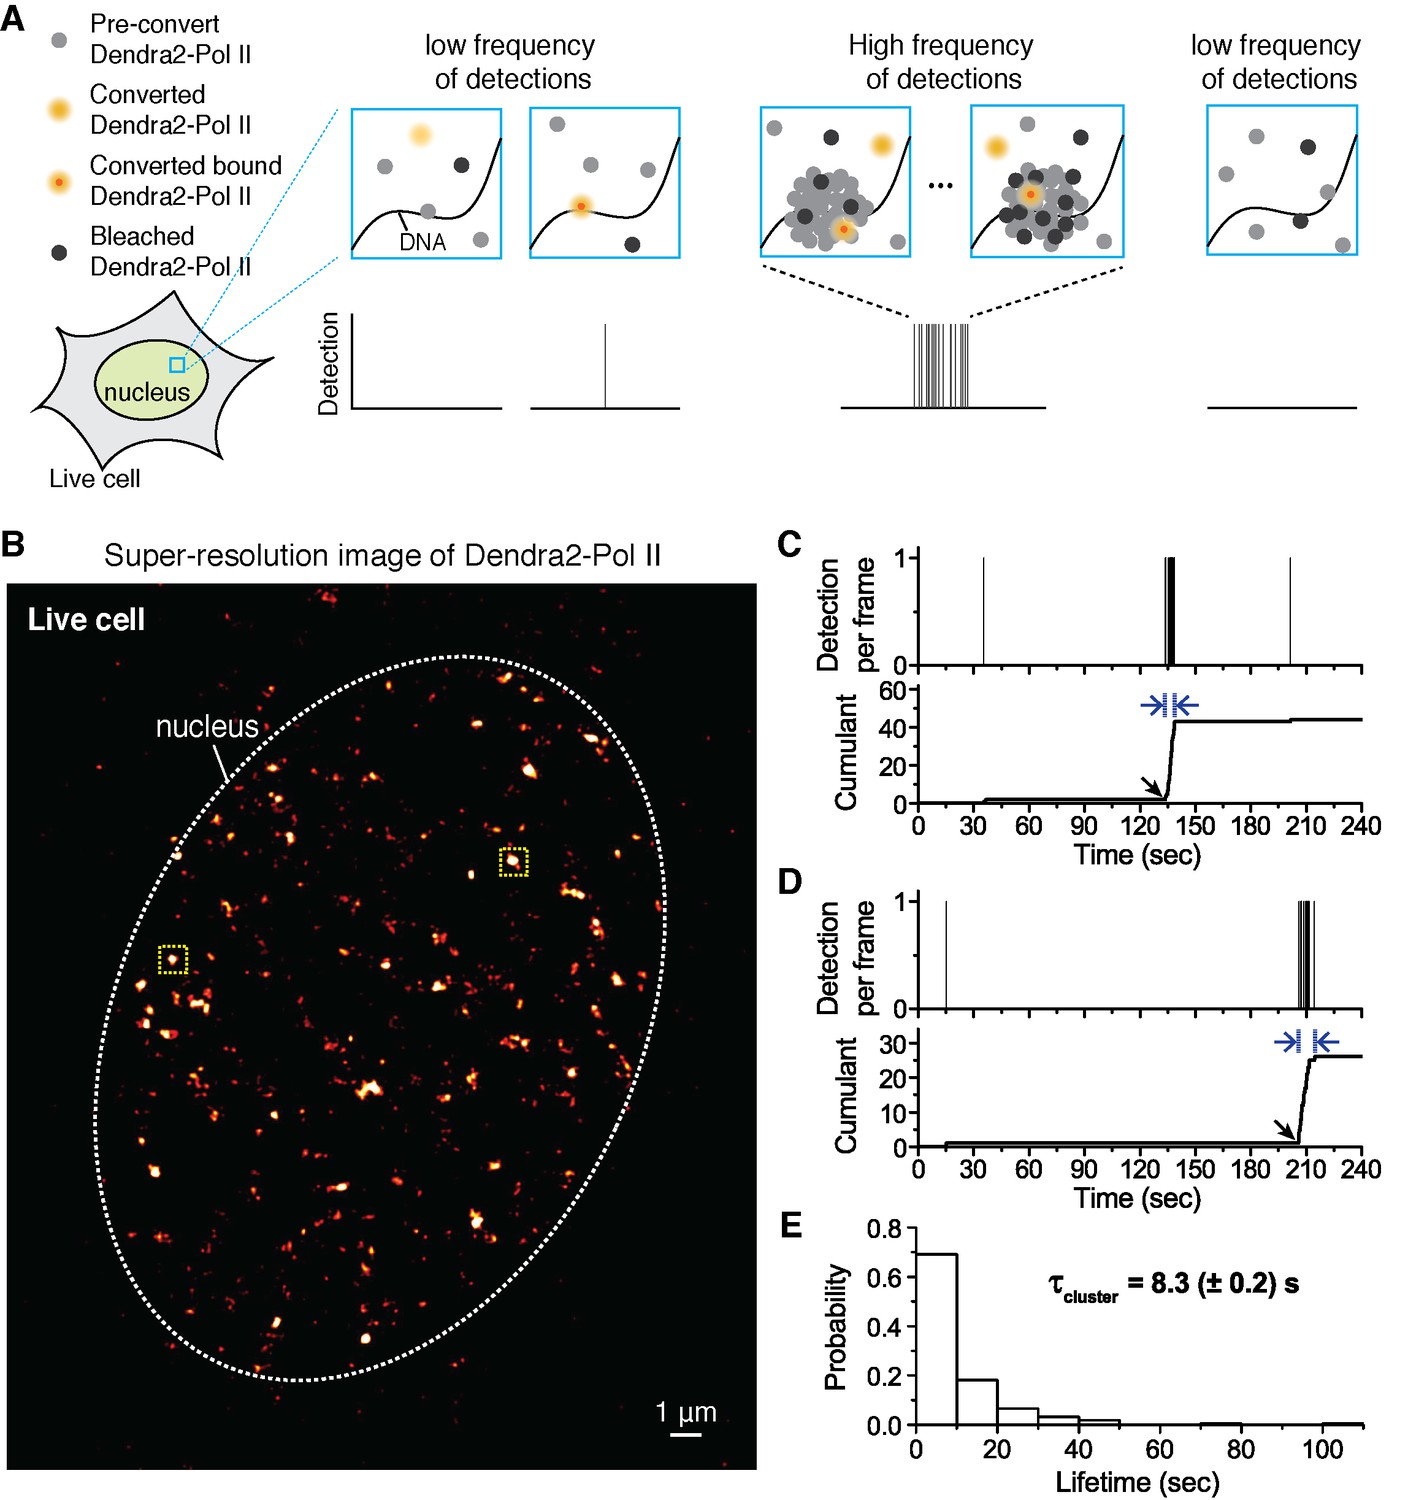
Quantitative super-resolution imaging unveils transient pol ii clustering in live mouse embryonic fibroblasts (MEF).
(A) Schematic representation of time-correlated detection counting: individual molecules that are photo-converted and bound within 60 ms frame rate are detected; changes in local protein concentrations are evidenced by relative changes in the frequency of detections (B) Super-resolution reconstruction of Dendra2-Pol II in live MEF, depicting clusters of Pol II. Red-hot color code denotes spatial density of detections accumulated from 5000 frames. (C, D) Representative time traces for two selected Pol II clusters. The selected regions are shown as yellow squares in B. In the traces, time t = 0 represents the start of acquisition. Black arrows indicate the onset of Pol II clustering, and blue arrows indicate the apparent cluster lifetime. (E) A histogram of the apparent cluster lifetimes (τcluster) is presented for 214 clusters pooled from 6 live MEF cells. Globally, throughout the nucleoplasm of live MEF cells an average lifetime, τcluster, of 8.3 (± 0.2) s was obtained. Errors (in parentheses) represent standard error of the mean.
-
Figure 1—source data 1
Source data for 1D.
Experimentally measured Pol II cluster lifetimes are provided.
- https://doi.org/10.7554/eLife.13617.003
Figure 1—figure supplement 1
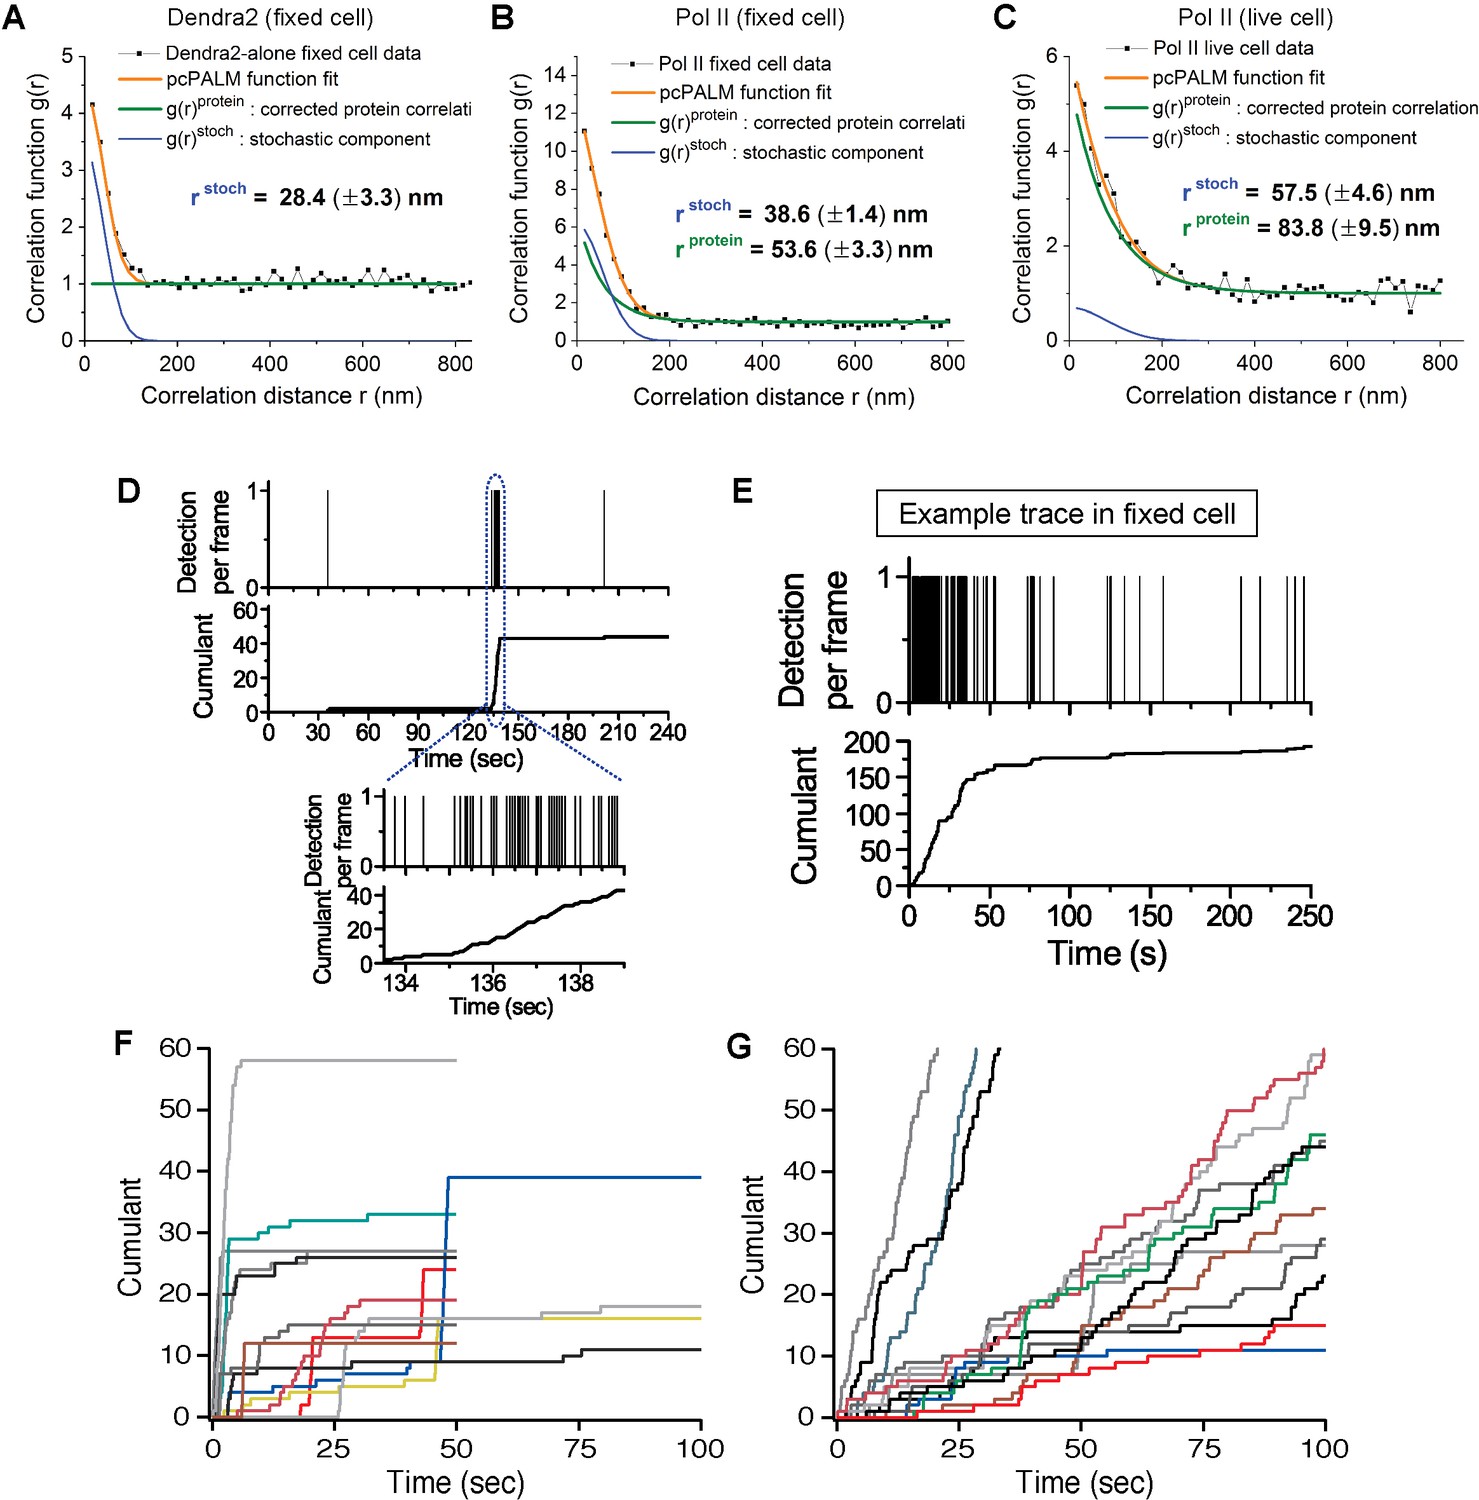
Spatial clustering of Pol II determined by pair-correlation (pcPALM) analysis, A zoom-in trace of transient Dendra2-Pol II cluster in live cells, A trace of Dendra2-Pol II in fixed cells, and traces of H2B-Dendra2 in live cells.
Pair-correlation analysis for (A) Dendra2-alone in fixed MEF cell, (B) Dendra2-Pol II in fixed MEF and (C) Dendra2-Pol II in live MEF. Orange line represents the global fitting curve by pair-correlation PALM (from Equation 2, as described in Appendix 1). Green and blue lines represent the protein correlation components and single molecule stochastic components, respectively. Dendra2-Pol II in live cell and fixed cell both show a protein correlation after correction consistent with spatial clustering of the protein indepent of single molecule photo-physics. In contrast, Dendra2 alone in fixed cell show no protein correlation (flat green in A), suggesting the fluorophore alone is not spatially clustered. (D) Zoomed-in time trace of the transient Pol II cluster in Figure 1C to show precise detection profile and corresponding cumulant. (E) An example time trace of a Pol II cluster in fixed cell is represented as proxy for the signature stable Pol II cluster: in the cumulant, a slope onset from beginning of acquision followed by a more gradual transition into a plateau. (F, G) Example time traces of histone H2B-Dendra2 in live cells (G), as a control for known stable structure in live cells, exhibit a more gradual temporal signature interpretable as a stable structure; by comparison Pol II-Dendra2 (F) detections from cells under identical imaging conditions as in F, show large sudden steps more consistent with dynamic clustering of Pol II.
Figure 1—figure supplement 2
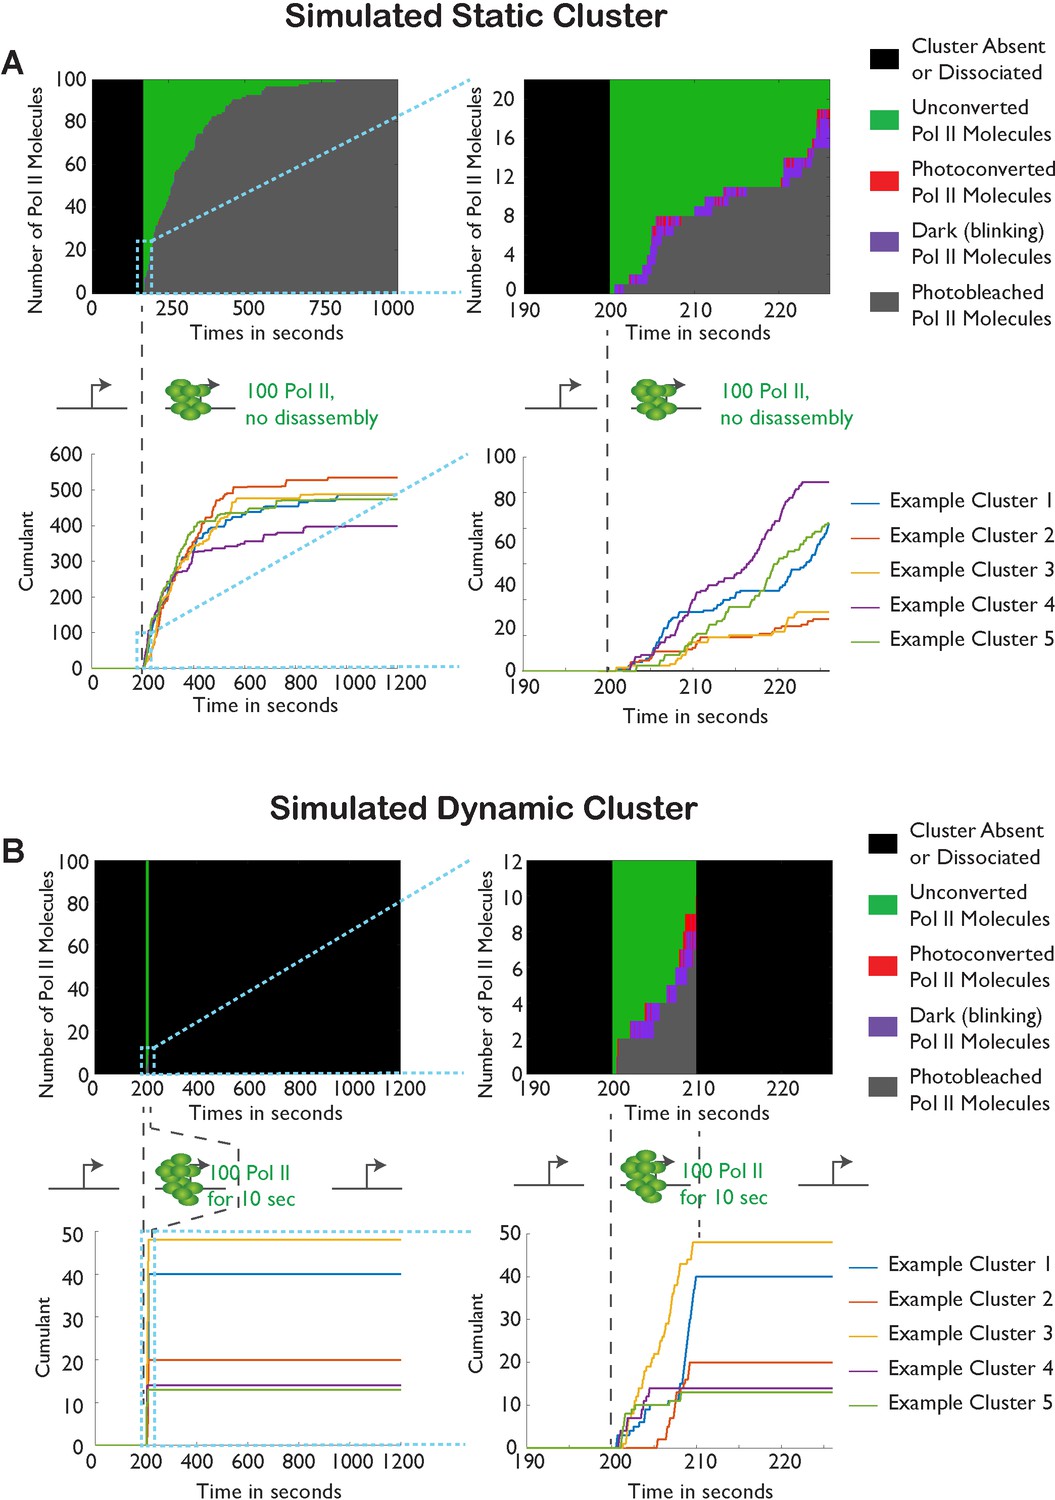
Monte-Carlo simulation of Pol II cluster dynamics as detected in tcPALM.
(A) Simuluation of a stable cluster: a static cluster is modeled as the recruitment, at t = 200 s, of 100 polymerases molecules which remain associated with the gene for the remainder of the simulation (total time, 1000 s). 5 independent runs of the simulations are represented in each graph for illustration. Top: Example of one simulation run illustration the counts of the different molecular states as a function of time. Before cluster recruitment, all molecules are absent (black pixels; one horizontal pixel correspond to one simulated camera frame). Upon cluster recruitment, Pol II molecules are all initially unconverted (green pixels). Gradually, molecules blink transiently (on: red pixels; off: purple pixels) before undergoing irreversible photobleaching (gray pixels). The top right panel represents a magnification of the first 30 s of the simulations. The bottom panels represent the cumulant detections from the 5 independent runs of the simulation. The blue curve corresponds to the simulation displayed in the top panels. (B) Simulation of transient clusters: A dynamic cluster is represented as the recruitment at t = 200 s of 100 molecules of Pol II followed by their dissociation at t = 210 s. The representation conventions are identical to panel A. The top panels demonstrate that the short duration of the cluster only allows the activation of a few percent of the total Pol II population (9 out of 100 molecules). The bottom panel demonstrate that the cumulant trace offers an accurate representation of the cluster lifetime in most simulations.
Figure 1—figure supplement 3
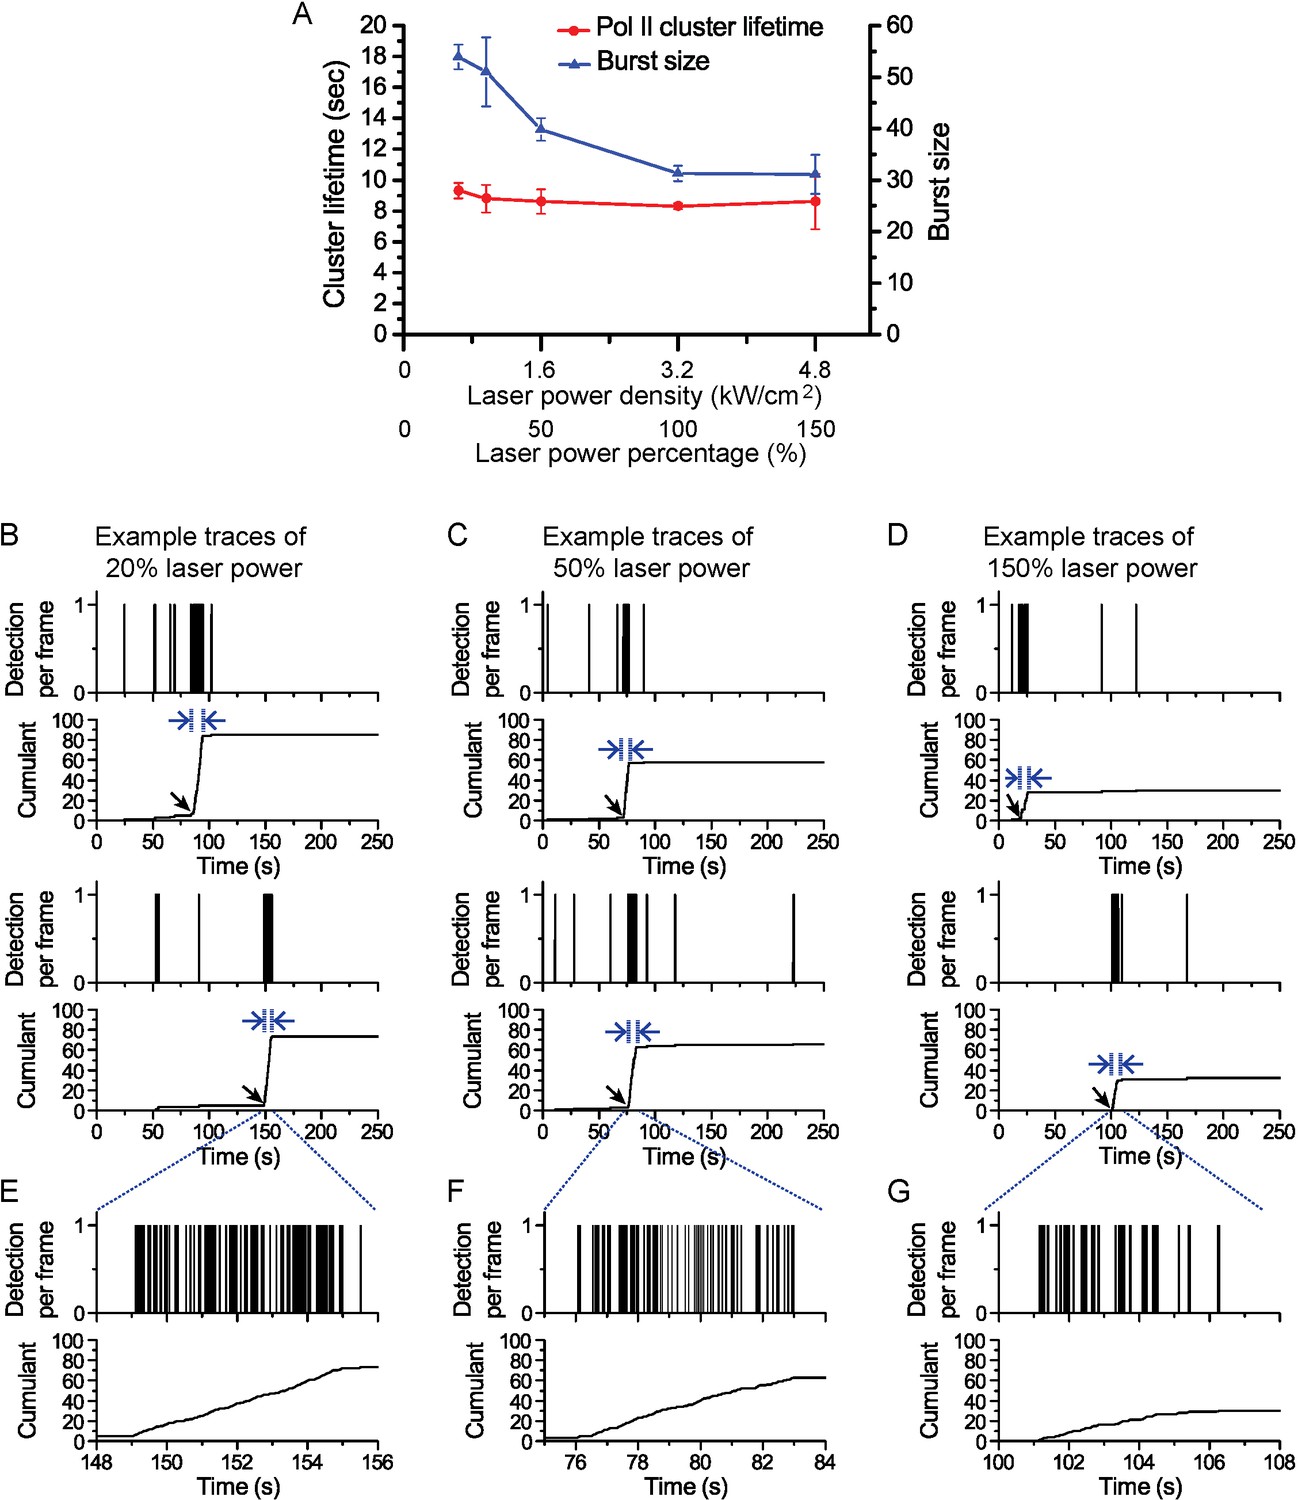
Pol II cluster lifetime is independent of 561 nm excitation laser power.
Pol II cluster lifetimes and burst sizes were measured in live MEFs imaged under different laser excitation (561 nm) power densities varying from 20% to 150% relative to the optimized laser power used in our regular experiments (3.2 kW/cm2). (A) The average Pol II cluster lifetime (red) remains unchanged with varying excitation power. The number of localizations per cluster (burst size, in blue) decreases with increasing laser power consistent with the fact that photobleach single molecules, with increasing laser power, contribute less localizations. (B–D) Representative time traces are shown for Pol II clusters in living cells at the indicated excitation powers. At different excitation the independent axes (time) remain unchanged while the cumulant level changes (E–G) Temporally-zoomed-in time traces show the single molecule detections per cluster from a seclection of traces. Overall the data validate that the apparent cluster lifetime is independent of the excitation laser power and thus independent of single molecule photobleaching. A total of 864 clusters from 28 cells were are analysed and represented in the figure. Each data point is an average at least N=4 cells imaged at the indicated laser power on at least two separate experiments. Error bars represent standard error of the mean.
Figure 2 with 2 supplements

Dual-color super-resolution imaging captures Pol II clustering at active β-actin gene locus in a living cell.
In a live MEF cell, endogenous β-actin loci can be observed (orange arrows in A, C and E). (A) Conventional fluorescence image of JF646-labeled β-actin mRNA and (B) pre-converted (conventional) Dendra2- Pol II imaging, at the same imaging plane as in A, in the same live cell nucleus. The images are acquired for a plane focusing on a bright JF646-β-actin gene locus (orange arrow in A). The images are averaged projections from 100 frames in A and 300 frames in B, respectively. (C) Super-resolution (STORM) reconstruction is performed to localize the β-actin gene locus with high precision; a magenta-hot color code is used to represent the spatial density of labeled mRNA detections accumulated from 200 frames. Because most of the mRNA is diffusing throughout the nucleoplasm of the living cell, mainly the immobile nascent mRNA signal appear as a clear signal in the super-resolved image (D) Super-resolution (PALM) reconstruction of converted Dendra2-Pol II is performed to image the Pol II clusters in the same plane of focus. A green-hot color code is used to represent density of labeled Pol II detections. (E) Merging the two super-resolved images of the β-actin gene locus (magenta) and Pol II (green) reveals the co-localization of a Pol II cluster with the active gene locus. Standard magenta and green are used for β-actin mRNA and Pol II respectively, such that co-localization should appear as white. (F) The live cell super-resolution time trace for the Pol II cluster co-localizing with the active gene locus shows an apparent cluster lifetime of 6.3 s, consistent with the transient clusters observed generally throughout live MEF cell nuclei (Figure 1E). Black arrow indicates the onset of Pol II clustering, and blue arrows indicate apparent lifetime. The cell was imaged 5 min after serum induction (additional co-localization data at different times after serum induction are shown in Figure 4 and Figure 4—figure supplement 2).
Figure 2—figure supplement 1
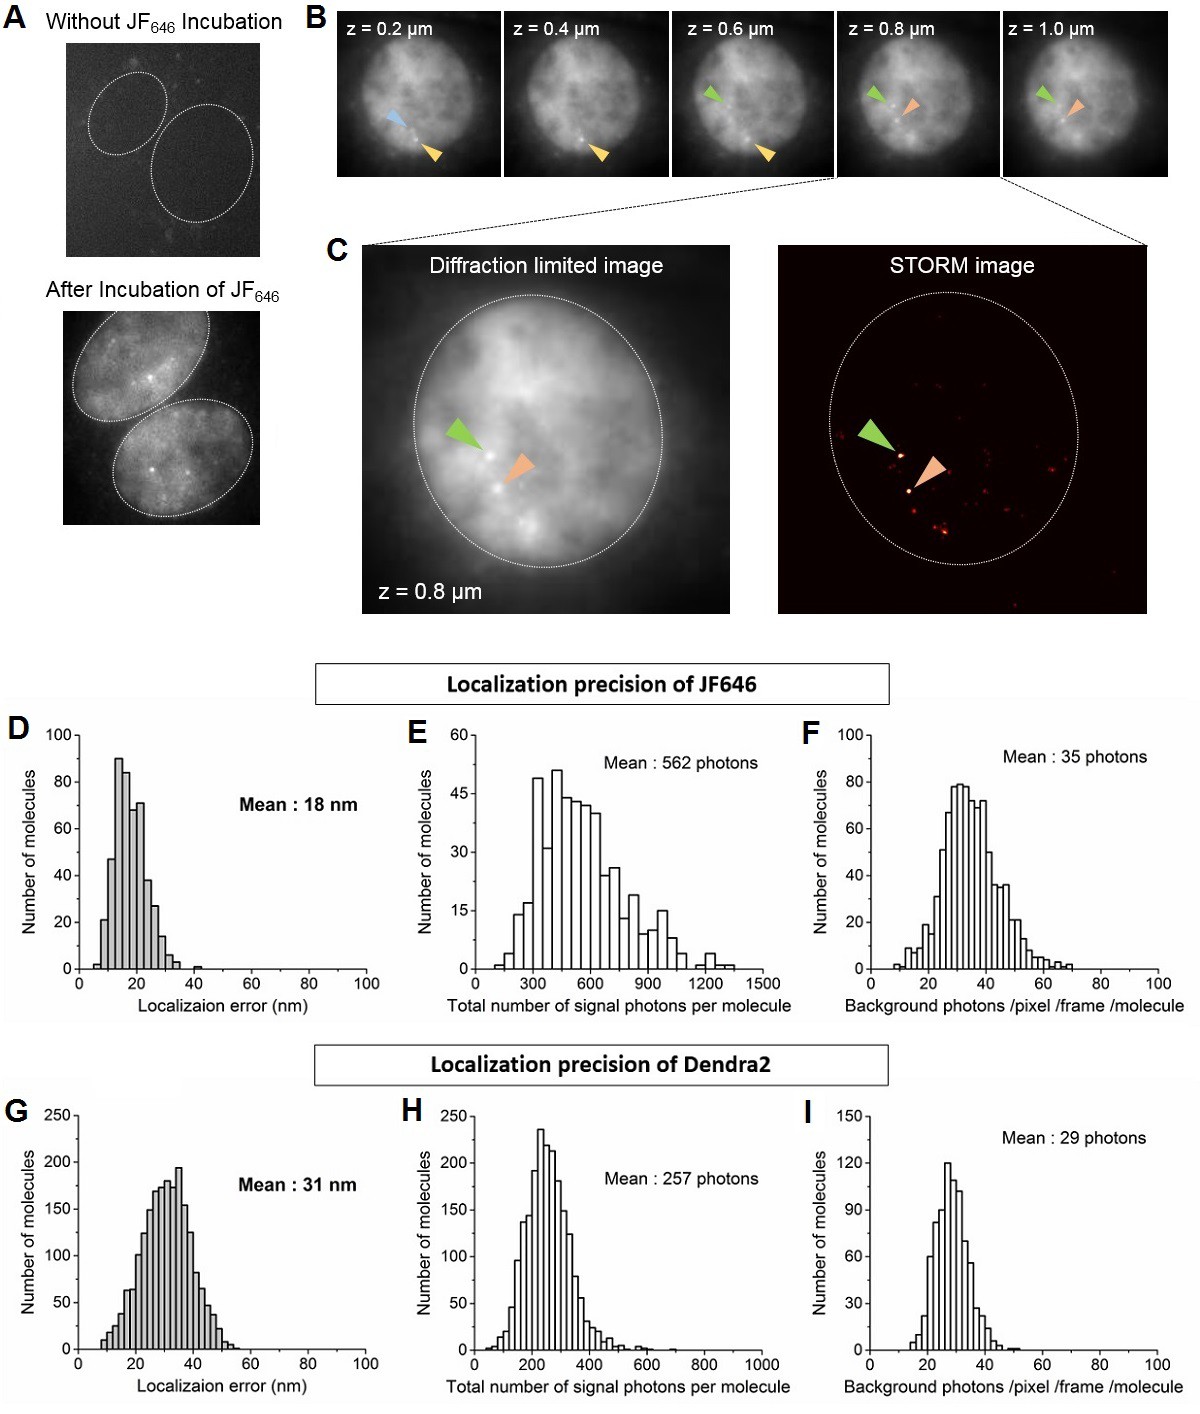
Identification of nascent transcription loci and localization precision of Dendra2 and JF646 as calculated from the live cell super-resolution data.
(A) Live cell images of MEFs before and after incubation with JF646 fluorophore, imaged 25 min after serum induction. With 642 nm laser excitation, there is no detectable fluorescence for cells in the absence of JF646. Distinct foci are visible following 1 hr incubation with JF646. Dotted lines delineate the cell nucleus. (B) For a single living cell nucleus, as we move vertically from the coverslip, distinct bright punctate loci (blue, yellow, green and orange arrows) come to focus in different focal planes. These loci with fluorescence intensities higher than the background labeled mRNA molecules are interpreted as β-actin gene loci, where multiple nascent mRNA molecules are synthesized. Throughout a whole cell nucleus we identified at most 4 nascent transcription loci per cell, consistent with the previous report that the original cell-line was tetraploid (Lionnet et al., 2011a). (C) For super-resolution imaging, a single plane with at least one locus is selected; live cell super resolution image of an MEF at a single plane in the nucleoplasm depicting two β-actin gene foci (orange and green arrows, same cell as in B) is represented. (D and G) Distributions oflocalization error as measured. (E and H) total number of signal photons per molecule and (F and I) number of background photons per pixel per frame per molecule for Dendra2 and JF646, respectively. The average localization precision was calculated to be 31 nm for Dendra2, and 18 nm for JF646.
Figure 2—figure supplement 2
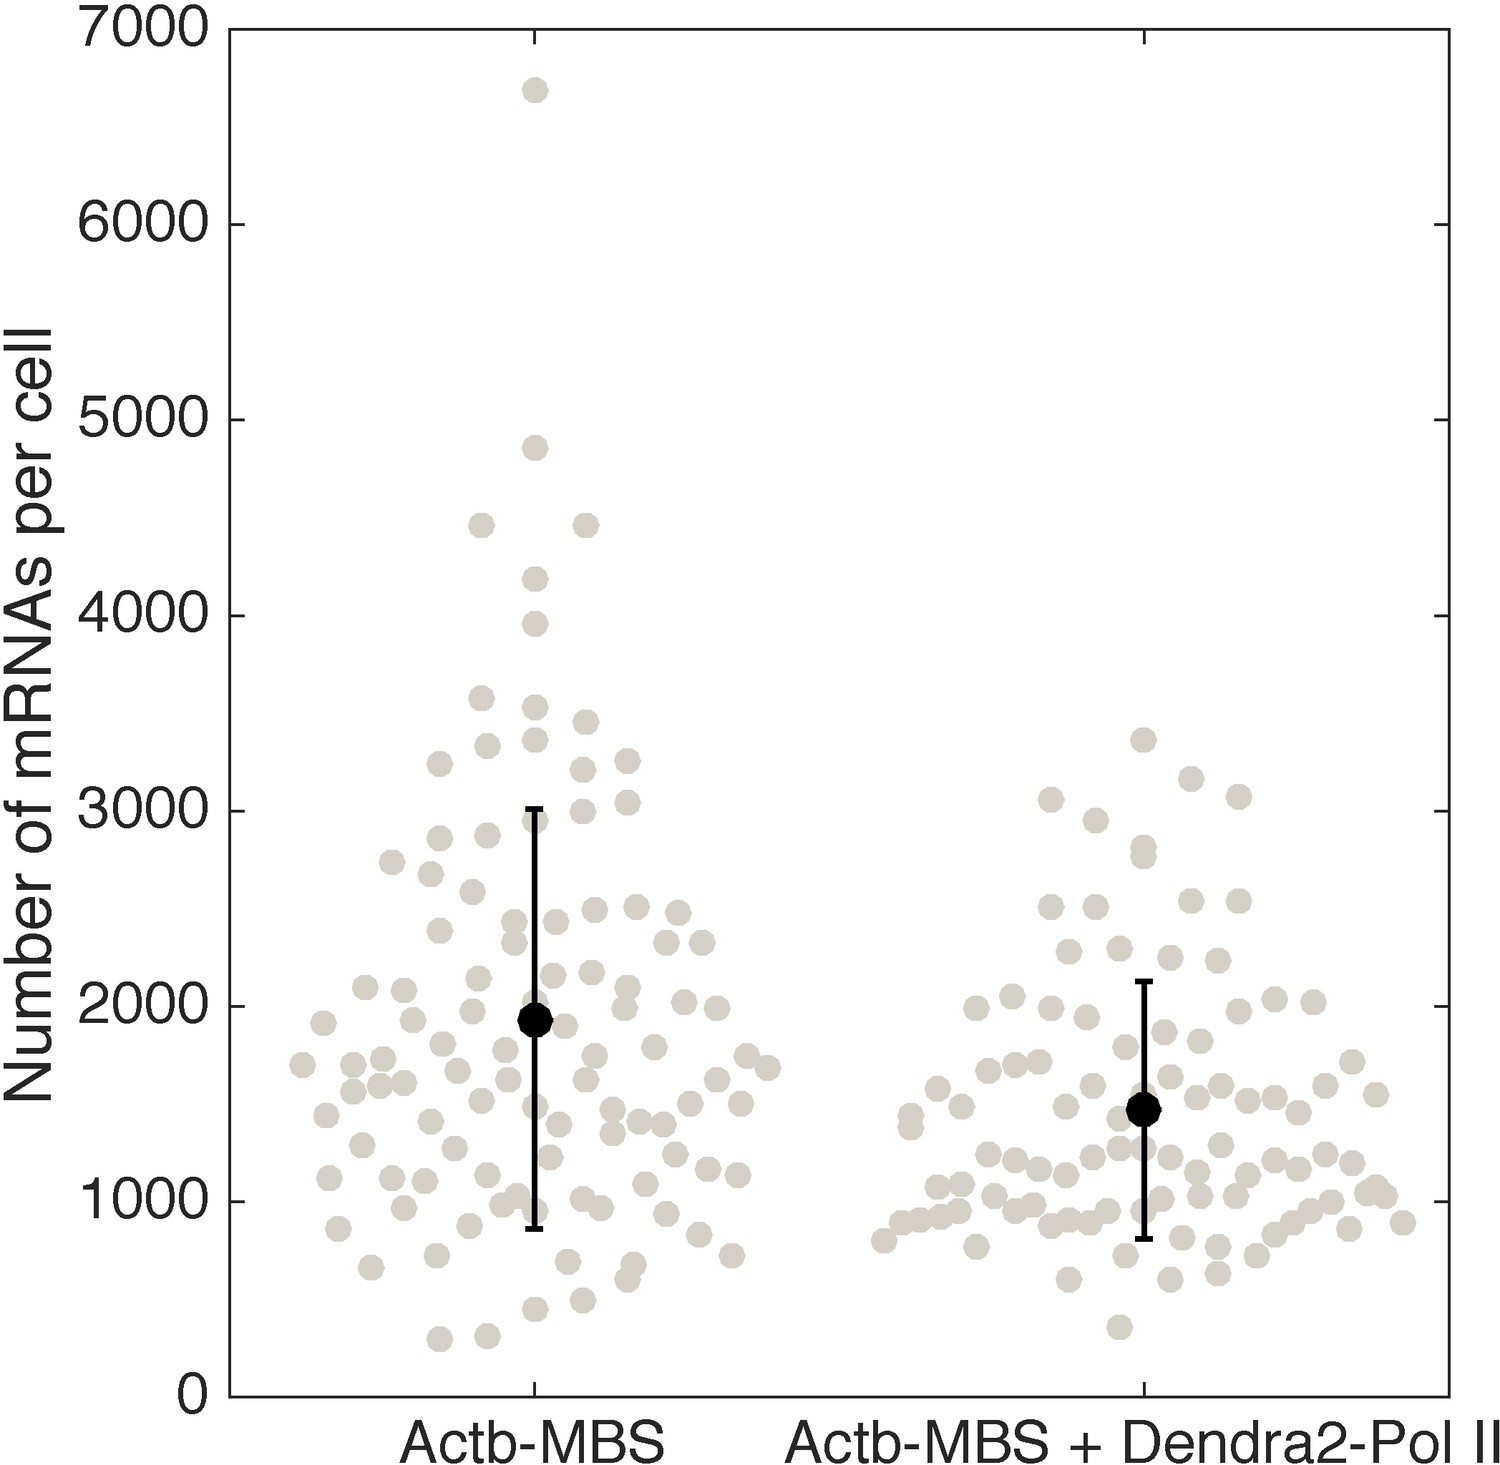
Quantification of β-actin mRNA copy number per cell (using smFISH) in the cell line expressing Dendra2–Pol II, compared to the cell line not expressing Dendra2–Pol II.
Expression of Dendra2-Pol II does not affect beta-actin mRNA expression. Quantification of mRNA copy number per cells (measured by single molecule mRNA FISH) for cells that do not express Dendra2-Pol II (left, mean=1936, STD = 1075, N=103 cells), compared to cells that express Dendra2-Pol II (right, mean=1468, STD = 658, N=96 cells).
Figure 3 with 1 supplement
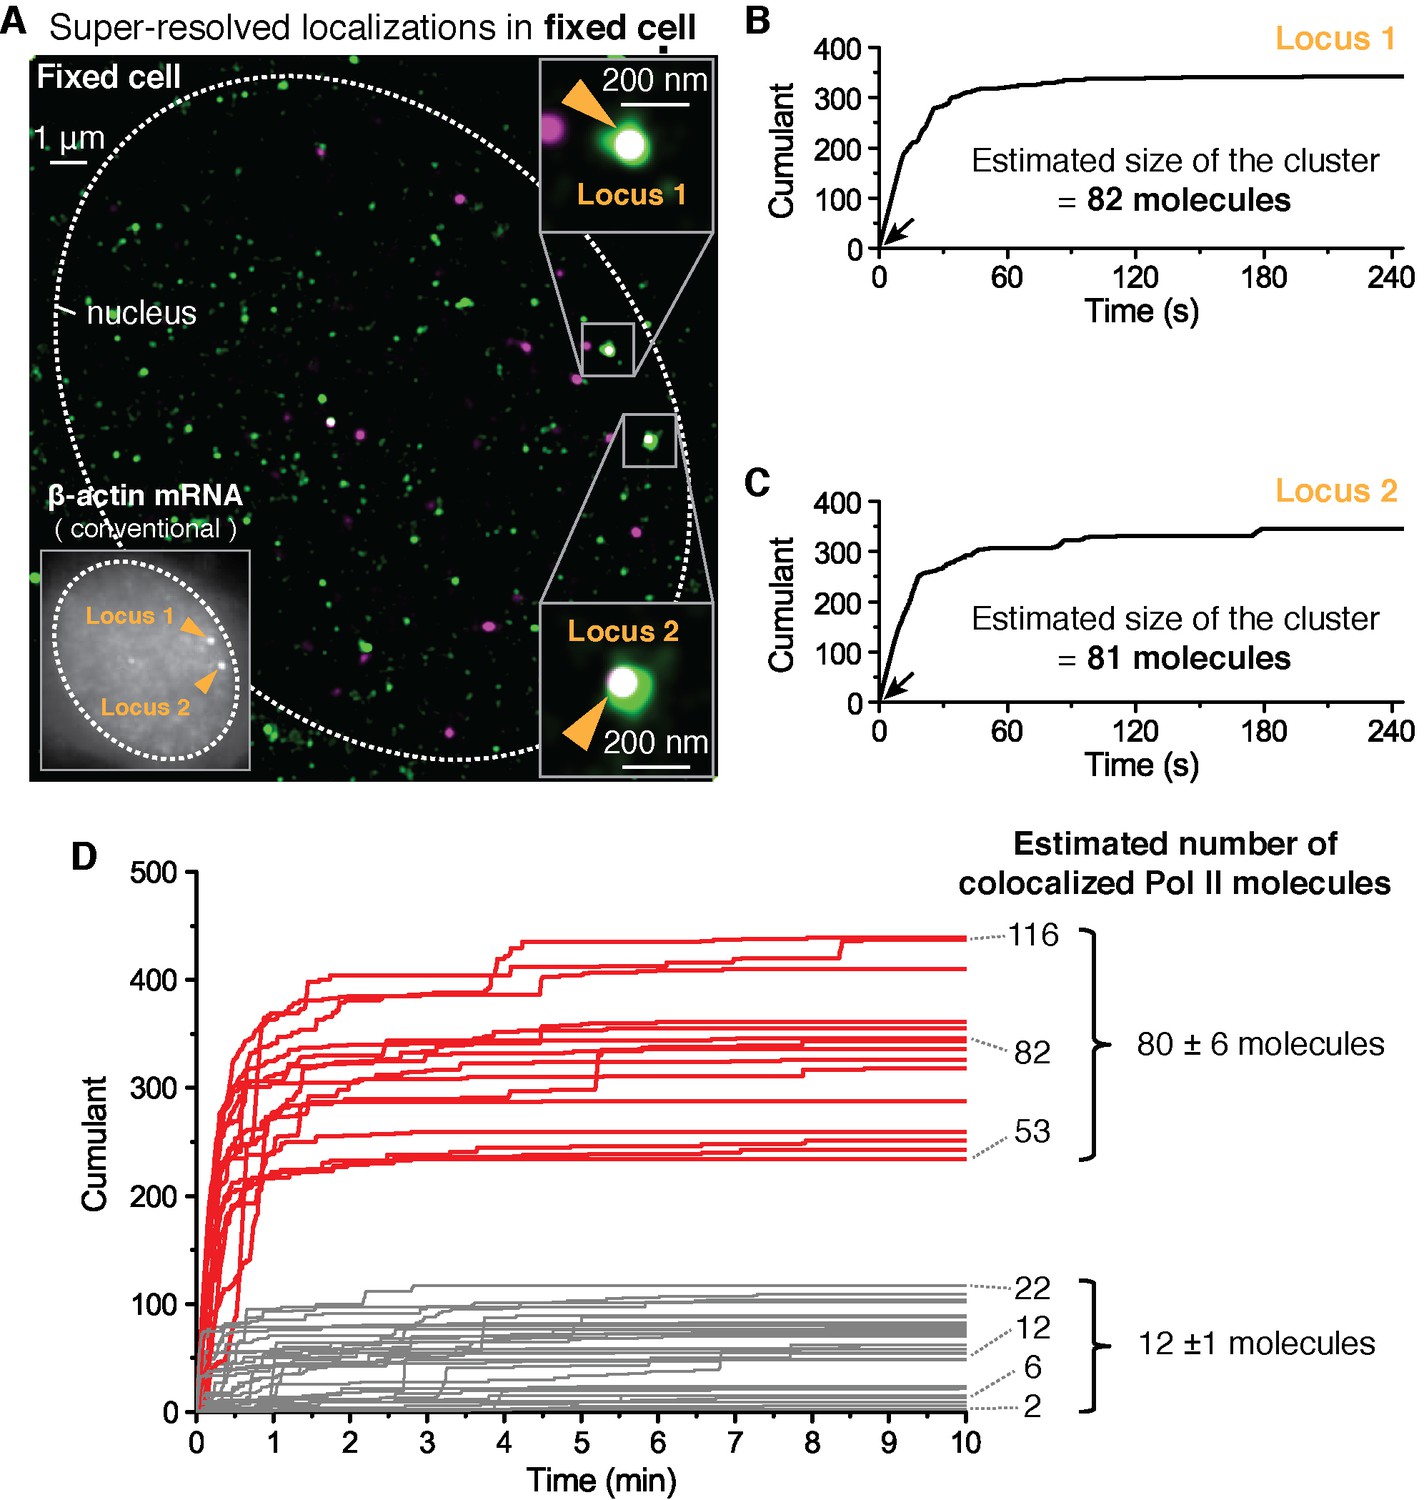
Fixed cell super resolution analyses reveal Pol II clusters are more numerous than polymerases actively transcribing the β-actin gene.
(A) The merged, super-resolved image of Dendra2-Pol II (green, PALM) and JF646-β-actin mRNA (magenta, STORM) is presented for a MEF cell chemically fixed 12 min after serum stimulation. (A, left inset) conventional fluorescence image shows two bright gene loci (orange arrows, indicated as “Locus 1” and “Locus 2”) in the same plane of focus for the same cell. In a fixed cell background non-diffusing mRNA may also appear as puncta of lower intensity in both conventional, and STORM images. (A, right insets) Co-localized Pol II clusters are detected on both gene loci. Standard magenta and green are used for β-actin mRNA and Pol II respectively, such that co-localizations appear as white. (B, C) The cumulant graphs for the two co-localized Pol II clusters are represented for Locus 1 and Locus 2, respectively. Note the slope onset (black arrows) from the start of acquisition indicative of stable clusters as expected for fixed cells. Both cumulant graphs feature total counts greater than 200 detections. The estimation of the count of Dendra2-Pol II molecules in the cluster is ~80 molecules for each locus. (D) Cumulant graphs of co-localized Pol II signals from 34 fixed cells are represented. More frequent are Pol II accumulations with relatively low counts of detections (in gray, 29 out of 44 cumulants), and molecule counts consistent with the number of Pol II engaged in β-actin mRNA synthesis (see Figure 3—figure supplement 1H). These may likely represent elongating Pol II. Also featured in the cumulant graphs are large Pol II clusters (in red, 15 out of 44 cumulants) with total counts greater than 200 detections, and molecular counts significantly higher than expected for elongating Pol II on a β-actin gene. These likely represent the rare transient clusters observed in living cells, captured during the fixation process. For the estimated number of Dendra2-Pol II molecules for a selection of Pol II cumulants, see Appendix 4,5 and Figure 3—figure supplement 1. Temporal localization profiles for 44 Pol II clusters co-localized with β-actin gene loci are available in Figure 3—source data 1.
-
Figure 3—source data 1
Source data for 3D.
Time-dependent detection profiles of accumulated Dendra2-Pol II co-localized with β-actin mRNA foci in fixed cells are provided.
- https://doi.org/10.7554/eLife.13617.011
Figure 3—figure supplement 1
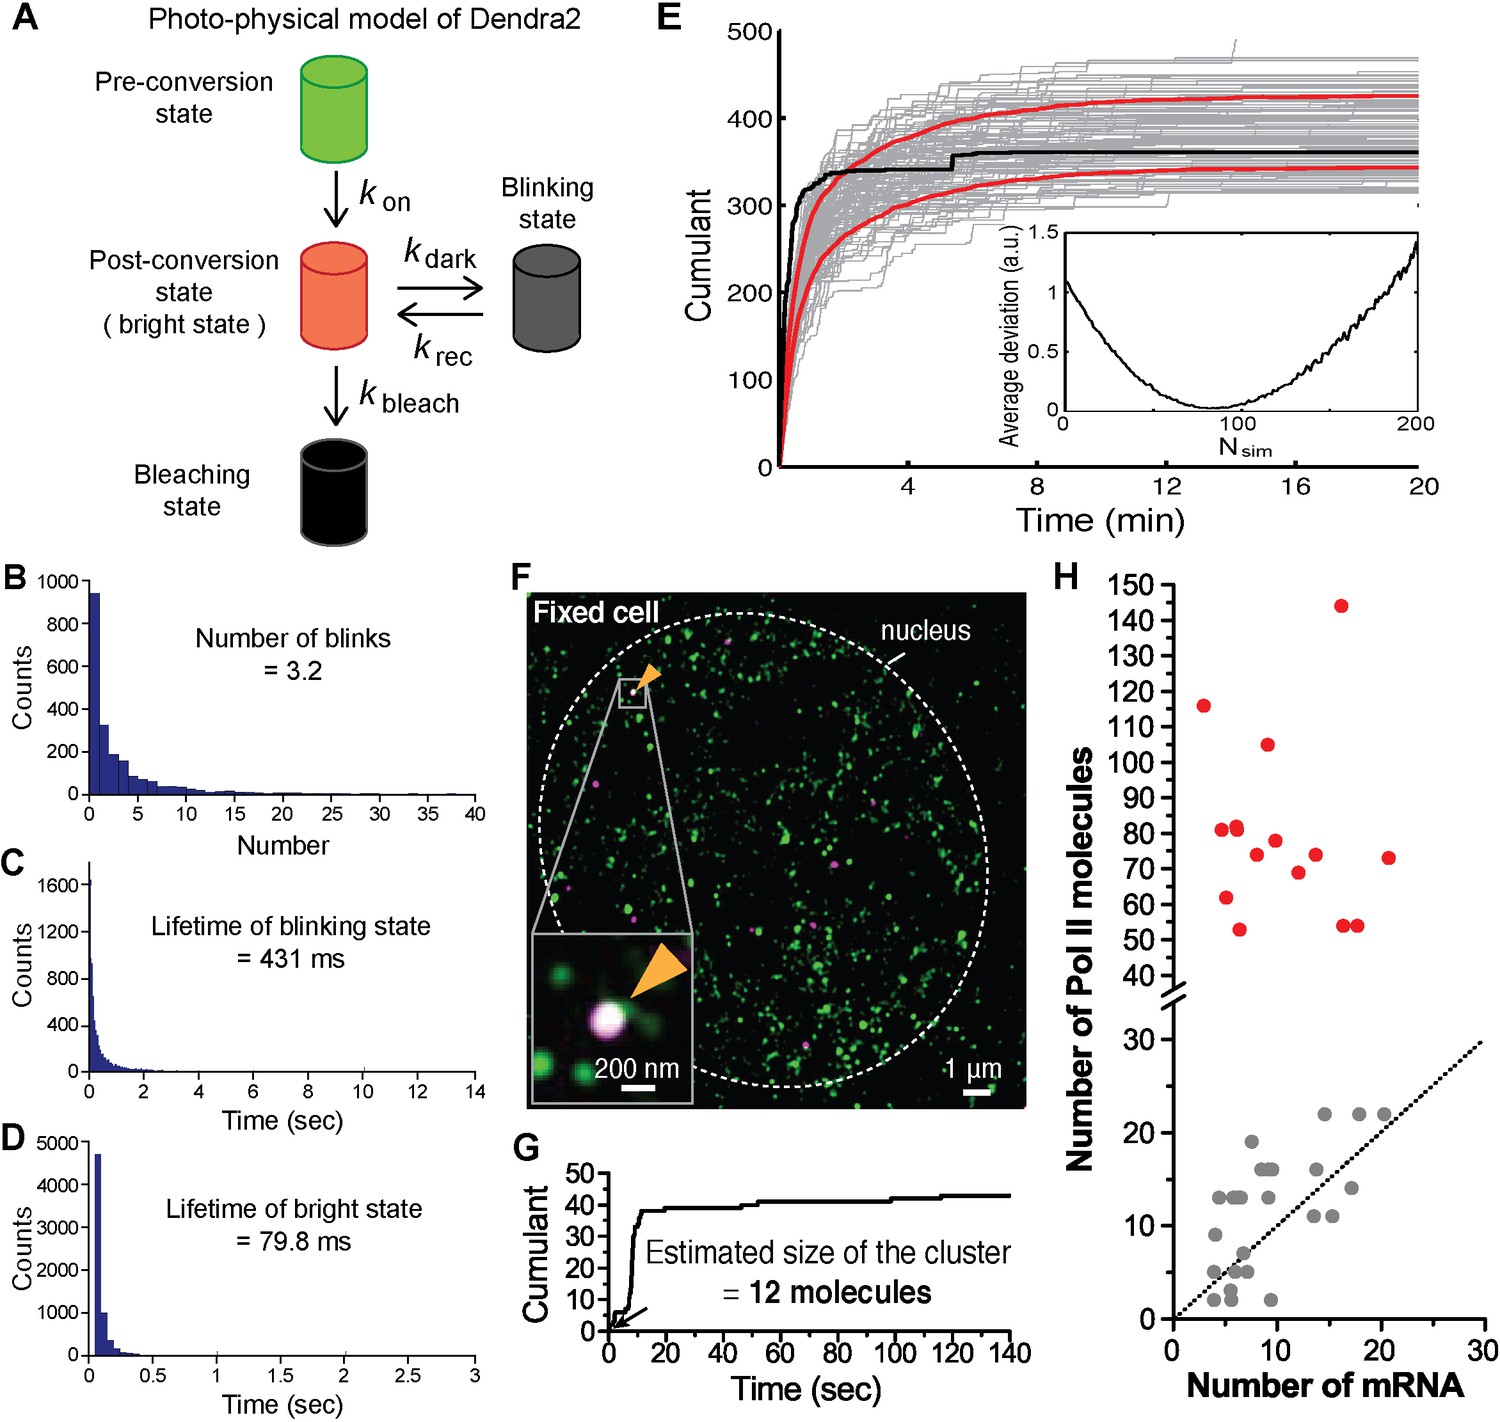
Estimation of cluster size with photo-physical parameters of Dendra2.
(A) Photo-physical model of Dendra2 fluorescence emission is presented. (B) The average number of blinks, and the average lifetimes in the (C) blinking and (D) bright states of Dendra2, analyzing signals from 2627 free Dendra2 molecules in 13 fixed cells. (E) Estimating the number of molecules in a cluster. The experimentally observed cumulant (black) is compared to 100 simulated cumulants (gray). Red curves indicate mean ± standard deviation of the simulated cumulants. Inset: An estimate for the number of molecules in a cluster is obtained by finding the minimum average deviation (here: Nsim = 81). (F) An example co-localization of Dendra2-Pol II and JF646-β-actin mRNA in a fixed cell. (Top left) A conventional fluorescence image of JF646-β-actin mRNA shows a bright locus (orange arrows). (Right) A co-localized Pol II cluster was detected on the gene locus. (Bottom left) A cumulant graph for the Pol II cluster is represented. (G) Corresponding cumulant graph features a total count ~40 detections. The estimation of the count of Dendra2-Pol II in the cluster is 12 molecules, presumed elongating active Pol II on the gene. (H) For the small accumulations (cumulants in gray in Figure 3D), there is a correlation between the estimated number of Pol II molecules and the estimated number of nascent mRNA at the same gene locus in the same cells; this suggests that the small accumulations observed in fixed cell may be attributed to elongating polymerases on the gene locus. The correlation between Pol II counts and mRNA counts breaks down for large clusters (red); the large clusters are not attributable to elongating polymerases.
Figure 4 with 2 supplements
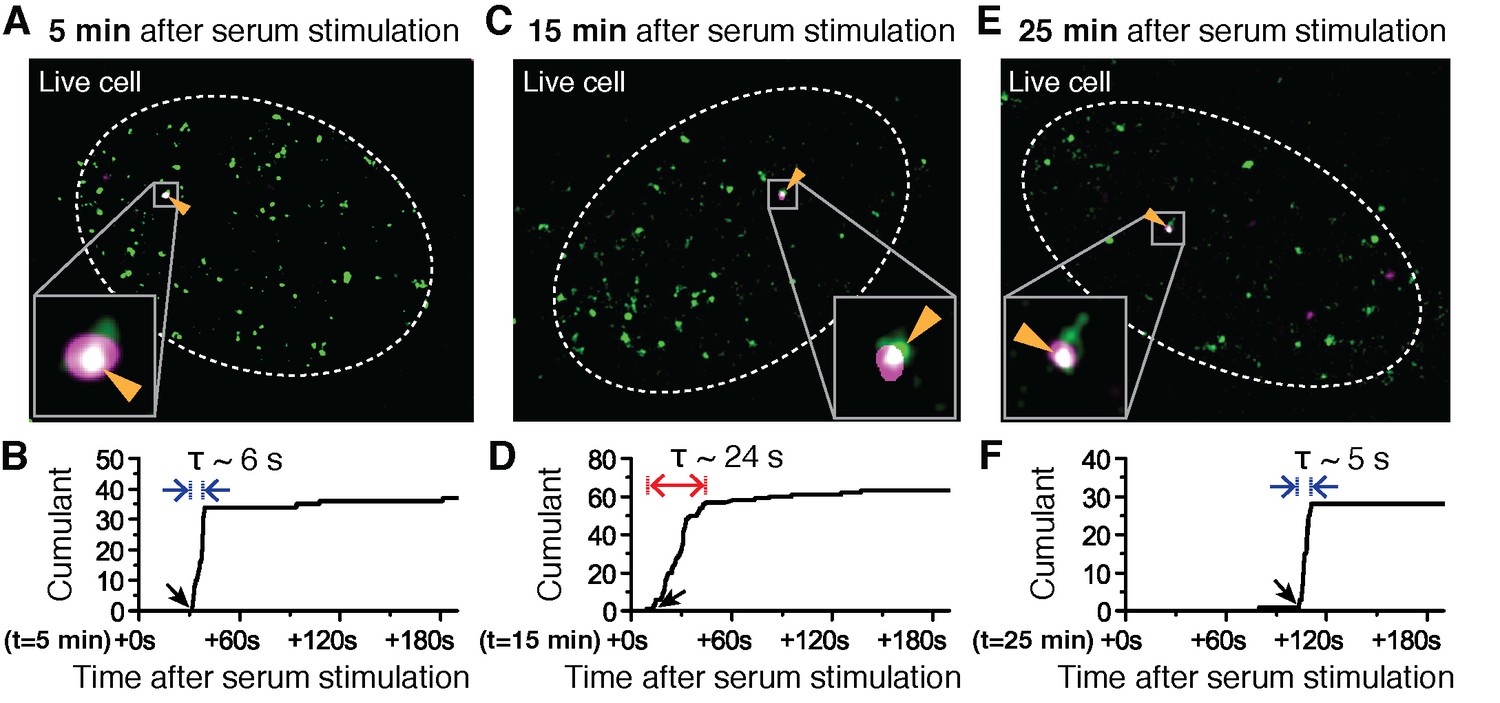
Super-resolved co-localization images of Dendra2-Pol II and JF646-β-Actin mRNA at 5, 15 and 25 minutes after serum-induction.
(A–C) Illustrated are three representative cells imaged at different time points after serum stimulation. Each cell shows co-localization between the pre-selectedβ-actin gene locus and a Pol II cluster in the merged super-resolved image. Magenta and green are used for β-actin mRNA and Pol II respectively, such that co-localization appears as white (D–F) Cumulant graphs of the Pol II clusters co-localizing with the nascent gene loci are represented. Consistently, cells imaged around 10 to 15 min after serum stimulation show increased cluster lifetime (red arrow in E), compared to clusters occurring outside that time window (blue arrows in D, F). The apparent lifetimes of the co-localized Pol II clusters are 6.3 s (D, blue arrows), 24.2 s (E, red arrows) and 4.8 s (F, blue arrows), for the cells imaged respectively at 5, 15 and 25 min after serum stimulation (additional examples at different times after serum induction are shown in Figure 4—figure supplement 2).
Figure 4—figure supplement 1
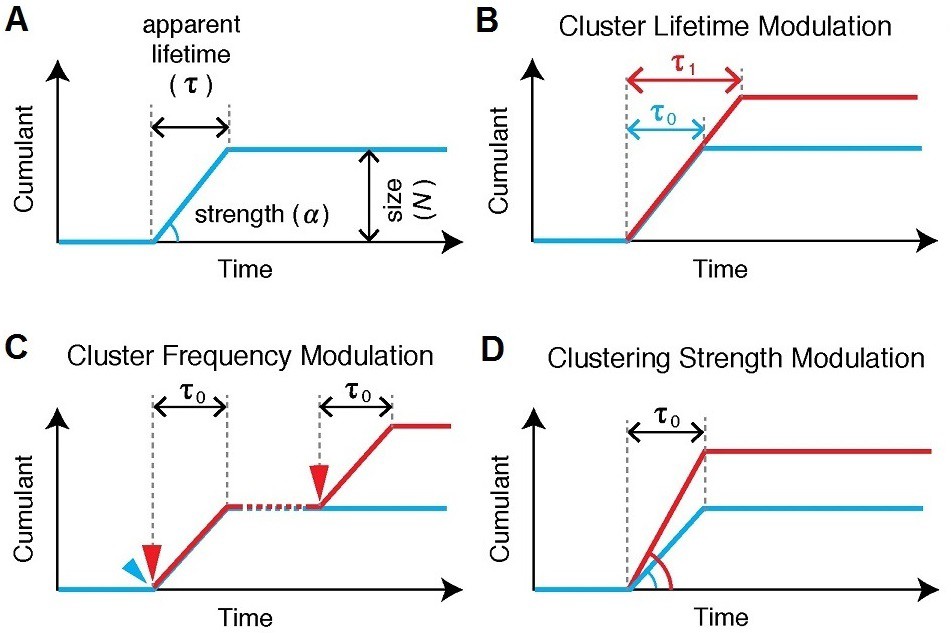
Various cluster modulation models.
(A) Characteristics of Pol II clustering profile are illustrated for tcPALM’s time-dependent cumulative detection plots. Time-correlated detections of Pol II clustering can be characterized with a lifetime, a burst size and clustering strength (by proxy , the deviation angle in the cumulative plot, where the rate of detection is given by ). If a modulation in Pol II clustering dynamics occurs, such modulation gives rise to different temporal signatures which should be quantitatively evident in tcPALM; these possible changes include: (B) a modulation of the lifetime, i.e. the apparent clustering dwell time, (C) a modulation of the cluster frequency, i.e. the number of distinct clustering events that occur per unit time and (D) a modulation of the clustering strength, i.e. the apparent local spatial density of detections.
Figure 4—figure supplement 2
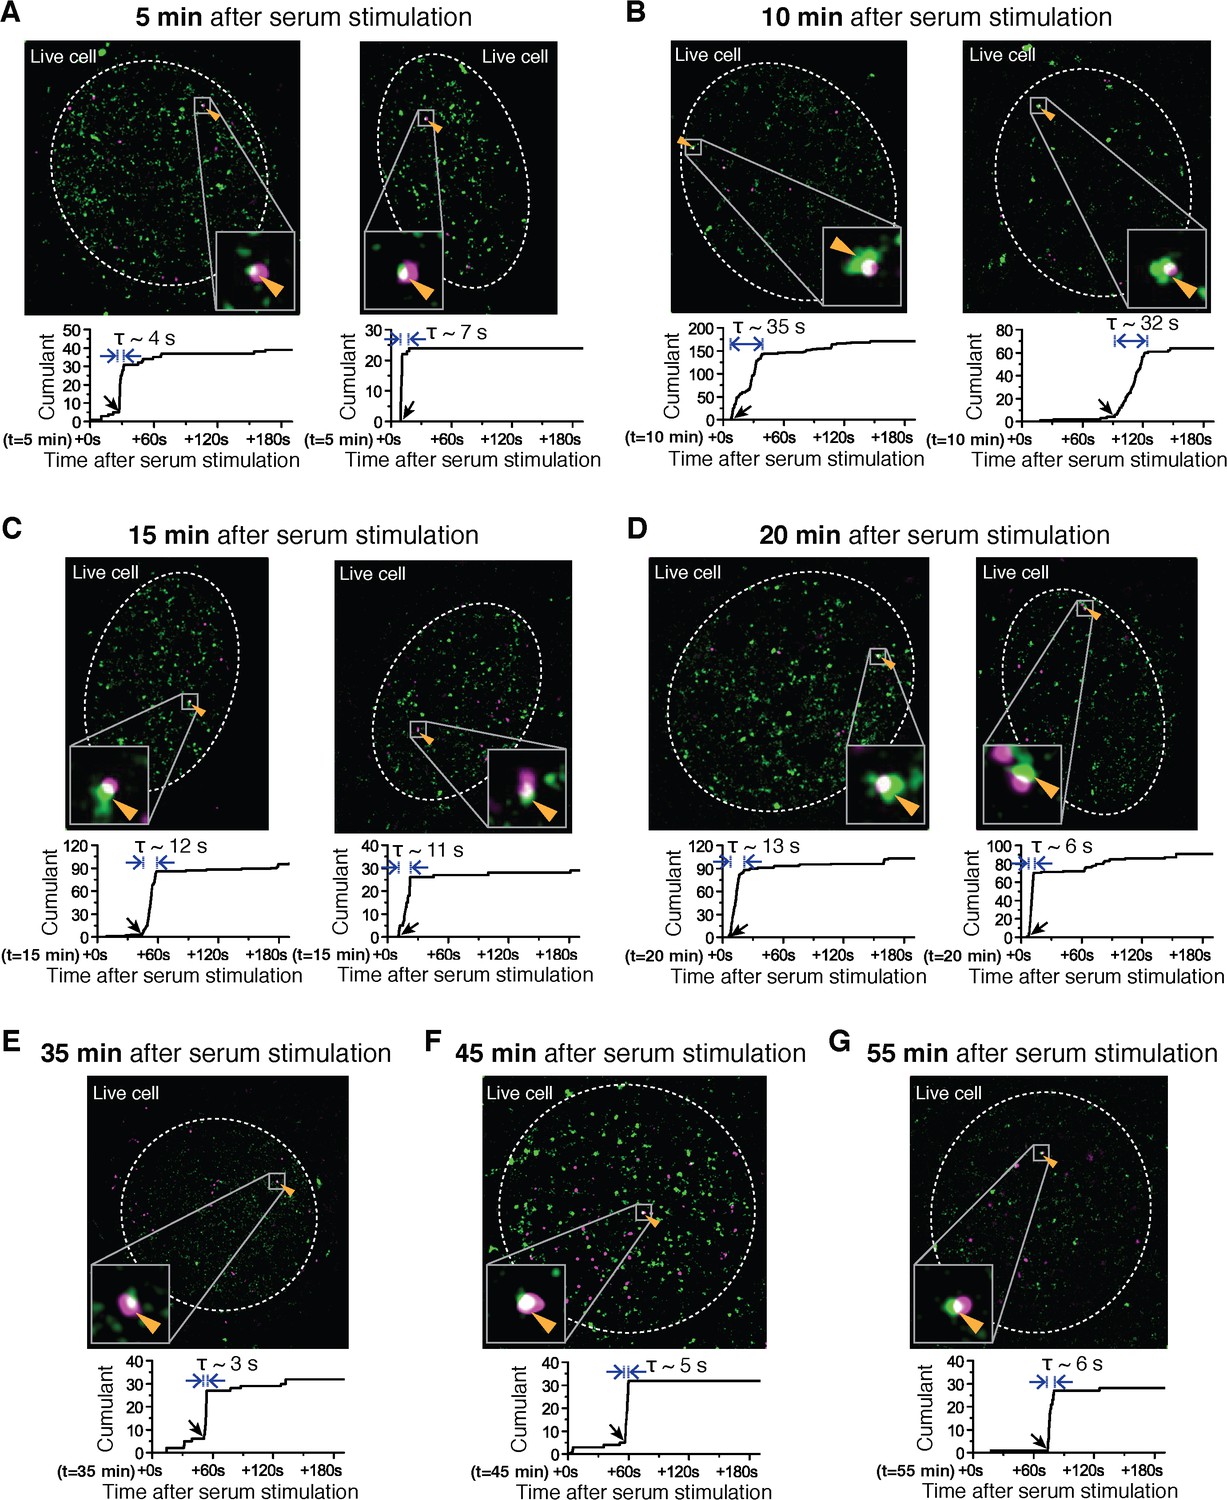
Examples of dual color super-resolved co-localization images of Dendra2-Pol II and JF646-β-actin mRNA at different time after serum-induction.
(A–G) Examples of merged super-resolved images and corresponding cumulant graphs of the Pol II clusters co-localizing with the nascent gene loci are presented for living cells imaged 5 min, 10 min, 15 min, 20 min, 35 min, 45 min or 55 min after serum-stimulation.
Figure 5 with 2 supplements

Pol II clustering lifetime correlates with the number of nascent β-Actin mRNAs in living cells.
(A) Average lifetime for Pol II clusters co-localizing with nascent β-actin gene loci are plotted as a function of time after serum induction. The gray circles represent individual clustering events. 160 clusters from 89 dual-color super-resolved living cells were used in this graph. Horizontal dashed line represents the median of Pol II cluster lifetimes (6.9 s) from all the 160 clusters. The black dots are binned average lifetime from the pool of individual clusters. A peak Pol II clustering lifetime of 24 (± 3) s appears 12.5 min after serum stimulation. For each binned data point (black dots), we averaged N = 4 to N = 31 clusters (gray circles) co-localizing on the β-actin gene locus in a living cell imaged at the indicated time after stimulation. Error bars represent standard error of the mean. (B) Time-dependent plot of the average number of nascent mRNA per β-actin gene locus. A peak in mRNA output of 18 (± 3) nascent transcripts appeared 15 min after serum stimulation. Horizontal dashed line represents median of nascent mRNA outputs (4.5 transcripts). For each data point we averaged nascent mRNA counts from a minimum N=4 living cells imaged at the indicated time after stimulation. Error bars represent standard error of the mean. (C) Top: Time traces from panels A and B are overlaid to illustrate an observed time lag (delay Δt) between the peak Pol II cluster lifetime (green) and the peak mRNA output (magenta). Bottom: The average number of nascent mRNA (offset by the experimentally observed delay Δt = 2.5 min) is plotted against the Pol II cluster lifetime. Data for the first 30 min representing the response period are used; remainder of the data representing the basal level (from 30–60 min in A and B) are plotted in Figure 5—figure supplement 1C. Error bars represent standard errors on the mean. (D, E) An input-output model may account for the linear correlation between Pol II cluster lifetime and mRNA output. (D) Pol II cluster lifetime used as model input (green) is overlaid with a plot of the best fit for the mRNA output (magenta) from theoretical model. A time lag (delay Δt) is observed in model. (E) Relationship between the model output for the average number of nascent mRNA (offset by the model delay Δt = 2 min), plotted against the model cluster lifetime input recapitulates a linear correlation analogous to our experimentally observed data in C (experimentally observed delay was Δt = 2.5 min, and best-fit model delay was Δt = 2 min).
-
Figure 5—source data 1
Source data for 5A, B and D.
- https://doi.org/10.7554/eLife.13617.017
Figure 5—figure supplement 1
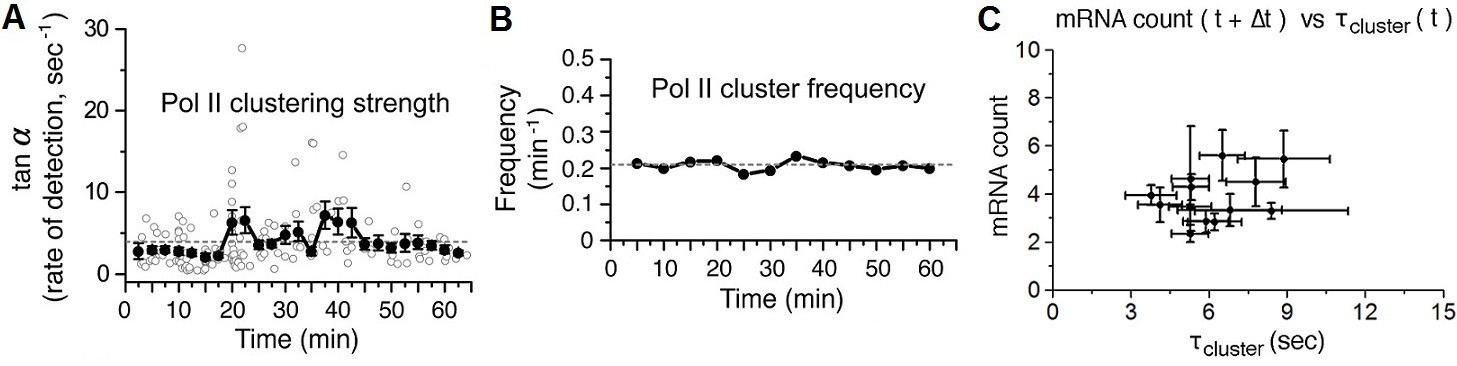
Time-dependent plots of spatial density and frequency of Pol II cluster, and a correlation Plot between number of mRNA and Pol II cluster lifetime 30–60 min after serum-stimulation.
(A) The spatial density (clustering strength) of Pol II cluster is measured and (B) thefrequency of Pol II clustering on the gene is plotted. Both clustering strength and frequency remain relatively unchanged up to an hour after serum stimulation. Error bars represent standarderrors on the mean of multiple cells imaged at the given time points, and horizontal gray dashed lines are representing medianvalue of each graphs. (C) The average number of nascent mRNA (offset by the delay Δt = 2.5 min) is plotted against the Pol II cluster lifetime. Data from 30–60 min representing the basal level in Figure 5A,B are plotted. Error bars represent standard errors on the mean.
Figure 5—figure supplement 2
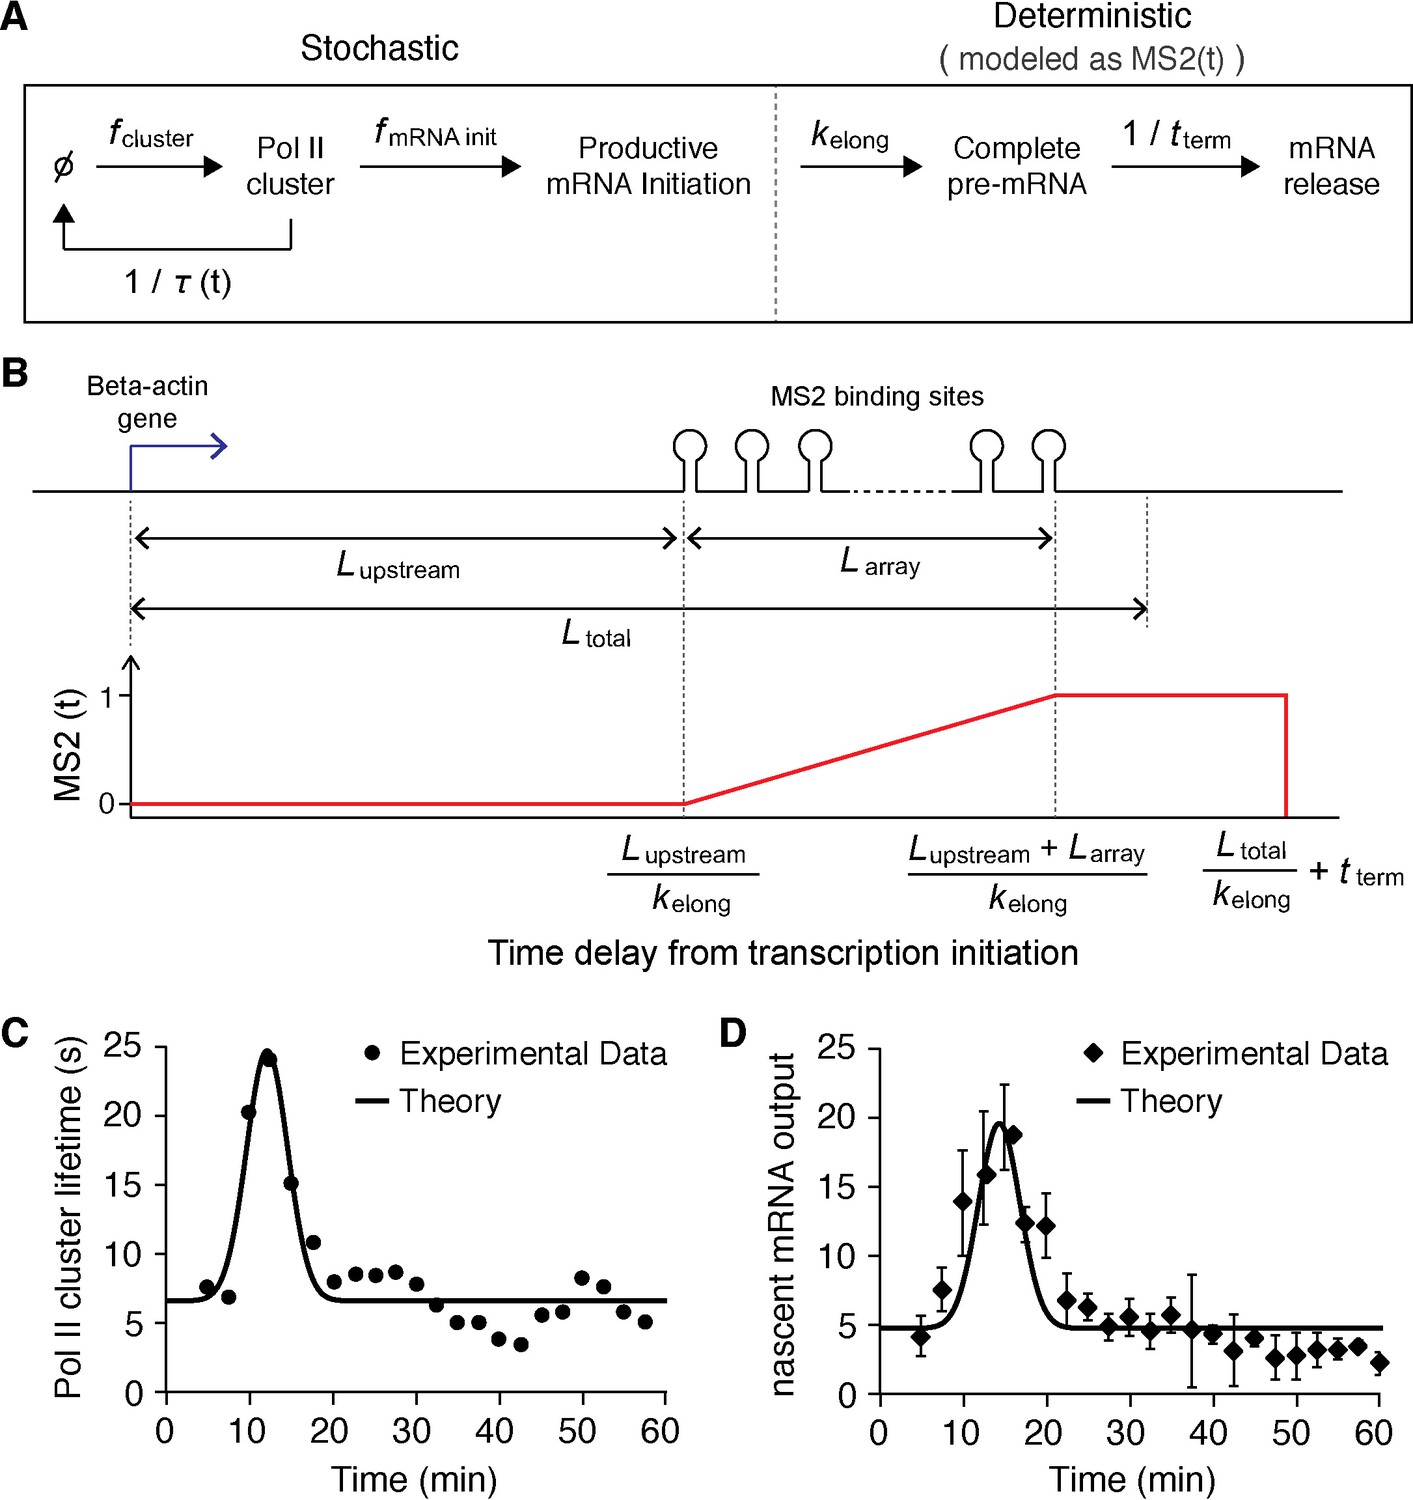
Stochastic model of Pol II clustering dependent transcriptional output.
(A) Schematic representation of a stochastic model of clustering. Transcription can occur during clustering events, but the gene is assumed inactive between clustering events. During a cluster, productive Pol II molecules are loaded stochastically with an effective rate assumed here to be constant. Pol II elongation proceeds up to the MS2 binding cassette that labels the mRNA, when the mRNA fluorescence read out starts. All kinetic rates are constant, at the exception of the lifetime of the clusters τ which varies as a function of time after serum addition (see panel C) (B) Based on the lengths of the respective parts of the construct, we build a model for the fluorescence of the nascent chain after initiation MS2(t). (C) Pol II clustering duration as a function of time after serum addition experimental data (same as Figure 5A, solid circles) is overlaid with the simplified Gaussian profile we used as an input in our theoretical model (black line). (D) Experimental data for the time-dependent average number of nascent mRNAs per β-actin gene locus (same as panel Figure 5B, circles) is well fitted by our theoretical model (black line).
Figure 6 with 2 supplements
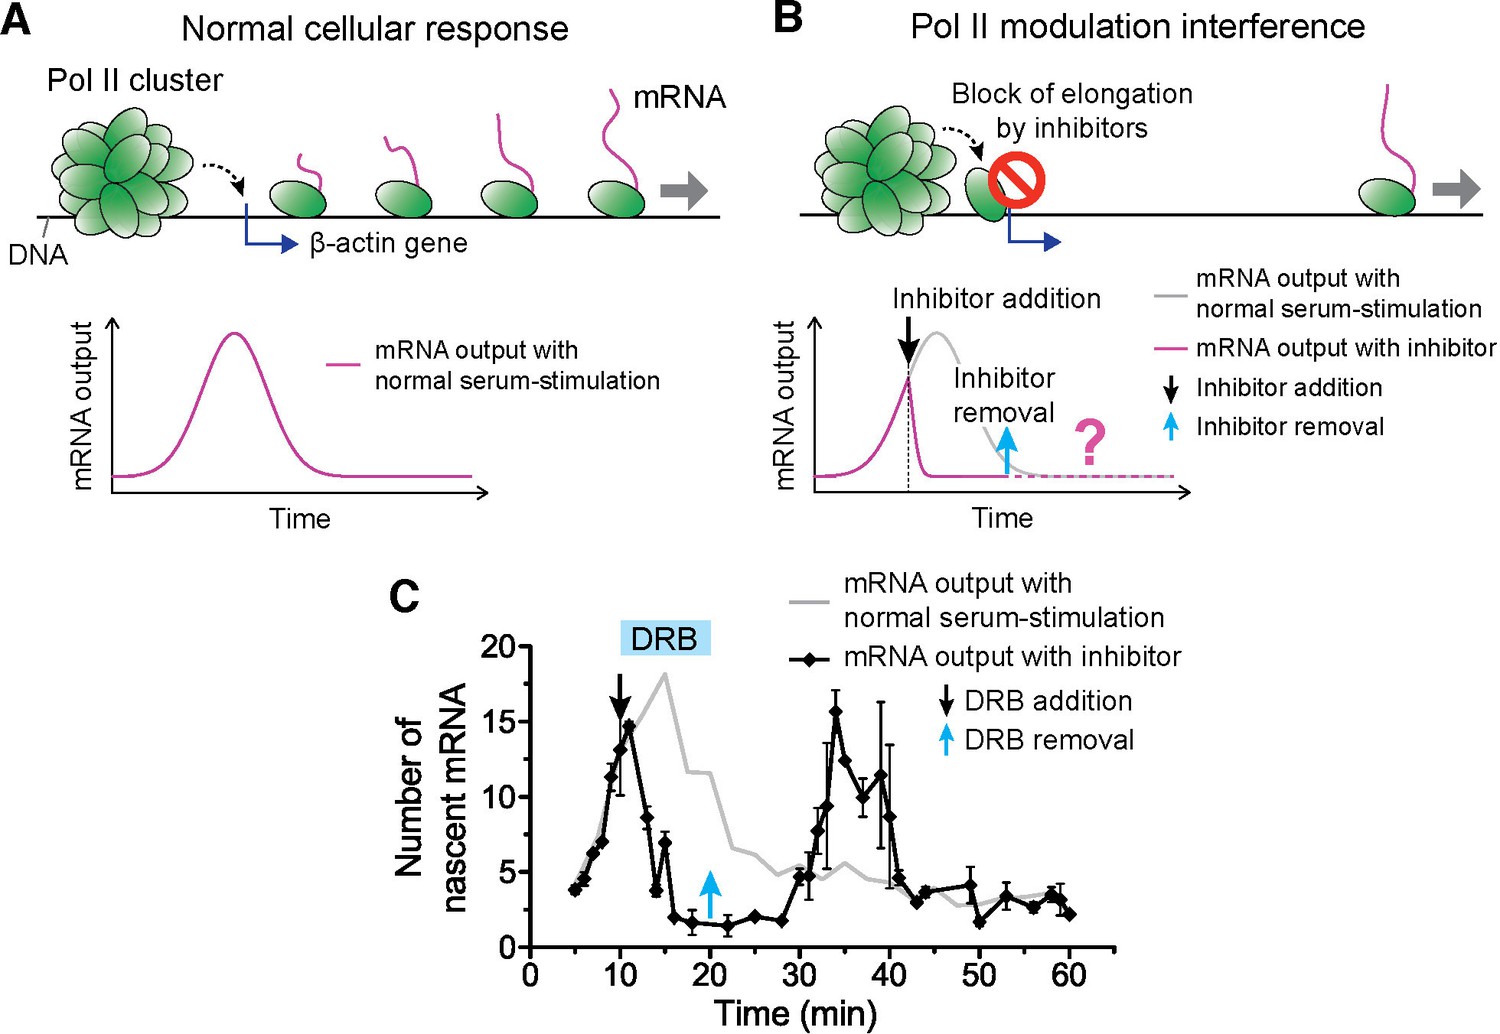
Drug interfering with promoter escape and Pol II clustering suppresses then re-induces gene bursting, at will, in living cells.
(A) With serum stimulation, a stereotyped mRNA response with a single peak can be expected. (B) Adding DRB, a drug that prevents promoter escape blocks one Pol II in the promoter proximal paused state thereby preventing new Pol II loading. A gradual decrease in nascent mRNA count is expected without new Pol II loading. Incidentally, we observe that blocking promoter escape leads to stable Pol II on the gene locus and throughout the living cell nucleus (Figure 6—figure supplement 1E). According to our model, the presence of this cluster should result in multiple Pol II loading (and thus gene bursting) when the blocking effect of the drug is reversed. (C) Data for the mRNA output in the drug treated cells (black) show a decrease in the β-actin signal upon addition of DRB. When the drug is removed, a second burst peak is observed in the mRNA output before a relaxation back to the basal mRNA level. Missing in this assay is the time between escape of the blocking Pol II and the subsequence cluster disassembly. The position of the second mRNA Peak is dependent on when DRB is removed (Figure 6—figure supplement 1F–I). The stereotypical β-actin mRNA output response, without DRB treatment, is represented in gray for comparison. For each data point we averaged nascent mRNA counts from a minimum of N=2 living cells imaged at the indicated time after stimulation. Error bars represent standard error of the mean.
-
Figure 6—source data 1
Source data for 6C and 6-figure supplement 1F-I.
Averaged numbers of nascent β-actin mRNA for each time point upon DRB addition/removal were provided.
- https://doi.org/10.7554/eLife.13617.021
Figure 6—figure supplement 1

Example time traces of Dendra2-Pol II in flavopiridol and DRB treated cells, transcriptional output response to flavopiridol, co-localization examples of stable Pol II clusters captured at β-actin gene loci minutes after flavopiridol and DRB treatment, and induction of transcriptional bursting at will with DRB.
Example time traces of stable Pol II cluster with (A) flavopiridol and (B) DRB treatment. (C) Time dependent estimated number of β-actinmRNA with addition of flavopiridol at different times after serum stimulation. Co-localization examples of stable Pol II clusters at the β-actin gene loci in the (D) flavopiridol and (E) DRB treated cells. (F–I) Time dependent estimated number of β-actinmRNA with addition and removal of DRB at different time points after serum stimulation. From F to I, DRB added at 10 min after serum-stimulation, then removed at 15, 20, 25 and 30 min after serum-stimulation. Gray line represents number of mRNA under serum-stimulation without inhibitor, shown in Figure 5B.
Figure 6—figure supplement 2
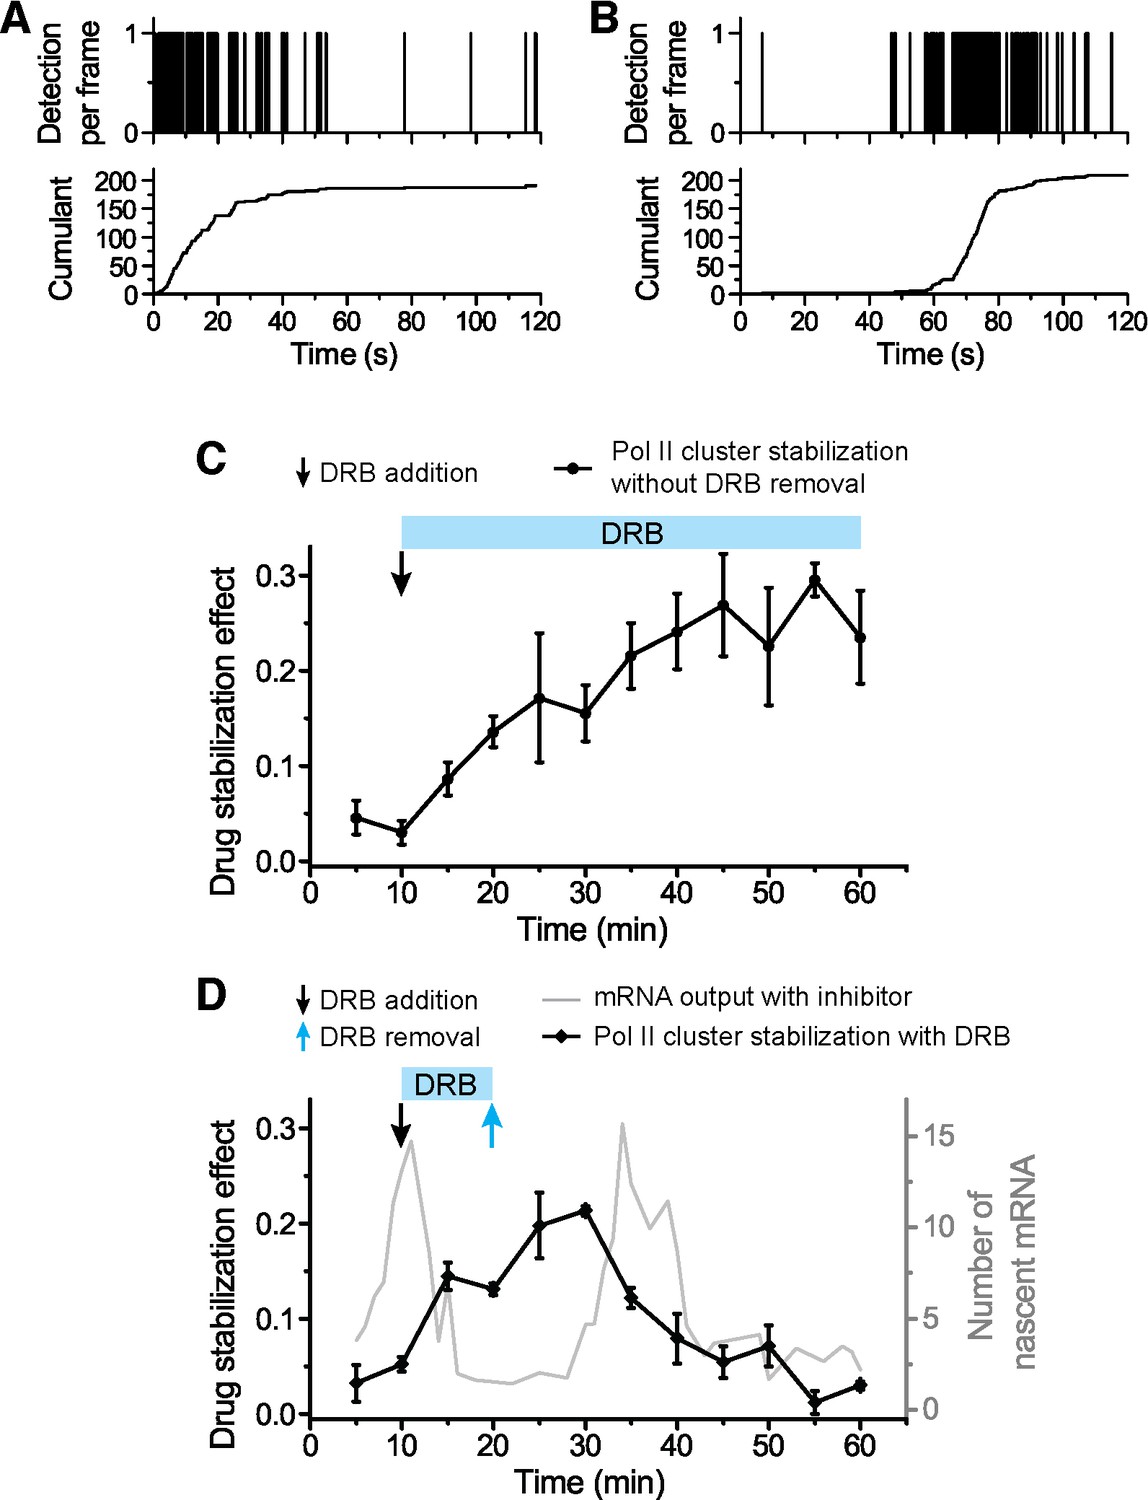
Global effects of DRB and DRB removal in stabilizing Pol II Clusters in living.
To measure the global effect of DRB on stabilizing Pol II clusters, we quantify the “stabilization effect” as the fraction of Pol II clusters with slope onset from the beginning of acquision (see example time trace in A). We note that drug stabilization can occur after start of acquisition (see example time trace in B) and these instances are not counted in the stabilization effect as we measure it; so the stabilization effect is not a full quantification of the total fraction of drug-stabilized clusters. (C) We observe an increase in the drug stabilization effect from immediately after drug treatment at the concentration used (see “DRB Treatment” section in Materials and methods). (D) Overlapping the drug addition/removal effect, with the induced mRNA bursting data (in gray, from Figure 6C), we observe an anti-correlation between the measured drug effect and when the draft changes in mRNA output occur. This observation suggests that the delays between drug removal (blue arrow) and second mRNA peak are attributable to the delay time for drug removal to take effect.
Download links
A two-part list of links to download the article, or parts of the article, in various formats.
Downloads (link to download the article as PDF)
Open citations (links to open the citations from this article in various online reference manager services)
Cite this article (links to download the citations from this article in formats compatible with various reference manager tools)
RNA Polymerase II cluster dynamics predict mRNA output in living cells
eLife 5:e13617.
https://doi.org/10.7554/eLife.13617


