Disruption of glycolytic flux is a signal for inflammasome signaling and pyroptotic cell death
- Stanford University School of Medicine, United States
- Boston College, United States
Figures
Figure 1 with 2 supplements
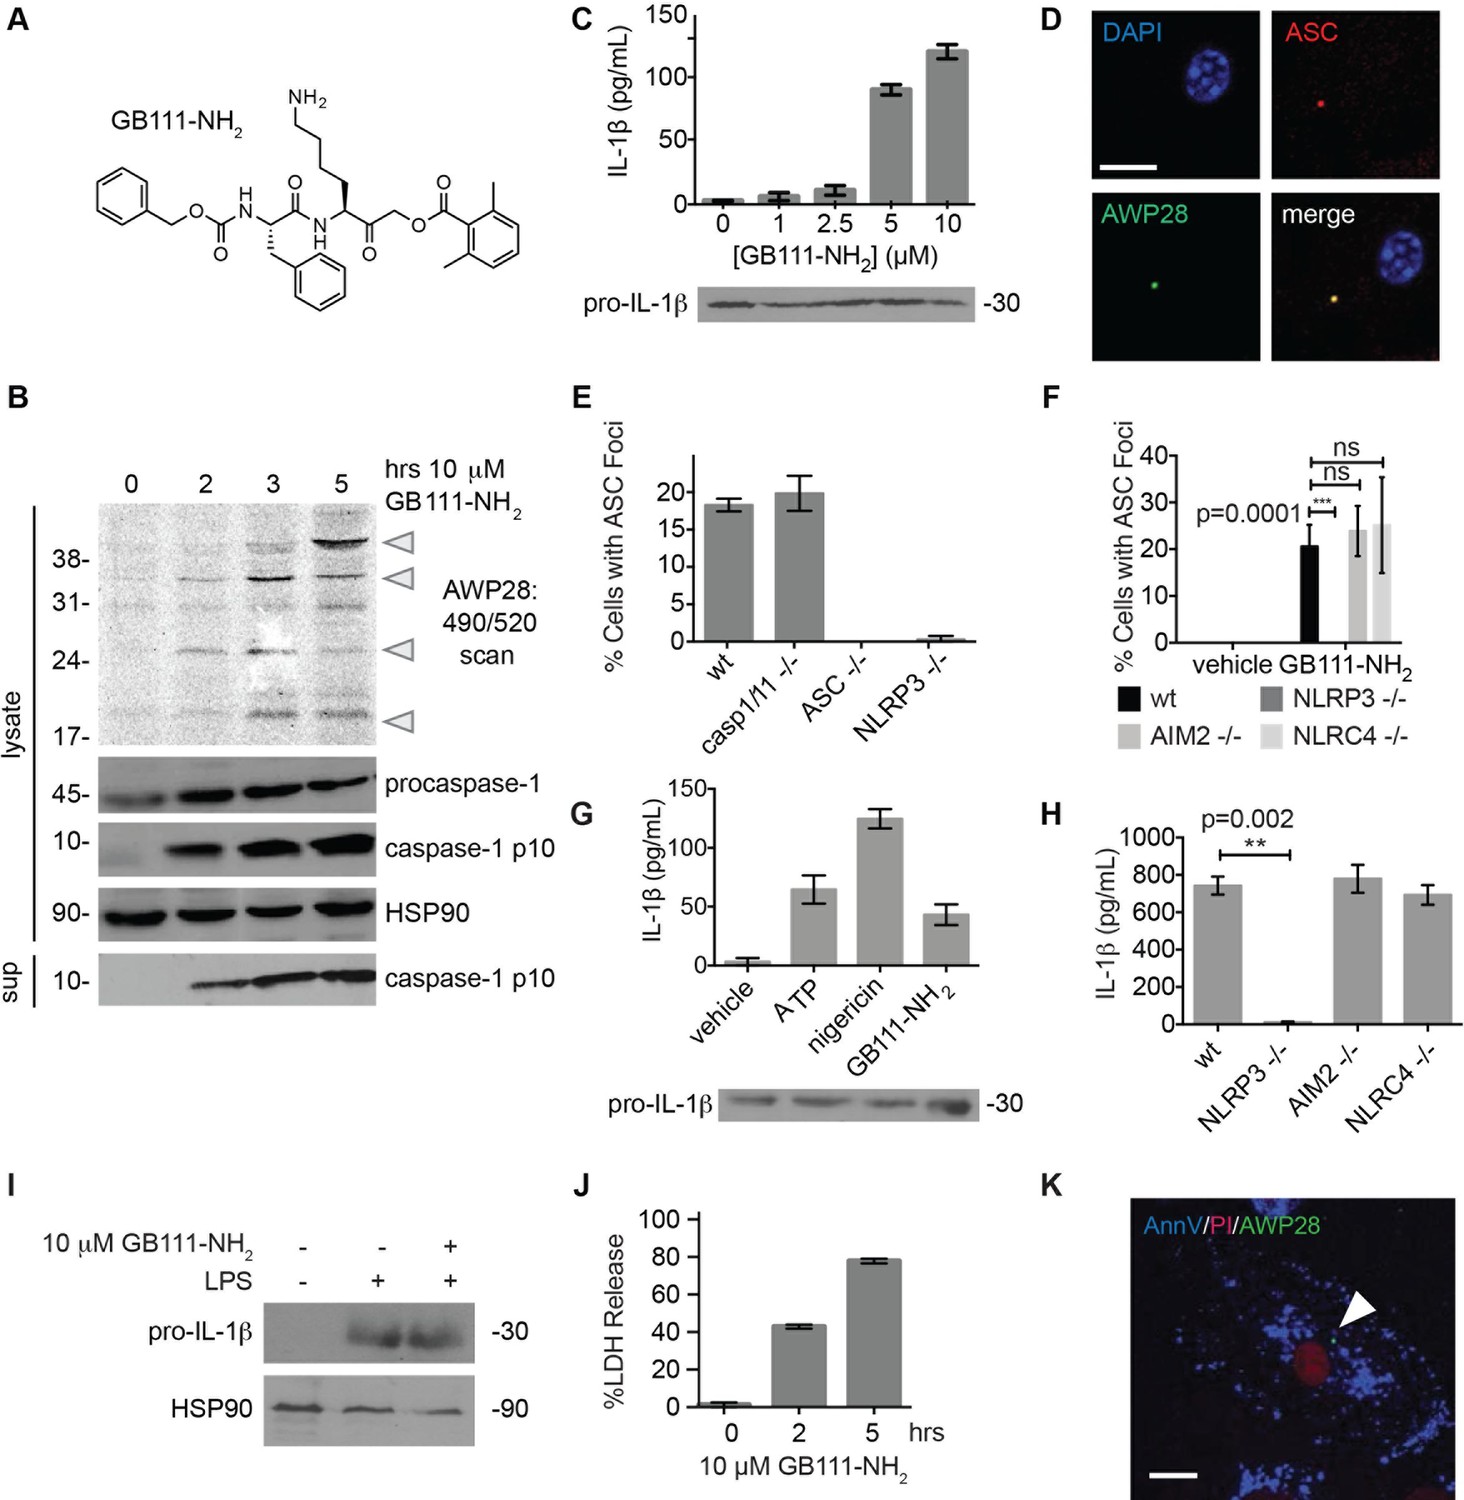
Identification of the NLRP3 inflammasome activator GB111-NH2.
(A) Structure of GB111-NH2. (B) Western blot and activity-based probe analysis of caspase-1 activation. BMDM primed with 100 ng/mL LPS for 3 hr were then treated with GB111-NH2. Intact cells were labeled with the caspase-1 probe AWP28 (1 μM) for the last hour before lysate harvest. Whole cell lysates were separated by SDS-PAGE. AWP28 labeling was analyzed by fluorescence scan and caspase-1 processing analyzed by western blot. Gray arrowheads indicate active forms of caspase-1 labeled by AWP28. HSP90 serves as loading control. (C) LPS-primed BMDM were treated with the indicated concentrations of GB111-NH2 for 2 hr. Supernatants were analyzed by ELISA. (D) LPS-primed BMDM were treated with 10 μM GB111-NH2 for 2 hr, labeled with AWP28, fixed, stained for ASC and DAPI, and visualized by confocal microscopy. Scale bar 10 μm. (E-F) BMDM of the indicated genetic backgrounds were treated with GB111-NH2 as in (D) and inflammasome foci/nuclei quantified. At least 4 fields of view (20x objective, 0.5x zoom) were taken per condition per experiment, ~2000 cells/condition. (G) LPS-primed BMDM were treated with the indicated compounds (ATP: 5 mM; nigericin: 10 μM; GB111-NH2: 10 μM) and supernatant analyzed by ELISA. (H) BMDM of the indicated genetic backgrounds were treated as in (D) and supernatant analyzed by ELISA. (I) BMDM were primed with LPS or vehicle, then treated with GB111-NH2 for 2 hr. Whole cell lysates were separated by SDS-PAGE, blotted for pro-IL-1β, stripped, and reblotted for HSP90. (J) Cell death in LPS-primed, GB111-NH2-treated BMDM was analyzed by LDH release. (K) LPS-primed BMDM were treated with 10 μM GB111-NH2 for 2 hr, labeled with AWP28, stained for Annexin V (AnnV) and propidium iodide (PI), and visualized by microscopy. White arrowhead indicates AWP28 focus. Scale bar 10 μm. In all cases, data are representative of at least n=3 experiments and error bars indicate mean +/- sd of technical triplicate. Statistical significance was analyzed using an unpaired, two-tailed t test.
Figure 1—figure supplement 1
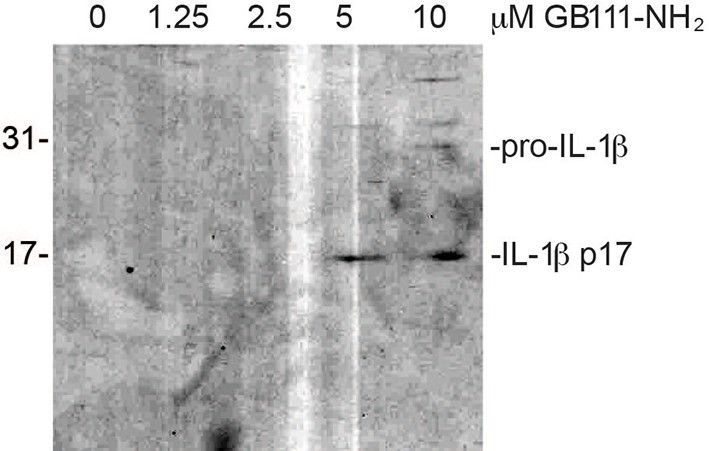
Secreted IL-1β is the bioactive, p17 form.
Supernatant from BMDM treated with the indicated concentrations of GB111-NH2 were analyzed by western blot for IL-1β. Different processing variants are indicated.
Figure 1—figure supplement 2
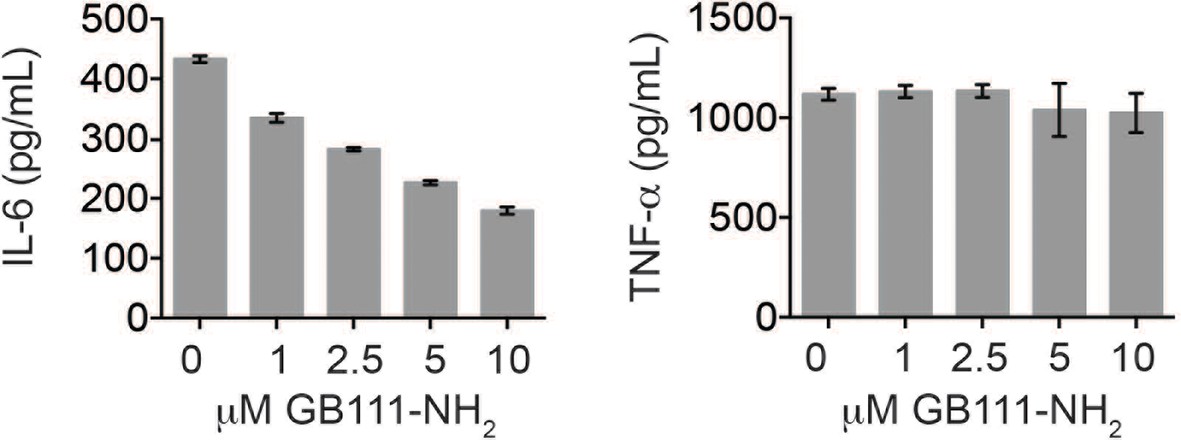
GB111-NH2 does not impair secretion of TNF-α and dose-dependently reduces IL-6 secretion.
LPS-primed BMDM were treated with the indicated concentrations of GB111-NH2 for 2 hr and then analyzed for IL-6 (left) and TNF-α (right) production by ELISA.
Figure 2 with 1 supplement
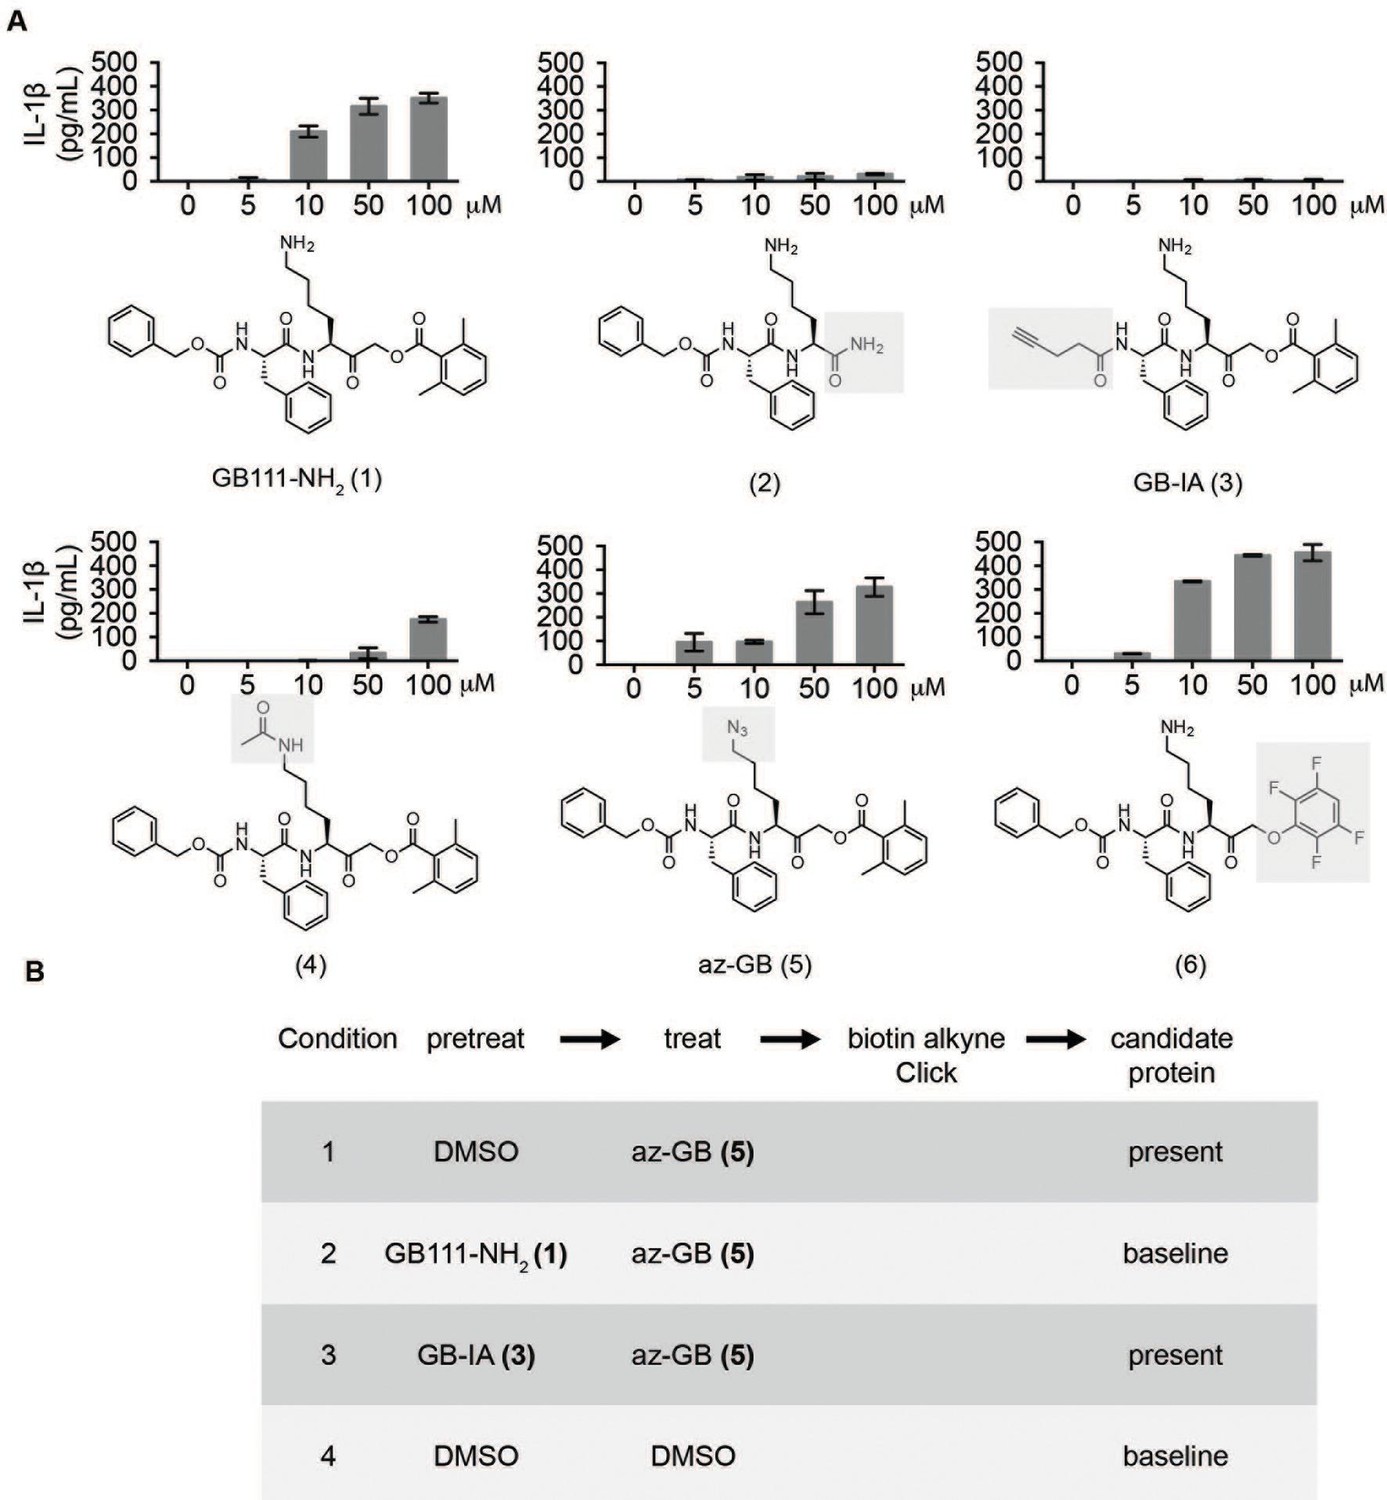
Structure-activity relationship study and identification of GB111-NH2 targets.
(A) Structures of GB111-NH2 analogs with structural changes highlighted in gray. LPS-primed BMDM were treated with analogs and supernatant IL-1β measured by ELISA. A dose response is shown above each analog. (B) Set-up of MudPIT target identification experiment. In all cases, data are representative of n=3 experiments. Error bars indicate mean +/- sd of technical triplicate.
Figure 2—figure supplement 1
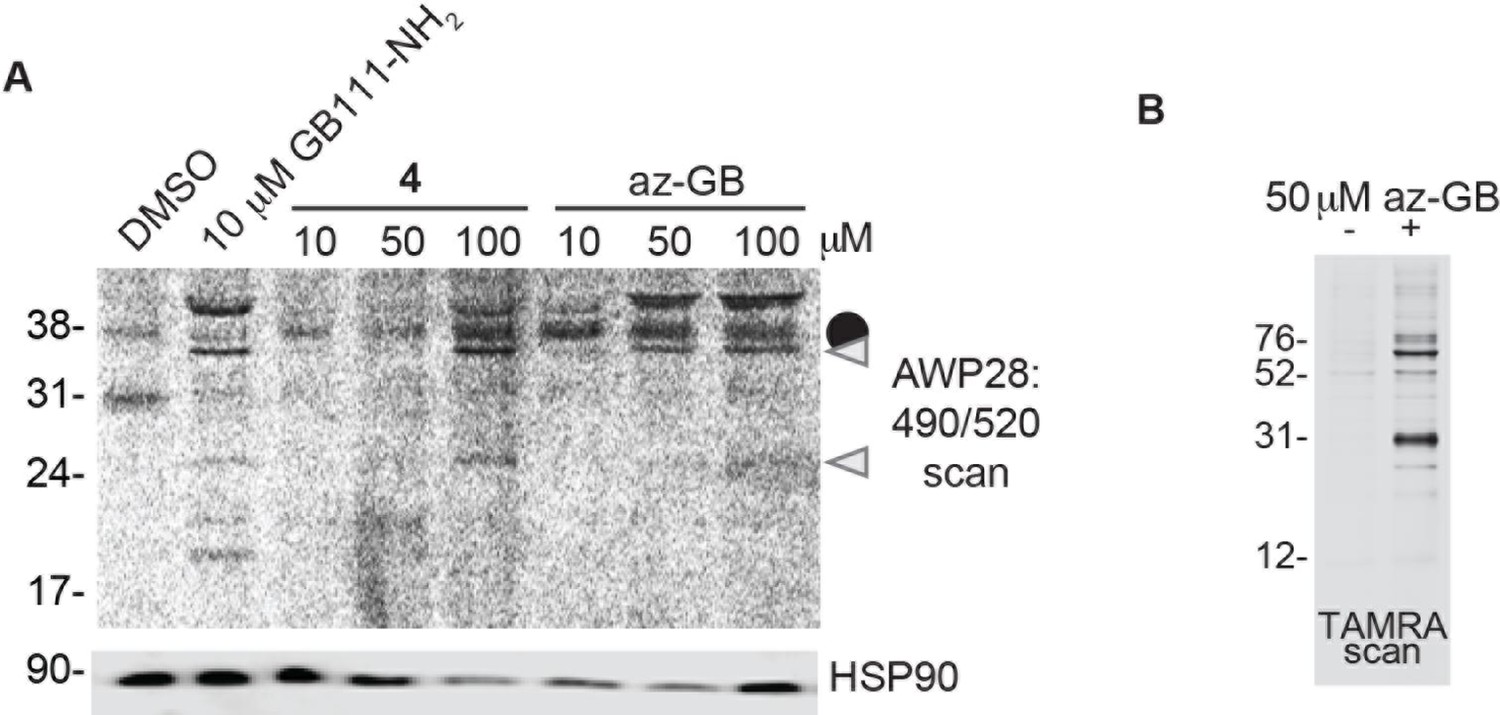
Az-GB is a functional probe version of GB111-NH2.
(A) BMDM were treated with GB111-NH2 or az-GB and labeled with AWP28. Whole cell lysates were separated by SDS-PAGE and analyzed by fluorescence scan and western blotting. Gray arrowheads indicate active caspase-1 species. HSP90 serves as loading control. (B) SV40-immortalized macrophages were treated with az-GB. Lysates were reacted with TAMRA-alkyne under Click reaction conditions, separated by SDS-PAGE, and analyzed by fluorescence gel scan.
Figure 3 with 2 supplements
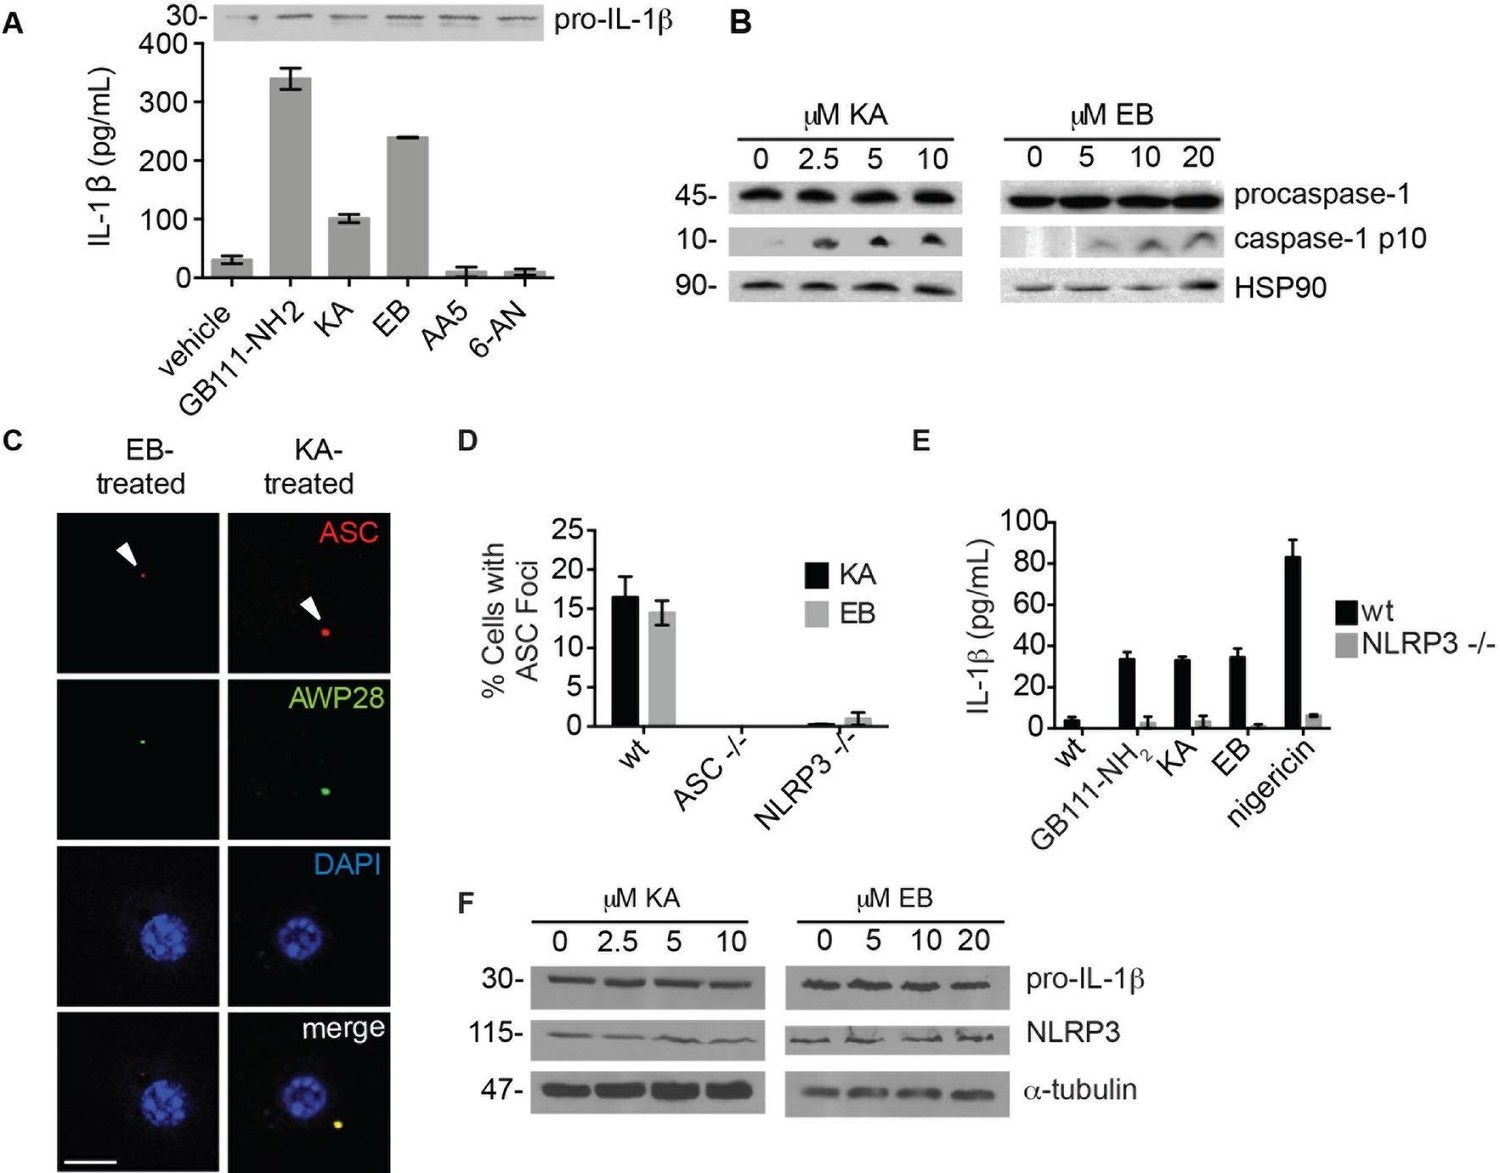
The phenotypically relevant targets of GB111-NH2 are glycolytic enzymes.
(A) LPS-primed BMDM were treated with the indicated compounds (GAPDH inhibitor koningic acid = KA; 10 μM, α-enolase inhibitor ENOblock = EB; 20 μM, succinate dehydrogenase inhibitor Atpenin A5 = AA5; 10 μM, 6-phosphogluconate dehydrogenase inhibitor 6-aminonicotinamide = 6-AN; 500 μM) and IL-1β secretion was analyzed by ELISA. Whole cell lysates were separated by SDS-PAGE and blotted for pro-IL-1β. (B) BMDMs were treated with KA and EB and cell lysates were analyzed for caspase-1 processing by western blot. HSP90 serves as loading control. (C) BMDM were treated as in (B), labeled with AWP28, fixed, stained for ASC and DAPI, and analyzed by fluorescence microscopy. Scale bar 10 μm. (D) LPS-primed BMDM from the indicated genetic backgrounds were treated with KA or EB for 3 hr, fixed, stained for ASC and DAPI, and analyzed by confocal microscopy. At least 4 fields of view were captured per condition, ~2000 cells/condition/experiment. (E) LPS-primed BMDM of the indicated genetic backgrounds were treated with the indicated compounds (GB111-NH2 – 10 μM for 2 hr, KA – 5 μM for 3 hr, EB – 20 μM for 3 hr, nigericin – 12.5 μM for 1 hr) and supernatant analyzed for IL-1β production by ELISA. (F) BMDM were treated as in (B). Whole cell lysates were separated by SDS-PAGE and blotted for pro-IL-1β, NLRP3, and α-tubulin.
Figure 3—figure supplement 1
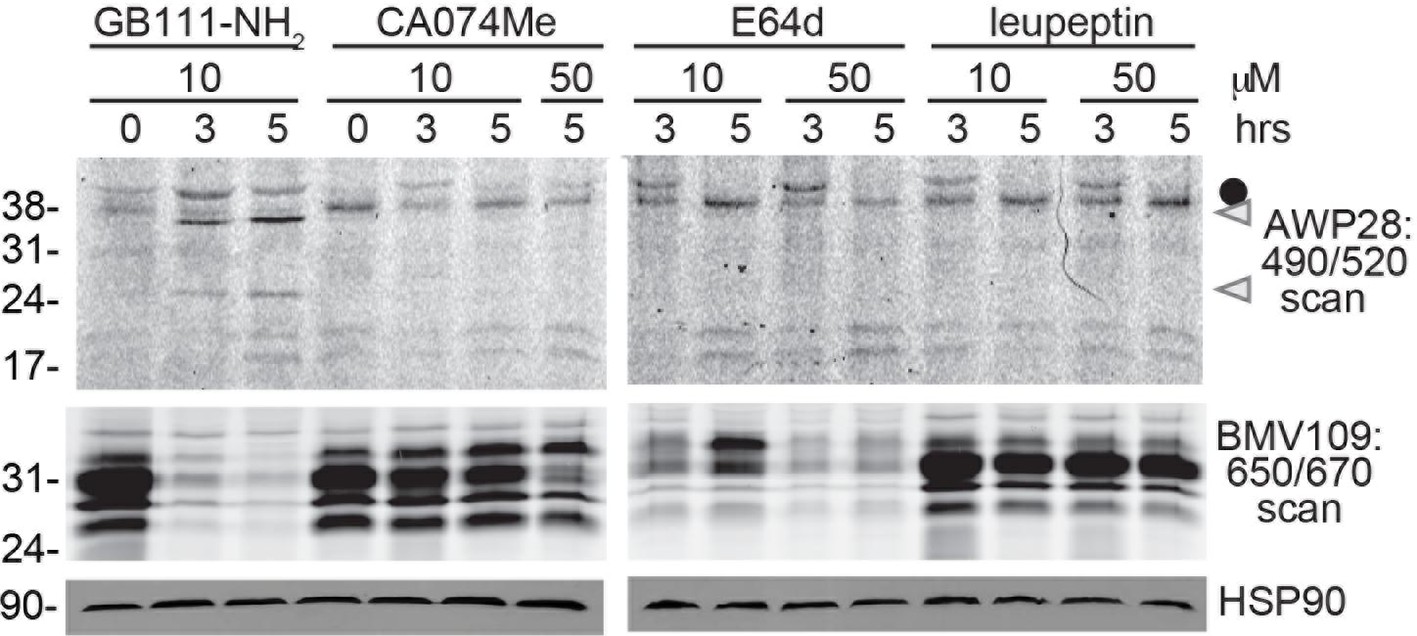
Cathepsin inhibition does not induce caspase-1 activation.
BMDM were treated with GB111-NH2 or structurally dissimilar cathepsin inhibitors CA074Me, E64d, and leupeptin. Caspase-1 activation was assessed by AWP28 labeling and cathepsin inhibition by BMV109 labeling. HSP90 serves as loading control.
Figure 3—figure supplement 2
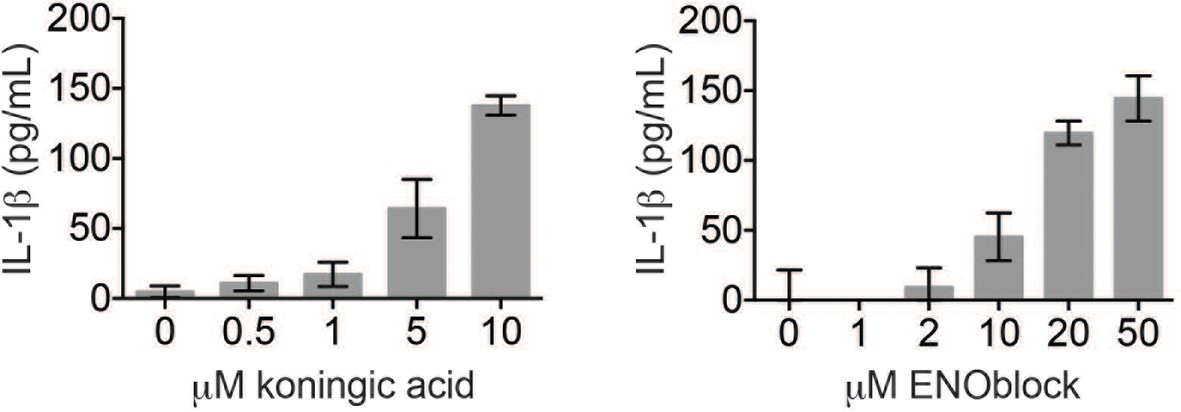
Koningic acid and ENOblock induce dose-dependent IL-1β secretion.
LPS-primed BMDM were treated with the indicated concentrations of koningic acid or ENOblock for 3 hr and supernatants analyzed by ELISA.
Figure 4 with 1 supplement

Compounds covalently bind to reactive cysteines on GAPDH and α-enolase and inhibit enzyme activity in vitro.
(A) Recombinant human GAPDH was pretreated with GB111-NH2 and its analogs at the indicated concentrations for 1 hr in 0.1 M Tris-HCl pH 8.0, then labeled with az-GB (50 μM) for 1 hr. Mixtures were reacted with TAMRA-alkyne, separated by SDS-PAGE, and analyzed by fluorescence scan. Gels were silver stained to assess loading. % of competition was calculated as 100-(fluor. intensitycmpd+az-GB/fluor. intensityaz-GB-only). (B) Recombinant human α-enolase was labeled as described for GAPDH in (A). (C) GAPDH was incubated with NEM (5 μM), GB111-NH2 (10 μM) or vehicle for 30 min, then labeled with iodoacetamide fluorescein (IAF; 10 μM) for 30 min. Reaction mixtures were separated by SDS-PAGE. Gels were analyzed by fluorescent scan and blotted for GAPDH to assess loading. (D) α-enolase was treated as described for GAPDH in (C) and blotted for α-enolase to assess loading. (E) Recombinant GAPDH and α-enolase were pretreated with inhibitors for 30 min and then enzyme activity assessed using substrate turnover assays. (F) GAPDH and α-enolase were incubated with GB111-NH2 for the indicated amounts of time and then enzyme activity assessed. Data are representative of at least n=3 experiments and error bars indicate mean +/- sd of technical triplicate.
Figure 4—figure supplement 1
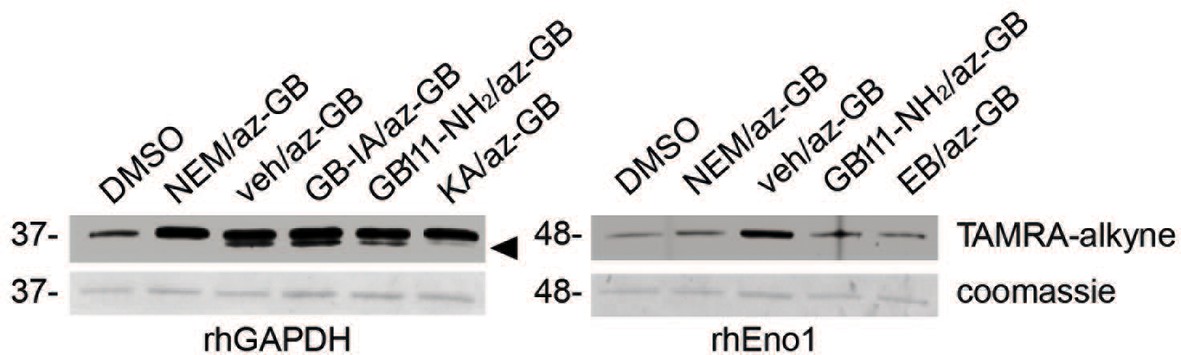
az-GB binds to reactive cysteines on recombinant GAPDH and α-enolase in a manner that is dependent on enzyme activity.
Recombinant human GAPDH or α-enolase (rhGAPDH, rhEno1) were pretreated with vehicle (veh), N-ethylmaleimide (NEM, 5 μM), active (GB111-NH2, 10 μM) or inactive (GB-IA, 50 μM) analogs, KA (5 μM) or EB (20 μM) for 30 min in PBS with 1% NP-40 and 0.1% SDS and then labeled with az-GB (50 μM). Reaction mixtures were reacted with TAMRA-alkyne, separated by SDS-PAGE, and analyzed by fluorescence scan and Coomassie Blue to assess loading. Black arrowhead indicates faster migrating active GAPDH species.
Figure 5 with 2 supplements
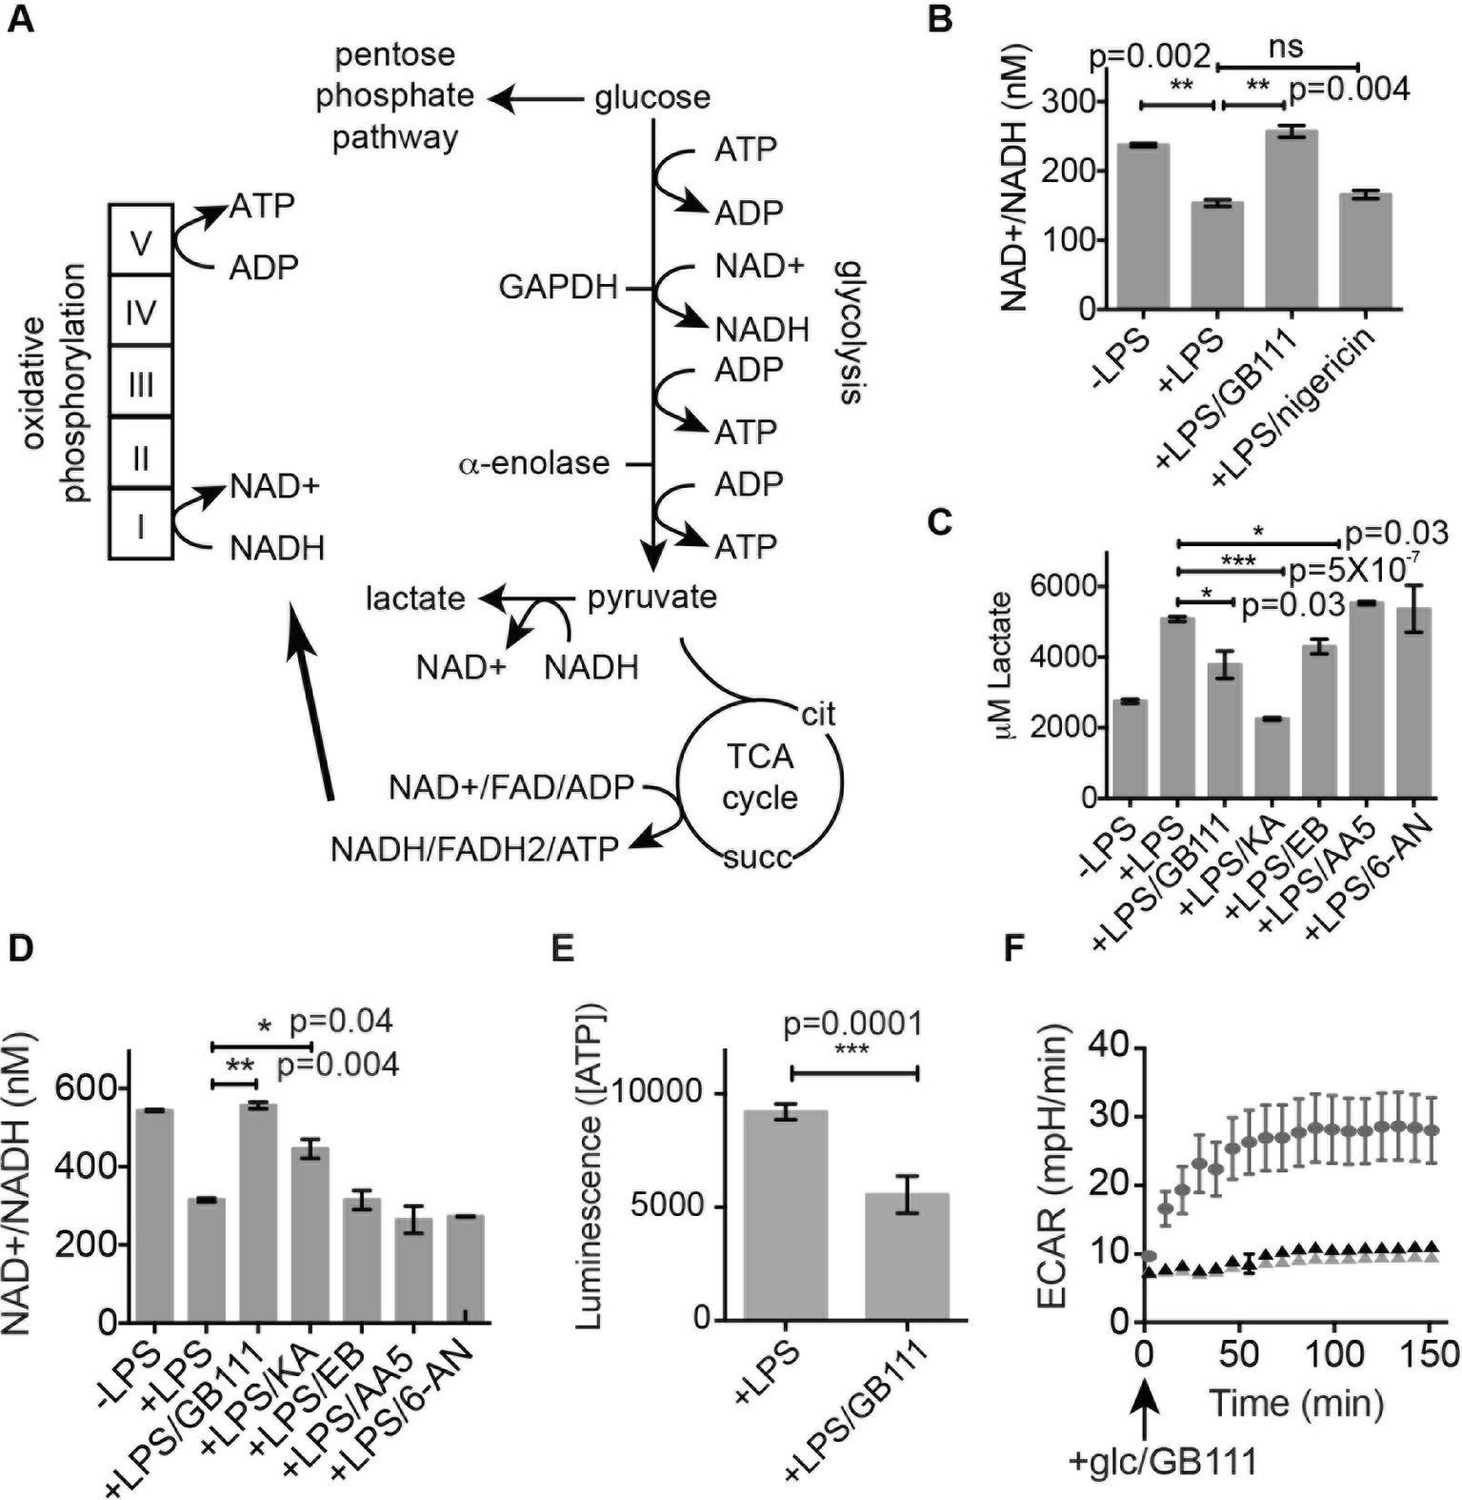
Inhibition of glycolytic flux creates a unique metabolic defect that activates the NLRP3 inflammasome.
(A) Map of relevant metabolic pathways. (B) BMDM were stimulated with LPS or vehicle for 3 hr and then the indicated compounds for 2 hr, after which cytosolic NAD+/NADH ratio was measured. (C) BMDM were treated as in (B) and supernatants were analyzed for lactate production. Inhibitor concentrations are those from Figure 3A. (D) BMDM were stimulated with LPS or vehicle for 3 hr and then with the indicated compounds for 2 hr, after which cytosolic NAD+/NADH was measured. (E) BMDM were treated as in (B) and cytosolic ATP concentration analyzed by ATP-coupled luminescence assay. (F) ECAR was measured in BMDM upon addition of fresh glucose-containing medium. Fresh medium contained vehicle (DMSO; gray circles) or 10 μM GB111-NH2 -/+ 1 mM pyruvate (black/gray triangles). Error bars represent mean +/- sd of 6 technical replicates per condition.
Figure 5—figure supplement 1
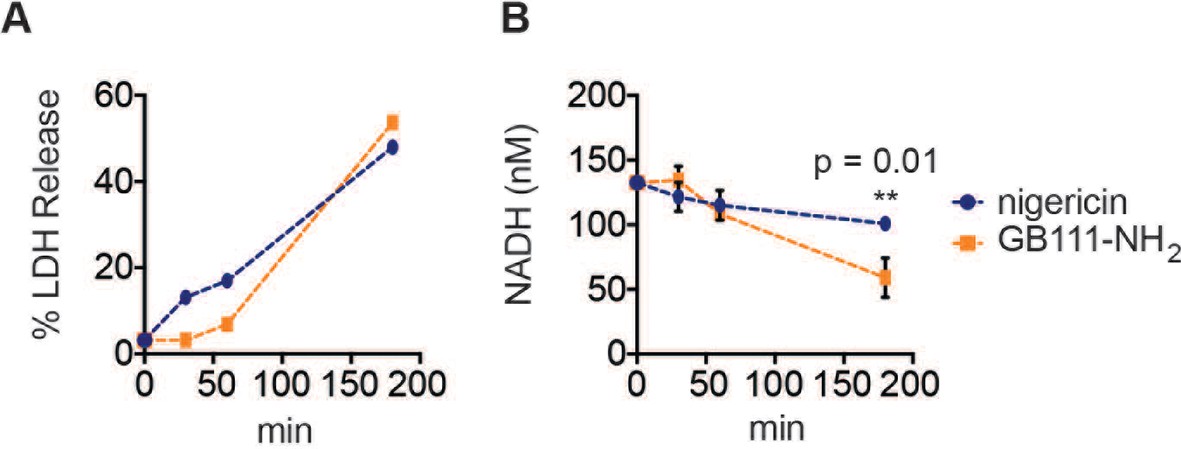
A dose of nigericin that induces cell death with similar kinetics to GB111-NH2 does not effect NADH production.
LPS-primed BMDM were treated with nigericin (1 μM) or GB111-NH2 (10 μM) for the indicated amounts of time (A) % LDH release was measured to assess the extent of cell death. (B) NADH production was measured in cell lysates. Error bars are mean +/- sd of technical triplicate. Statistical difference between conditions was assessed using an unpaired, two–tailed t test.
Figure 5—figure supplement 2
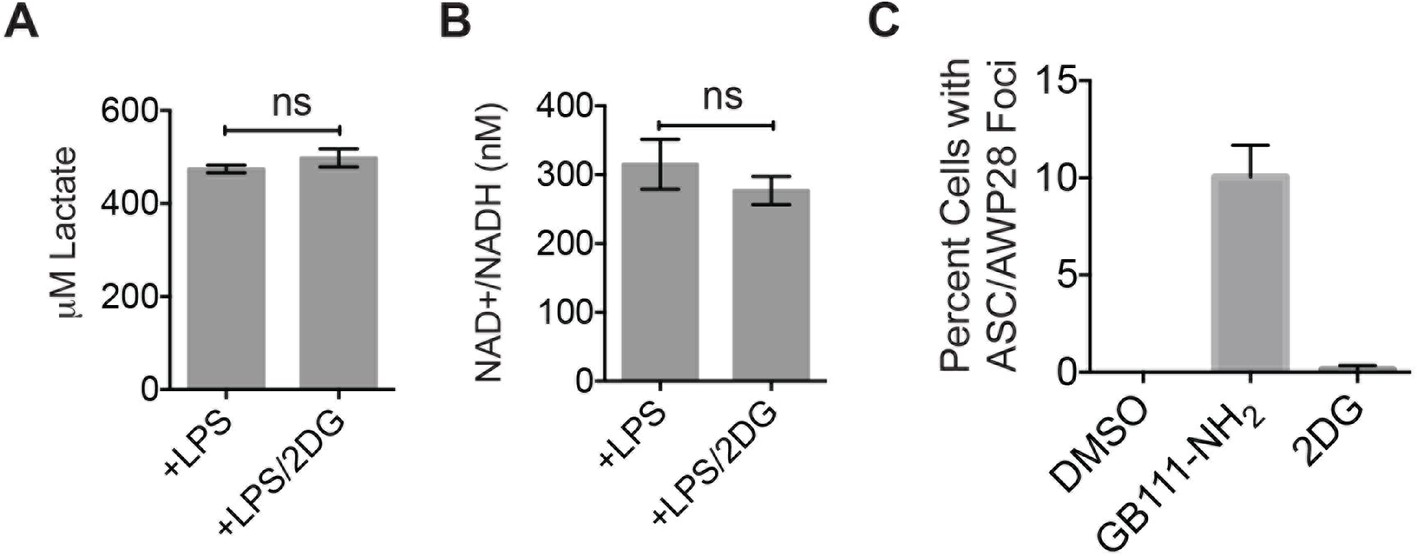
2DG does not dramatically impair glycolytic flux or induce inflammasome formation.
(A) Lactate production from 2-deoxyglucose (2DG at 10 mM) –treated LPS-primed BMDM was measured. (B) BMDM were treated as in (A) and analyzed for cytosolic NAD+/NADH. (C) LPS-primed BMDM were treated with GB111-NH2 (10 μM) or 2DG (10 mM) for 2 hr and labeled with AWP28. BMDM were then fixed, stained for ASC and with DAPI, and inflammasome foci were quantified.
Figure 6
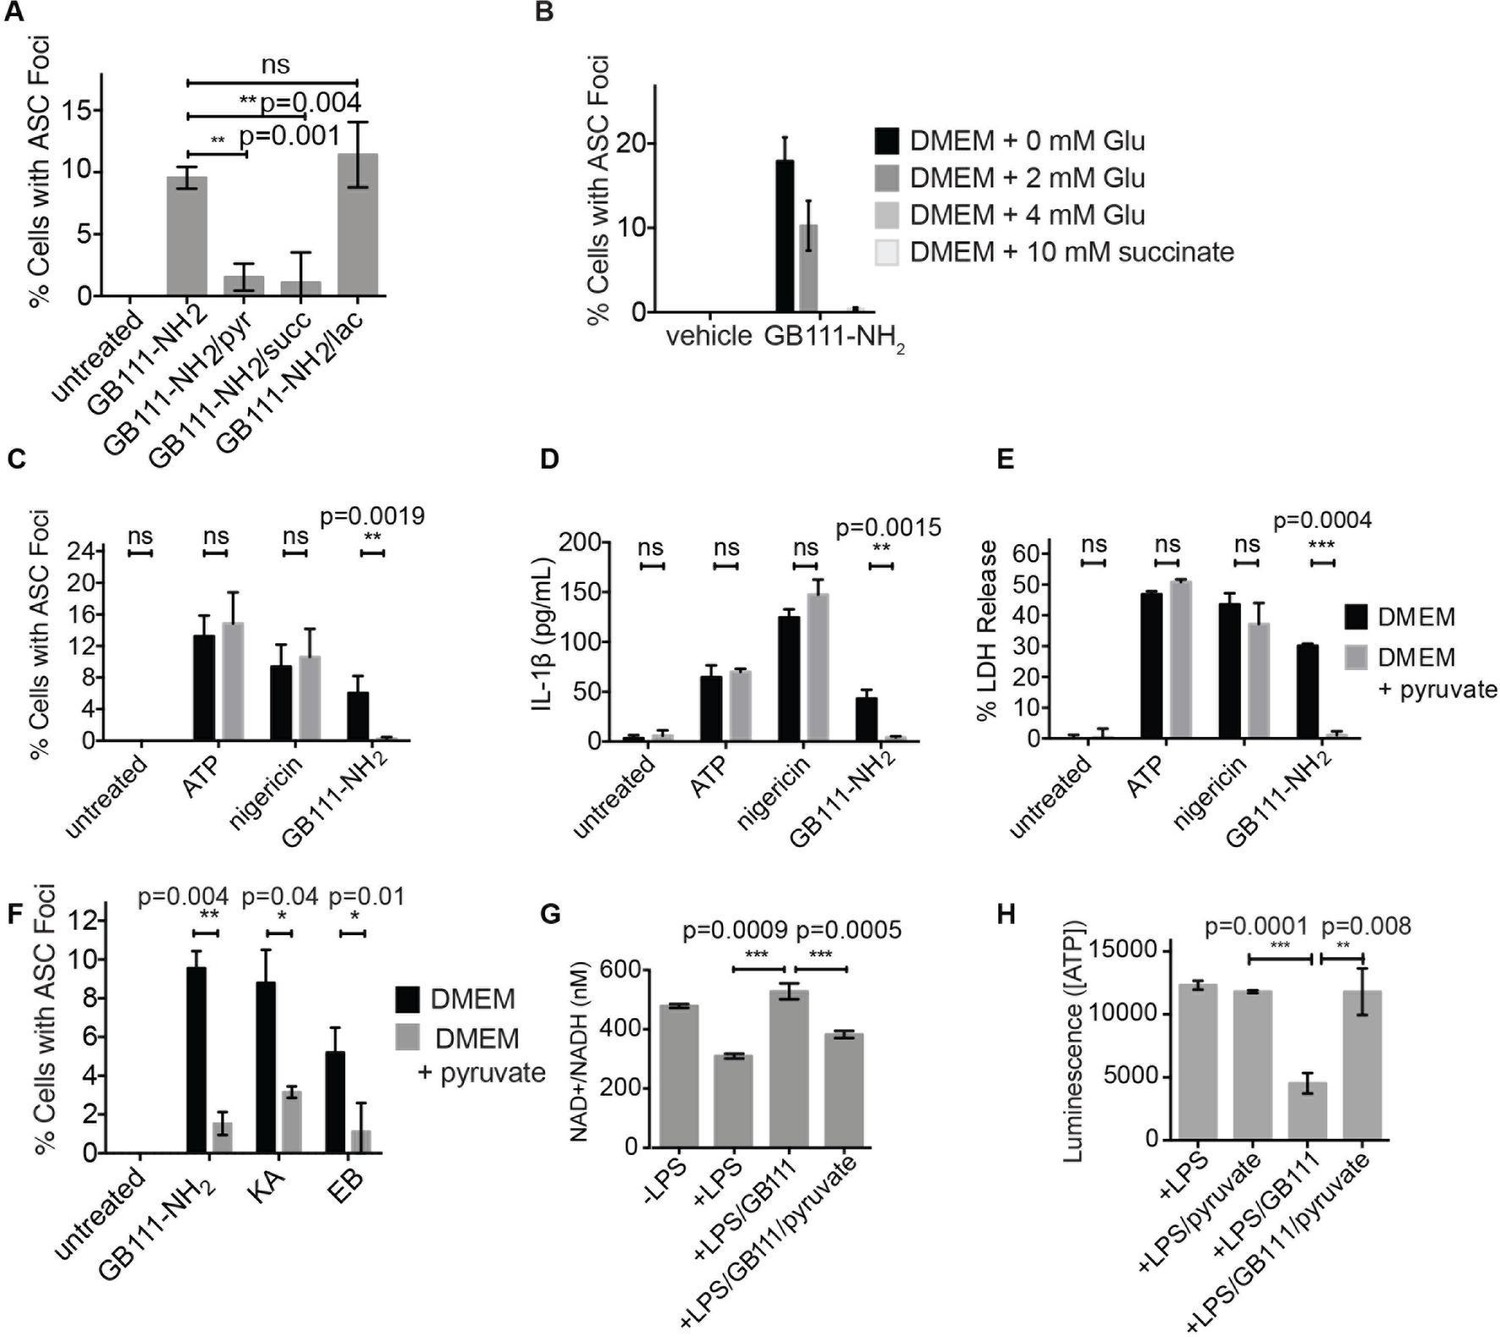
Addition of metabolites downstream of glycolysis prevents NLRP3 inflammasome activation induced by glycolytic disruption.
(A) LPS-primed BMDM were treated with GB111-NH2 for 2 hr in the presence of pyruvate (pyr; 1 mM) or cell-permeable esters of lactate (lac; 1 mM) and succinate (succ; 10 mM). Cells were fixed, stained for ASC and DAPI, and inflammasome foci/nuclei quantified. At least four fields of view were quantified per condition per experiment, ~2000 cells/condition. Error bars represent mean +/- sd of fields of view analyzed. (B) BMDM were primed with LPS and then treated with 10 μM GB111-NH2 for 2 hr in the presence of the indicated concentrations of L-glutamine or succinate. Cells were fixed, stained for ASC and DAPI, and quantified by microscopy. Four fields of view (~2000 cells) were analyzed per condition. Error bars represent mean +/- sd of separate fields of view. (C) LPS-primed BMDM were treated with the indicated compounds in the presence or absence of pyruvate and analyzed as in (A). (D) BMDM were treated as in (C) and supernatants were analyzed for IL-1β by ELISA. (E) BMDM were treated as in (C) and cell death was measured by LDH release. (F) BMDM were treated with the indicated inhibitors, stained for ASC and DAPI, and quantified by microscopy as in (B). (G) BMDM were treated with GB111-NH2 for 2 hr in the presence or absence of pyruvate (1 mM), after which cytosolic NAD+/NADH was measured. (H) BMDM were treated as in (G) and cytosolic ATP measured by ATP-coupled luminescence assay. For ELISA and LDH release data, error bars represent mean +/- sd of technical triplicate. Data were analyzed for statistical significance using an unpaired, two-tailed t test.
Figure 7 with 2 supplements
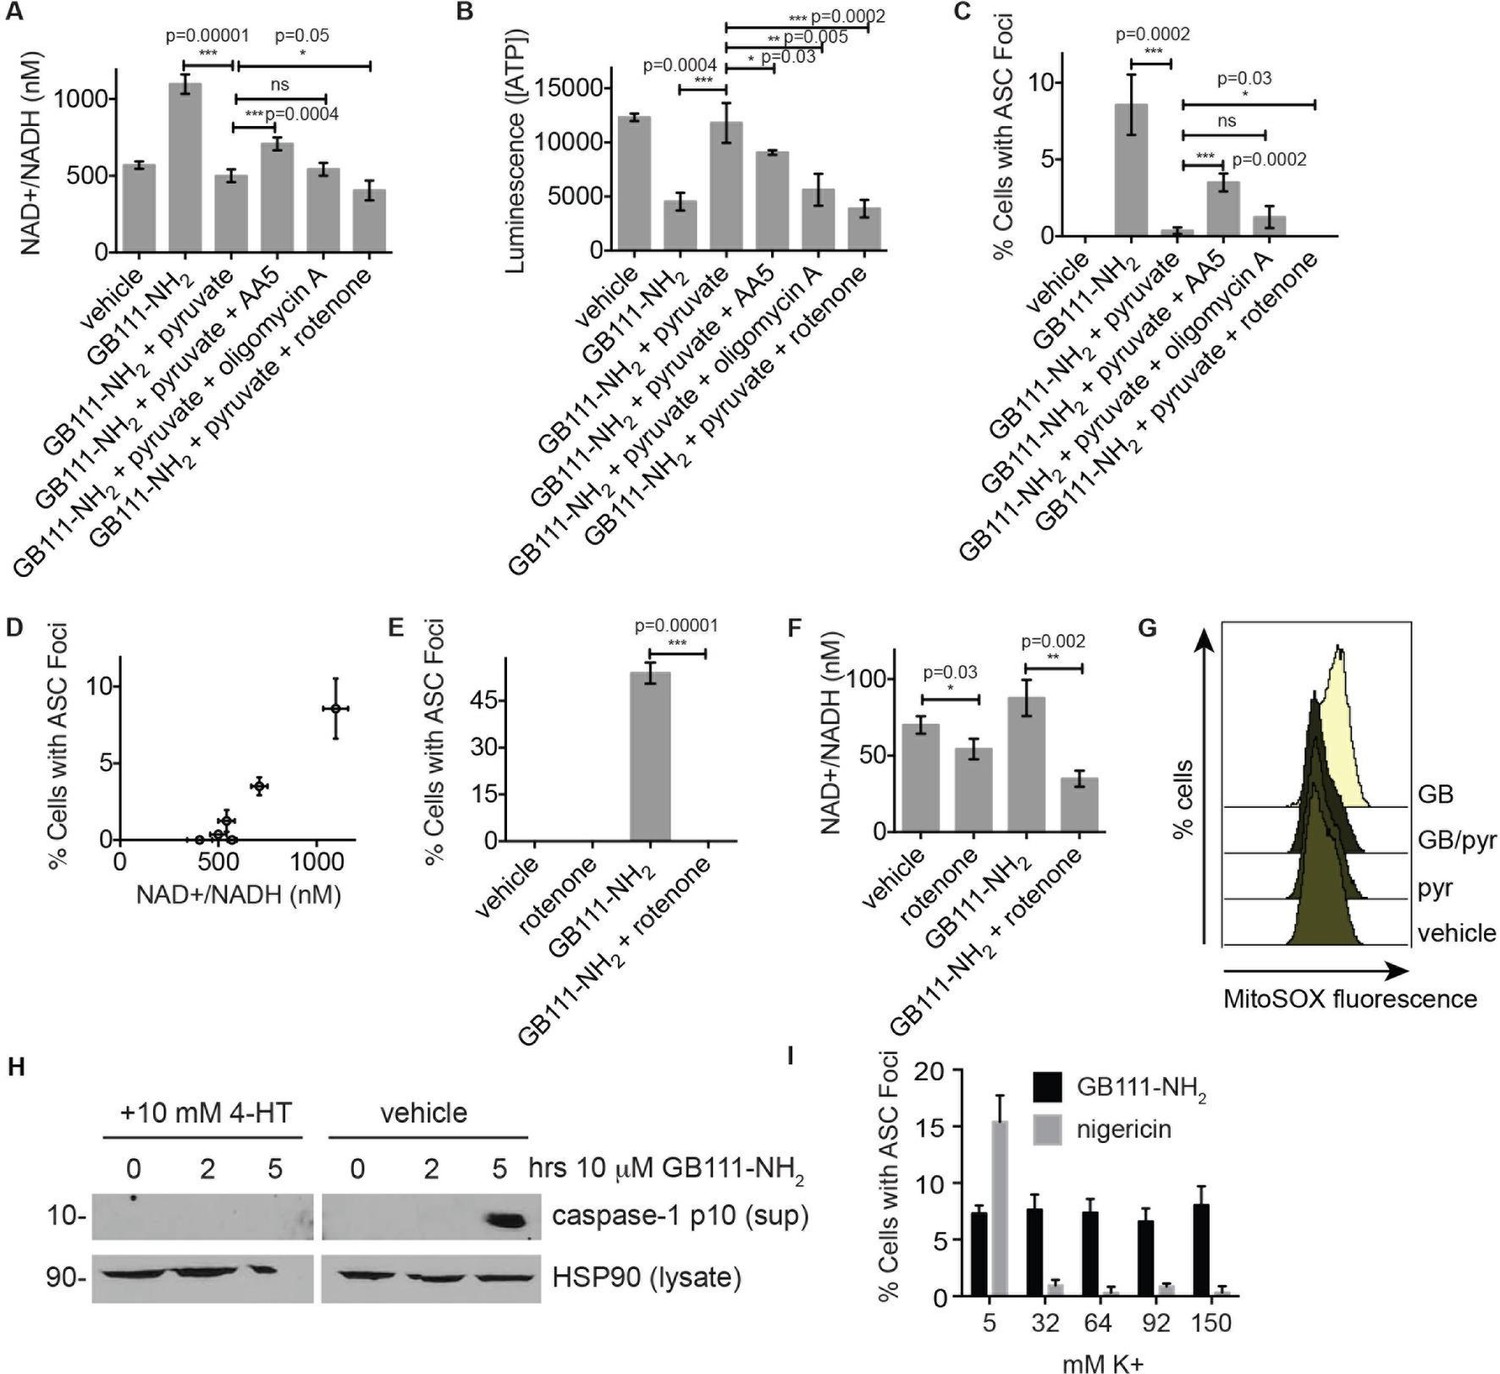
NAD+/NADH ratio elevation and mitochondrial ROS accumulation are signals for NLRP3 inflammasome formation downstream of glycolytic disruption.
(A) LPS-primed BMDM were treated with the indicated compounds (GB111-NH2 - 10 μM, sodium pyruvate - 1 mM, AA5 - 10 μM, oligomycin A - 1 μM, rotenone - 5 μM) for 2 hr, after which cells were fixed, stained for ASC and DAPI, and visualized by microscopy. (B) Cells were treated as in (A) and cytosolic NAD+/NADH measured. (C) Cells were treated as in (A) and cytosolic ATP measured by ATP-coupled luminescence assay. (D) % Cells with ASC foci values from (A) are plotted against NAD+/NADH values from (B). Error bars are representative of mean +/- sd of technical triplicate from (A) and (B). (E) LPS-primed BMDM were treated with vehicle or 10 μM GB111-NH2 in the presence or absence of 5 μM rotenone for 2 hr. Cells were fixed, stained for ASC and DAPI, and analyzed by microscopy. Four fields of view were collected per condition (~2000 cells). (F) Cells were treated as in (E) and cytosolic NAD+/NADH analyzed. Error bars represent mean +/- sd of technical triplicate. (G) BMDM were treated with 10 μM GB111-NH2 or vehicle in the presence or absence of 1 mM pyruvate (pyr) and stained with MitoSOX (2.5 μM). Cells were analyzed for MitoSOX uptake by flow cytometry. (H) LPS-primed BMDMs were treated with GB111-NH2 in the presence or absence of 4-hydroxyTEMPO (4-HT). Whole cell lysates and cell supernatants (sup) were separated by SDS-PAGE and analyzed by western blot to detect the active p10 form of caspase-1. HSP90 serves as loading control. (I) BMDM were treated with nigericin (12.5 μM) or GB111-NH2 (10 μM) in Ringer’s buffer with increasing concentrations of K+. Cells were fixed, stained for ASC and DAPI, and inflammasome foci/nuclei quantified.
Figure 7—figure supplement 1
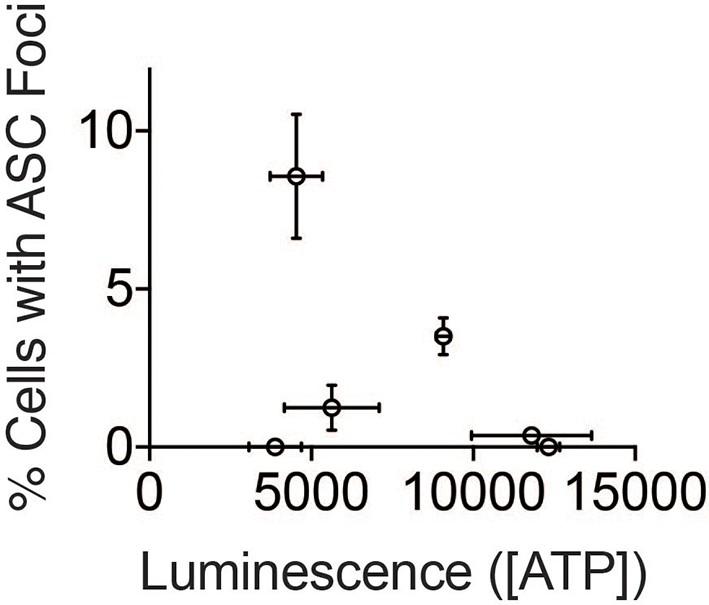
ATP concentration does not correlate with inflammasome numbers.
https://doi.org/10.7554/eLife.13663.018
Figure 7—figure supplement 2
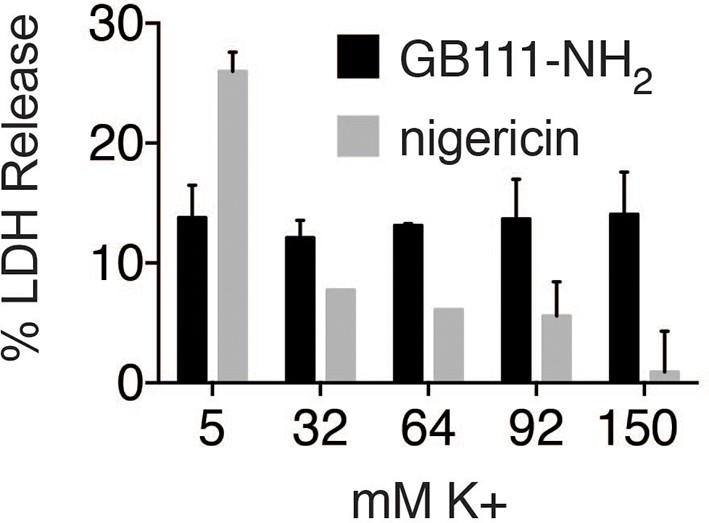
K+ efflux is not required for GB111-NH2-induced pyroptotic cell death.
BMDM were treated with nigericin (12.5 μM) or GB111-NH2 (10 μM) in Ringer’s buffer with increasing concentrations of K+. After 3 hr, cell death was assessed by measuring % LDH release. Error bars are mean +/- sd of technical triplicate.
Figure 8
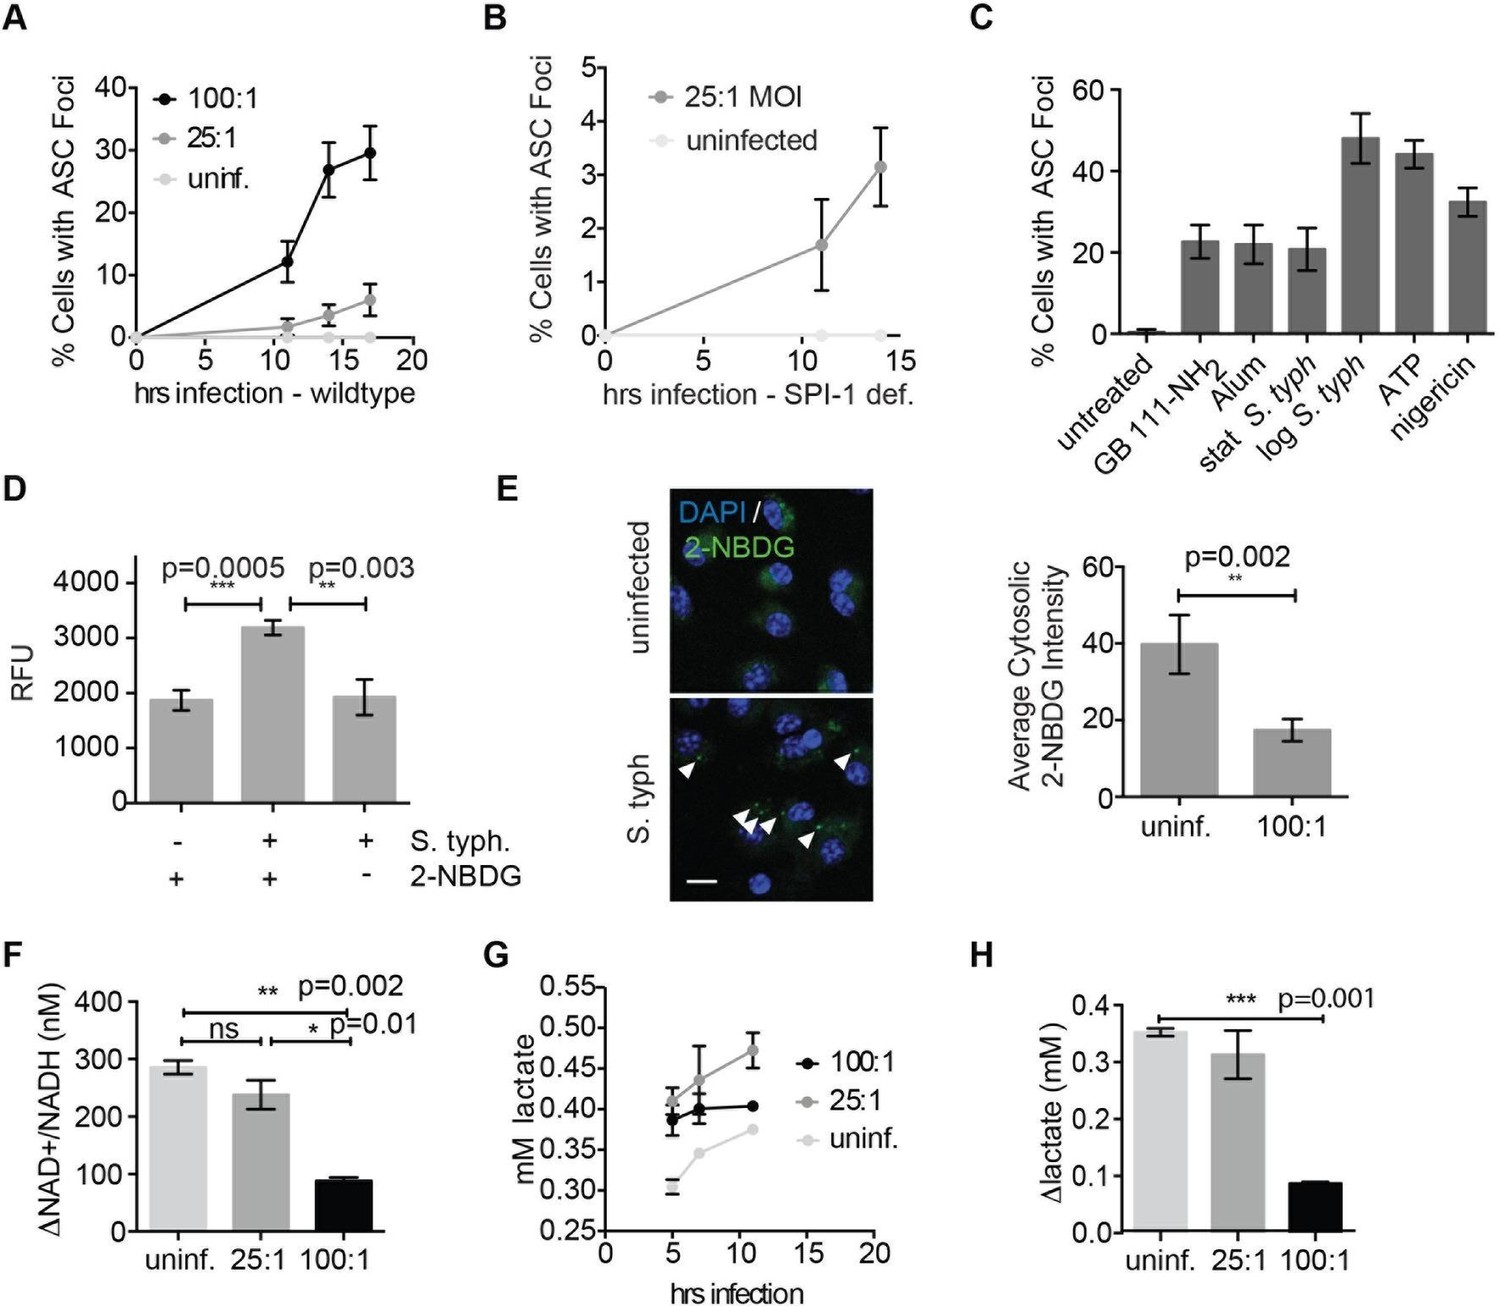
Salmonella typhimurium disrupts host cell glycolysis.
(A) BMDMs were infected with S. typhimurium strain SL1344 grown to stationary phase and infected at the indicated multiplicity of infection (MOI; 25:1 and 100:1). At the indicated timepoints, cells were fixed and stained for ASC and DAPI. Inflammasome foci/nuclei were quantified. (B) BMDM were infected with △orgA (SPI-1 deficient) S. typhimurium grown to stationary phase. Cells were fixed at the indicated timepoints, stained for ASC and DAPI, and foci/nuclei quantified. (C) Cells were treated with the indicated compounds or infected with S. typhimurium grown to stationary phase (100:1 MOI) or log phase (10:1 MOI). Cells were fixed, stained for ASC, and ASC foci/nuclei were quantified. (D) BMDM were infected with 100:1 MOI stationary phase S. typhimurium for 5 hr. 2-NBDG (10 μM) or vehicle was added to media 2 hr post-infection. Cells were washed, lysed, intracellular bacteria sedimented from whole cell lysate via centrifugation, resuspended, and bacterial fluorescence (abs/em 465/540) analyzed by plate reader. (E) BMDM were treated as in (D), fixed, stained for DAPI, and visualized by confocal microscopy. Left: Representative image. White arrowheads indicate cytosolic S. typhiurium positive for 2-NBDG and DAPI. Scale bar 10 μM. right: 2-NBDG signal in areas of cytosol negative for DAPI (S. typhimurium negative) was measured. Cytosolic regions from ~200 discrete cells from 4 fields of view were measured per condition. Error bars represent mean +/- sd of different fields of view. (F) BMDMs were infected with stationary phase S. typhimurium and analyzed for cytosolic NAD+/NADH. △NAD+/NADH indicates the difference between the ratio measured at 11 hr and 5 hr post-infection. (G) BMDMs were infected with stationary phase S. typhimurium and levels of lactate in the supernatant analyzed at the indicated timepoints. (H) Quantification of the difference between lactate secretion measured at 11 hr and 5 hr post-infection.
Figure 9 with 2 supplements
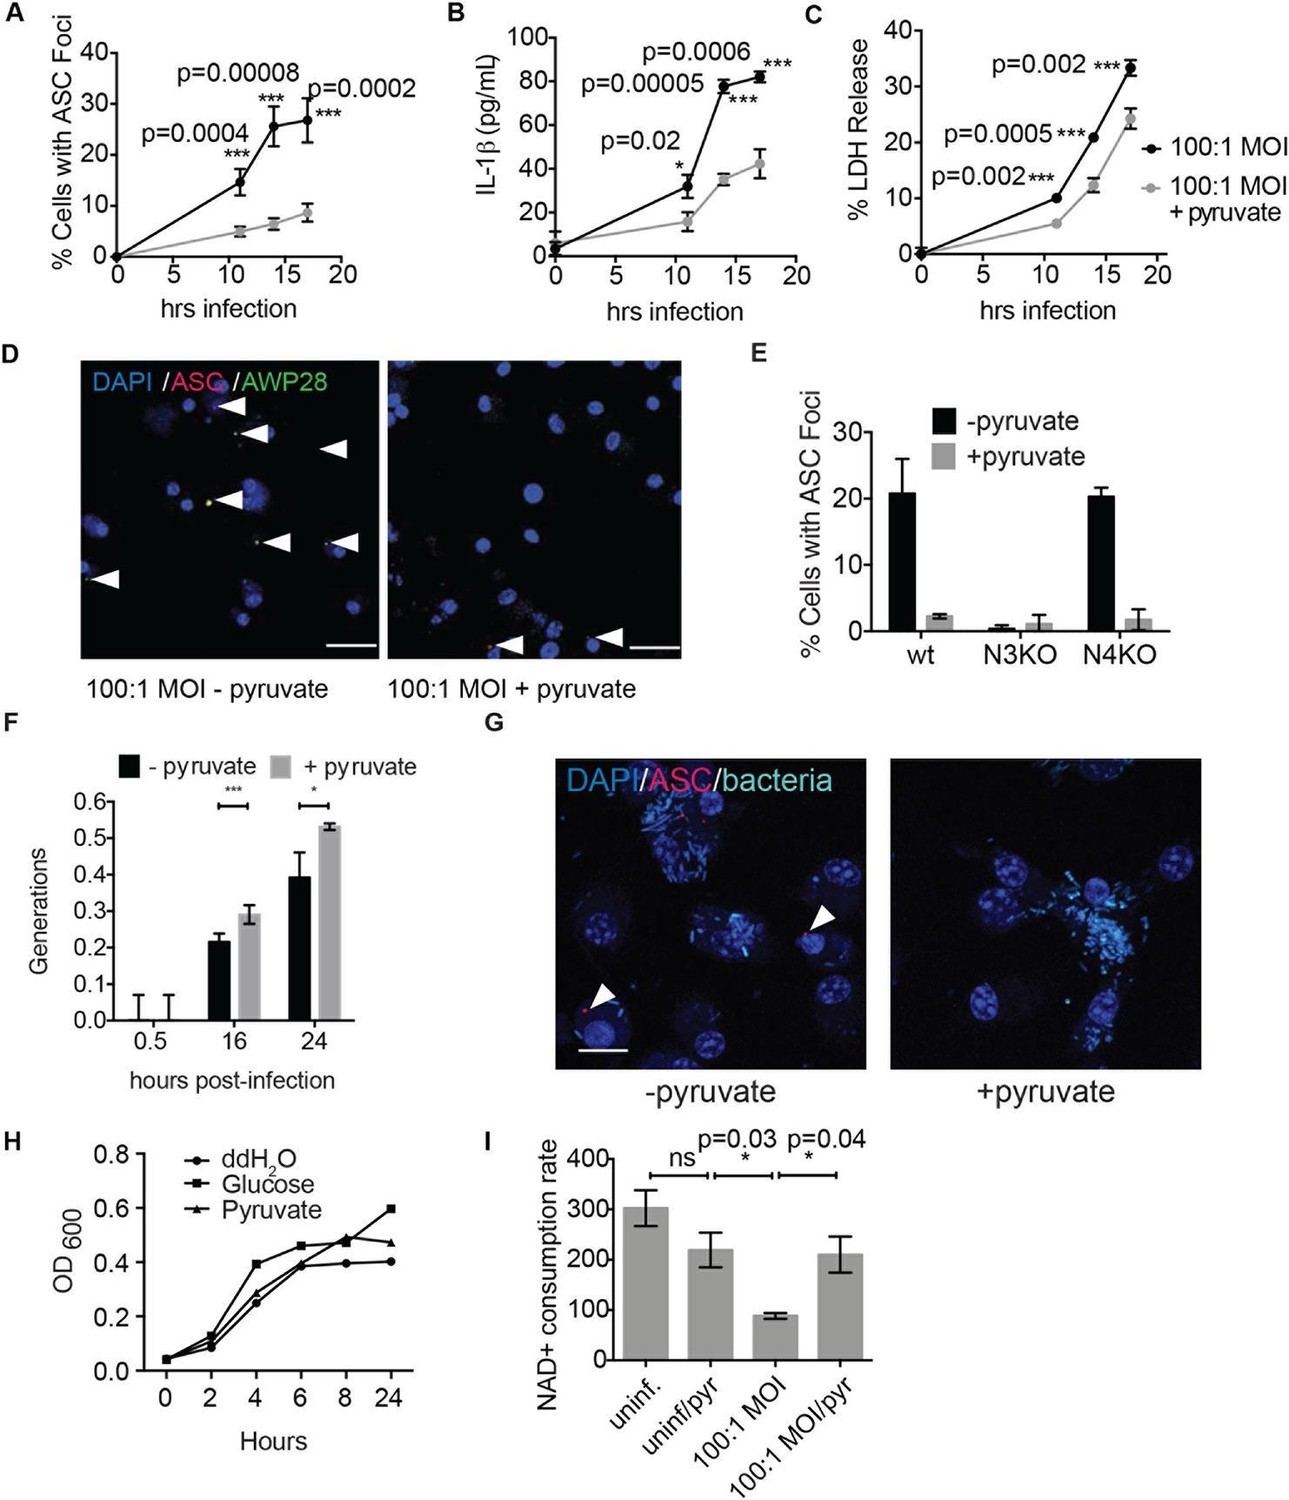
Disruption of glycolysis by Salmonella typhimurium activates the NLRP3 inflammasome.
(A–D) BMDMs were infected with S. typhimurium grown to stationary phase in the presence or absence of 1 mM pyruvate and (A) cells were fixed and stained for ASC and DAPI. ASC foci/nuclei were quantified. At least four fields of view (~2000 cells) were analyzed per condition. (B) IL-1β secretion was analyzed by ELISA, (C) Cell death was measured by LDH release. (D) Representative image from (A). White arrowheads indicate inflammasome foci. Scale bar 30 μm. (E) BMDM of the indicated genetic backgrounds were infected with stationary phase S. typhimurium (100:1 MOI) in the presence or absence of pyruvate. Inflammasome foci were quantified at 17 hr post-infection. (F) BMDMs were infected with stationary phase S. typhimurium 12,023 (25:1) expressing a replication plasmid. Generations were quantified at the indicated timepoints post-infection. Data are representative of n=3 experiments. (G) BMDMs were infected with stationary phase S. typhimurium 12,023 (100:1 MOI) constitutively expressing EGFP. Cells were fixed at 17 hr post-infection, stained for ASC, and infection visualized by confocal microscopy. Scale bar 15 μm. (H) Minimal medium containing vehicle, 2 mM glucose, or 2 mM pyruvate was inoculated with wildtype S. typhimurium. Bacterial growth was measured by analyzing OD600. (I) Cytosolic NAD+/NADH was analyzed at 5 and 11 hr post infection with S. typhimurium (100:1 MOI) or vehicle (uninf.) in the presence or absence of 1 mM pyruvate (pyr). NAD+ consumption rate indicates the difference in NAD+/NADH ratio between 5 and 11 hr post-infection. Data are representative of n=3 experiments. For LDH release, ELISA, and metabolic assays, error bars indicate mean +/- sd of technical triplicate. Data were analyzed for statistical significance using an unpaired, two-tailed t test.
Figure 9—figure supplement 1
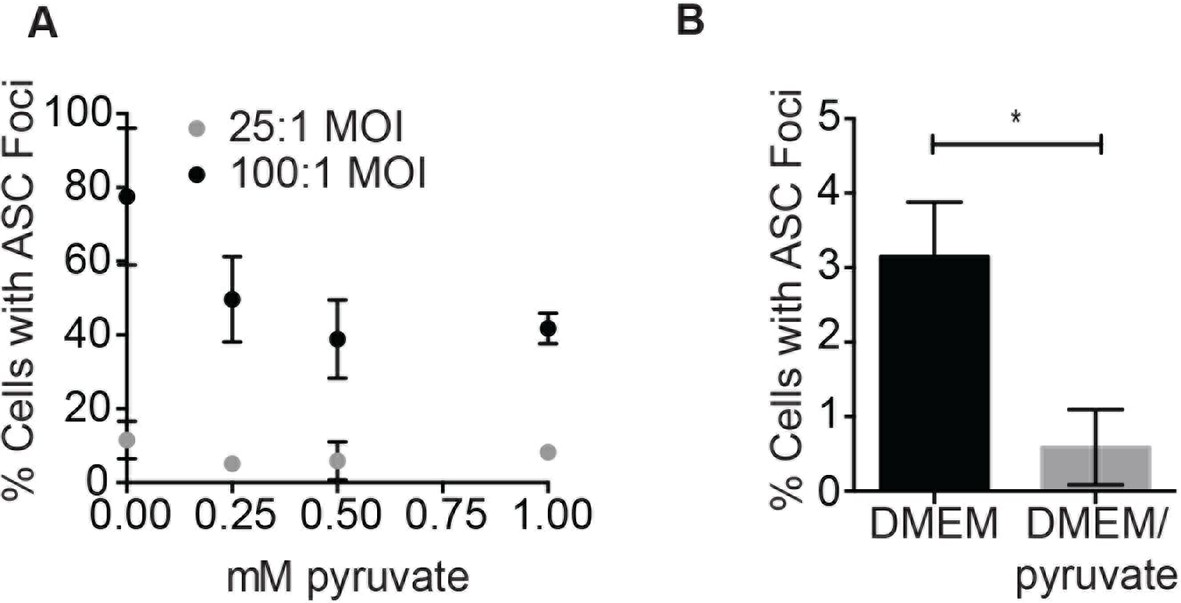
Pyruvate prevents S. typhimurium-induced inflammasome formation in a dose-dependent manner.
(A) BMDM were infected with stationary phase S. typhimurium in the presence of increasing concentrations of pyruvate and inflammasome foci quantified. (B) BMDM were infected with △orgA (SPI-1 deficient) S. typhimurium grown to stationary phase at 25:1 MOI in the presence or absence of 1 mM pyruvate. Inflammasome foci were quantified at 14 hr post-infection.
Figure 9—figure supplement 2
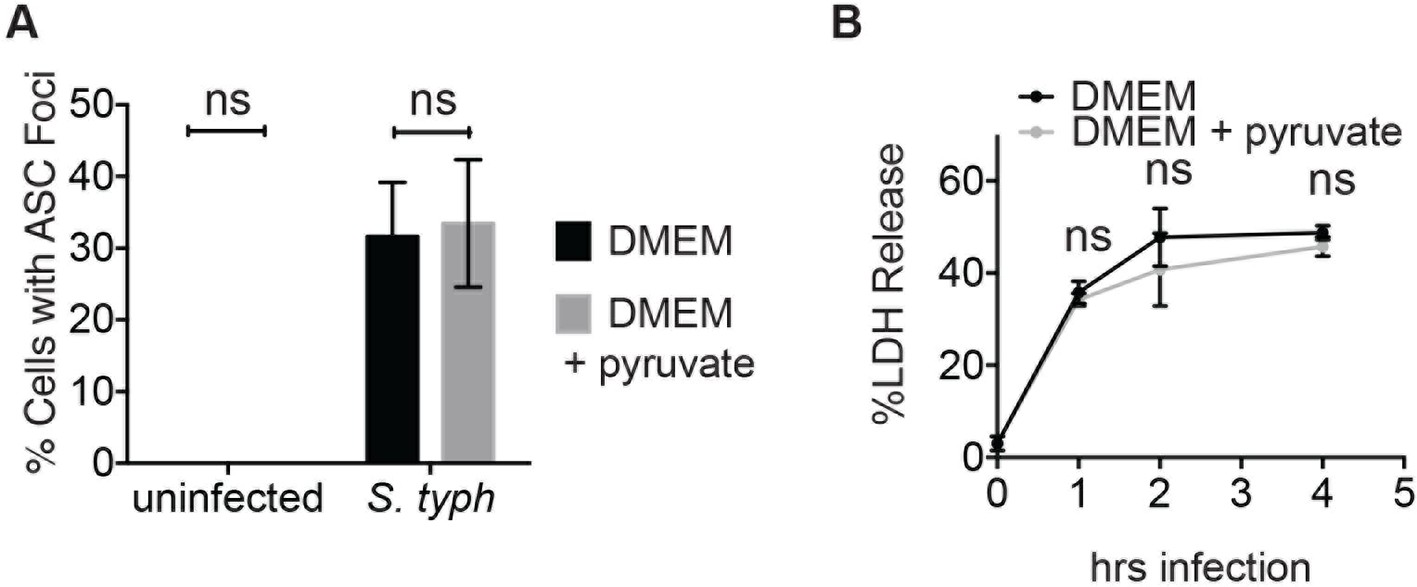
Inflammasome formation and cell death induced by log phase S. typhimurium infection are unaffected by pyruvate.
(A) BMDM were infected with S. typhimurium grown to log phase (10:1 MOI) in the presence or absence of pyruvate and inflammasome foci were quantified after 1 hr. (B) BMDMs were treated as in (A) and cell death was quantified by LDH release at the indicated timepoints.
Figure 10
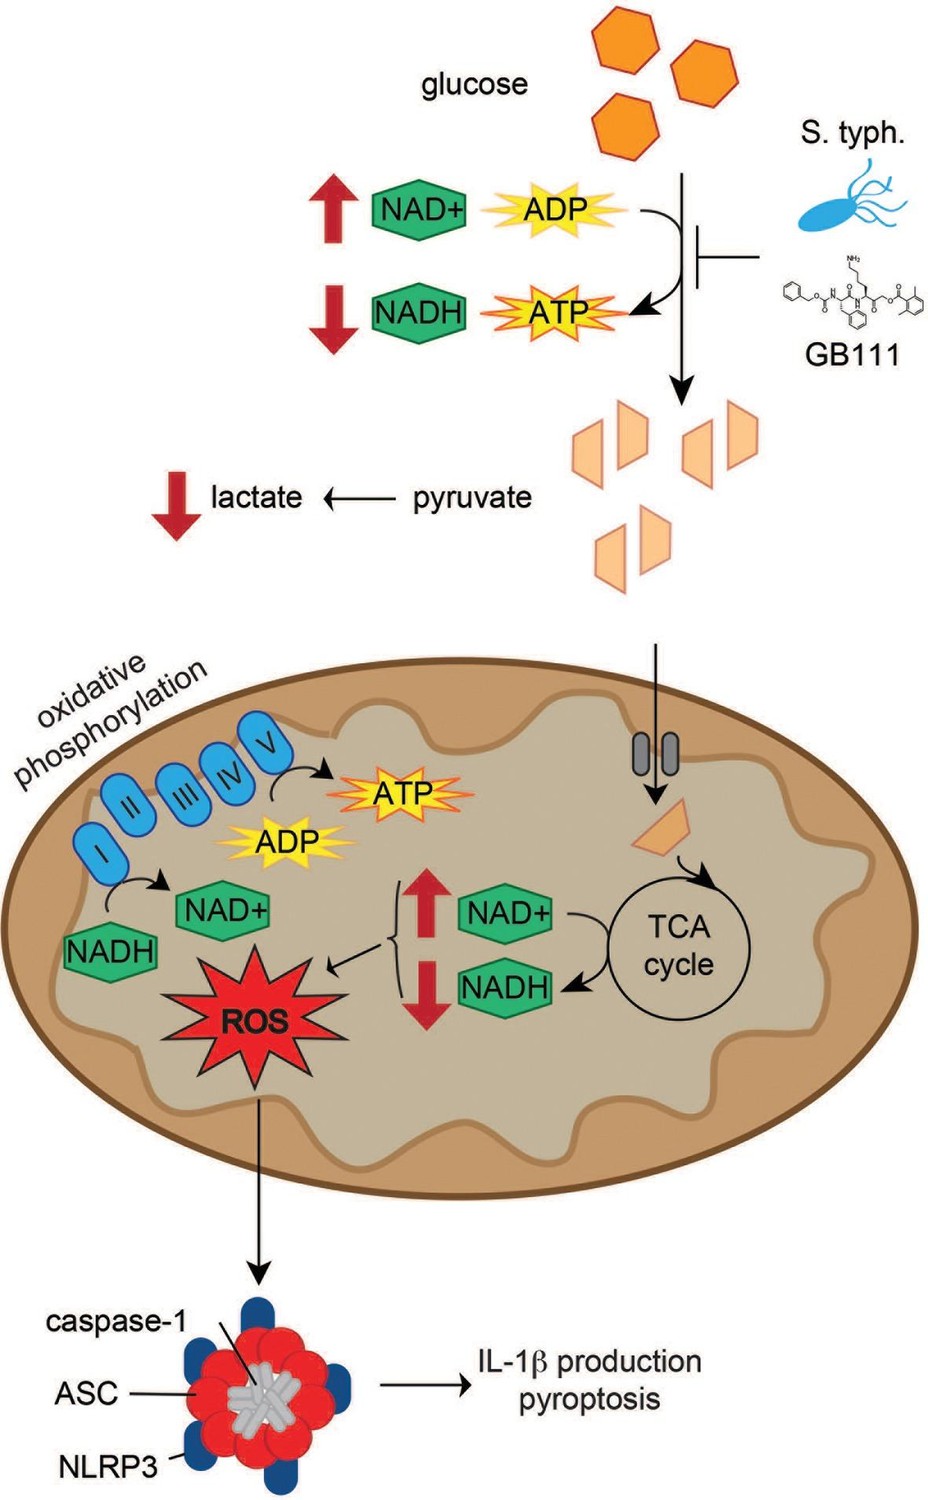
Model of NLRP3 inflammasome activation induced by disruption of glycolytic flux.
S. typhimurium and chemical inhibitors disrupt glycolytic flux in LPS-primed BMDM, resulting in an increase in NAD+/NADH, a decrease in ATP production, and a decrease in lactate secretion. TCA cycle metabolism is also impaired, potentiating the elevated NAD+/NADH ratio into the mitochondria. Mitochondrial ROS are produced by glycolytic disruption and trigger NLRP3 inflammasome formation, IL-1β production, and pyroptosis.
General synthesis schema
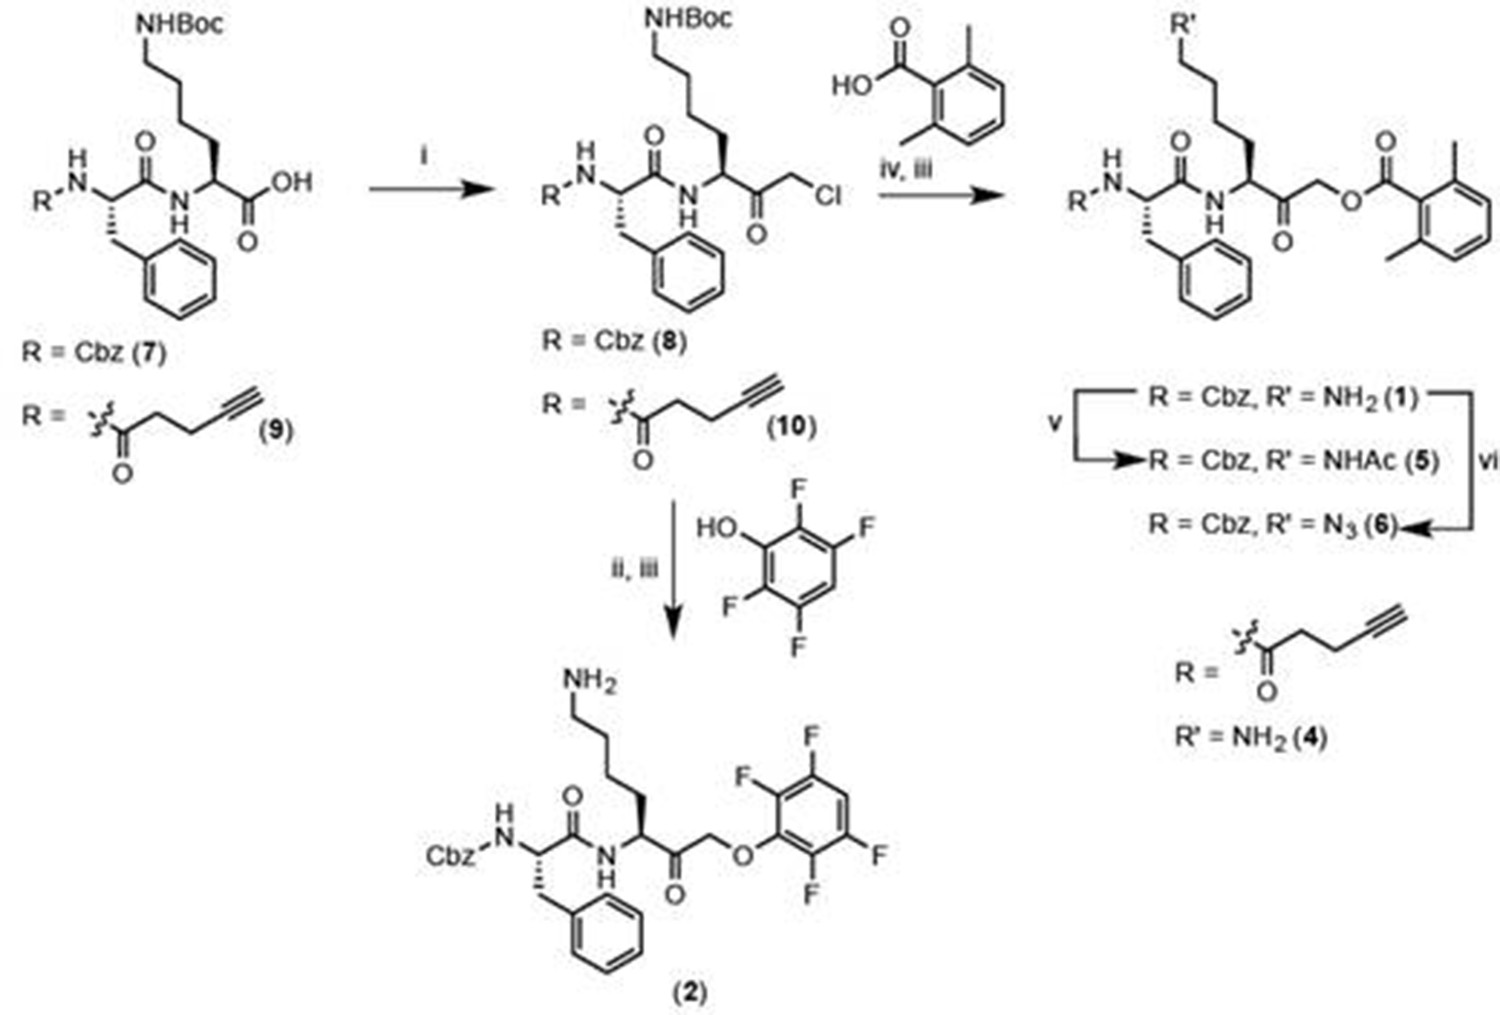
Reagents and conditions: i. IBCF, NMM, THF, -77°C, 1 hr, then CH2N2, -77°C, 1 hr, then warm to RT, 3 hr, then 1:1 HCl:AcOH. ii. 2,3,5,6-tetrafluorophenol, KF, DMF, 80°C, 2 hr. iii. 50% TFA in DCM, 30 min. iv. 2,6-dimethylbenzoic acid, KF, DMF, 9 hr. v. Acetyl chloride, TEA, DCM, 30 min. vi. imidazole-1-sulfonyl azide, K2CO3, CuSO4, MeOH, o/n.
Chemical structure 1
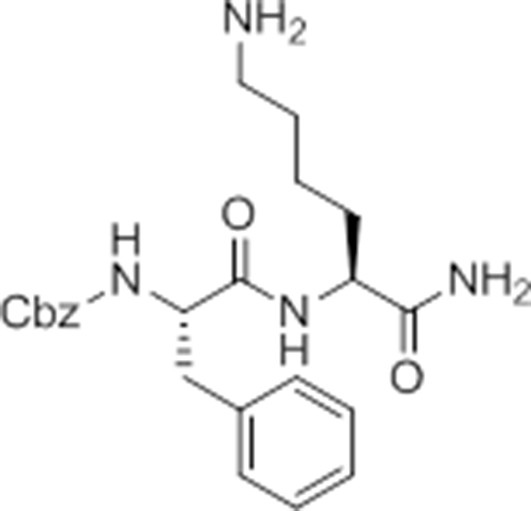
Carboxybenzyl-Phe-Lys-NH2 (NR-GB11).
https://doi.org/10.7554/eLife.13663.026
Chemical structure 2
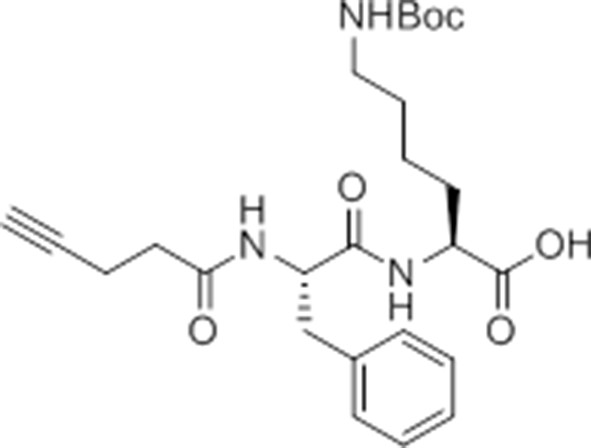
pent-4-ynamido-Phe-Lys(Boc)-OH.
https://doi.org/10.7554/eLife.13663.027
Chemical structure 3
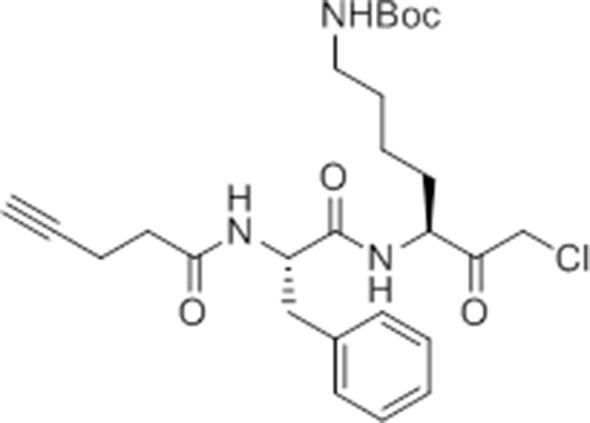
pent-4-ynamido-Phe-Lys(Boc)-CMK.
https://doi.org/10.7554/eLife.13663.028
Chemical structure 4
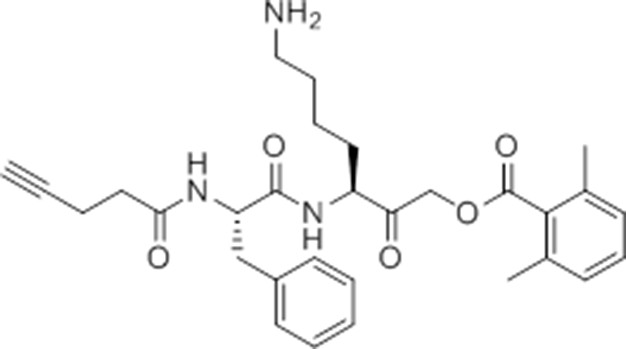
pent-4-ynamido-Phe-Lys(Boc)-AOMK (GB-IA).
https://doi.org/10.7554/eLife.13663.029
Chemical structure 5

Carboxybenzyl-Phe-Lys(Boc)-CMK.
https://doi.org/10.7554/eLife.13663.030
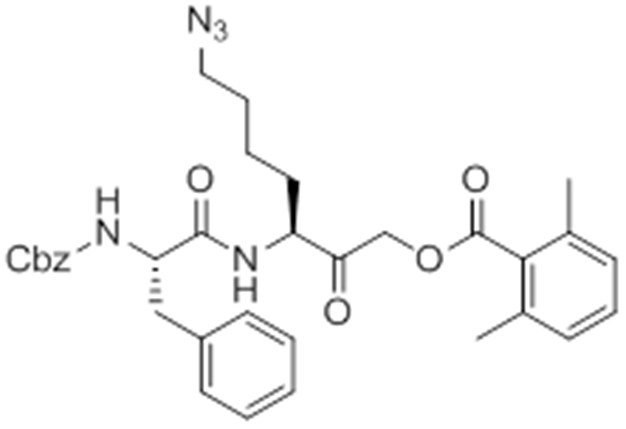
Chemical structure 6
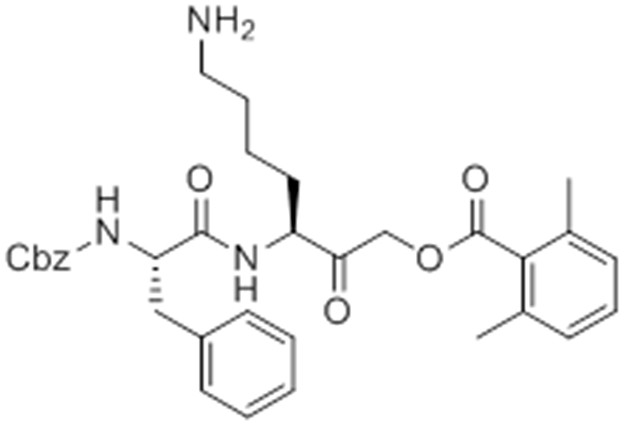
caboxybenzyl-Phe-Lys-AOMK (GB111-NH2).
https://doi.org/10.7554/eLife.13663.031
Chemical structure 7
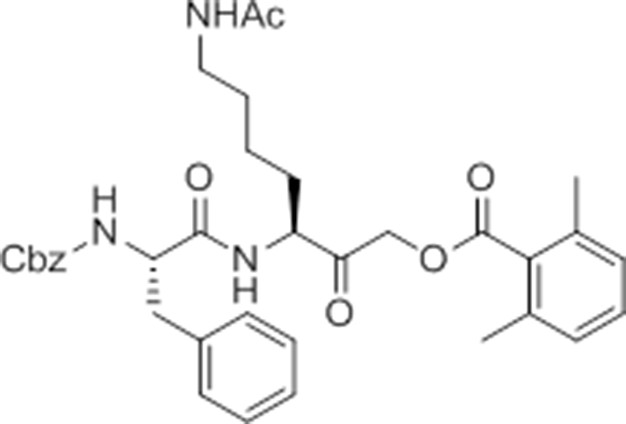
caboxybenzyl-Phe-Lys(Ac)-AOMK (ac-GB111).
https://doi.org/10.7554/eLife.13663.032
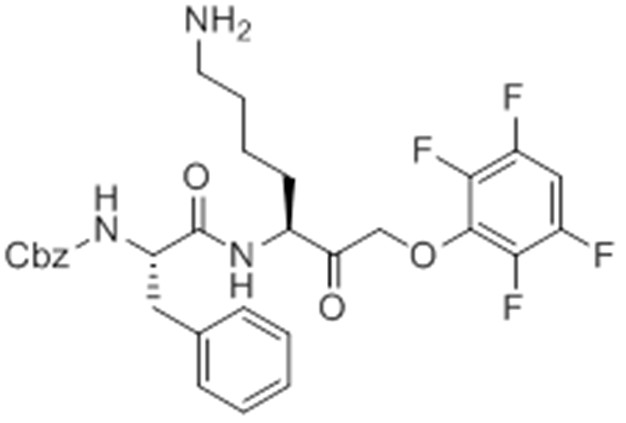
Chemical structure 8
caboxybenzyl-Phe-Lys(Az)-AOMK (az-GB).
https://doi.org/10.7554/eLife.13663.033
Chemical structure 9
caboxybenzyl-Phe-Lys-PMK (GB111-PMK).
https://doi.org/10.7554/eLife.13663.034Additional files
-
Supplementary file 1
Complete MudPIT dataset.
BMDM from four different treatment conditions (see Figure 2) were lysed and lysates reacted with alkyne-biotin. Biotin-labeled proteins were enriched using streptavidin resin, digested off the resin, and bound proteins identified by mass spectrometry. Number of spectral counts from peptides from each identified protein are reported for each condition.
- https://doi.org/10.7554/eLife.13663.035
-
Supplementary file 2
Complete MudPIT dataset normalized to endogenously biotinylated proteins.
Data from Supplementary file 1 was normalized based on relative abundance of endogenously biotinylated proteins across conditions. This data reports normalized spectral counts.
- https://doi.org/10.7554/eLife.13663.036
-
Supplementary file 3
Hits from MudPIT analysis.
A protein was selected as a 'hit' if, in Supplementary file 2, it had over 30 spectral counts in Condition 1, showed 80% competition for az-GB binding by GB111 (Condition 2), and showed <50% competition for az-GB binding by GB-IA (Condition 3). The proteins meeting these criteria and number of spectral counts in each condition are shown.
- https://doi.org/10.7554/eLife.13663.037
-
Supplementary file 4
Compound Characterization and Spectra.
- https://doi.org/10.7554/eLife.13663.038
Download links
A two-part list of links to download the article, or parts of the article, in various formats.
Downloads (link to download the article as PDF)
Open citations (links to open the citations from this article in various online reference manager services)
Cite this article (links to download the citations from this article in formats compatible with various reference manager tools)
Disruption of glycolytic flux is a signal for inflammasome signaling and pyroptotic cell death
eLife 5:e13663.
https://doi.org/10.7554/eLife.13663


