Functional synergy between the Munc13 C-terminal C1 and C2 domains
- University of Texas Southwestern Medical Center, United States
- Charité-Universitätsmedizin Berlin, Germany
- Huazhong University of Science and Technology, China
Figures
Figure 1 with 1 supplement
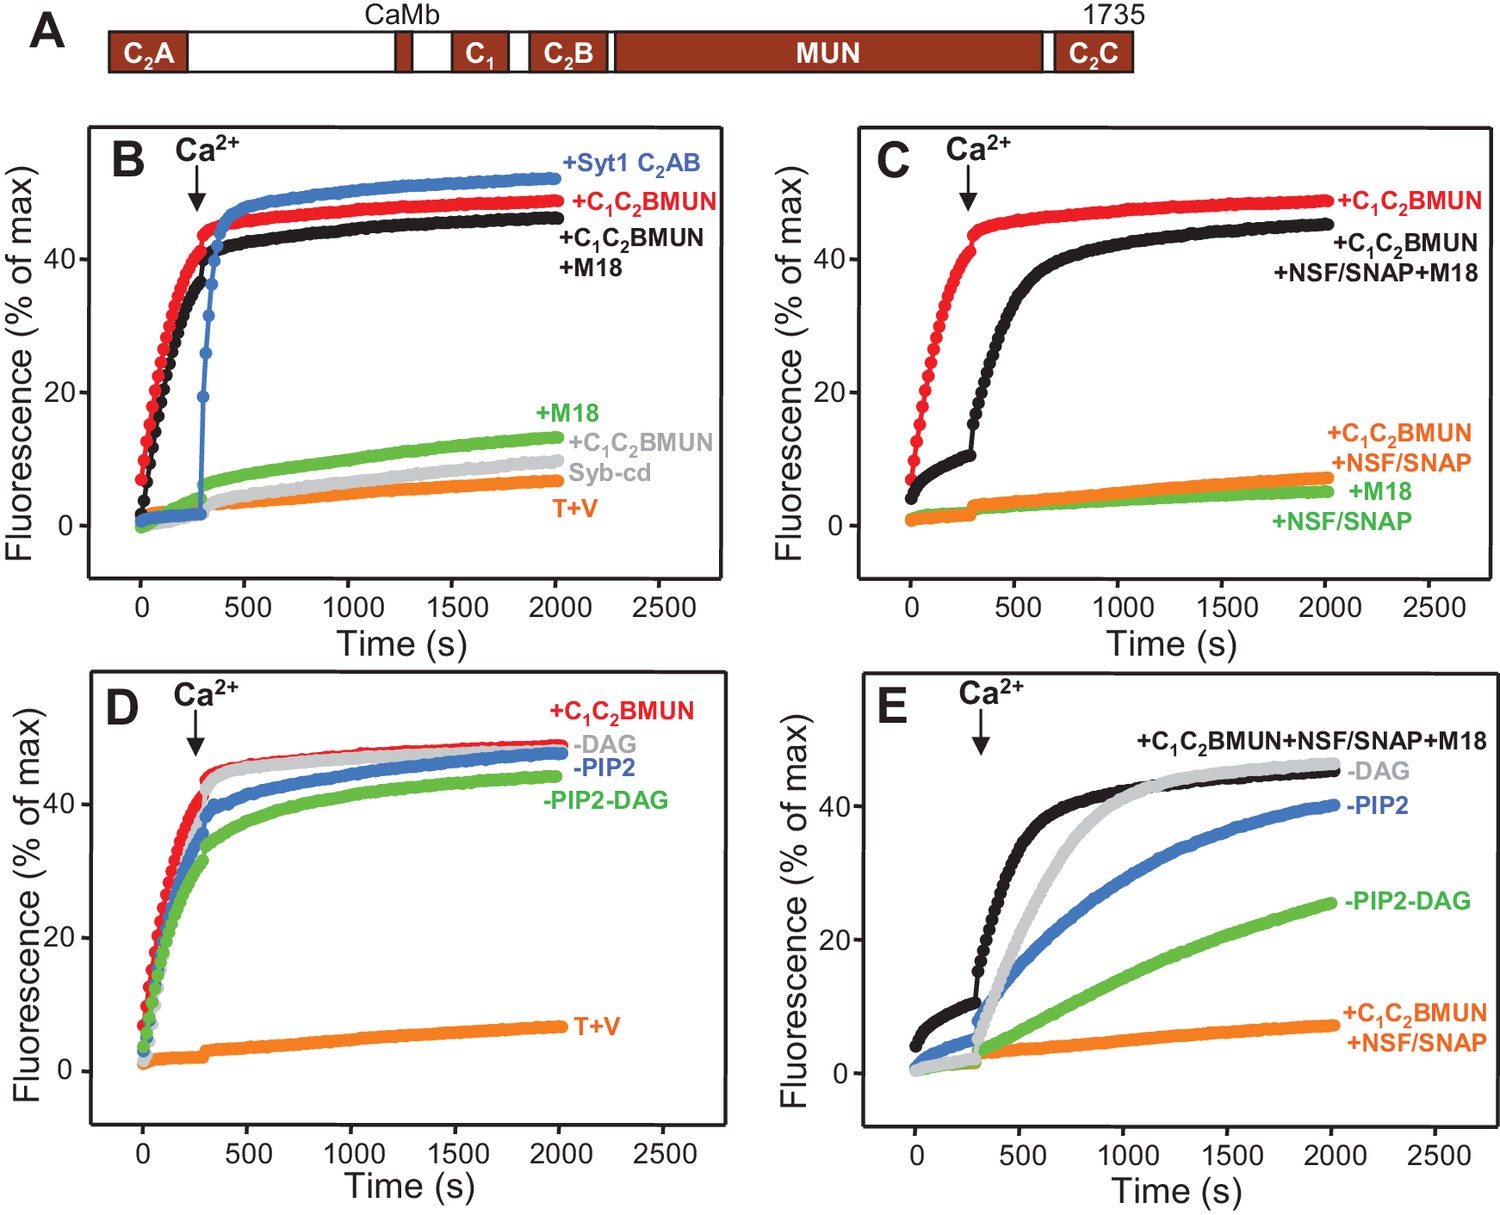
Munc13-1 C1C2BMUN strongly stimulates lipid mixing between V- and T-liposomes.
(A) Domain diagram of Munc13-1. CaMb = calmodulin-binding sequence. (B–C) Lipid mixing assays between V- and T-liposomes alone (T+V) or in the presence of different combinations of Munc13-1 C1C2BMUN, Syt1 C2AB fragment, Munc18-1 (M18), NSF-αSNAP (NSF/SNAP) and synaptobrevin cytoplasmic domain (Syb-cd). T-liposomes contained 1% DAG and 1% PIP2. (D–E) Analogous lipid mixing assays performed in the presence of C1C2BMUN (D) or C1C2BMUN plus Munc18-1 and NSF-αSNAP (NSF/SNAP) (E) with T-liposomes containing 1% DAG and 1% PIP2, 1% PIP2 (-DAG), 1% DAG (-PIP2) or no DAG and PIP2 (-DAG-PIP2). Controls of T+V (D) or T+V in the presence of C1C2BMUN plus NSF-αSNAP (NSF/SNAP) (E), both with T-liposomes containing 1% DAG and 1% PIP2, are shown in orange. All experiments were started in the presence of 100 μM EGTA, and Ca2+ (600 μM) was added after 300 s.
Figure 1—figure supplement 1
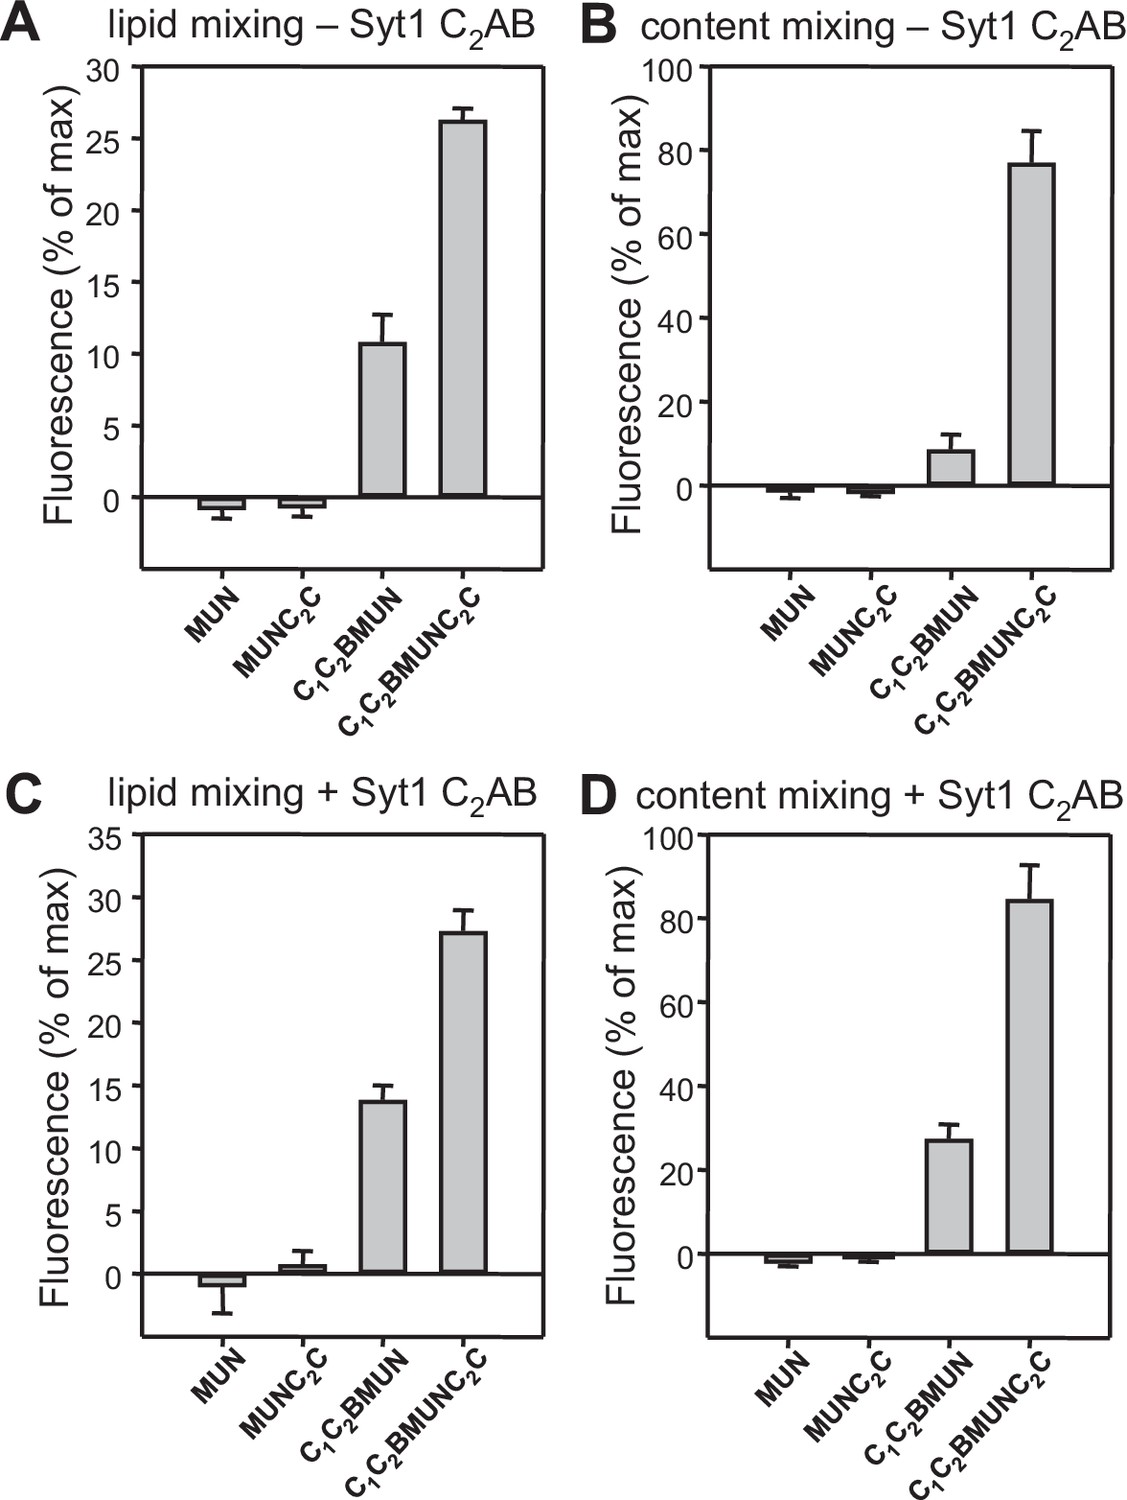
Quantification of the lipid mixing experiments of Figure 1.
Panels (A–D) correspond to panels (B–E) of Figure 1, respectively. Bars represent averages of the normalized NBD fluorescence observed after 500 s (200 s after Ca2+ addition) in experiments performed at least in triplicate. Error bars represent standard deviations.
Figure 2 with 1 supplement

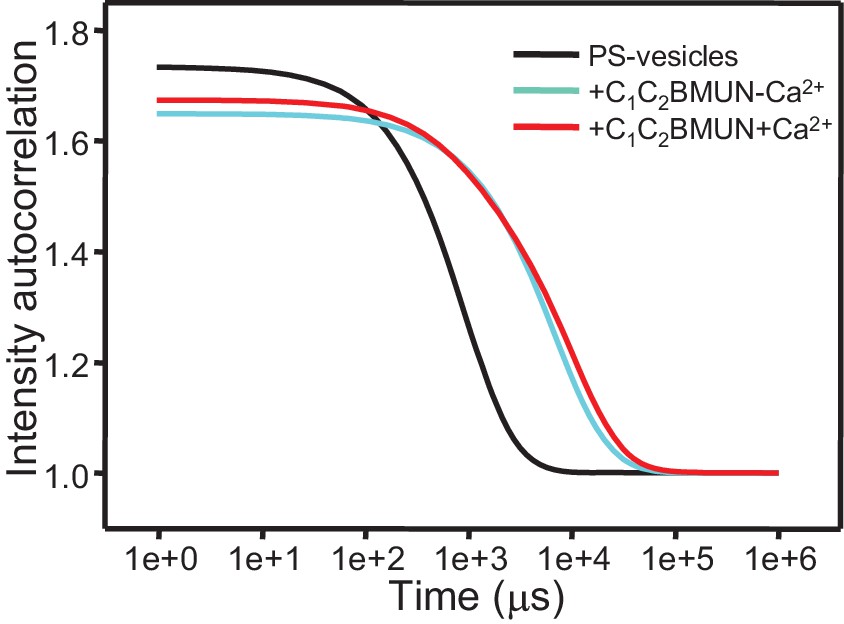
Munc13-1 C1C2BMUN clusters PS-containing liposomes.
(A–E) The particle size in samples containing phospholipid vesicles alone (gray bars) or after incubation with Munc13-1 C1C2BMUN for 5 min (red bars) in the absence of Ca2+ was measured by DLS. The liposomes had a standard lipid composition including no PS (A), PS (B), PS and synaptobrevin (C), PS+DAG+PIP2 (D) or PS and syntaxin-1 (E). (F) Intensity autocorrelation curves corresponding to the experiments shown in (A–E) after incubation with Munc13-1 C1C2BMUN for 5 min.
Figure 2—figure supplement 1
Ca2+ does not stimulate liposome clustering by C1C2BMUN strongly.
The diagram shows intensity autocorrelation curves measured by DLS at 25°C for PS-containing vesicles alone or after 5 min incubation with C1C2BMUN in the presence of 100 μM EGTA or 500 μM Ca2+.
Figure 3 with 1 supplement
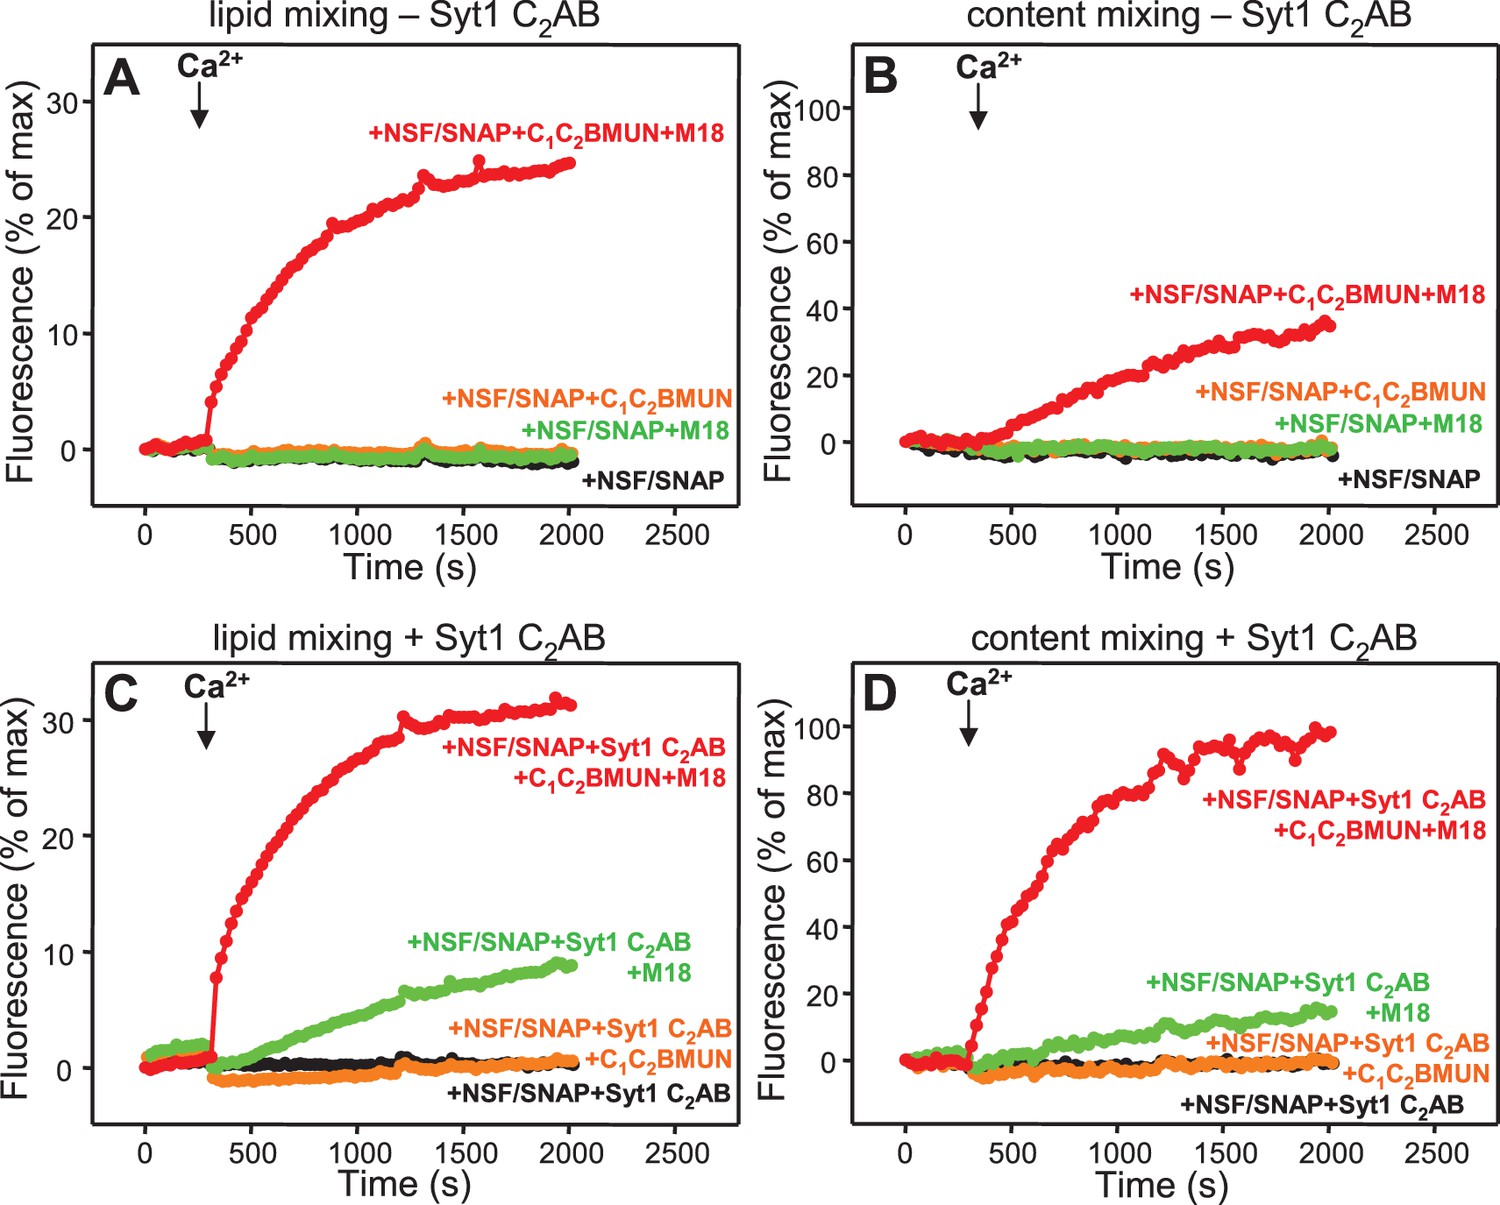
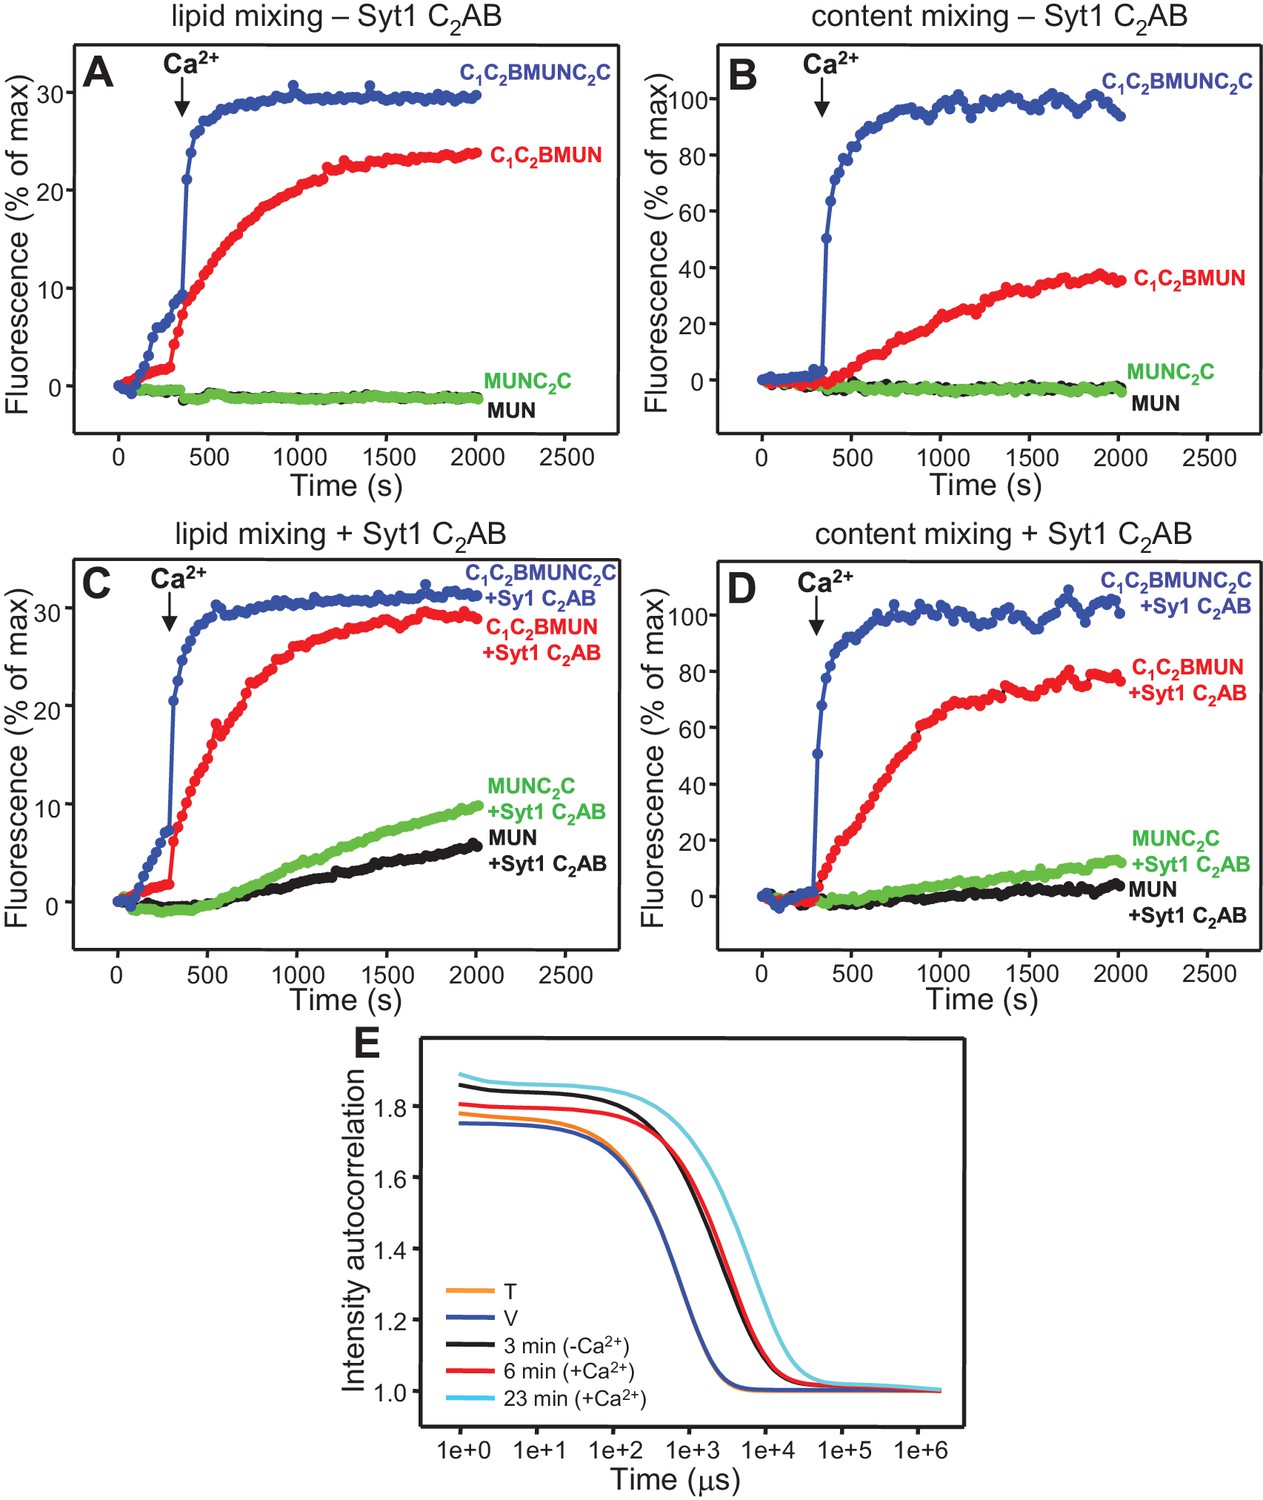
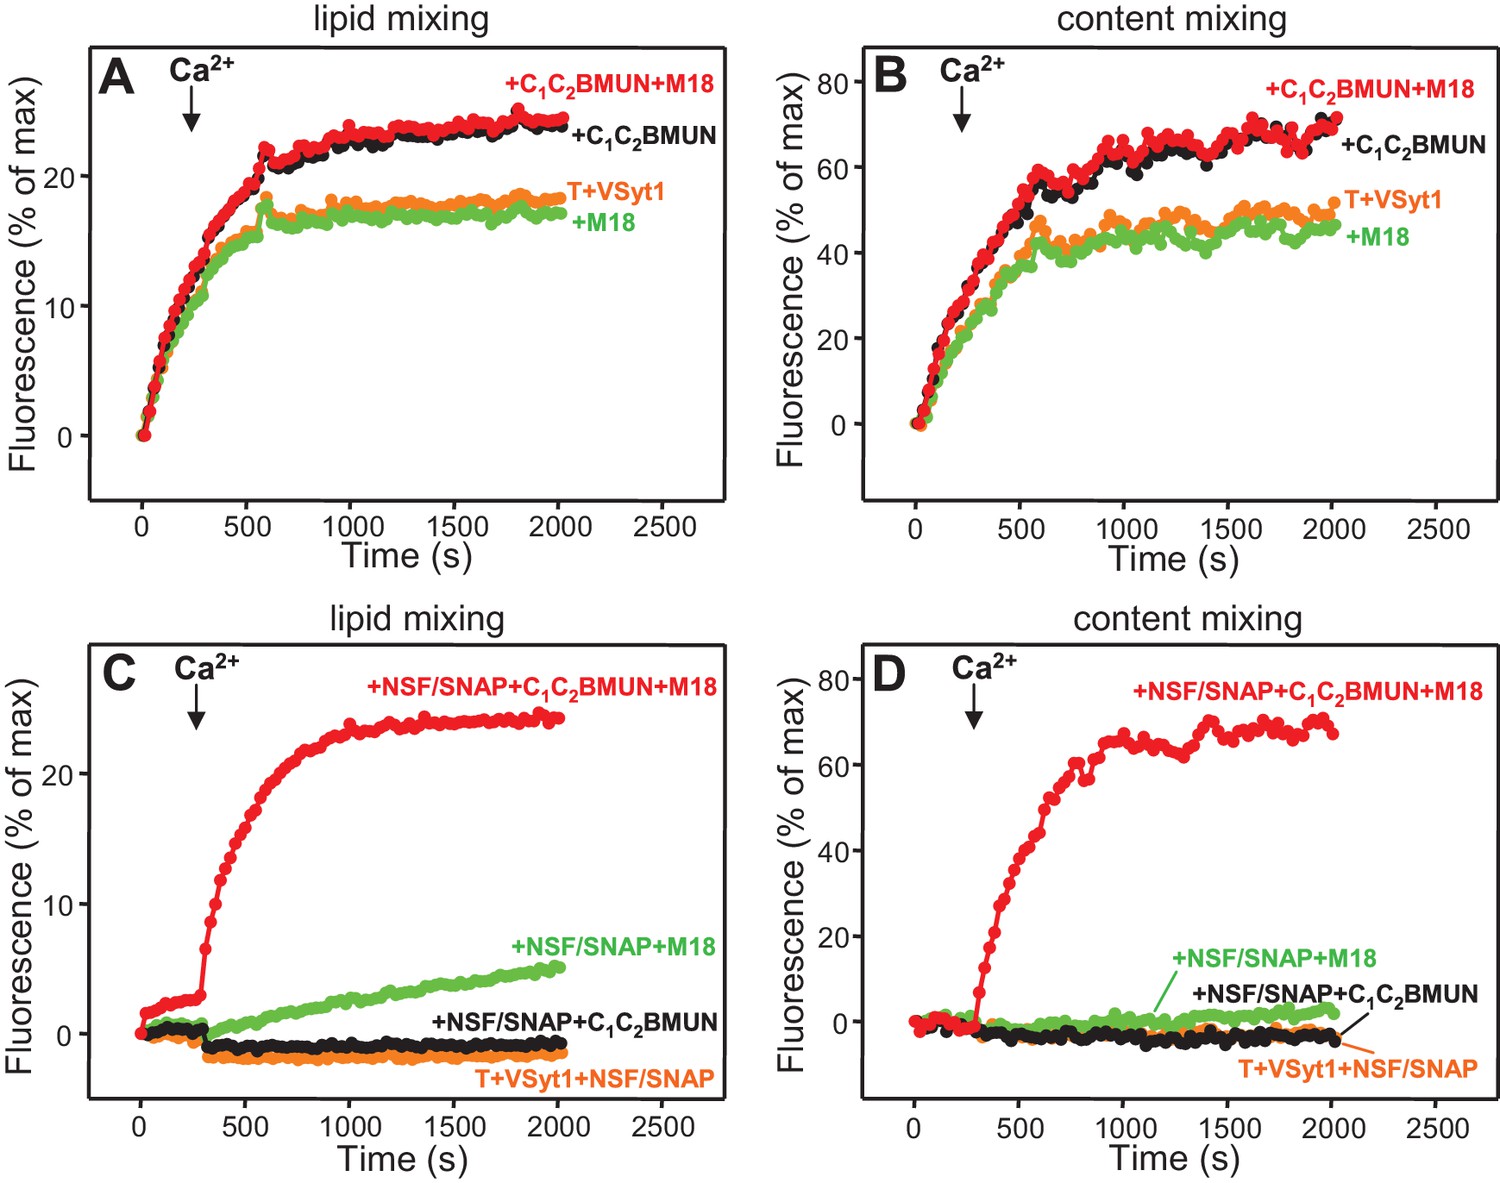
Syt1 is required for efficient content mixing but not lipid mixing in reconstitutions including Munc18-1, Munc13-1 C1C2BMUN and NSF-αSNAP.
Lipid mixing (A,C) between V- and T-liposomes was measured from the fluorescence de-quenching of Marina Blue-labeled lipids and content mixing (B,D) was monitored from the development of FRET between PhycoE-Biotin trapped in the T-liposomes and Cy5-Streptavidin trapped in the V-liposomes. The assays were performed in the presence of different combinations of Munc13-1 C1C2BMUN, Munc18-1 (M18) and NSF-αSNAP (NSF/SNAP), and in the absence (A,B) or presence (C,D) of Syt1 C2AB fragment. Experiments were started in the presence of 100 μM EGTA and 5 μM streptavidin, and Ca2+ (600 μM) was added after 300 s.
Figure 3—figure supplement 1
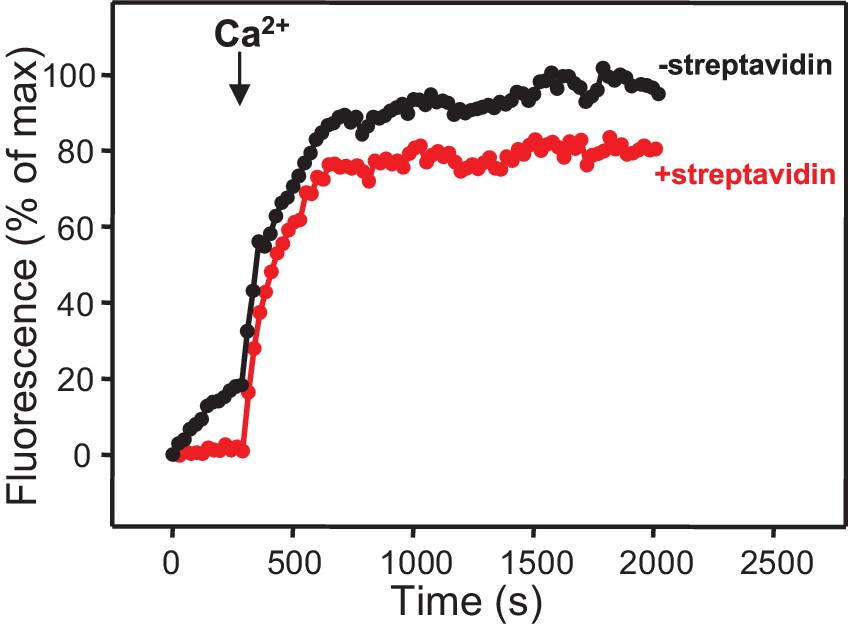
Assessment of leakiness in content mixing assays.
Content mixing assays monitoring the development of FRET between PhycoE-Biotin trapped in the T-liposomes and Cy5-Streptavidin trapped in the V-liposomes were performed as in Figure 3D in the presence of Munc13-1 C1C2BMUN, Munc18-1, NSF-αSNAP, and Syt1 C2AB fragment with (red curve) or without (black curve) 5 μM streptavidin.
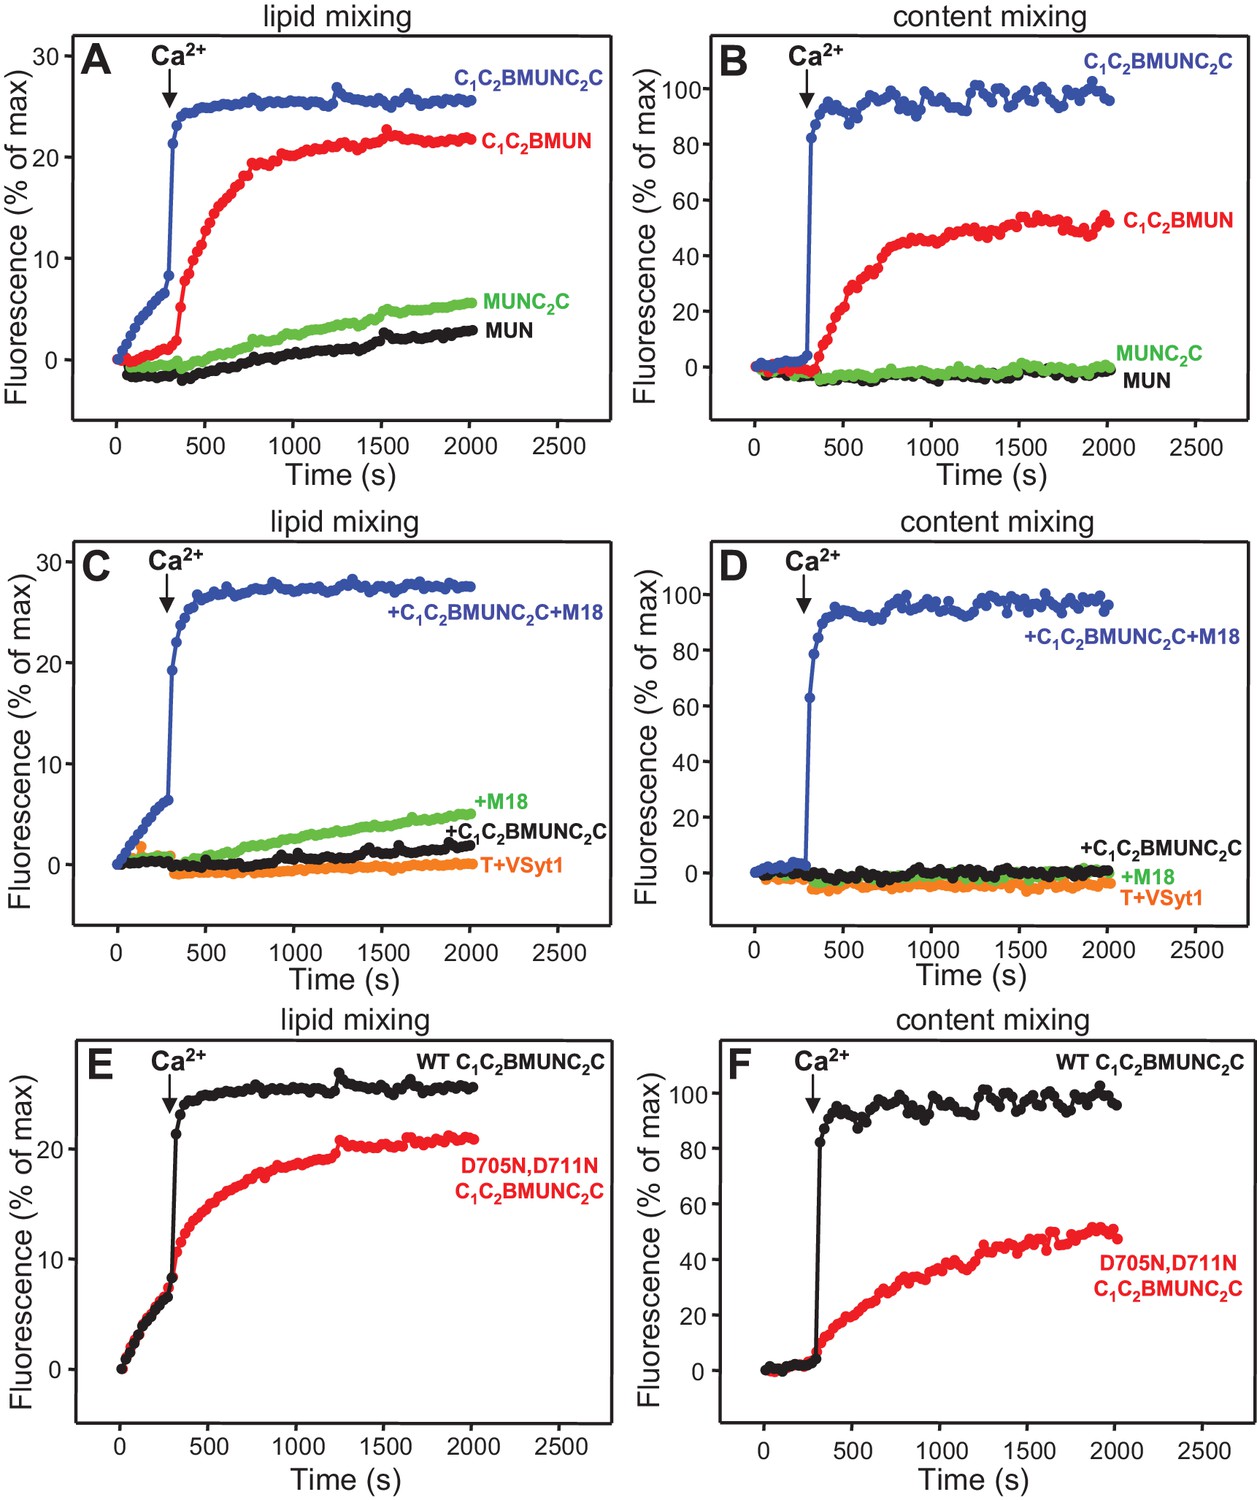
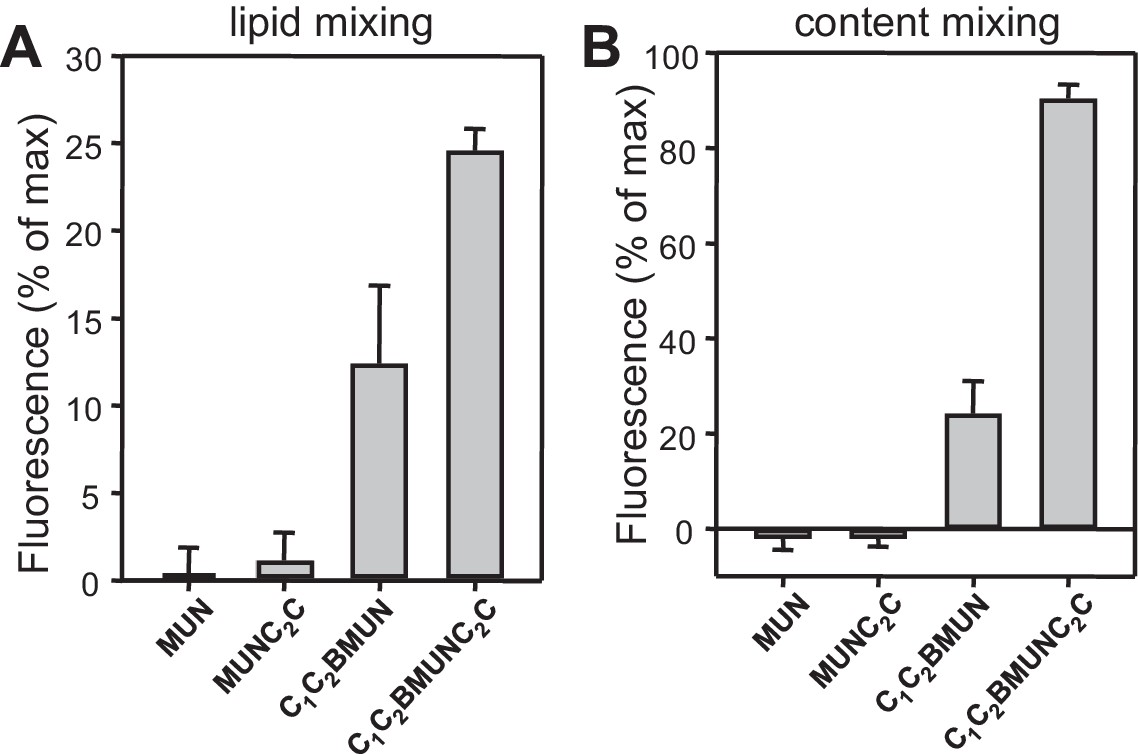
Figure 4 with 4 supplements
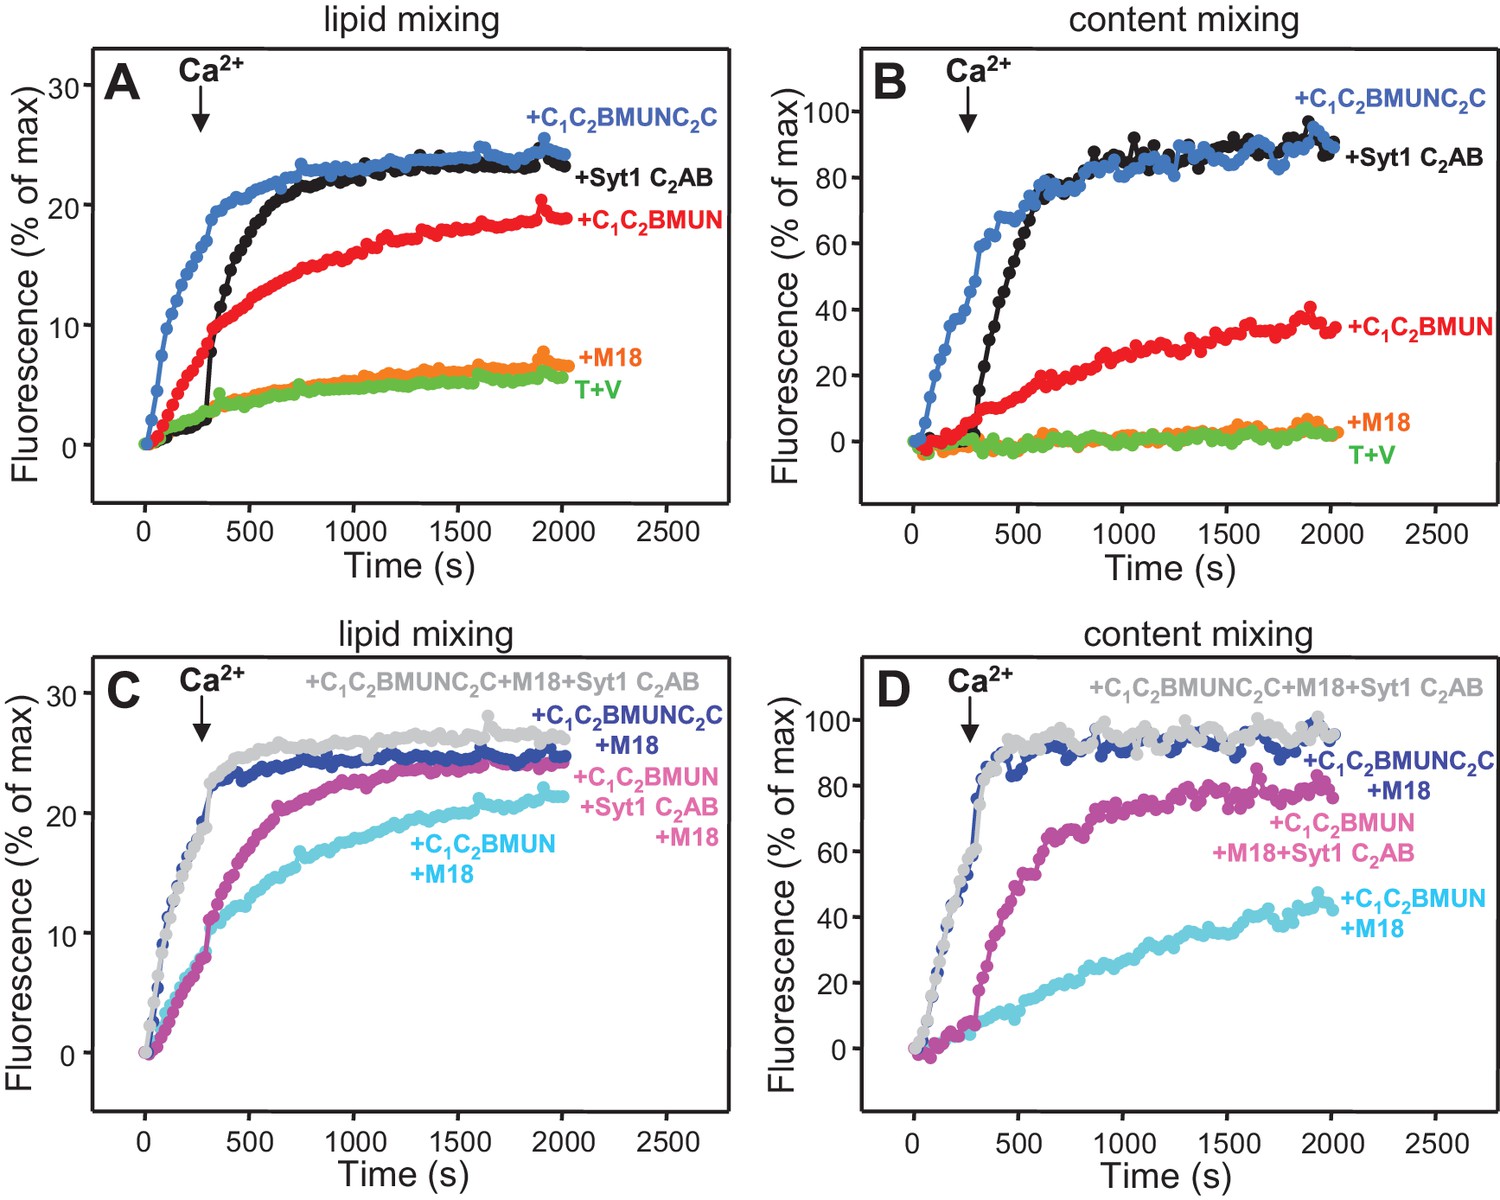
The Munc13-1 C2C domain strongly stimulates membrane fusion.
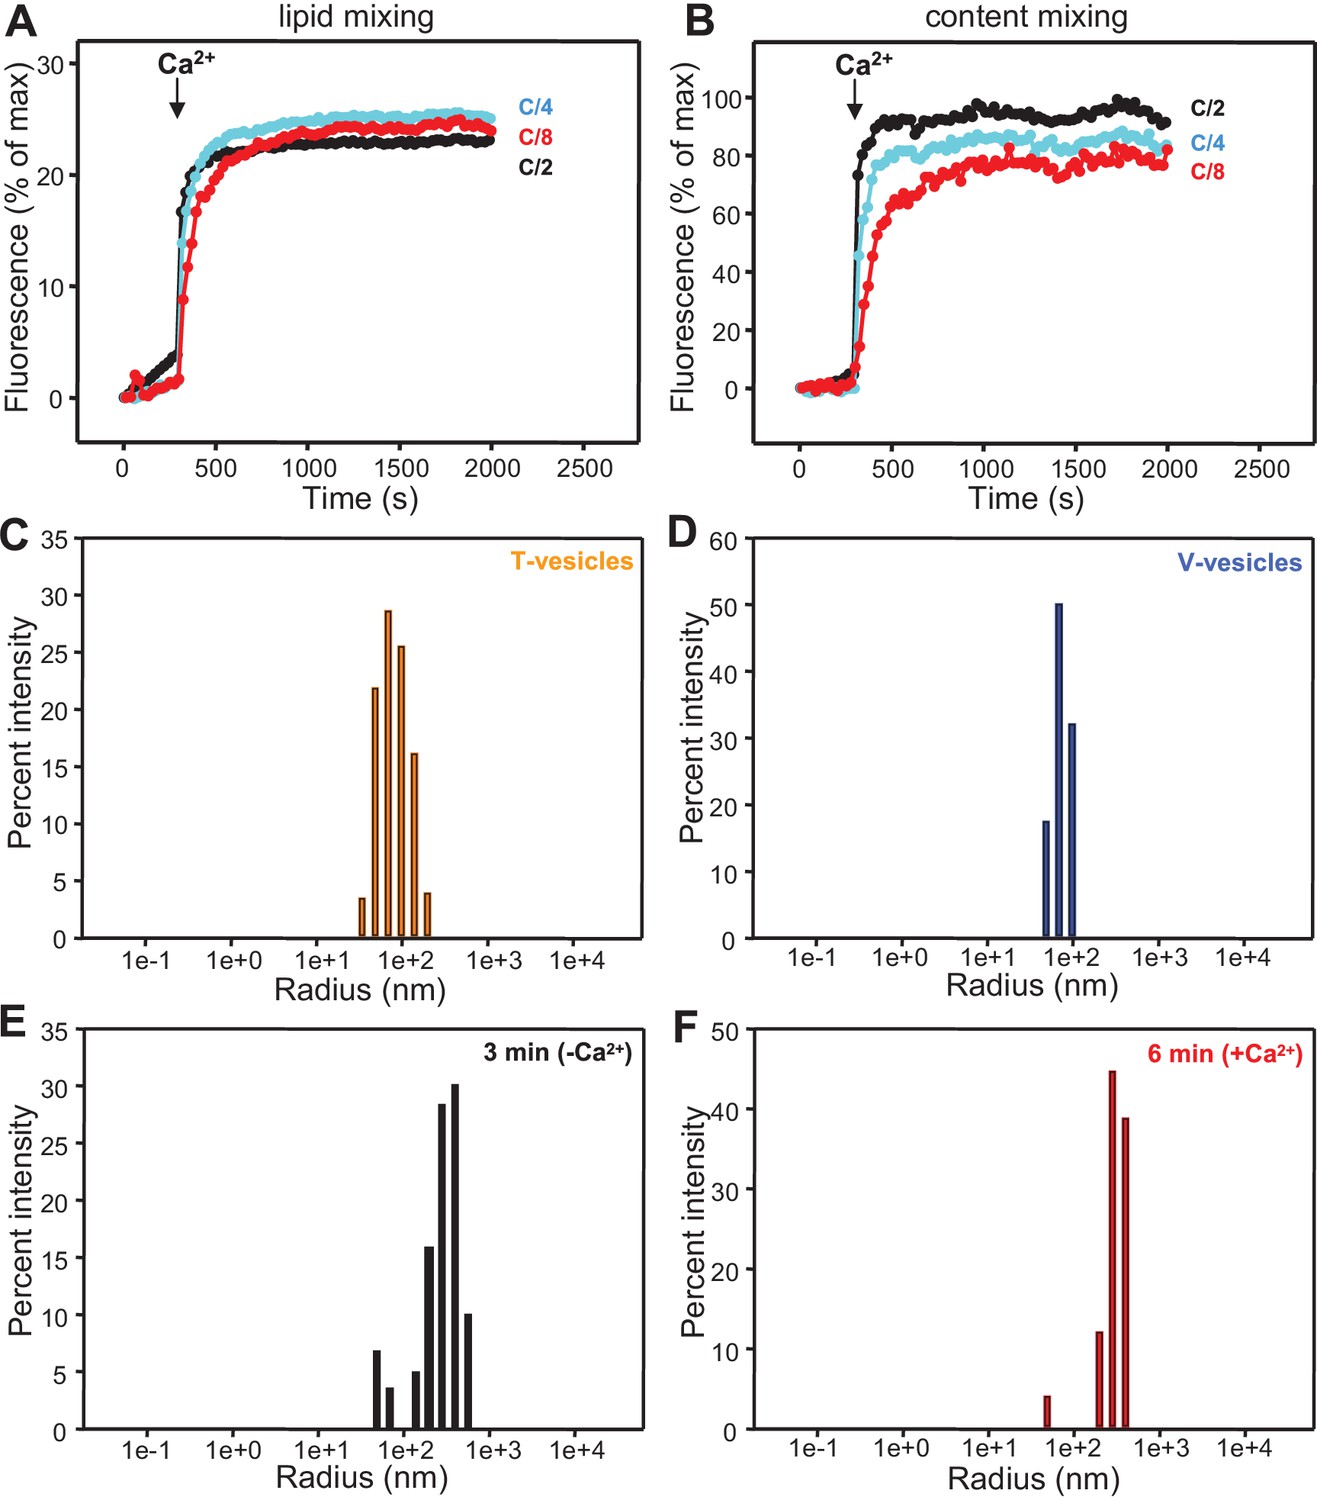
Lipid mixing (A,C) between V- and T-liposomes was measured from the fluorescence de-quenching of Marina Blue-labeled lipids and content mixing (B,D) was monitored from the development of FRET between PhycoE-Biotin trapped in the T-liposomes and Cy5-Streptavidin trapped in the V-liposomes. The assays were performed in the presence of Munc18-1, NSF-αSNAP and distinct Munc13-1 fragments as indicated, without (A,B) or with (C,D) Syt1 C2AB fragment. Experiments were started in the presence of 100 μM EGTA and 5 μM streptavidin, and Ca2+ (600 μM) was added after 300 s. (E) Intensity autocorrelation curves measured by DLS for isolated V- or T-liposomes, or at different time points as indicated in a fusion reaction performed as in (A,B) with C1C2BMUNC2C and 8-fold dilution of all proteins and liposomes. Lipid and content mixing curves for this reaction, as well as particle size distributions corresponding to several of these intensity autocorrelation curves, are shown in Figure 4—figure supplement 4.
Figure 4—figure supplement 1
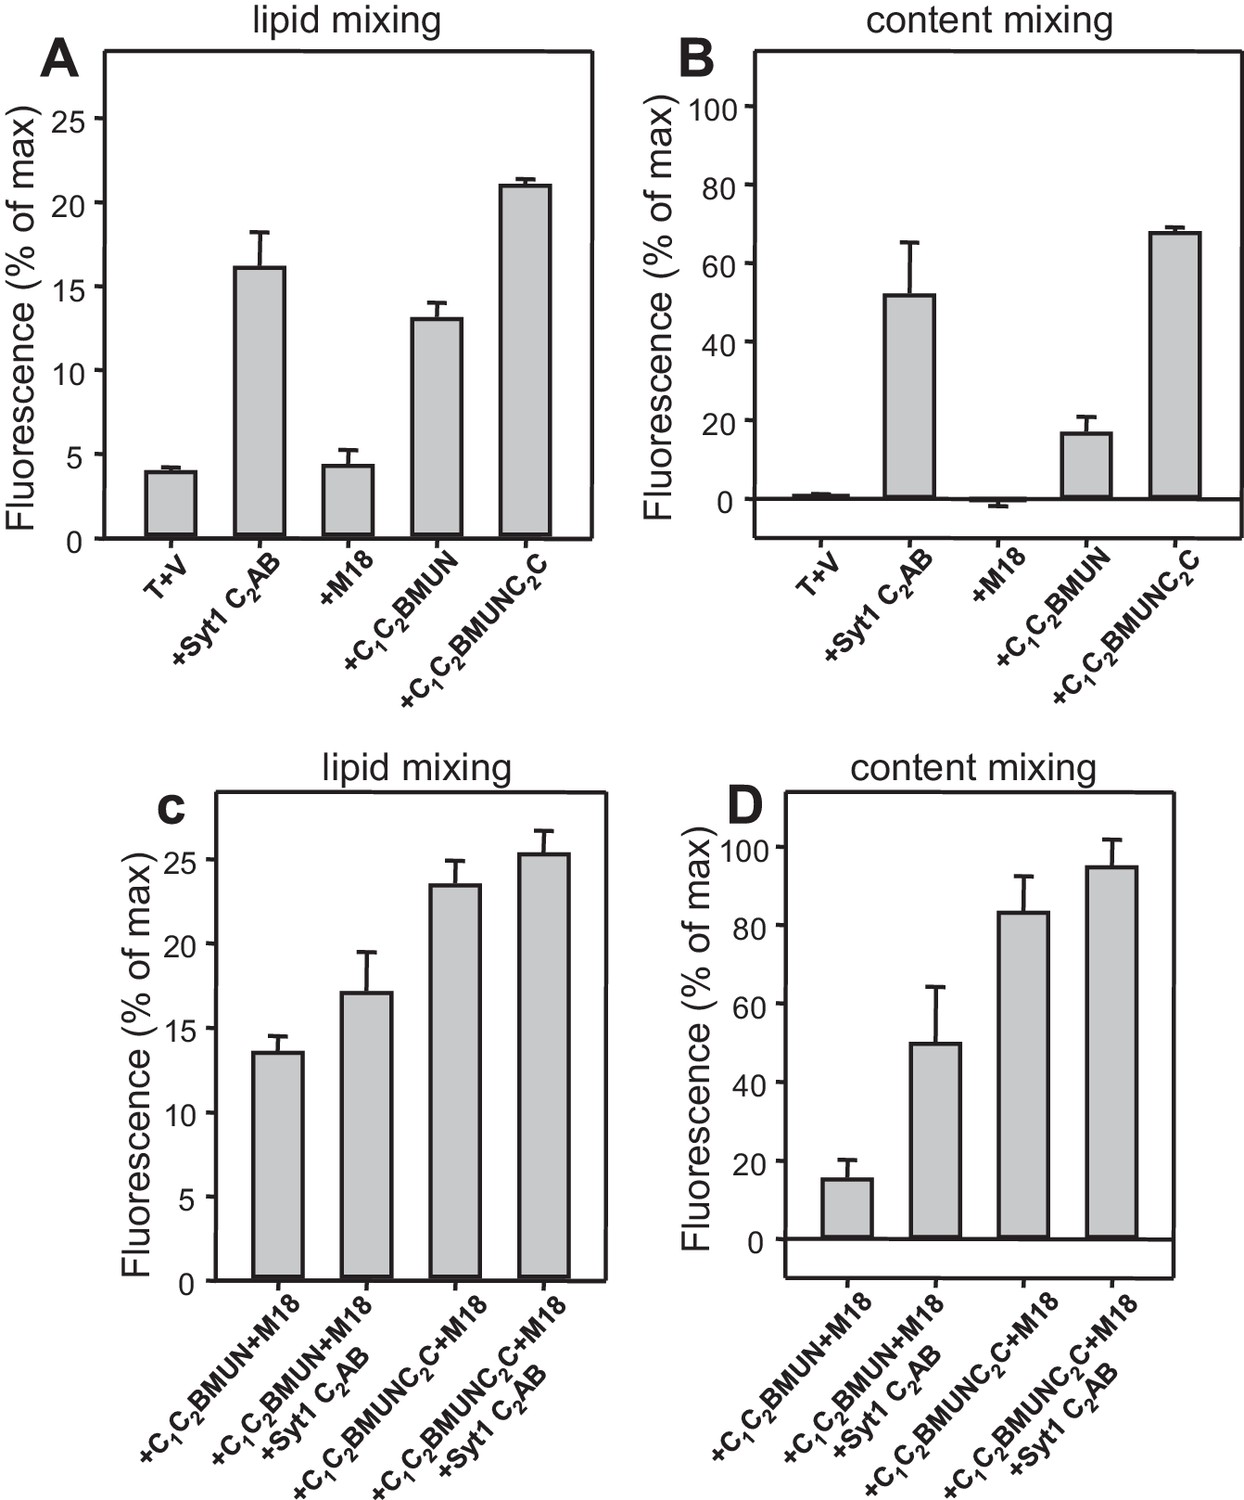
Quantification of lipid and content mixing experiments of Figure 4.
Panels (A–D) correspond to panels (A–D) of Figure 4, respectively. Bars represent averages of the normalized fluorescence observed after 500 s (200 s after Ca2+ addition) in experiments performed at least in triplicate. Error bars represent standard deviations.
Figure 4—figure supplement 2
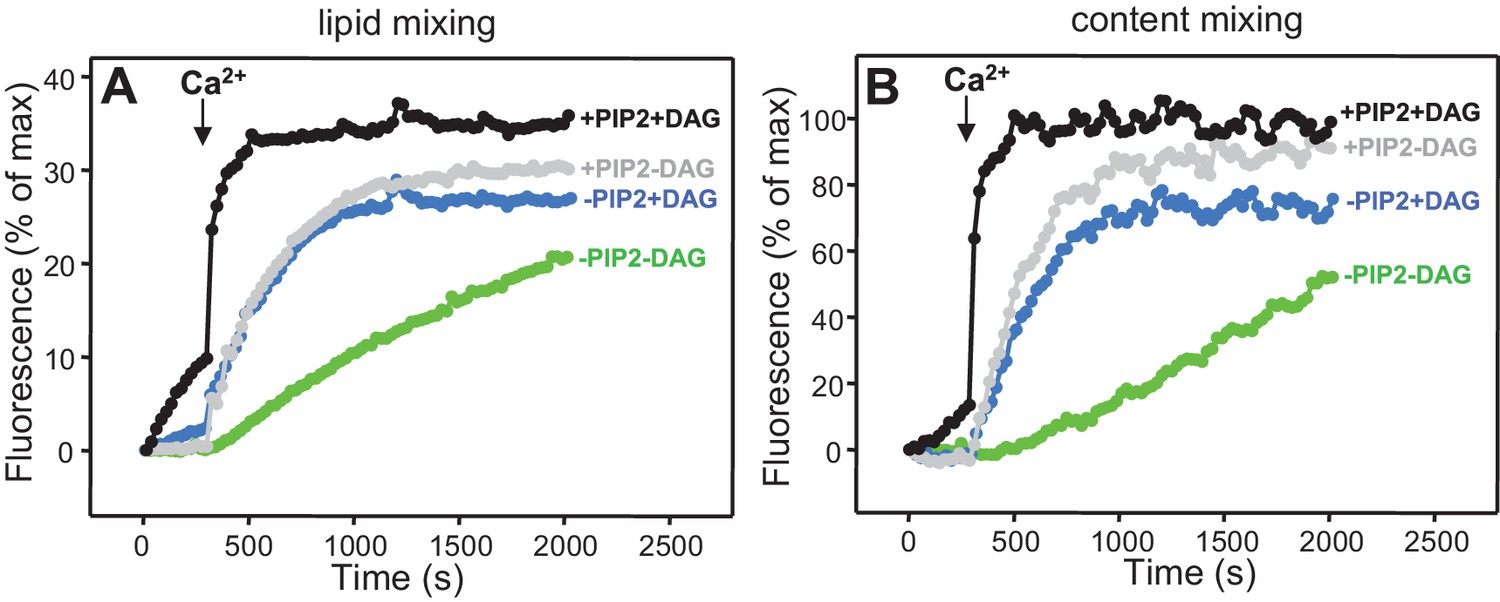
Dependence of lipid and content mixing on DAG and PIP2.
Lipid (A) and content (B) mixing assays were performed as in Figure 4 in the presence of Munc18-1, NSF-αSNAP, Munc13-1 C1C2BMUNC2C and Syt1 C2AB fragment with T-liposomes that contained or lacked 1% DAG and/or 1% PIP2.
Figure 4—figure supplement 3
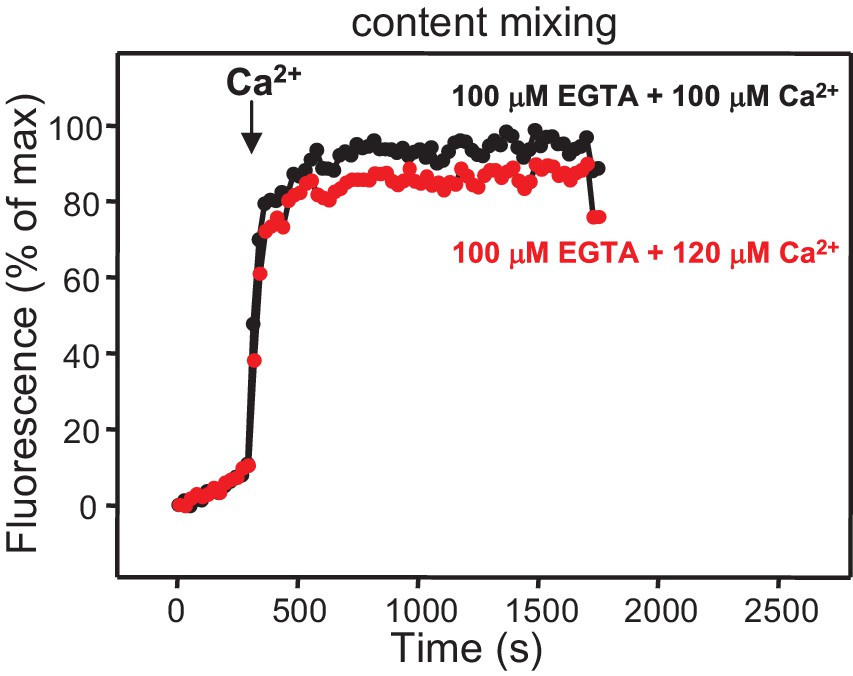
Ca2+-dependence of membrane fusion.
Content mixing assays were performed as in Figure 4 in the presence of Munc18-1, NSF-αSNAP, Munc13-1 C1C2BMUNC2C and Syt1 C2AB fragment, starting in the presence of 100 μM EGTA and adding 100 μM Ca2+ (black curve) or 120 μM Ca2+ (red curve) after 300 s. Note that the extent of content mixing is comparable in both experiments to that observed when 600 μM Ca2+ was added at 300 s (Figure 4D).
Figure 4—figure supplement 4
Analysis of particle size during fusion assays between V- and T-liposomes in the presence of Munc18-1, NSF-αSNAP and Munc13-1 C1C2BMUNC2C.
(A,B) Lipid mixing (A) between V- and T-liposomes was measured from the fluorescence de-quenching of Marina Blue-labeled lipids and content mixing (B) was monitored from the development of FRET between PhycoE-Biotin trapped in the T-liposomes and Cy5-Streptavidin trapped in the V-liposomes. The assays were performed in the presence of Munc18-1, NSF-αSNAP and distinct Munc13-1 fragments as in Figures 4A,B but with all protein and liposome concentrations divided by 2, 4 or 8 (C/2, C/4 or C/8, respectively). Experiments were started in the presence of 100 μM EGTA and 5 μM streptavidin, and Ca2+ (600 μM) was added after 300 s. (C–F) Bar diagrams showing particle size distributions for several of the intensity autocorrelation curves shown in Figure 4E (same color coding).
Figure 5 with 1 supplement
Munc13-1 C1C2BMUNC2C can induce Ca2+-independent fusion of V- and T-liposomes in the absence of NSF-αSNAP.
Lipid mixing (A,C) between V- and T-liposomes was measured from the fluorescence de-quenching of Marina Blue-labeled lipids and content mixing (B,D) was monitored from the development of FRET between PhycoE-Biotin trapped in the T-liposomes and Cy5-Streptavidin trapped in the V-liposomes. The assays were performed in the presence of different combinations of Munc18-1 (M18), Syt1 C2AB fragment and Munc13-1 C1C2BMUN or C1C2BMUNC2C as indicated. Experiments were started in the presence of 100 μM EGTA and 5 μM streptavidin, and Ca2+ (600 μM) was added after 300 s.
Figure 5—figure supplement 1
Quantification of lipid and content mixing experiments of Figure 5.
Panels (A–D) correspond to panels (A–D) of Figure 5, respectively. Bars represent averages of the normalized fluorescence observed after 500 s (200 s after Ca2+ addition) in experiments performed at least in triplicate. Error bars represent standard deviations.
Figure 6 with 4 supplements
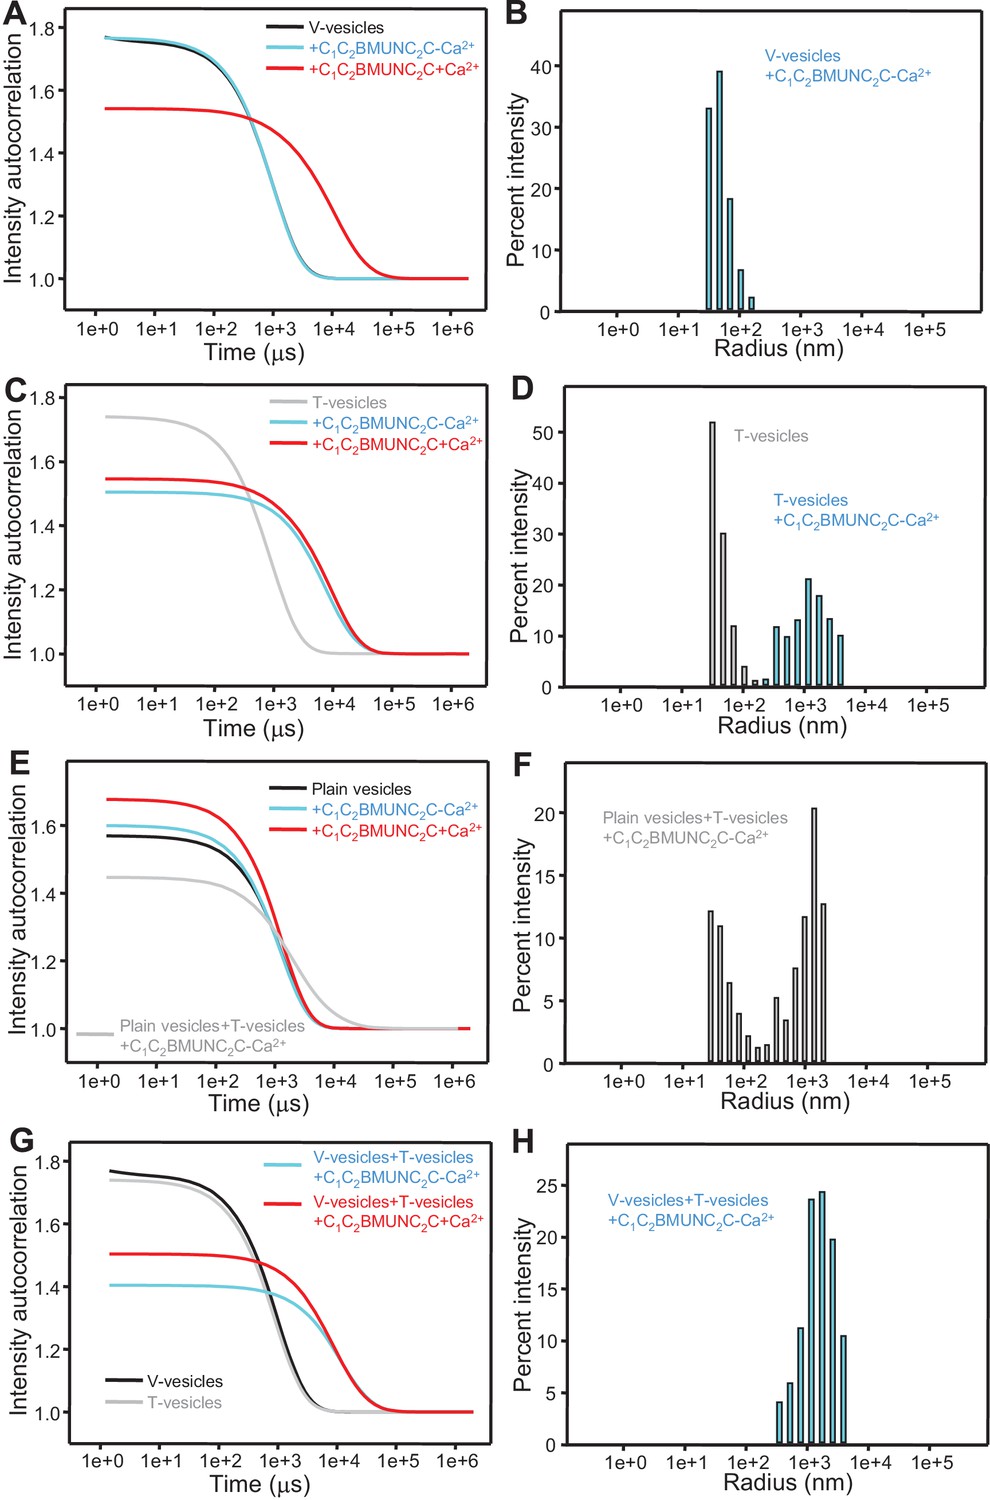
The Munc13-1 C1C2BMUNC2C fragment bridges V-liposomes to T-liposomes.
(A,C,E,G) Intensity autocorrelation curves measured by DLS after 3 min incubations at 20°C on samples containing: (A) V-vesicles alone or in the presence of C1C2BMUNC2C and 100 μM EGTA or 500 μM Ca2+; (C) T-vesicles alone or in the presence of C1C2BMUNC2C and 100 μM EGTA or 500 μM Ca2+; (E) plain vesicles containing no PS alone or in the presence of C1C2BMUNC2C and 100 μM EGTA or 500 μM Ca2+, or a 1:1 mixture of plain vesicles and T-vesicles in the presence of C1C2BMUNC2C and 100 μM EGTA; (G) V-vesicles alone, T-vesicles alone, or 1:1 mixtures of V- and T-vesicles in the presence of C1C2BMUNC2C and 100 μM EGTA or 500 μM Ca2+. (B,D,F,H) Bar diagrams showing the particle size distribution in samples containing: (B) V-vesicles in the presence of C1C2BMUNC2C and 100 μM EGTA; (D) T-vesicles alone or in the presence of C1C2BMUNC2C and 100 μM EGTA; (F) a 1:1 mixture of plain vesicles and T-vesicles in the presence of C1C2BMUNC2C and 100 μM EGTA; (H) a 1:1 mixture of V- and T-vesicles in the presence of C1C2BMUNC2C and 100 μM EGTA. These bar diagrams correspond to the autocorrelation curves of selected samples among those shown in (A,C,E,G) and are intended to illustrate that mixtures of clustered and non-clustered vesicles can be readily distinguished (F), and that Ca2+-free C1C2BMUNC2C does not cluster isolated V-vesicles (B) but bridges V- to T-vesicles (H).
Figure 6—figure supplement 1
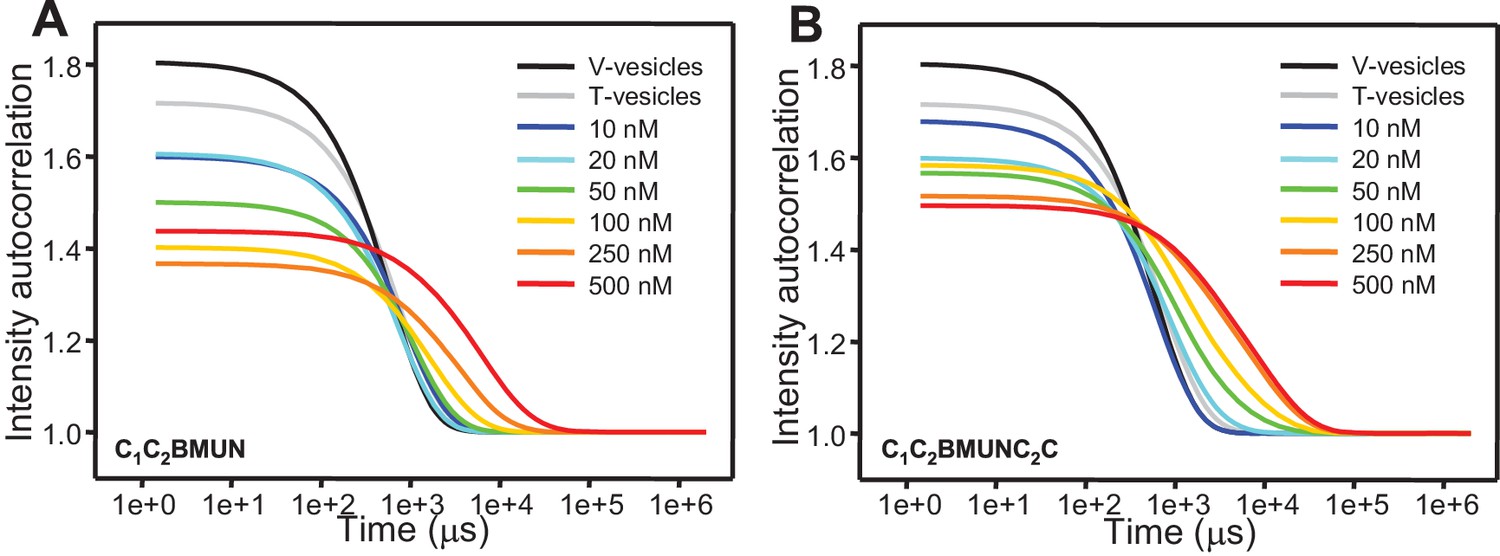
Concentration dependence of the liposome clustering activity of Munc13-1 C1C2BMUN and C1C2BMUNC2C.
The diagrams show intensity autocorrelation curves measured by DLS after 3 min incubations at 30°C for mixtures of V- and T-liposomes at the same concentrations used for lipid and content mixing assays (0.125 and 0.25 mM lipids, respectively) in the presence of 0.1 mM EGTA and different concentrations of C1C2BMUN (A) or C1C2BMUNC2C (B).
Figure 6—figure supplement 2
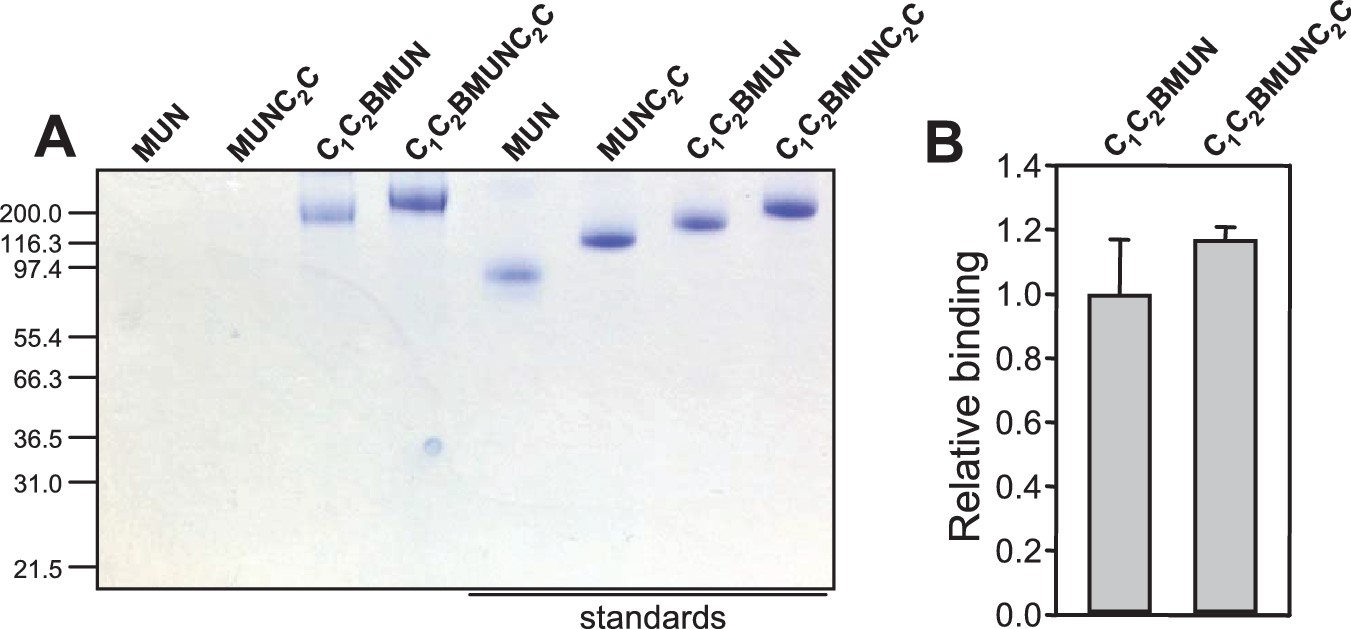
Lipid binding to distinct Munc13-1 fragments monitored by liposome co-floatation assays.
(A) Analysis of Munc13-1 fragments that co-float with liposomes by SDS-PAGE and coomassie blue staining. The four lanes on the left correspond to the co-floatation assays. The four lanes on the right show loading controls (1 μg of protein) for quantification. (B) Relative binding of Munc13-1 C1C2BMUNC2C with respect to C1C2BMUN measured by co-floatation experiments. Band intensities were quantified with ImageJ and normalized with the corresponding control. The calculated values were further normalized with the average value obtained for C1C2BMUN. The diagram shows averages and standard deviations from triplicate experiments.
Figure 6—figure supplement 3
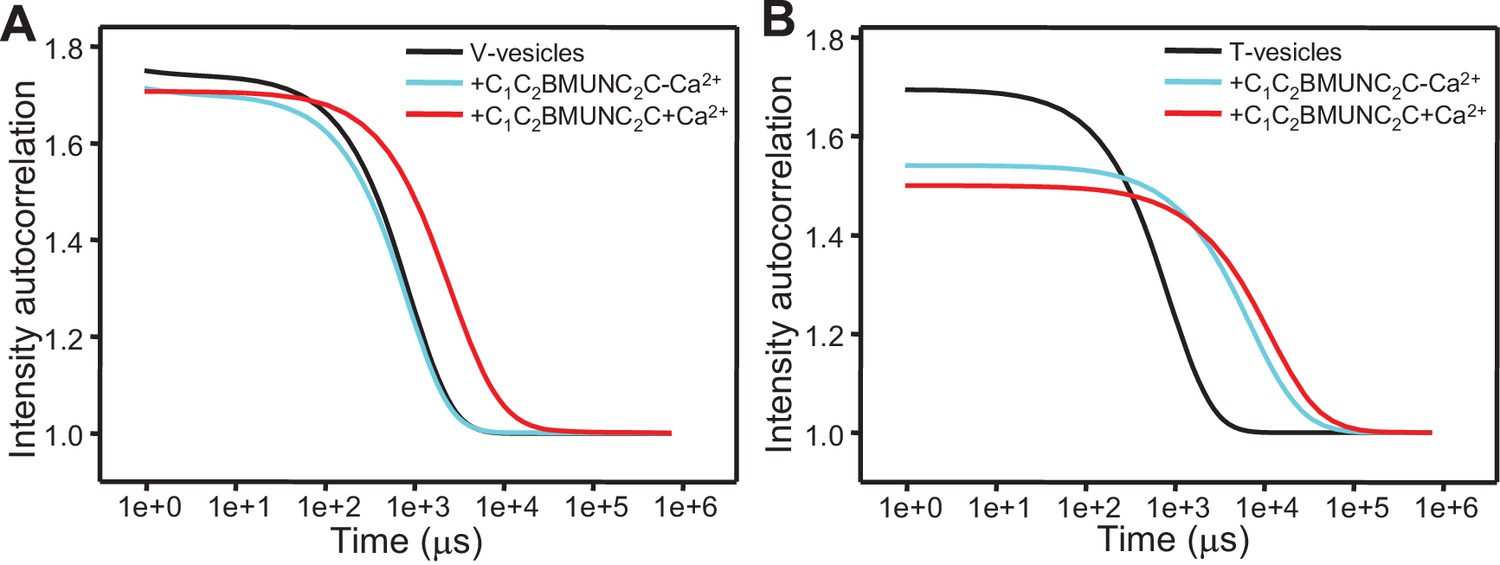
Ca2+-free C1C2BMUNC2C does not cluster V-liposomes.
(A,B) Intensity autocorrelation curves measured by DLS after 3 min incubations at 30°C on samples containing: (A) V-vesicles alone or in the presence of C1C2BMUNC2C and 100 μM EGTA or 500 μM Ca2+; (B) T-vesicles alone or in the presence of C1C2BMUNC2C and 100 μM EGTA or 500 μM Ca2+.
Figure 6—figure supplement 4
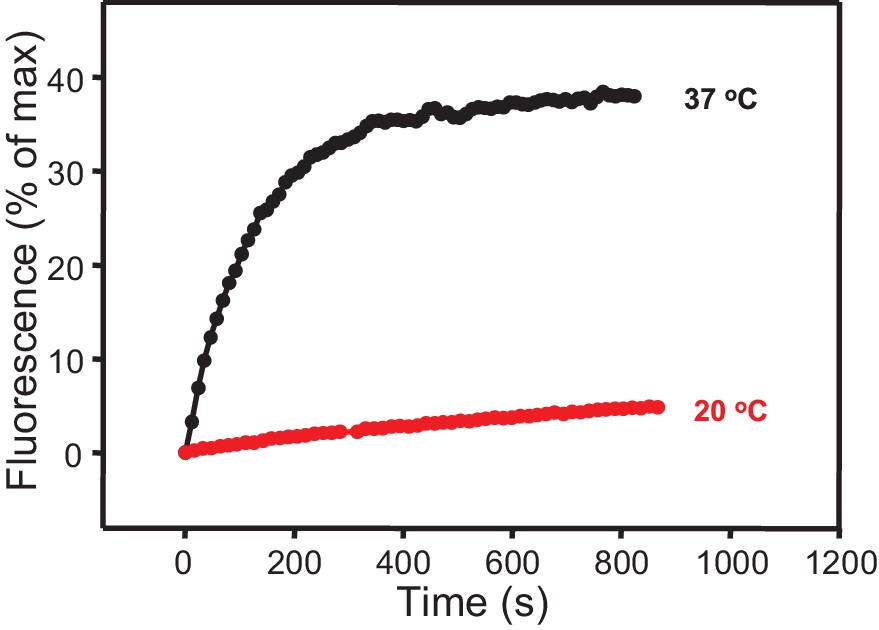
Minimal stimulation of lipid mixing between V- and T-liposomes in the presence of C1C2BMUNC2C at 20°C.
Lipid mixing assays between V- and T-liposomes in the presence of C1C2BMUN and 100 μM EGTA were performed as in Figure 1 at 20 or 37°C without addition of Ca2+.
Figure 7 with 1 supplement
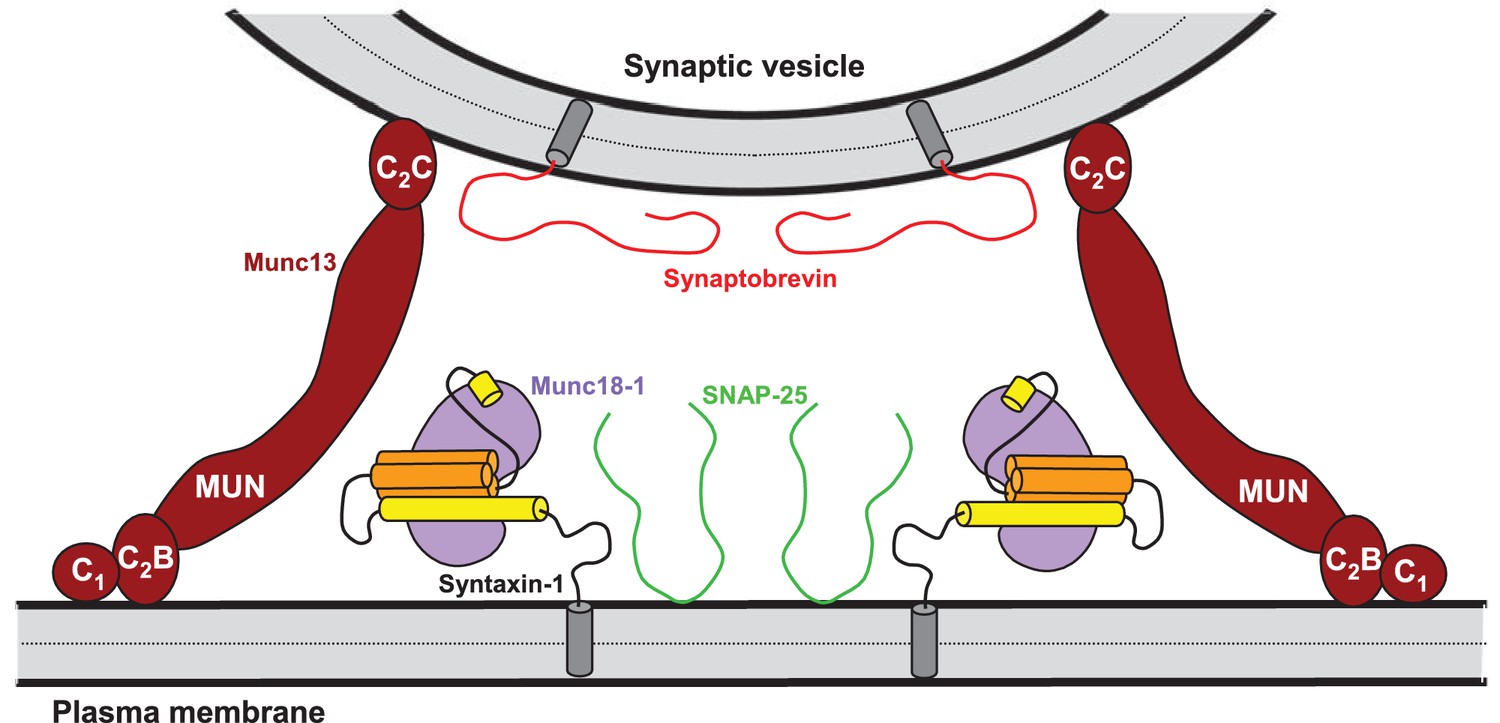
Model of how bridging of synaptic vesicles to the plasma membrane by the highly conserved C-terminal region of Munc13s can create a cage-like environment and facilitate the activity of the MUN domain in promoting the transition from the syntaxin-1-Munc18-1 complex to the SNARE complex, thus favoring SNARE complex assembly.
Syntaxin-1 (Habc domain, orange; SNARE motif and N-terminus, yellow) is shown in a closed conformation bound to Munc18-1 (purple). Synaptobrevin is shown in red, SNAP-25 in green and the C-terminal region of Munc13-1 in brown. The model is inspired by the ability of C1C2BMUNC2C to bridge V- to T-liposomes (Figure 6) and assumes that the C1-C2B region binds to the plasma membrane while the C2C domain binds to the vesicle membrane. See text and the legend of Figure 7—figure supplement 1 for additional details.
Figure 7—figure supplement 1
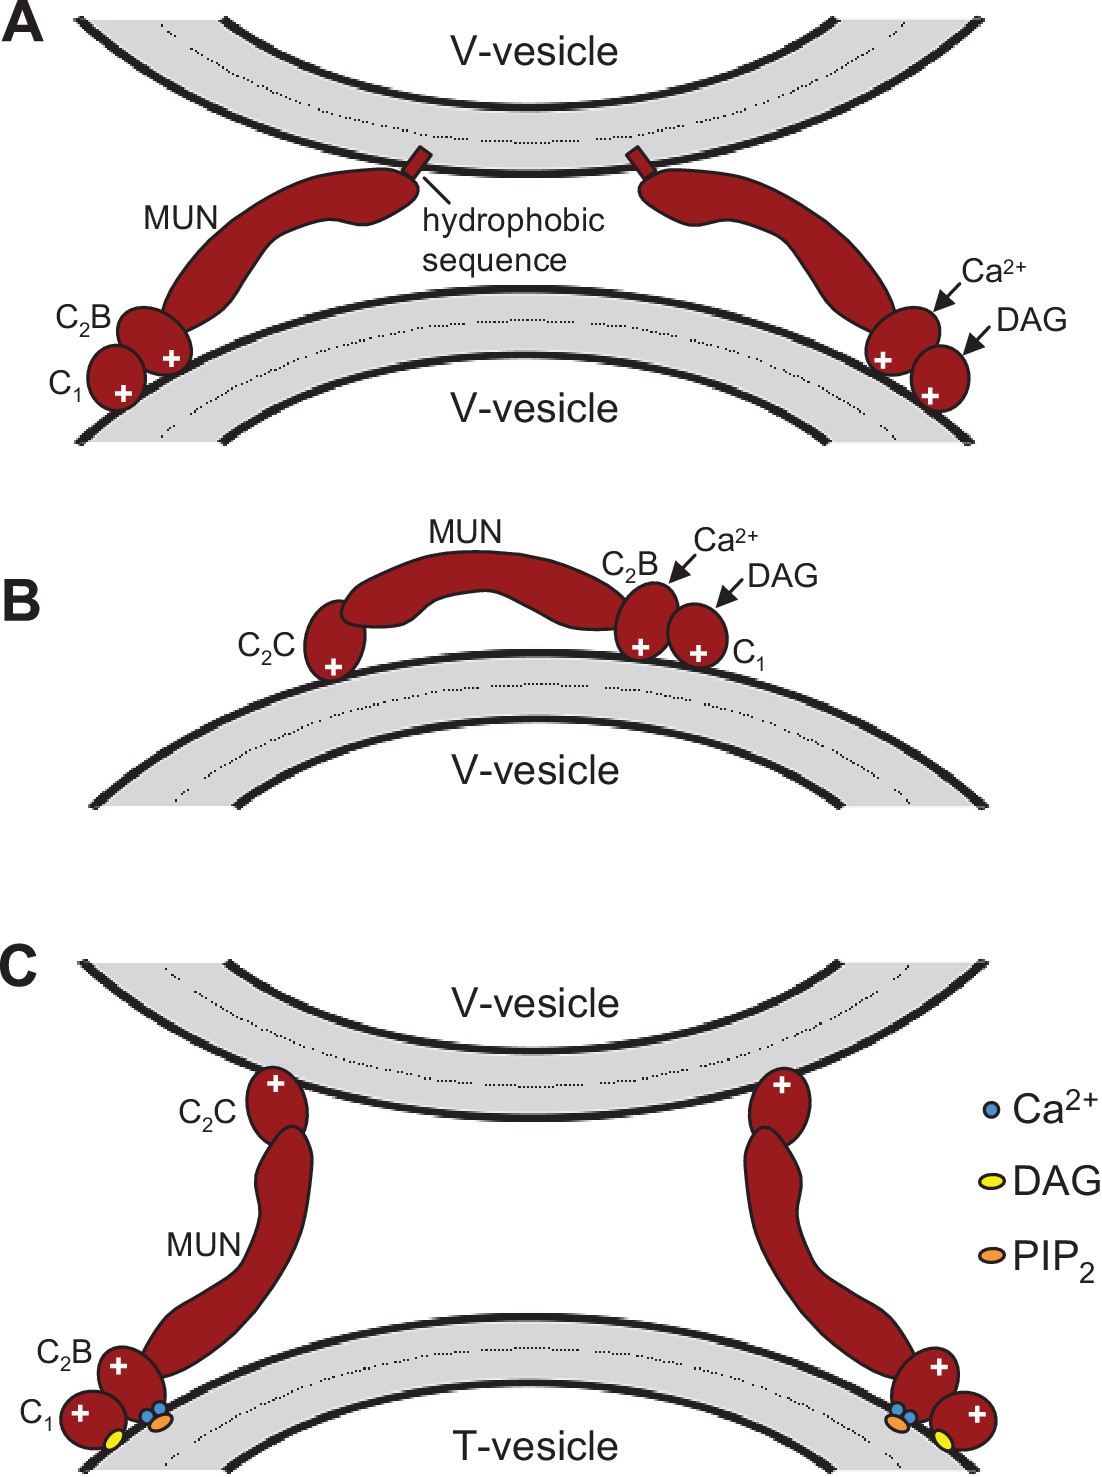
Speculative models of membrane bridging by C1C2BMUN and C1C2BMUNC2C.
These models serve in part as a basis for the model proposed in Figure 7 and provide a rationalization for the liposomes clustering activities observed for C1C2BMUN and C1C2BMUNC2C. However, it is important to note that there are multiple potential explanations for these activities. The findings that PS is a major determinant of vesicle clustering by C1C2BMUN (Figure 2) without requiring Ca2+ (Figure 2—figure supplement 1), but C1C2BMUNC2C requires Ca2+ to cluster V-liposomes (Figure 6A,B), suggest that there are multiple membrane binding sites in these large protein fragments that can cooperate in cis to interact with a single membrane or in trans to bind to two membranes. Indeed, the MUN, C1 and C2B domains contain several positive patches, the C1 domain binds to DAG, and the C2B domain binds to PIP2 weakly in the absence of Ca2+ and more strongly in the presence of Ca2+ (Shen et al., 2005; Shin et al., 2010; Yang et al., 2015). The C2C domain is likely to have at least one lipid-binding site with moderate affinity that explains the stronger overall liposome clustering activity of C1C2BMUNC2C compared to C1C2BMUN (Figure 6—figure supplement 1) (see discussion). Moreover, the sequence spanning residues 1517–1531 at the C-terminus of C1C2BMUN does not form part of the MUN domain structure (Yang et al. 2015) and contains a highly hydrophobic sequence that could bind to membranes, but this sequence may become structured due to the presence of the C2C domain in C1C2BMUNC2C, which could render it unable to bind membranes. We speculate that this hydrophobic sequence together with positive patches in the C1-C2B region underlie the liposome clustering activity of Ca2+-free C1C2BMUN (A), while in C1C2BMUNC2C the C2C domain provides a PS-binding site that cooperates with the C1-C2B region to favor binding in cis to the same membrane (B). Ca2+ binding to the C2B domain may favor membrane binding of C1C2BMUNC2C in a different orientation that facilitates interaction of the C2C domain in trans with another membrane, which would explain why Ca2+-bound C1C2BMUNC2C can bridge V-liposomes; this orientation could also be favored by binding of the C2B domain to PIP2 and of the C1 domain to DAG in T-liposomes (C), leading to the overall notion that the C1-C2B region binds to the plasma membrane and the C2C domain to synaptic vesicle membrane (Figure 7). Extensive studies will be required to test this and other plausible models compatible with the liposome clustering data.
Figure 8
Ca2+-independent membrane fusion between Syt1-containing V-liposomes and T-liposomes becomes Ca2+-dependent in the presence of Munc18-1, Munc13-1 C1C2BMUN and NSF-αSNAP.
Lipid mixing (A,C) between V-liposomes containing Syt1 (VSyt1) and T-liposomes was measured from the fluorescence de-quenching of Marina Blue-labeled lipids and content mixing (B,D) was monitored from the development of FRET between PhycoE-Biotin trapped in the T-liposomes and Cy5-Streptavidin trapped in the V-liposomes. The assays were performed in the presence of different combinations of Munc18-1 (M18), Munc13-1 C1C2BMUN and NSF-αSNAP as indicated. Experiments were started in the presence of 100 μM EGTA and 5 μM streptavidin, and Ca2+ (600 μM) was added after 300 s.
Figure 9 with 3 supplements
Fast, Ca2+-dependent membrane fusion between VSyt1- and T-liposomes in the presence of Munc18-1, Munc13-1 C1C2BMUNC2C and NSF-αSNAP, which depends on Ca2+ binding to the Munc13-1 C2B domain.
Lipid mixing (A,C,E) between V-liposomes containing Syt1 (VSyt1) and T-liposomes was measured from the fluorescence de-quenching of Marina Blue-labeled lipids and content mixing (B,D,F) was monitored from the development of FRET between PhycoE-Biotin trapped in the T-liposomes and Cy5-Streptavidin trapped in the V-liposomes. In (A,B), the assays were performed in the presence of Munc18-1, NSF-αSNAP and distinct Munc13-1 fragments as indicated. In (C,D), experiments were performed in the presence of NSF-αSNAP with or without addition of Munc18-1 and/or Munc13-1 C1C2BMUNC2C. In (E,F), assays were performed in the presence of Munc18-1, NSF-αSNAP and WT or D705N,D711N mutant Munc13-1 C1C2BMUNC2C. All experiments were started in the presence of 100 μM EGTA and 5 μM streptavidin, and Ca2+ (600 μM) was added after 300 s.
Figure 9—figure supplement 1
Quantification of lipid and content mixing experiments of Figure 9A,B.
Panels (A–B) correspond to panels (A–B) of Figure 9, respectively. Bars represent averages of the normalized fluorescence observed after 500 s (200 s after Ca2+ addition) in experiments performed at least in triplicate. Error bars represent standard deviations.
Figure 9—figure supplement 2
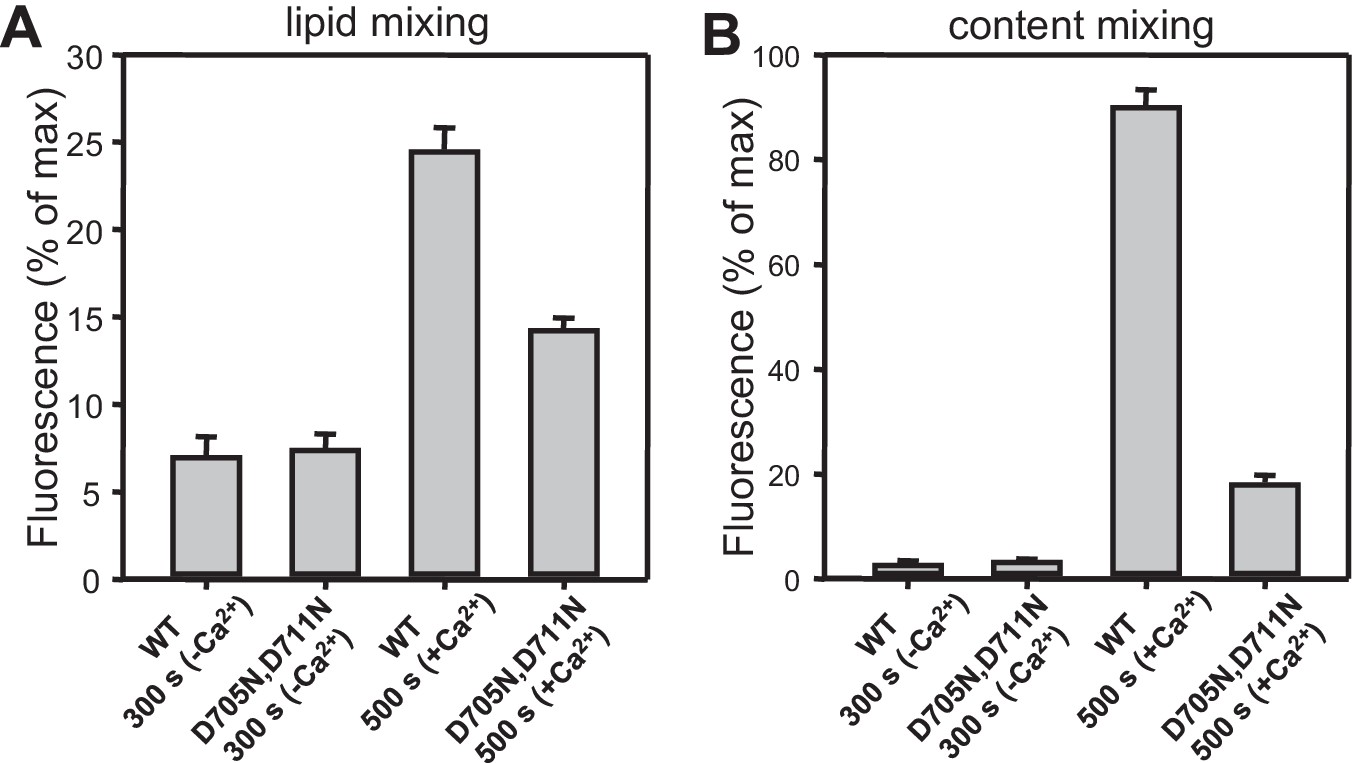
Quantification of lipid and content mixing experiments of Figure 9E,F.
Panels (A–B) correspond to panels (E–F) of Figure 9, respectively. Bars represent averages of the normalized fluorescence observed after 300 s (before Ca2+ addition) and 500 s (i.e. 200 s after Ca2+ addition) in experiments performed at least in triplicate. Error bars represent standard deviations.
Figure 9—figure supplement 3
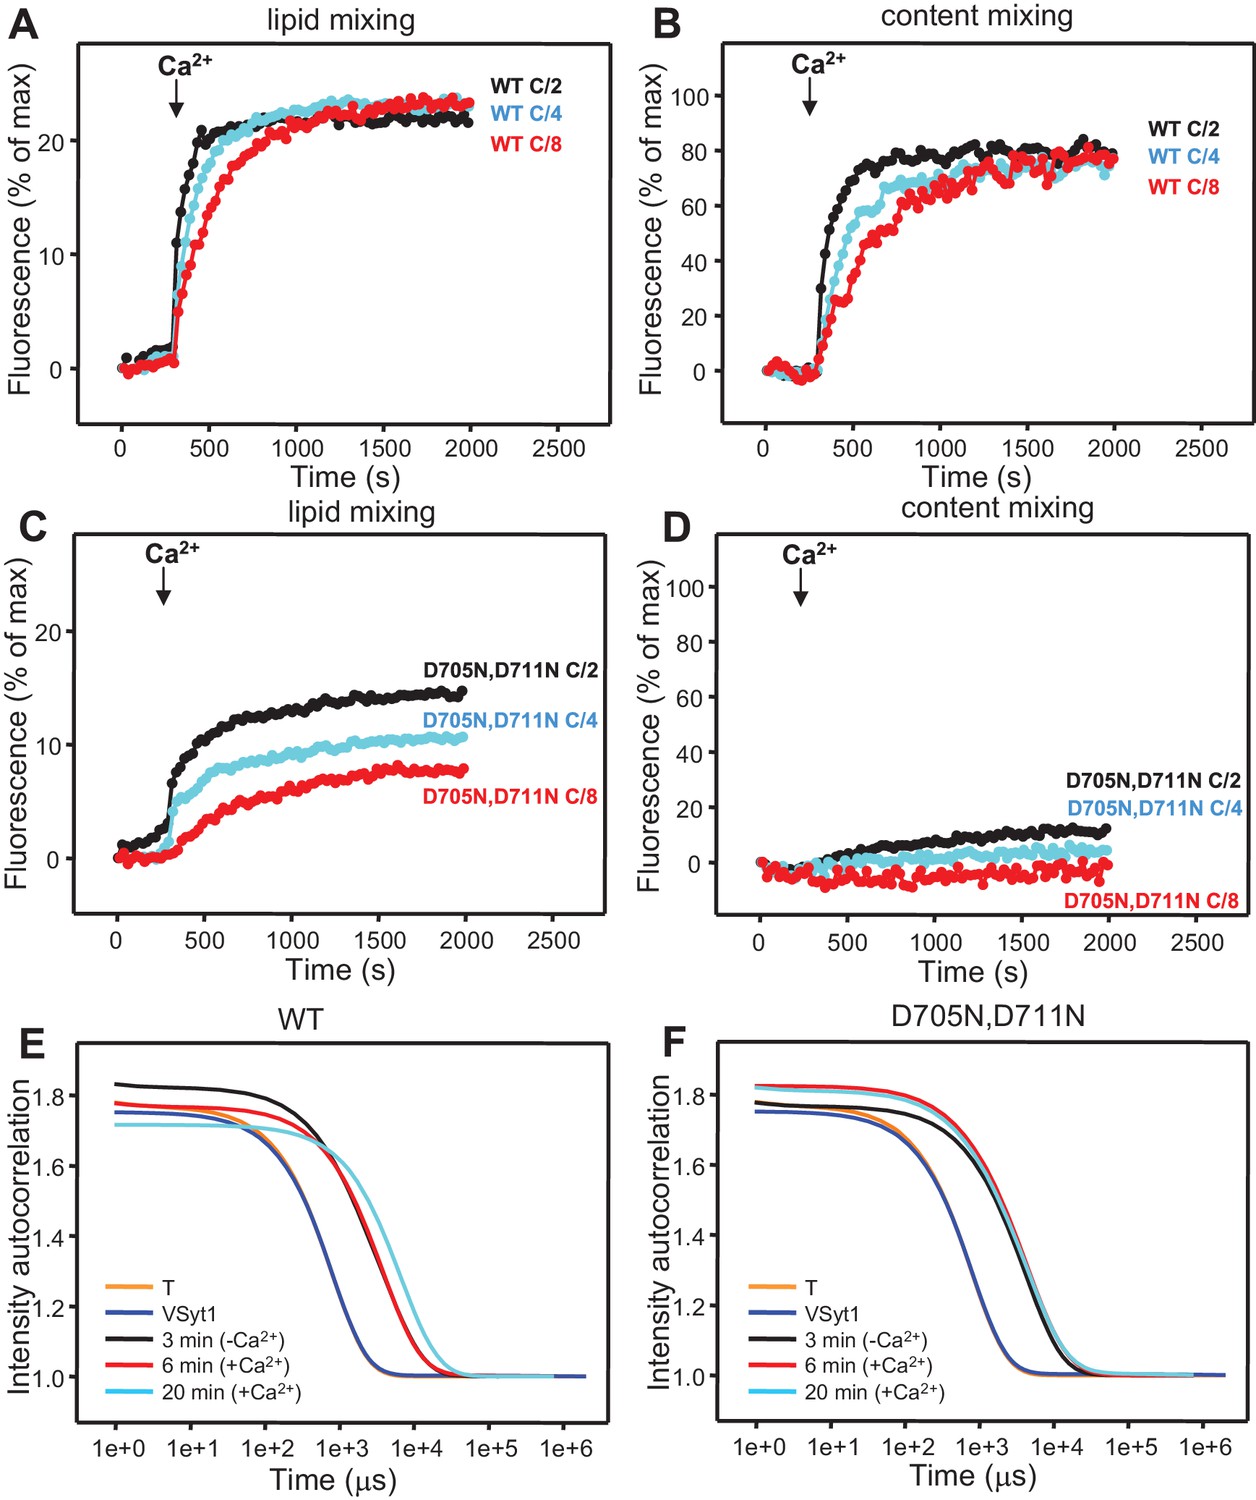
Analysis of particle size during fusion assays between VSyt1- and T-liposomes in the presence of Munc18-1, NSF-αSNAP and Munc13-1 C1C2BMUNC2C.
(A–D) Lipid mixing (A,C) between V- and T-liposomes was measured from the fluorescence de-quenching of Marina Blue-labeled lipids and content mixing (B,D) was monitored from the development of FRET between PhycoE-Biotin trapped in the T-liposomes and Cy5-Streptavidin trapped in the VSyt1-liposomes. The assays were performed in the presence of Munc18-1, NSF-αSNAP and WT (A,B) or D705N,D711N mutant (C,D) C1C2BMUNC2C as in Figure 9E,F but with all protein and liposome concentrations divided by 2, 4 or 8 (C/2, C/4 or C/8, respectively). Experiments were started in the presence of 100 μM EGTA and 5 μM streptavidin, and Ca2+ (600 μM) was added after 300 s. (E,F) Intensity autocorrelation curves measured by DLS for isolated VSyt1- or T-liposomes, or at different time points as indicated in fusion assays performed as in panels (A–D) with eight-fold dilution of all proteins and liposomes.
Figure 10 with 1 supplement
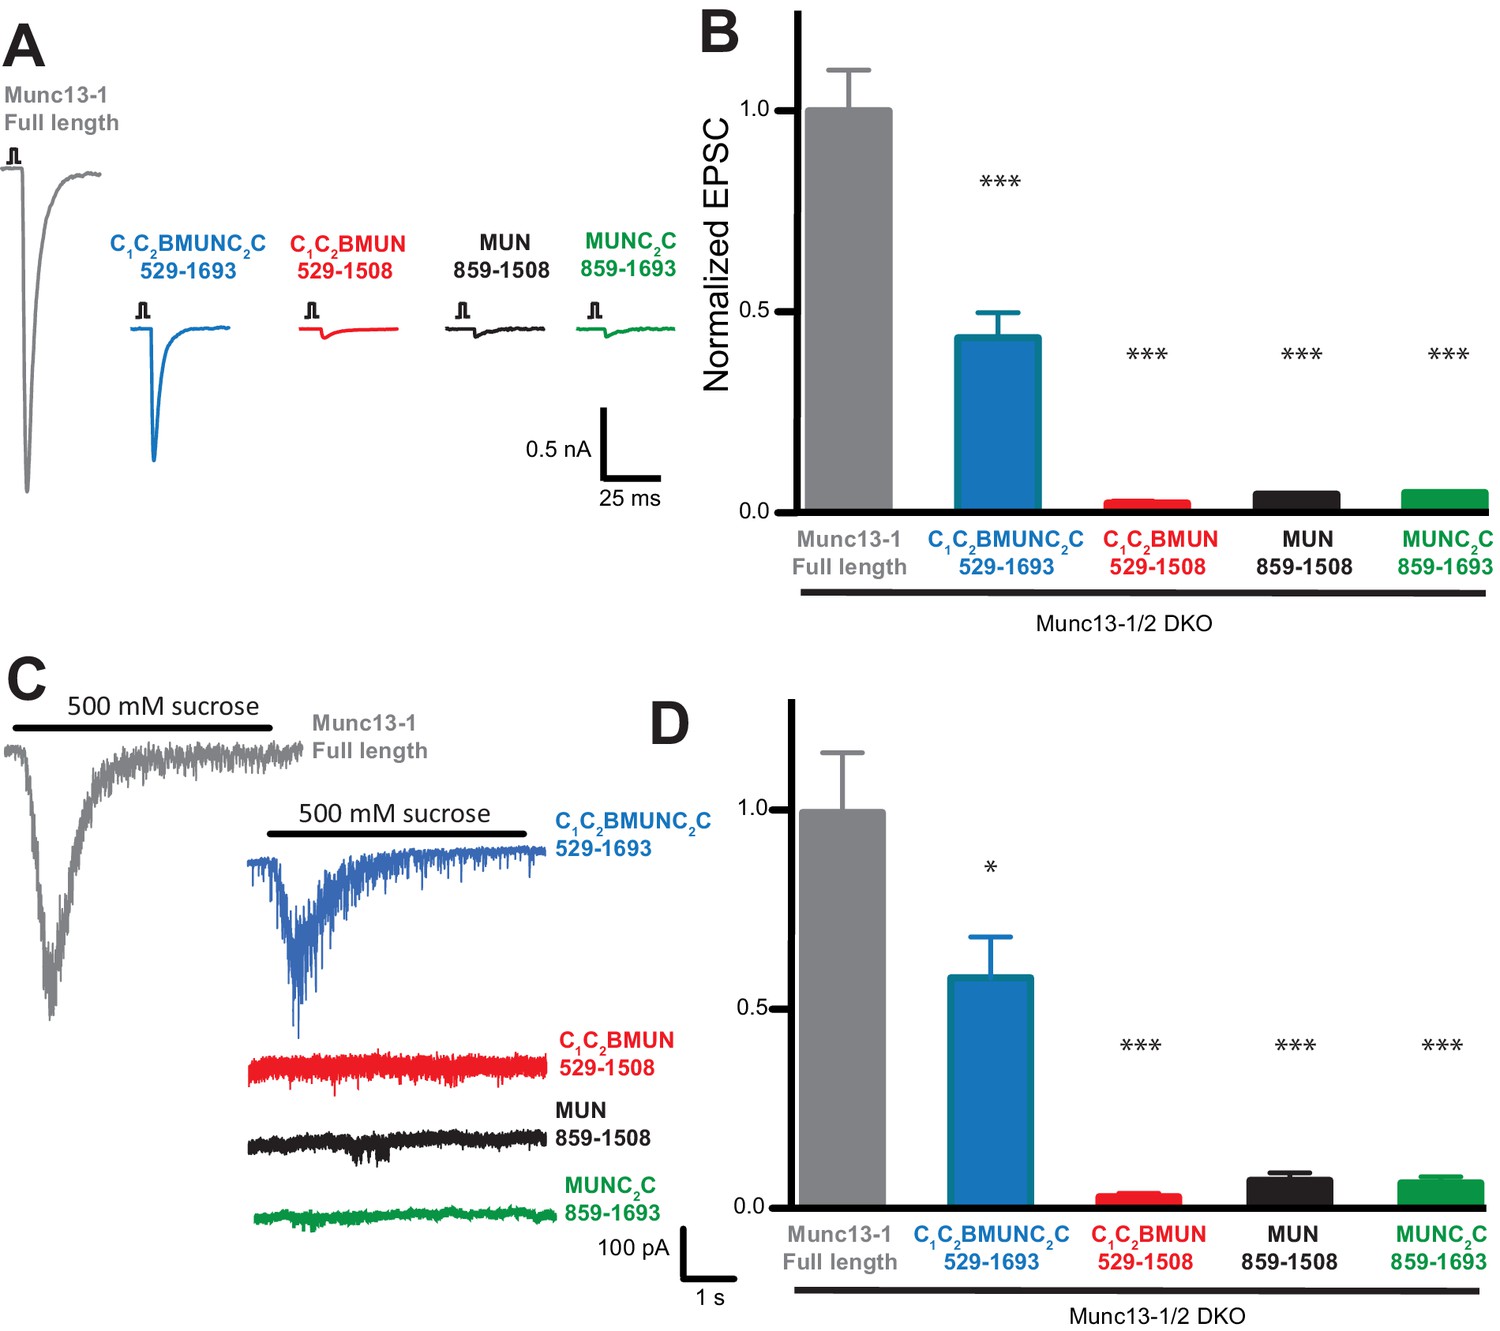
The Munc13-1 C1, C2B and C2C domains are critical for neurotransmitter release.
(A) Representatives traces of single AP-evoked EPSCs from Munc13-1/2 DKO hippocampal neurons rescued with Munc13-1 full length, or C-terminal Munc13-1 fragments, in response to 2 ms somatic depolarization. Depolarization artifacts and action potentials were blanked. (B) Normalized summary plot of EPSC peak amplitudes from Munc13-1/2 DKO hippocampal neurons rescued with Munc13-1 full length or C-terminal fragments. Data were collected during 4 consecutive days of recording. Data were normalized to the mean value of the control group (Munc13-1 full length). Error bars represent SEM. Normalized data were pooled from two independent cultures. Values that differ significantly from controls are indicated (*p<0.05; ***p<0.001) by Non parametric Kruskal-Wallis test with a post hoc Dunn's Multiple comparison test. (C) Representative traces of RRP sizes induced by 5 s hypertonic sucrose solution application, from Munc13-1/2 DKO hippocampal neurons rescued with Munc13-1 full length and C-terminal fragments. (D) Normalized summary plot of RRP charge. For the rescue experiments, approximately equal numbers of green positive Munc13-1/2 DKO neuron rescues with Munc13-1 full length or C-terminal fragments were collected the same day. But due to the fact that neurons that lacked both Munc13-1 and Munc13-2 proteins show no evoked excitatory postsynaptic currents (EPSCs), and no response with sucrose stimulation, EPSC and RRP that show no responses were not quantified in the plots. The following numbers of EPSC or RRP responses were observed out of the total green positive neurons for each condition: FL, 53/55; C1C2BMUNC2C, 45/54; C1C2BMUN, 6/50; MUN, 6/50; MUNC2C, 4/51. EPSC means ± SEM (nA) excluding 0: FL, 1.963 ± 0.2511; C1C2BMUNC2C, 0.83120 ± 0.1427; C1C2BMUN, 0.03298 ± 0.008110; MUN, 0.05984 ± 0.0009355; MUNC2C, 0.05892 ± 0.0009125. EPSC charge means ± SEM (pC) excluding 0: FL, 226.3 ± 42.04; C1C2BMUNC2C, 139.5 ± 23.90; C1C2BMUN, 5.090 ± 1.190; MUN, 1.847 ± 1.092; MUNC2C 8.259 ± 1.092.
Figure 10—figure supplement 1
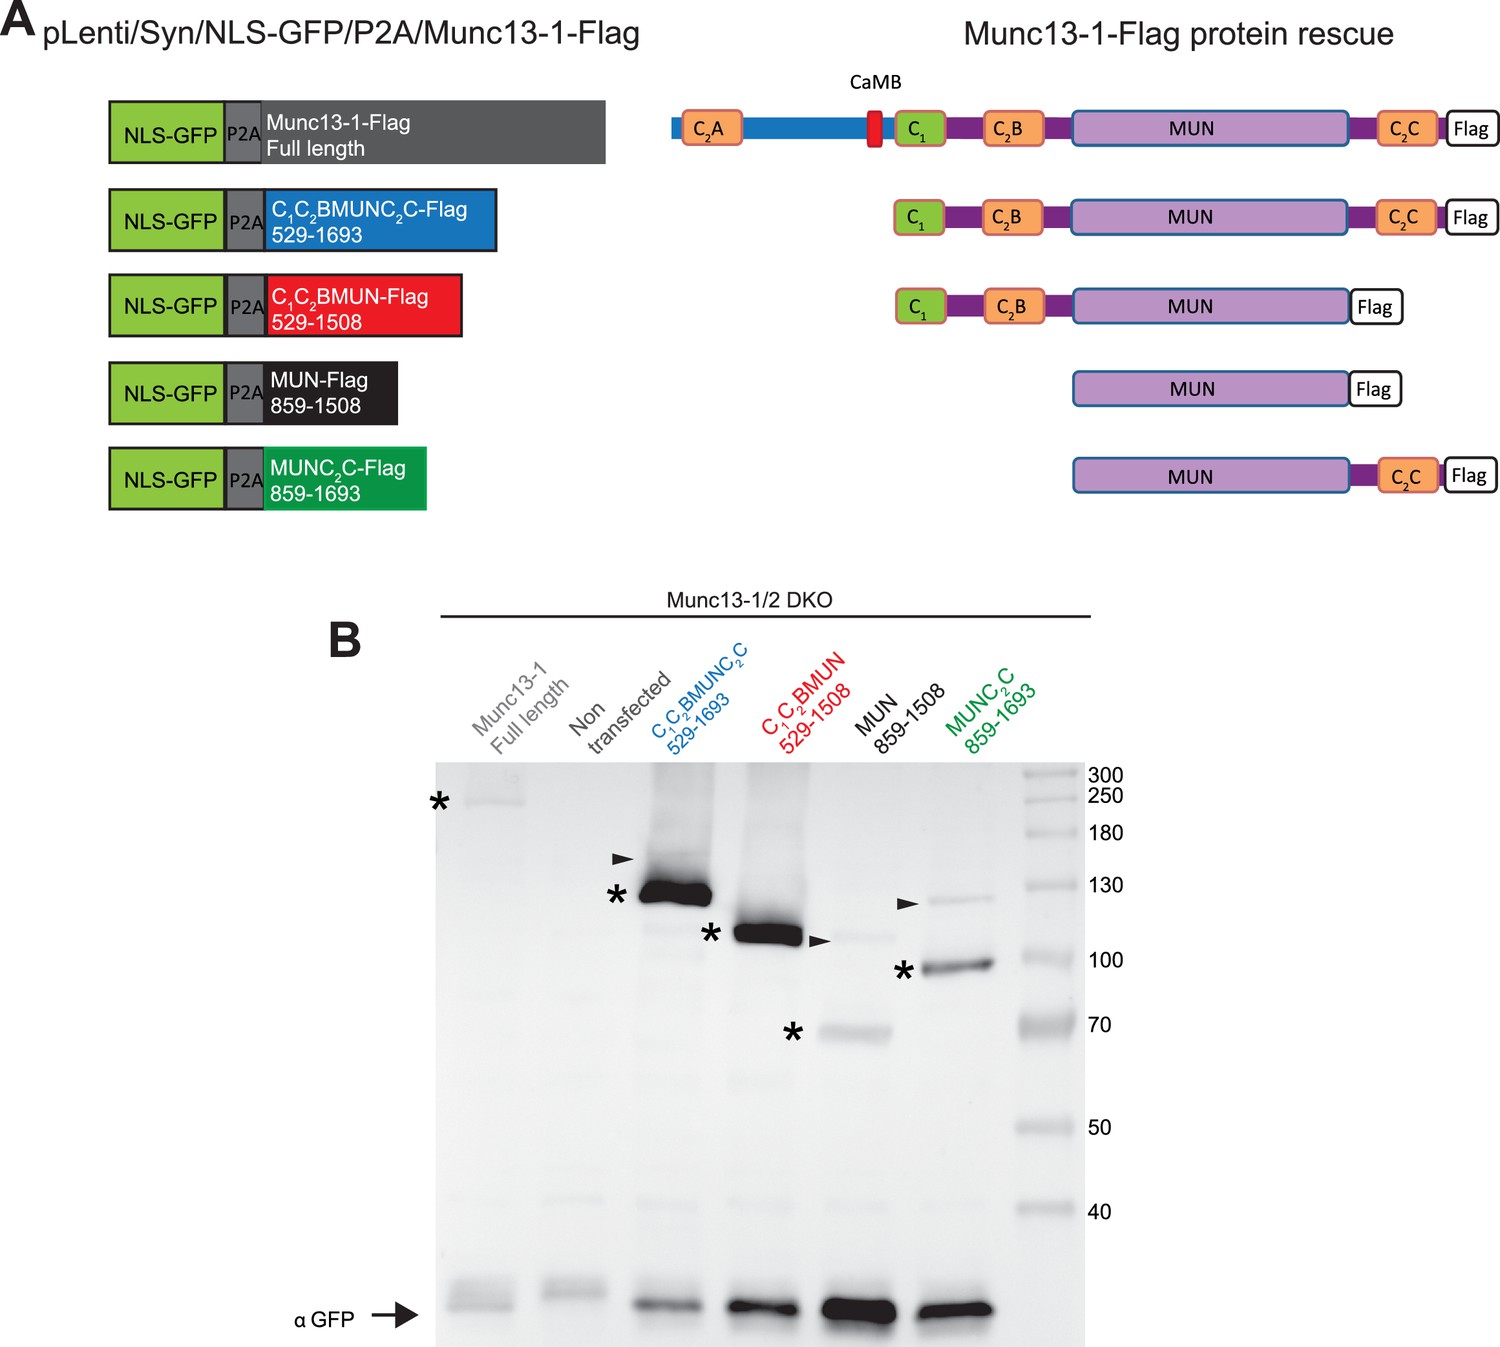
Protein expression from Munc13-1/2 DKO hippocampal mass cultures infected with Munc13-1-Flag and C-terminal-Flag tagged fragments.
(A) Diagrams illustrating the pLenti/Syn/NLS-GFP/P2A/Munc13-1-Flag constructs and the Munc13-1 fragments used. (B) Western blot. Lane 1 shows the expression of the two cleaved products expected from the NLS-GFP/P2A/Munc13-1-Flag after the 2A cleavage. A signal for anti-flag at 250kDa corresponds to the expected full length Munc13-1-flag, and the anti-GFP signal at around 30kDa indicates the second cleave product NLS-GFP. This indicates that the P2A fusion construct was cleaved successfully, producing the two translational products expected. Lane 2 shows the lack of expression of the protein Munc13-1-flag or NLS-GFP in untransfected Munc13-1/2 DKO neurons as a negative control. Lanes 3–6 show the protein expression of all Munc13-1 fragments used. All constructs tested presented bands for flag and GFP. In all lanes the band of molecular weights (→) 30 kDa corresponds to the translational products NLS-GFP protein after the 2A cleavage. Bands at 130, 115, 75 and 100 kDa corresponded to the cleavage products of C-terminal Flag tagged fragments (*). Little amounts of uncleaved products (→) were also found. Note that the GFP signal increases with the shortness of the construct introduced while the Flag signal exhibits a different pattern that may arise from differences in protein instability.
Download links
A two-part list of links to download the article, or parts of the article, in various formats.
Downloads (link to download the article as PDF)
Open citations (links to open the citations from this article in various online reference manager services)
Cite this article (links to download the citations from this article in formats compatible with various reference manager tools)
Functional synergy between the Munc13 C-terminal C1 and C2 domains
eLife 5:e13696.
https://doi.org/10.7554/eLife.13696


