Birth order dependent growth cone segregation determines synaptic layer identity in the Drosophila visual system
- University of Vienna, Austria
- Eunice Kennedy Shriver National Institute of Child Health and Human Development, United States
Figures
Figure 1 with 1 supplement
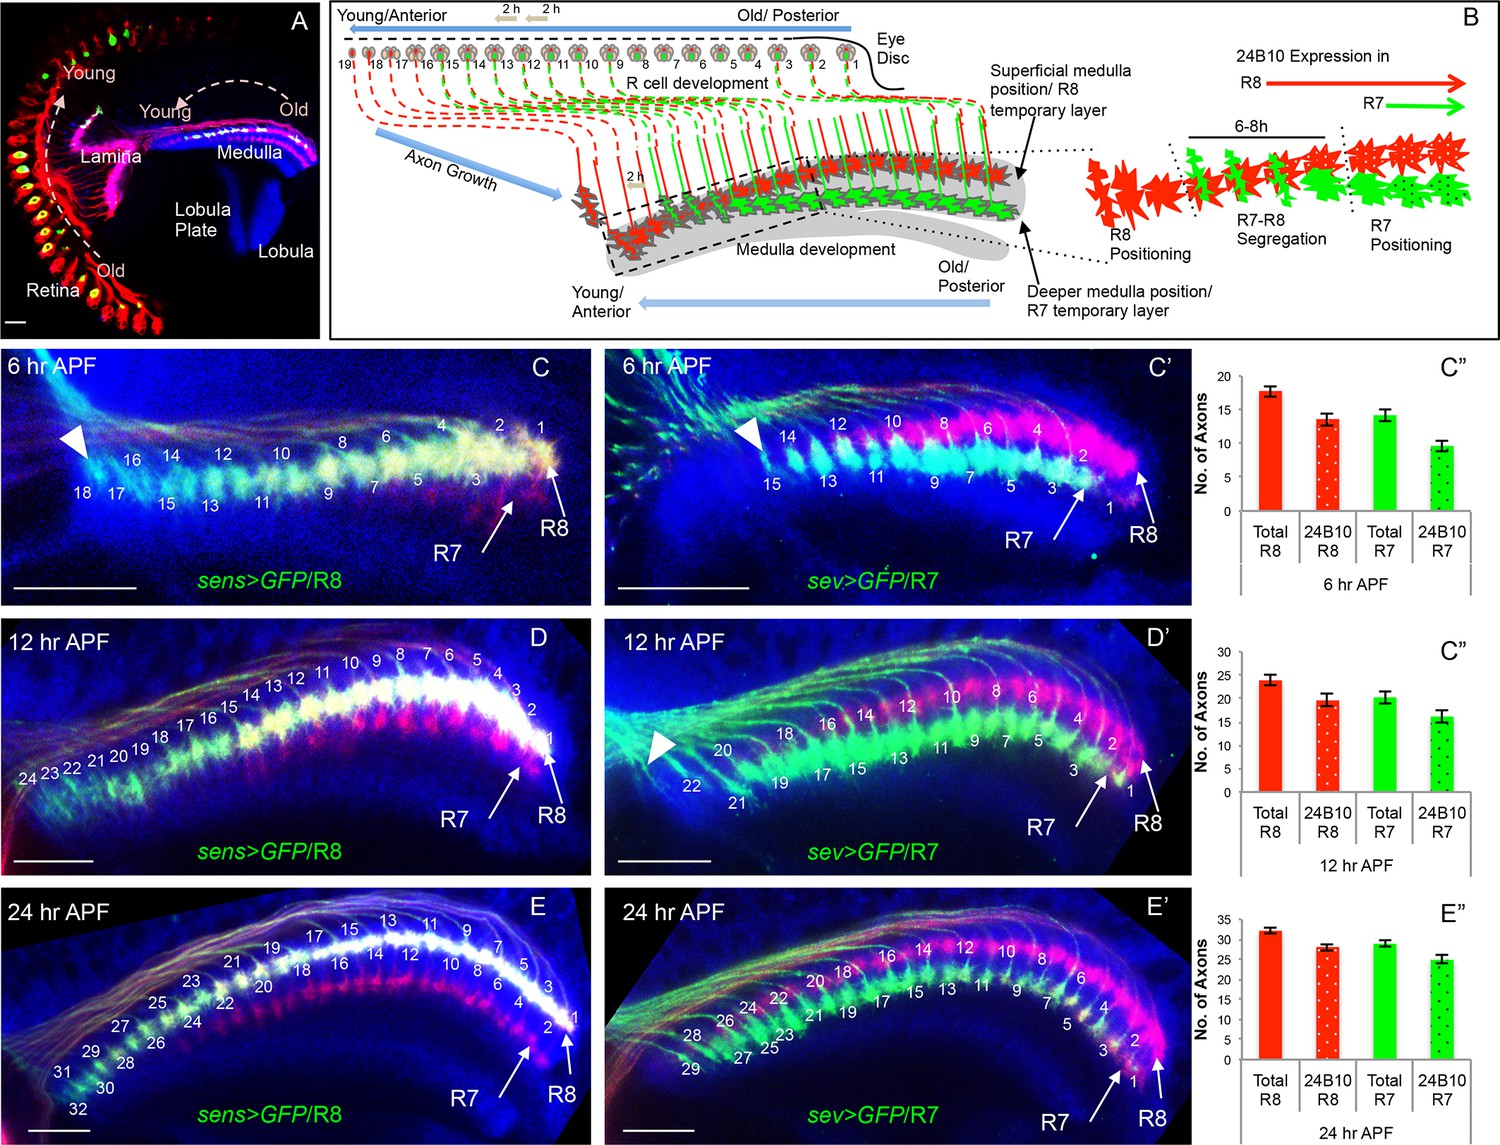
Initial positioning of R cell growth cones in the developing medulla target field.
(A) Overview of the developing Drosophila visual system at 24 hr APF. Arrows indicate the developmental gradient of photoreceptor differentiation in the retina and corresponding axonal targeting in the medulla neuropile. (B) Model of initial innervation of R cell axons and growth cone segregation in the medulla. C–E’’. R7/R8 axon innervation in the medulla target field at different developmental stages. (C, D, E) R8 growth cones labelled with UAS-mCD8-GFP expressed under sens-Gal4. C’, D’, E’. R7 growth cones labelled with UAS-mCD8-GFP expressed under sev-Gal4. C, C’. At 6 hr APF, 18 R8 (C arrowhead) and 15 R7 (C’ arrowhead) axons innervate the medulla. D, D’. At 12 hr APF, 24 R8 and 21 R7 axons innervate the medulla. In addition to 21 R7 axons that are already present in the medulla field, 22nd R7 axon can be seen entering at the anterior medulla (D’ arrowhead). E, E’. At 24 hr APF, 32 R8 and 29 R7 axons have innervated the medulla field. Scale bar shown in all images is 20μm. All photoreceptor axons are visualized using 24B10 antibody (Fujita et al., 1982 in red), R8 (in A, C, D, E) and R7 growth cones in (C’, D’, E’) are stained with anti-GFP antibody (in green) and medulla neuropile is stained using anti-N-Cadherin antibody (in Blue). C’’, D’’, E’’. Quantification of the sequential innervation of R7/R8 axons in the medulla field. Error bars indicate Standard Deviation.
-
Figure 1—source data 1
R cell innervation quantification.
The data shows quantification of total number of R8 and R7 axons innervating medulla neuropile at three different developmental stages (6/12/24 hr APF) and axons labelled by 24B10 staining at each stage. The analysis shows the number of R7 and R8 axons for each brain as well as the average numbers for each stage at the bottom.
- https://doi.org/10.7554/eLife.13715.004
-
Figure 1—source data 2
Sequoia expression quantification.
The file depicts the average Normalised Fluorescence Intensity (NFI) of Sequoia expression analysed using anti-Sequoia antibody. The average NFI for each row of R8 cells is shown. Average NFI for Sequoia expression in each row was calculated for 60 different 3rd instar eye discs and was normalised against background to avoid individual differences in staining of each disc. The number represents the ratio of NFI for each R8 cell in a row against the background staining in each disc. To minimize the effect of variations in the staining of individual discs following modifications were made to imaging and analysis protocol- The discs were imaged as a single slice so that complete nuclei of all R8 cells are captured simultaneously to avoid fluorescence decay between slices. The fluorescence of each R8 nucleus was normalised against the background signal of exactly the same area. Further, to get rid of variation between samples, ratio of average R8 fluorescence against average fluorescence of background of each disc was considered while quantifying the NFI of Sequoia expression for each row.
- https://doi.org/10.7554/eLife.13715.005
Figure 1—figure supplement 1
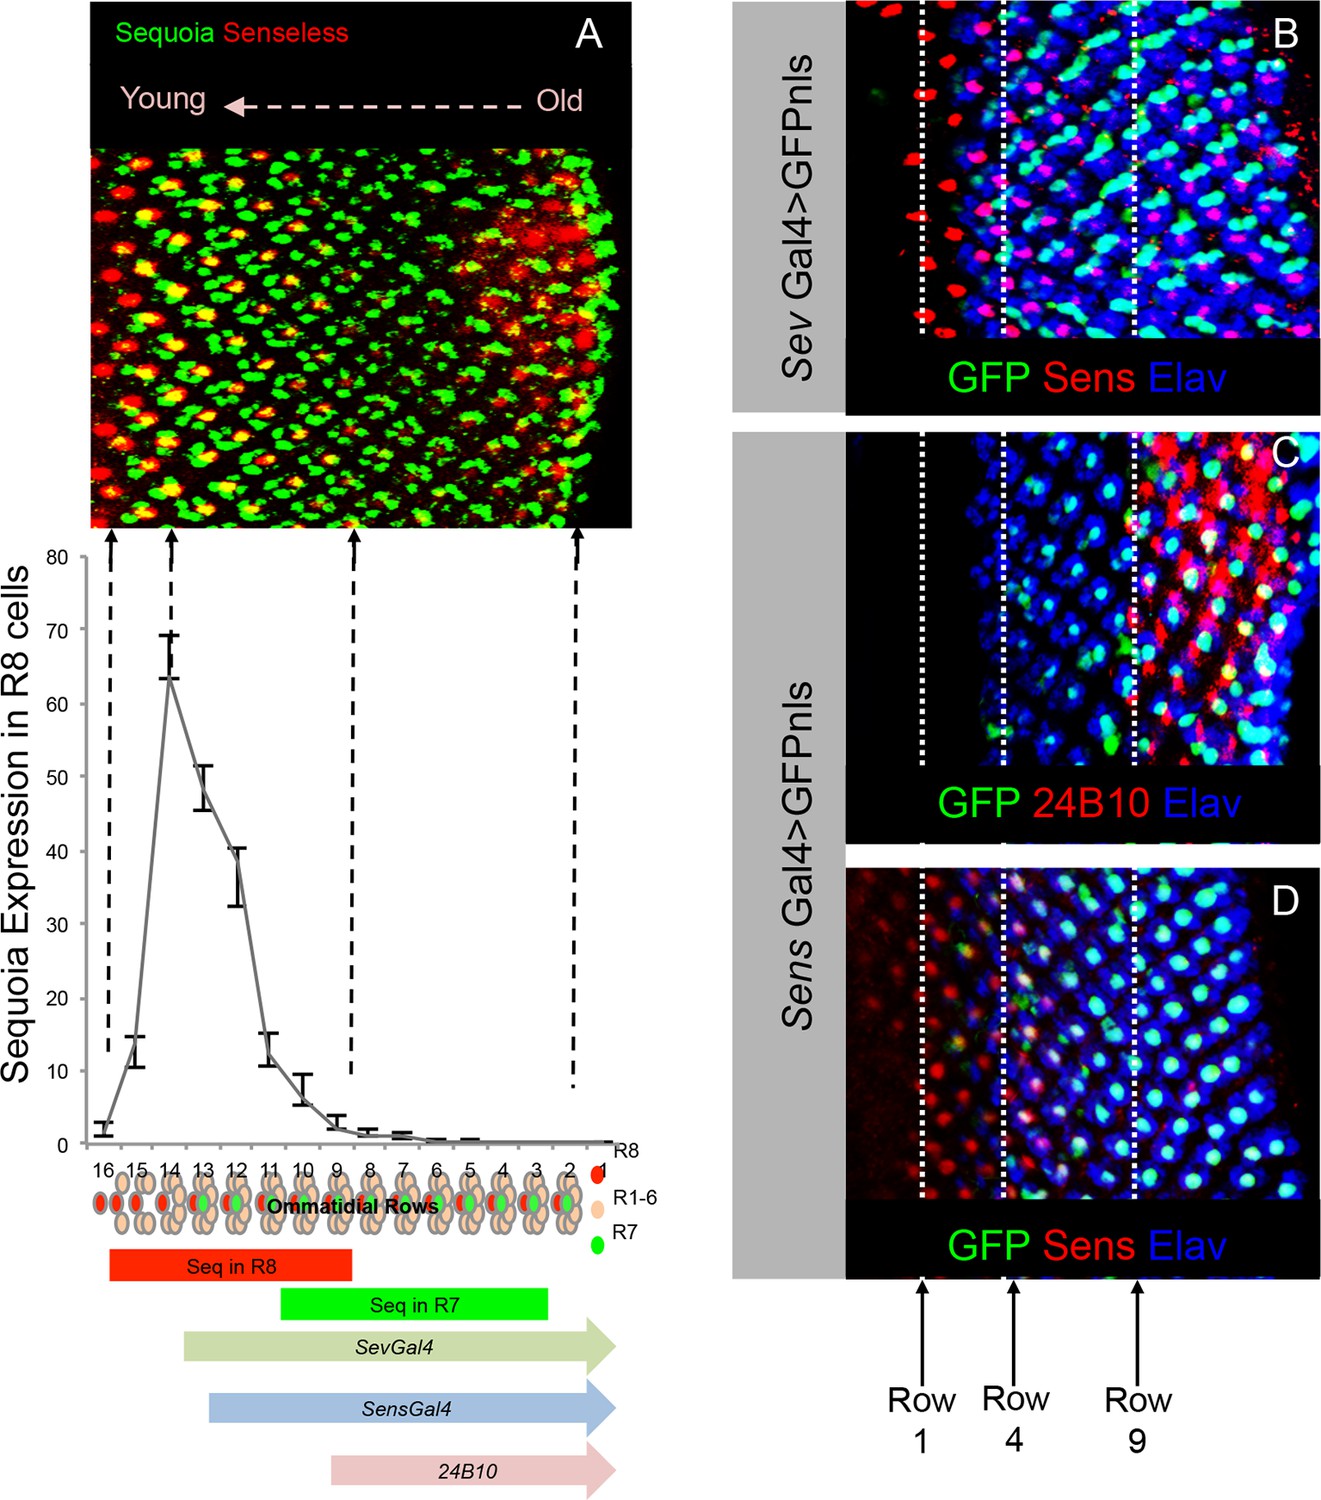
Onset of cell-type specific marker expression in the developing R cells.
(A) Quantification of Sequoia expression levels in the R8 cells. The graph shown normalized fluorescence intensity plotted against rows in the 3rd instar eye disc. The Sequoia expression timing in R8 and R7 cells in the 3rd instar eye disc is shown in comparison to the photoreceptor cell type marker expression. (B–D) Expression of R cell specific drivers in the 3rd instar eye disc. B. R7 labelling with GFP expression under sevenless-Gal4 compared to R8 differentiation determined by anti-Senseless antibody. GFP expression can be seen from 3rd ommatidial row onwards, which is one row prior to the R7 specification. This is likely due to the expression of sev-Gal4 in the R7 precursor cells. Specific labelling of cell types is indicated in the figure panel. (C) R8 labelling by senseless-Gal4 compared to Chaoptin expression in the 3rd instar eye disc. Chaoptin expression (visualized using 24B10 antibody) can be detected from 9th ommatidial row onwards. (D) GFP expression under senseless-Gal4 compared to R8 differentiation determined by anti-Senseless antibody. GFP expression can be seen from the 4th ommatidial row onwards suggesting a delay in the Gal4 driven expression of GFP as compared to Senseless protein expression, visible from 1st row onwards.
Figure 2 with 1 supplement
Sequoia mediates growth cone segregation of R cell axons in the medulla.
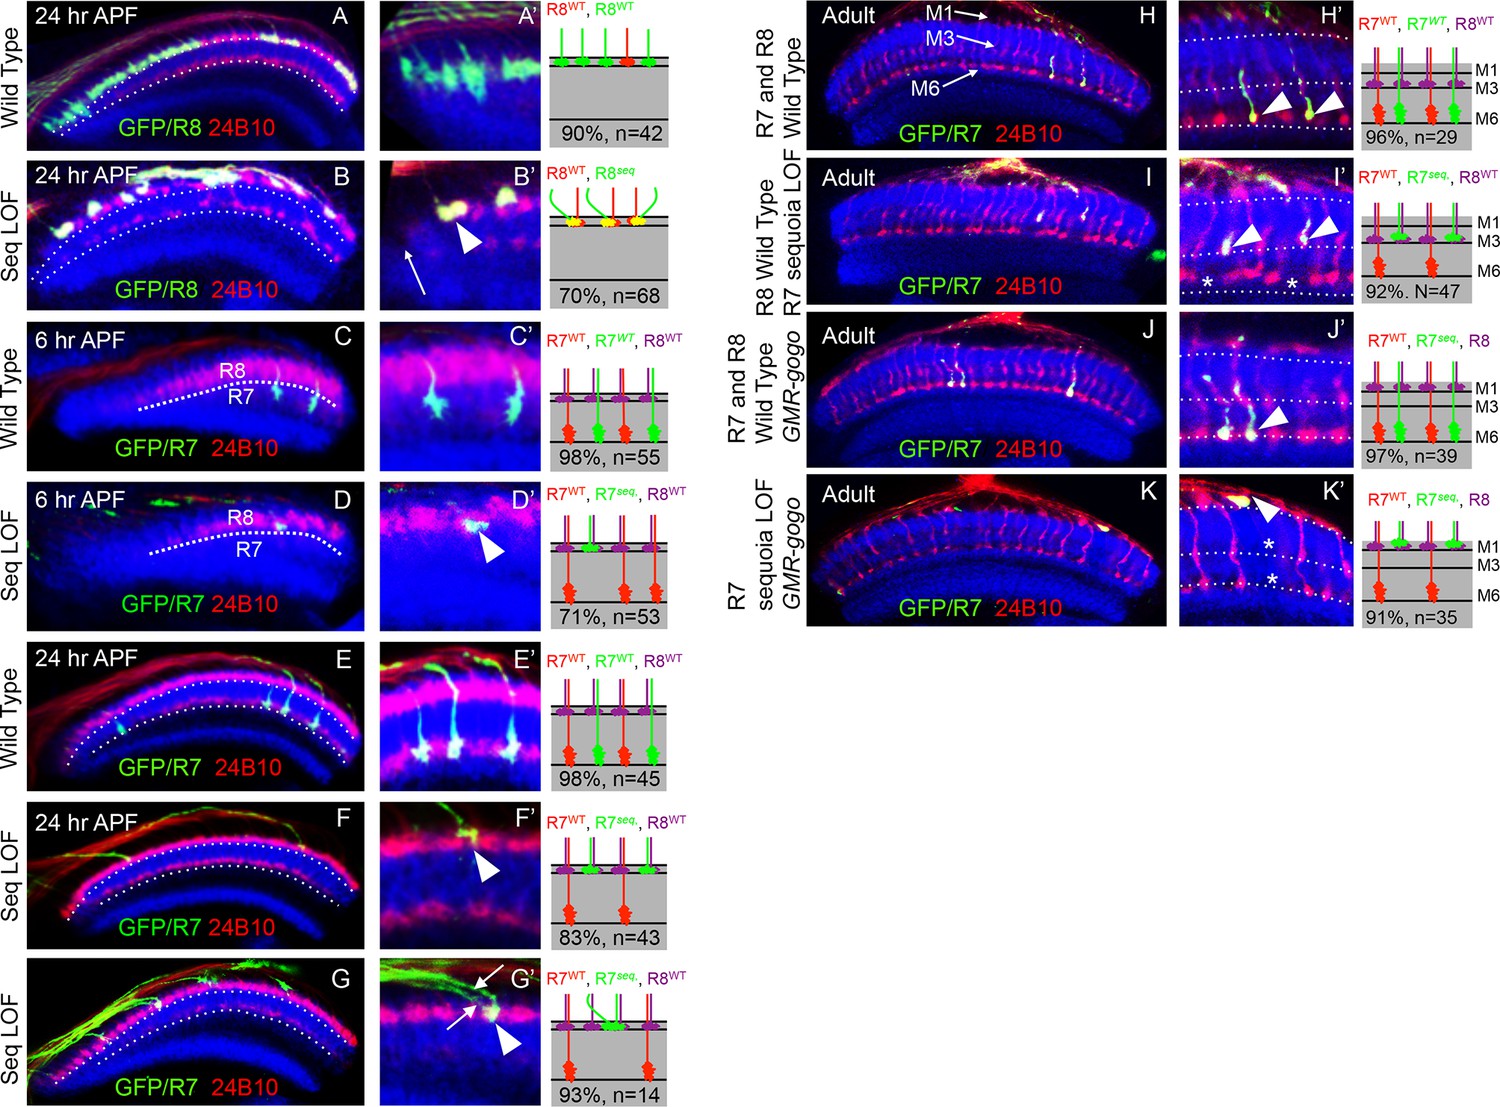
(A, A’) Wild type position of R8 growth cones as they arrive at the anterior region of the medulla (A’). (B, B’) sequoia mutant R8 growth cones converge upon arrival at the anterior medulla (B’ arrowhead) leaving gaps in their normal position (B’ arrow). (C, C’) Growth cones of wild type R7 cells segregate from R8 growth cones at 6 hr APF and are positioned immediately proximal to the R8 growth cones in respective columns. (D, D’) Growth cones of sequoia mutant R7 cells fail to segregate from R8 growth cones and are positioned with R8 growth cones at the superficial medulla position at 6 hr APF (D’ arrowhead). (E, E’) Wild type R7 growth cones reach their temporary target layer in the deeper medulla position at 24 hr APF. F, F’. sequoia mutant R7 growth cones fail to reach their temporary target layer and remain at the superficial medulla position with R8 growth cones at 24 hr APF (G’ arrowheads). (G, G’) Two neighbouring sequoia mutant R7 growth cones (G’ arrows) converge into a single column (G’ arrowhead) in the superficial medulla position. (H, H’) Wild type R7 axons target to medulla layer M6 and R8 axons target to layer M3 in the adults (H’ arrowhead). (I, I’) sequoia mutant R7 axons mis-target to M3, the target layer for R8 axons (I’ arrowhead) leaving layer M6 empty (I’ asterisk). (J, J’) Wild type R7 axons target to medulla layer M6 in the adult (J’ arrowhead) even when R8 axons are retained in layer M1 due to expression of Golden Goal (GMR-gogo). (K, K’) sequoia mutant R7 axons in presence of GMR-gogo mis-target to medulla layer M1 along with R8 axons (K’ arrowheads) leaving both layers M3 and M6 empty (K’ asterisks). Schematics in all panels illustrate growth cone positioning (A–G’) or axon targeting (H–K’) phenotypes and numbers indicate quantification of respective phenotype.
Figure 2—figure supplement 1
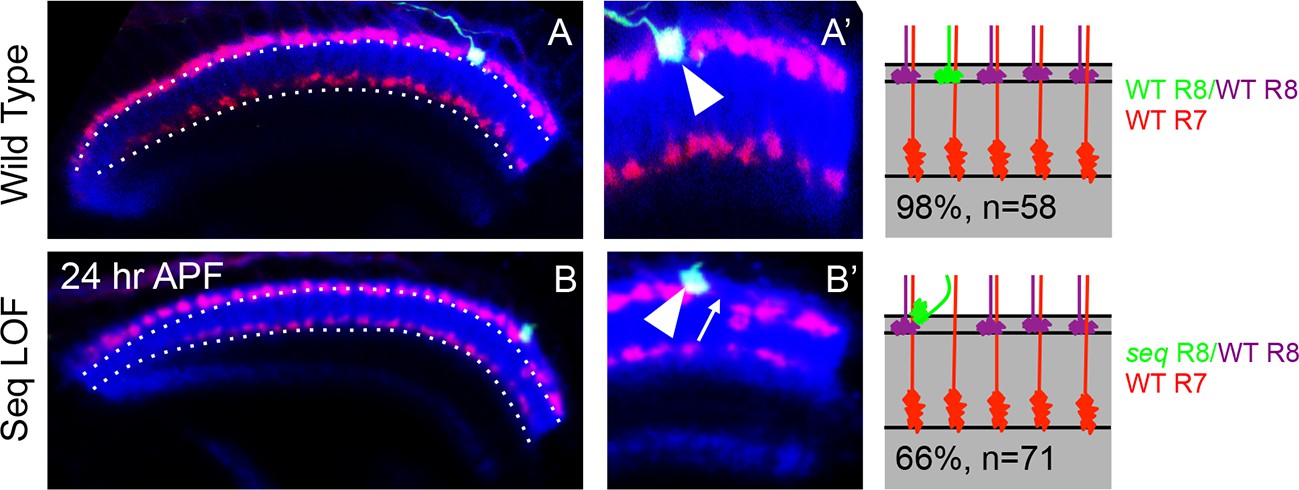
Cell-autonomous effects of Sequoia loss-of-function in R8 cells (A, A’) Wild type single R8 cell clones.
A' Shows a single R8 clone in the medulla. A’. Wild type R8 cell growth cone is positioned correctly in the superficial medulla position and is segregated from its wild type neighbour growth cones (A’ arrowhead). B–B’ Sequoia loss-of-function leads to cell-autonomous defects in single R8 cell clones. B. Shows a single sequoia mutant R8 cell generated in the medulla. B’. Shows defects in the segregation of sequoia mutant R8 cell which leaves its normal position, leaving a gap (B’ arrow) and converges onto the neighbouring wild type cell leading to non-segregation (B’ arrowhead).
Figure 3 with 1 supplement
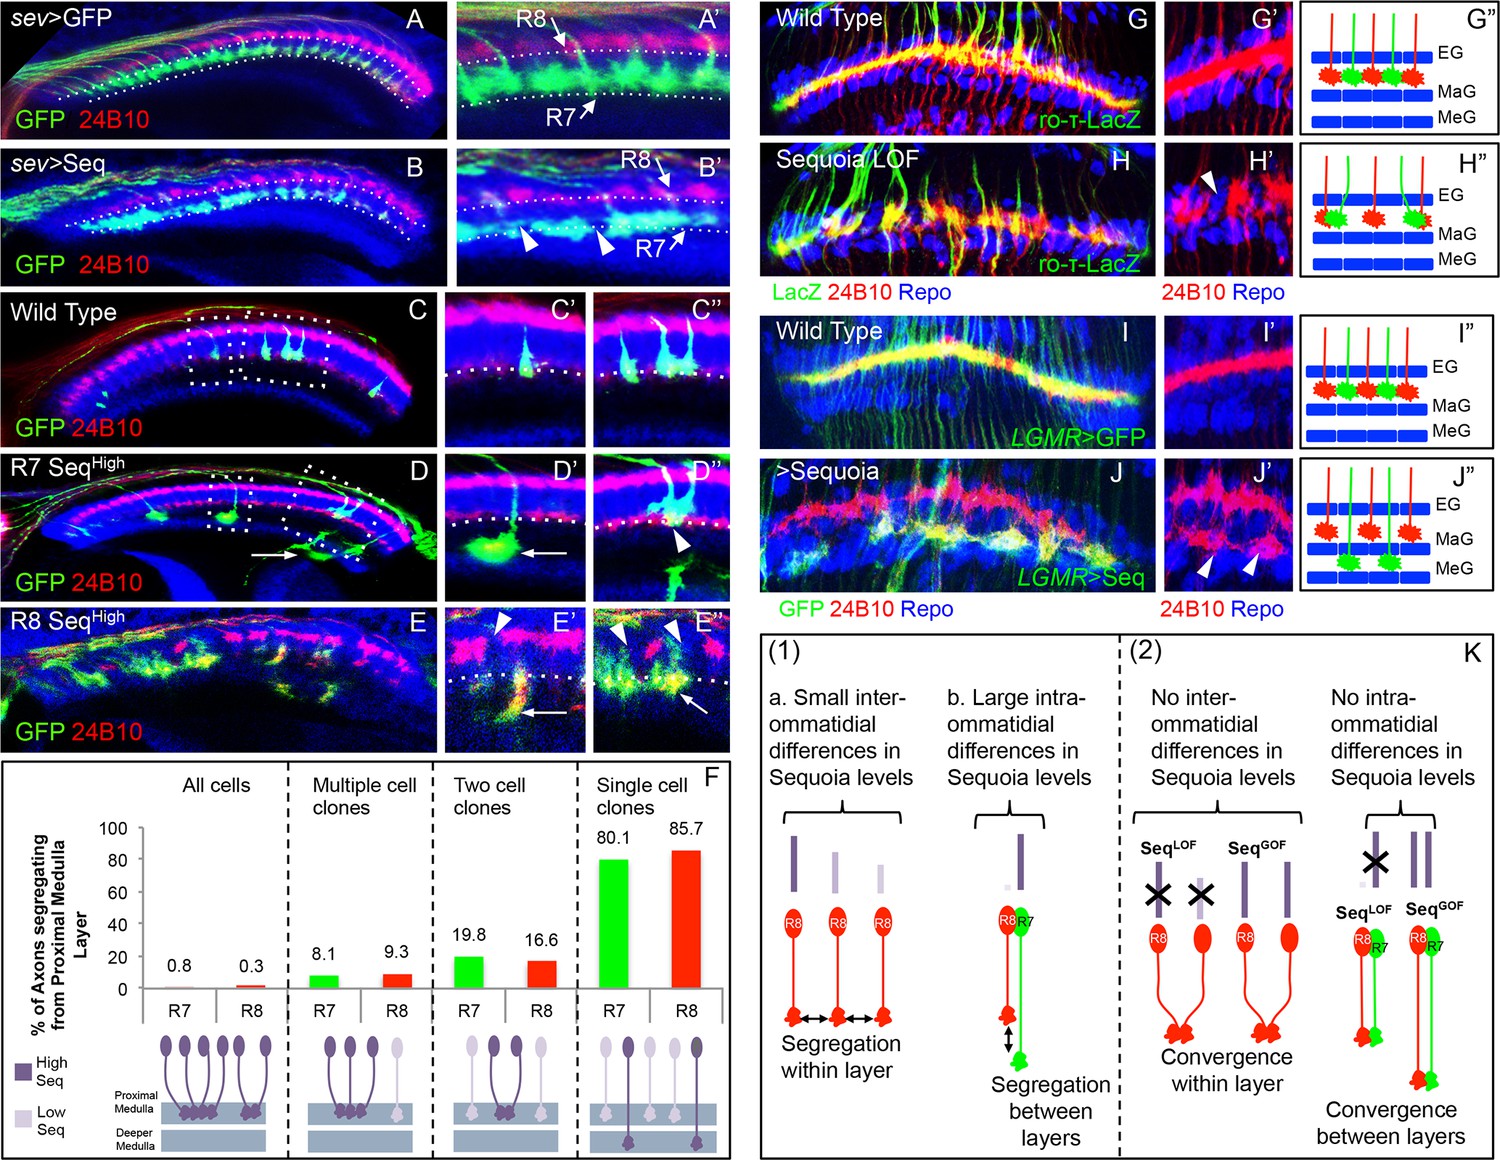
Relative levels of Sequoia mediate growth cone segregation.
(A) Wild type R7 growth cones segregate within the deeper medulla position thereby maintaining the topographic columnar arrangement. (B) Mis-expression of Sequoia in R7 cells alone under sev-Gal4 (all R8 Seqlow, all R7 Seqhigh) does not affect segregation of R7 growth cones from R8 growth cones but disrupts segregation among R7 growth cones within deeper medulla position. This leads to the loss of topographic arrangement illustrated by gaps in the deeper medulla position (B’ arrowheads). R8 and R7 growth cone positions in the medulla are indicated in A’–B’. C–E”. Wild type and Sequoia mis-expressing clones of R7 cells are generated using GMR-FLP induced MARCM. (C’) shows a single cell and C’’ shows a two cell R7 clone (C’, C’’ arrowheads). (D, E) Sequoia mis-expressing clones of R7 and R8 respectively. D’ shows a single Sequoia mis-expressing R7 cell clone (R7 Seqhigh) that segregates from growth cones of neighbour wild type R7 cells (R7 Seqlow) and extends beyond the normal R7 position into the medulla; D’’ shows a two cell clone of neighbouring R7 cells that mis-express Sequoia (R7 Seqhigh-R7 Seqhigh) but do not extend growth cones beyond the normal R7 position in the medulla (D’’ arrowhead). (E’) Single Sequoia mis-expressing R8 cell clone (R8 Seqhigh) extends growth cone to the medulla regions beyond the R7 position (E’ arrow) thus leaving a gap in the superficial R8 position in the medulla (E’ arrowhead). (E”) Multiple R8 cell clones exhibit shift of their growth cones to deeper medulla position (E” arrowheads showing empty R8 position) but are retained in this position similar to the two cell R7 clones (R8 Seqhigh-R8 Seqhigh E” arrow). The brain regions are visualized using anti-N-cadherin antibody (in blue) and labelling of photoreceptors axons is indicated in the figure panels. (F) Quantification of the overshooting phenotype at the Seqlow -Seqhigh clone boundary exhibited by single vs. multiple cell clones of R7 and R8 cells. Sequoia expression in- all R cells- R7 n=96, R8 n=128, multiple cell clones- R7 n=37, R8 n=43, two cell clones- R7 n=97, R8=6 and single cell clones- R7 n=121, R8 n=7. (G–J”) Lamina plexus assembly is disrupted by loss and gain of Sequoia function. (G, G”)- Wild type clones of lamina targeting R1-R6 cells are generated using ey3.5-FLP and are labelled with ro-τ-LacZ to visualize growth cones of R2/R5 cells. (H, H”) Disruption of lamina plexus assembly in sequoia mutant R1-R6 clones (H’ arrowhead). R2/R5 cell growth cones visualized with ro-τ-LacZ. (I, I”) Wild type clones of R1-R6, generated using ey3.5-FLP and labelled with LGMR-Gal4, target normally to lamina plexus. (J, J”) Sequoia mis-expressing clones of R1-R6 cells labelled with LGMR-Gal4. Growth cones of Sequoia mis-expressing R1-R6 cells (labelled with GFP) segregate from the growth cones of wild type cells and assemble into an additional layer between marginal (MaG) and medulla glia (MeG) cells (J’ arrowheads). G”–J” show schematics of wild type, sequoia mutant and Sequoia mis-expressing R1-R6 growth cones in the lamina plexus. (K) Schematics depicting (1) the relative differences in Sequoia expression levels among R8-R8 and R8-R7 cells in wild type development, (2) R cell growth cone phenotypes in Sequoia loss and gain of function scenarios.
-
Figure 3—source data 1
R cell axon overshooting quantification.
The overshooting phenotype of R cell axons in Sequoia gain of function clones was quantified and calculated as percentage of axons overshooting. Each brain was manually analysed and total number of clone axons (GFP positive) were individually counted against number of overshooting axons. The row 1 depicts type of clone, row 2 depicts cell type, row 3 depicts the percentage of overshooting axons and row 4 shows the raw number of axons counted.
- https://doi.org/10.7554/eLife.13715.010
Figure 3—figure supplement 1
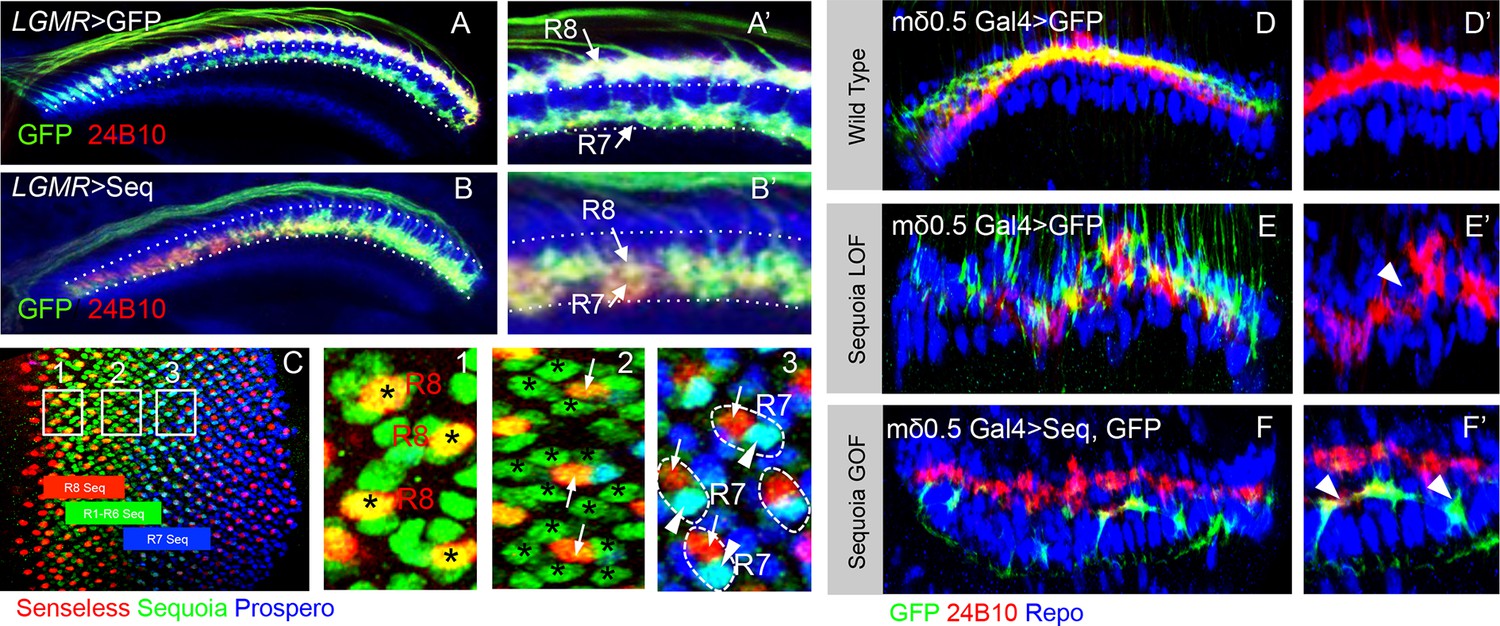
Loss and gain of Sequoia function in single lamina targeting R cell-type (R4) is sufficient to induce changes in growth cone segregation.
(A) Wild type R7 growth cones segregate from R8 growth cones present in the superficial medulla position and are positioned in the deeper medulla position. (B) Prolonged expression of Sequoia in both R7 and R8 cells under LGMR-Gal4 (all R8Seqhigh, all R7 Seqhigh) leads to convergence of their growth cones in the deeper medulla position. (C) Expression of Sequoia in 3rd instar eye disc. The coloured blocks depict the expression period of Sequoia in R8 (red), R1-R6 (green) and R7 (blue). 1,2 and 3 insets show Sequoia expression in R8, R1-R6 and R7 respectively. (1) Shows high expression of Sequoia in R8 cells (asterisks). (2) Shows the loss of Sequoia expression in R8 cells (arrows) whereas high Sequoia expression in R1-R6 cells (asterisks). (3) Shows high Sequoia expression in R7 cells and no Sequoia expression R8 as well as R1-R6 cells. The large (intra-ommatidial) difference in Sequoia expression levels between R8 and R7 cells is depicted by outlining the R7/R8 cells in same ommatidium. No detectable expression of Sequoia in R8 (3, arrows) and high Sequoia expression in R7 (3, arrowheads). (D–F’) Sequoia loss and gain of function affects segregation of even single cell type (R4) in the lamina. (D) Clones of wild type R4 cells in the lamina plexus. R4 growth cones are labelled using mδ0.5 Gal4 and show normal patterning within lamina plexus. (E, E’) sequoia mutant R4 cells labelled with mδ0.5 Gal4 show abnormal patterning in the lamina plexus and disruption of lamina assembly is demonstrated by occurrence of gaps in the plexus (B’ arrowhead). (F, F’) Sequoia mis-expression under mδ0.5 Gal4 leads to segregation between growth cones of Sequoia mis-expressing R4 cells (labelled with GFP) and wild type R1-R6 cells, and shift of Sequoia mis-expressing R4 cell growth cones to a distinct position within the lamina neuropile.
Figure 4 with 1 supplement

Initial position of R cell axons in the medulla is developmentally consolidated.
(A) Early mis-expression of Sequoia from 3rd instar stage leads to shift of all R8 growth cones to deeper medulla position and results in convergence with R7 growth cones. (B) Induction of Sequoia mis-expression from 6 hr APF shows consolidation of 8 posterior R8 growth cones in their superficial medulla position at 24 hr APF. (C) Sequoia mis-expression from 8 hr APF shows 12 posterior R8 growth cones to be consolidated. (D) Sequoia mis-expression from 12 hr APF onwards shows consolidation of 16 posterior R8 growth cones in superficial medulla position at 24 hr APF. (E) Continued Sequoia mis-expression until 40 hr APF following induction at 12 hr APF does not disrupt the consolidation of 16 posterior R8 growth cones. (F) Quantification of R8 growth cone consolidation. Error bars indicate Standard Deviation.
-
Figure 4—source data 1
R8 axon consolidation quantification.
The file depicts quantification of number of R8 axons consolidated in the superficial medulla position following induction of Sequoia expression at different developmental stages. Rows depict different developmental stages at which Sequoia expression was induced. Total number of R8 axons was counted at the stage of Sequoia expression induction and number of R8 axons consolidated in the superficial medulla position was counted at 24 hr APF. For each stage, 20 brains were analysed and the average number is shown in the source file.
- https://doi.org/10.7554/eLife.13715.013
Figure 4—figure supplement 1
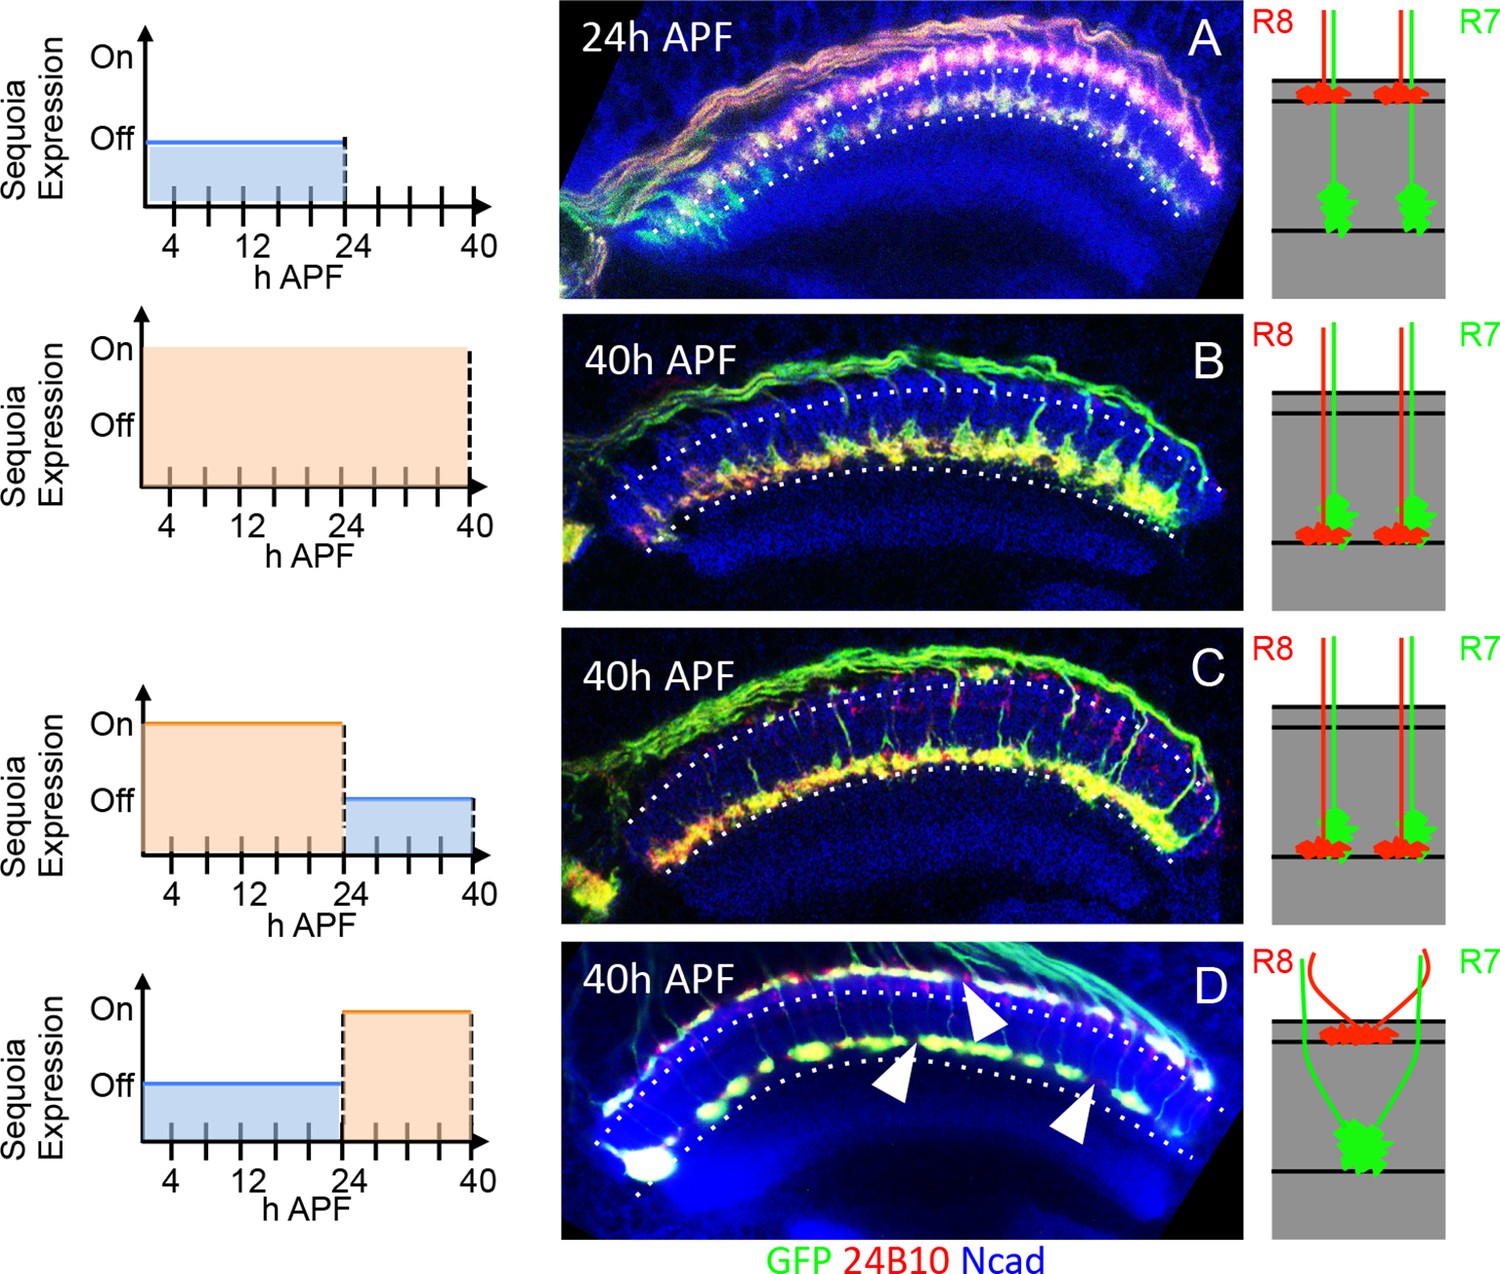
Temporally restricted induction of Sequoia expression has differential effects on R7/R8 growth cone segregation.
(A–D) The induction of Sequoia expression in temporally restricted manner during R cell growth cone positioning. Schematics on the left illustrate the temporal windows of Sequoia expression and schematics on the right illustrate the resulting growth cone phenotypes. (A) Wild type targeting of R8 and R7 growth cones at 24 hr APF in the medulla. (B) Continued mis-expression of Sequoia causes R8 and R7 growth cones to remain converged forming a single layer in deeper medulla position at 40 hr APF. (C) Early mis-expression of Sequoia until 24 hr APF is sufficient for continued convergence of R8 and R7 growth cones at 40 hr APF. (D) Late mis-expression of Sequoia after 24 hr APF cannot induce convergence of R8 and R7 growth cones in deeper medulla position at 40 hr APF but results in loss of topographic arrangement (D arrowheads).
Figure 5 with 1 supplement

Capricious mediates initial position consolidation of R8 axons.
(A–D’) Expression pattern of Capricious protein in the developing medulla at 24 hr APF. A, B, C and D show Capricious expression at the anterior medulla corresponding to the initial positioning of R8/R7 growth cones as they innervate the medulla and A’, B’, C’ and D’ show the Capricious expression at the posterior side of medulla corresponding to the region where R8 growth cones are consolidated in their superficial medulla position. (D–D’) The heat map of Capricious expression (measured in terms of normalized relative fluorescence intensity) in the developing medulla region. The Arbitrary Fluorescence Units used for plotting the heat map are shown in D. The table shows the quantification of Capricious expression intensity measured as ratio between the Normalized Fluorescence Intensities (NFI) at R8 or R7 growth cone position vs. the surrounding medulla region. (E–H”) Loss of Capricious function disrupts R8 growth cone consolidation. (E, E”) Wild type R8 clones at 24 hr APF. Wild type R8 growth cones are positioned at the superficial medulla position at both anterior (E’) and posterior (E”) side of medulla (98%, n=58). (F, F”) Wild type R8 axons at 75 hr APF target to medulla layer M3 (F’, F”, 97%, n=49). (G–H”) capricious mutant R8 clones. (G, G”) capricious mutant R8 clones at 24 hr APF. capricious mutant R8 growth cones are positioned correctly at the anterior side of medulla (G’, 94%, n=37) as they innervate medulla whereas at the posterior side (G”) capricious mutant R8 growth cones prematurely extend towards the deeper medulla position (G” arrowheads, 62%, n=24). (H–H”) capricious mutant R8 axons at 75 hr APF mis-target to medulla layer M6 instead of M3 (H” arrowheads, 71%, n=38). (I–L) Reduction of Capricious levels leads to the disruption of R8 growth cone consolidation. I. UAS-CapriciousRNAi expression under LGMR-Gal4 does not affect R8 growth cone consolidation at 24 hr APF. (J) Sequoia mis-expression from 12 hr APF leads to consolidation of 16 posterior R8 growth cones at 24 hr APF. (K) Sequoia mis-expression from 12 hr APF in sensitized background of UAS-CapriciousRNAi severely disrupts R8 growth cone consolidation at 24 hr APF. (I, J, K) Dotted lines depict region in the medulla with R8 growth cone consolidation and solid lines depict region in the medulla with R8 growth cones extending to the deeper R7 position. (L) Quantification of the UAS-CapriciousRNAi mediated disruption of R8 growth cone consolidation. Error bars indicate Standard Deviation.
-
Figure 5—source data 1
UAS-Seq/ UAS-Seq; UAS-Caps RNAi consolidation quantification.
The file depicts the quantification of R8 axon consolidation following Sequoia expression induction at 12 hr APF with and without CapriciousRNAi in the background. For Sequoia expression induction without Capricious RNAi, R8 axon consolidation was quantified for 13 brains whereas 19 brains were analysed for Sequoia expression induction in Capricious RNAi background. Average number of axons and Standard Deviation were accordingly calculated for both conditions.
- https://doi.org/10.7554/eLife.13715.016
Figure 5—figure supplement 1
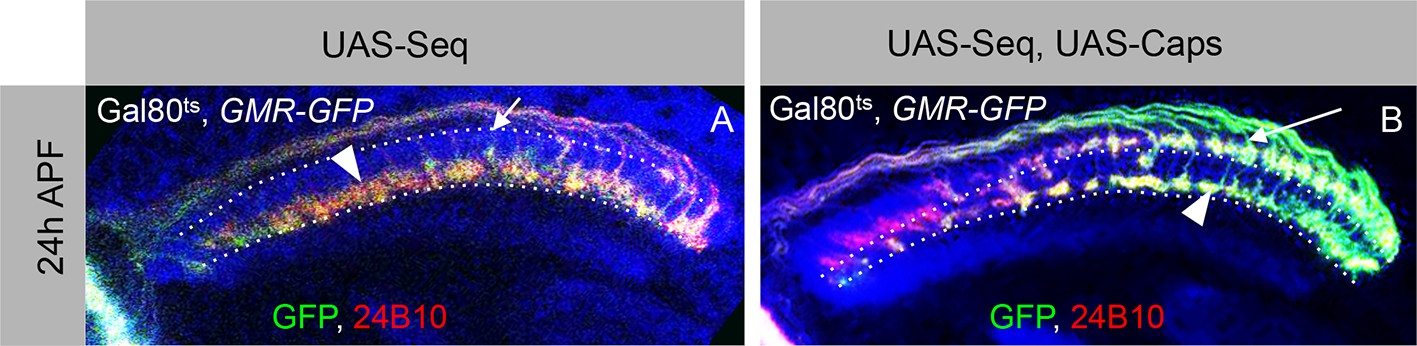
Antagonistic interaction between Sequoia and Capricious mediates proper positioning of R-cell growth cones in the developing medulla.
(A–A’) R-cell growth cone positioning is disrupted by Sequoia mis-expression. A. Sequoia mis-expression under LGMR-Gal4 leads to mis-positioning of R8 growth cones in the deeper medulla position at 24 hr APF (Arrowhead shows mis-positioned R8 growth cones in deeper medulla position, arrow shows empty superficial medulla position). Co-expression of Sequoia and Capricious under LGMR-Gal4 rescues Sequoia mediated mis-positioning of R8 growth cones, thereby R8 growth cones are positioned at the superficial medulla position (arrow) whereas R7 growth cones are positioned in their normal deeper medulla position (arrowhead) at 24 hr APF.
Figure 6 with 2 supplements
Initial position determines final medulla layer targeting and synaptogenesis.
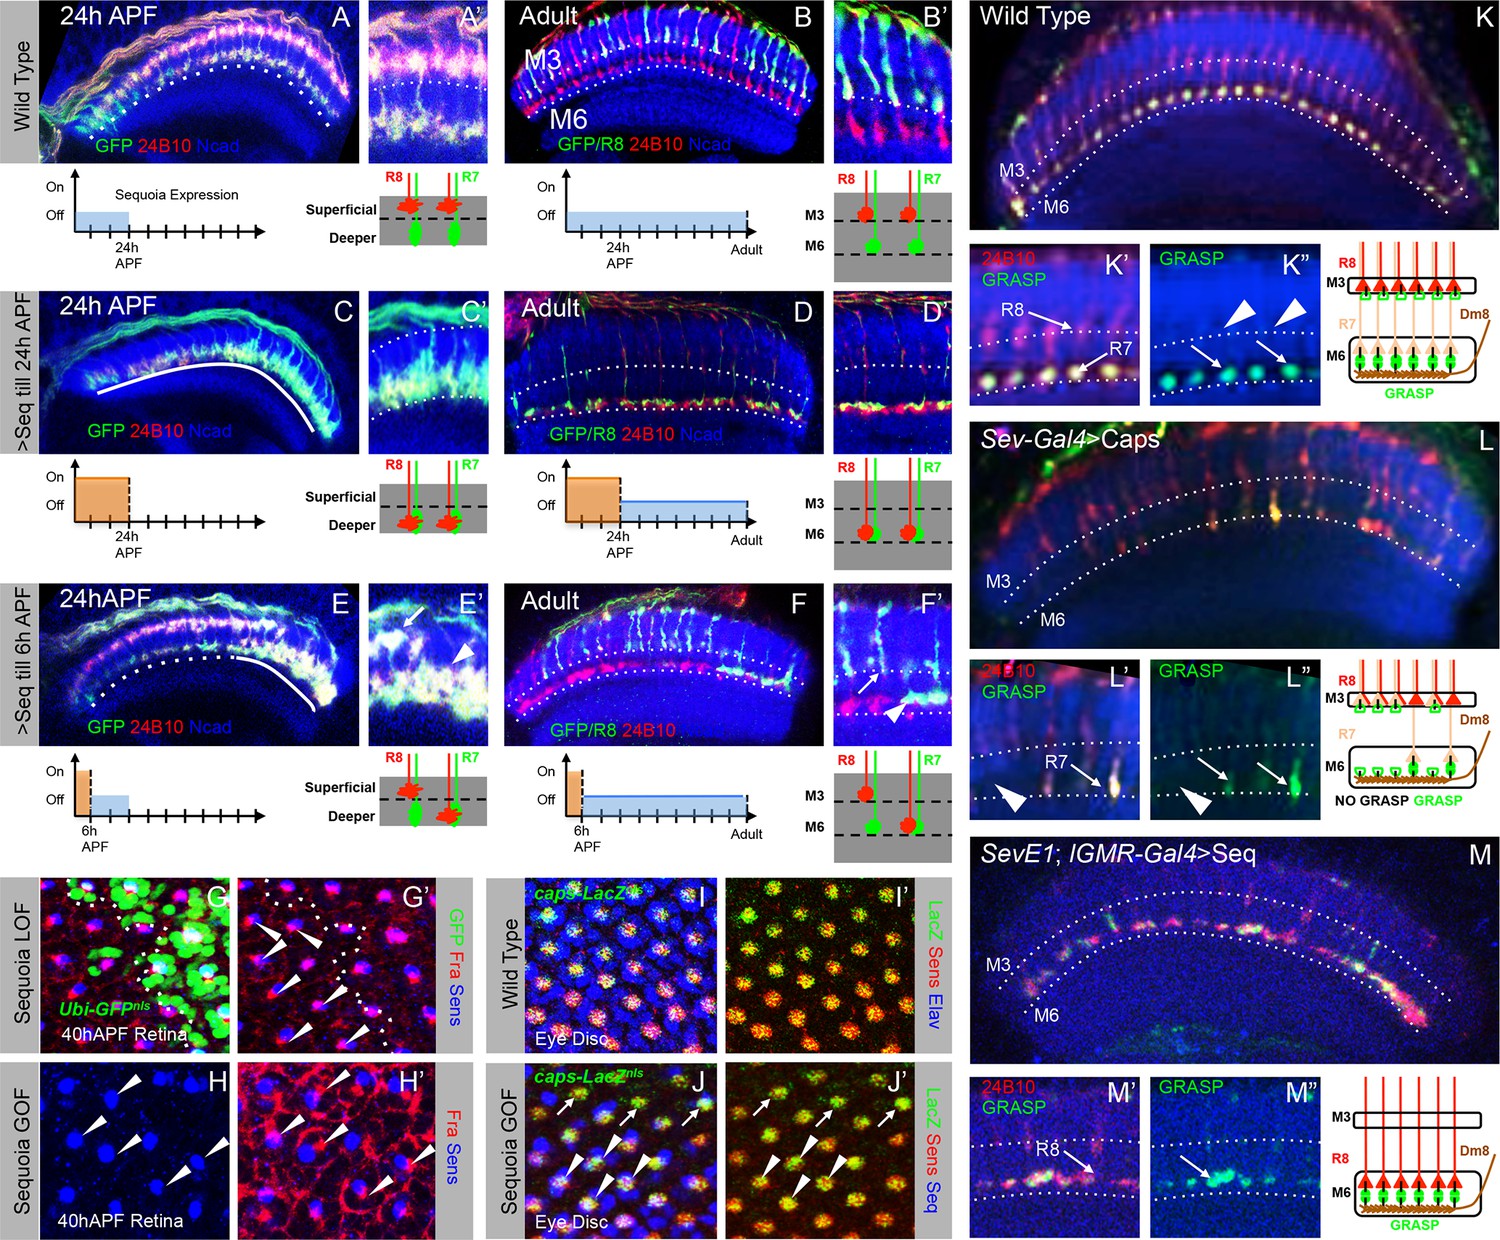
(A–F’) Initial growth cone position correlates with final target layer. (A) Wild type R7/R8 growth cone position in the medulla at 24 hr APF. (B) Wild type innervation of R8 axons in the adult to layer M3 and R7 axons to layer M6. (C) Induced Sequoia expression mediates mis-positioning of R8 growth cones in the deeper medulla position at 24 hr APF. (D) R8 axons mistarget to layer M6 in the adult even when Sequoia mis-expression is stopped from 24 hr APF onwards. (E) Sequoia mis-expression until 6 hr APF leads to mis-positioning of 6–8 posterior R8 growth cones to deeper medulla position. (F) Initially mis-positioned R8 growth cones mis-target to layer M6 whereas normally positioned R8 growth cones later target to layer M3. A’-F’ shows magnifications of A-F. (G-J’) Changes in Sequoia expression do not affect expression of known R8 targeting molecules. (G, G’) Homozygous sequoia mutant cells are visualized using loss of Ubi-GFPnls expression as a clonal marker. Arrowheads show individual R8 cells labelled with Senseless and Frazzled and cells without GFP are sequoia mutant R8 cells. (H, H’) Visualization of Frazzled expression following Sequoia mis-expression using LGMR-Gal4. All cells mis-express Sequoia and individual R8 cells are labelled with Senseless (Blue). Frazzled expression is visualized using anti-Frazzled antibody (Red). All R8 cells express Frazzled suggesting mis-expression of Sequoia does not repress Frazzled expression. Additional Frazzled staining at the ommatidial boundaries is from a different imaging plane. (I–J’) Elevated Sequoia levels do not affect Capricious expression. I, I’- Wild type pattern of Capricious expression reported by caps-LacZnlsenhancer trap (Shishido et al., 1998) and visualized using anti-LacZ antibody (Green) in the R8 cells labelled with Senseless (Blue). (J, J’) Sequoia mis-expression does not transcriptionally repress the expression of Capricious (J, J’- Arrowheads show R8 nuclei with Sequoia mis-expression, arrows show R8 nuclei without Sequoia mis-expression). (K–M”) Synaptogenesis of R8 axons in the ectopic layer M6 with Dm8 neurites as shown by GFP Reconstitution Across Synaptic Partners (syb-GRASP). (K–K”) Control GRASP between R7 and Dm8 at layer M6. R8 and R7 axons target to layers M3 and M6 (K’ arrows) and GRASP signal is observed in layer M6 (K” arrows) but not in layer M3 (K” arrowheads). (L–L”) Mistargeting of R7 axons to layer M3 upon UAS-CapriciousID expression under sev-Gal4 leads to loss of GRASP between R7 and Dm8. Escaper R7 axons that target to M6 show GRASP with Dm8 (L’ arrows) whereas R7 axons that mistarget to M3 do not show GRASP signal (L” arrowheads). (M–M”) R8 axons ectopically targeting to layer M6 upon Sequoia mis-expression show GRASP signal with Dm8 (M” arrows).
Figure 6—figure supplement 1
Ectopic R8 growth cones are present in close proximity of Dm8 neurites early in the development.
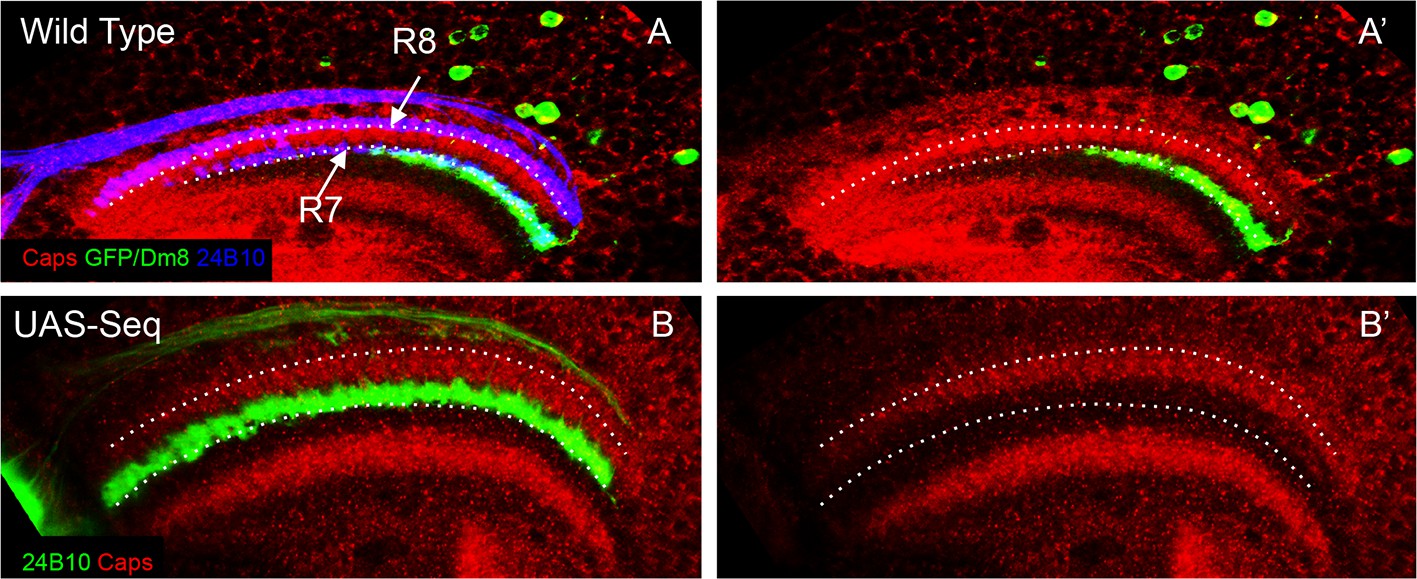
(A–B’). Initially mis-positioned R8 growth cones can contact Dm8 neurites at 24 hr APF. (A, A’) At 24 hr APF, Dm8 neurites are present at the R7 initial position in the medulla. This R7 and Dm8 neurite position is proximal to the Capricious expression domain in the medulla. Dotted lines show R8 and R7 axon positions. (B, B’) Sequoia mis-expression causes R8 axons to mis-position along with R7 axons in the deeper position in the medulla just proximal to the Capricious expression domain. This is the position where Dm8 neurites are present and are therefore in close proximity to the mis-positioned R8 growth cones.
Figure 6—figure supplement 2
Role of N-Cadherin in stabilizing R7 growth cones in deeper medulla position and subsequent M6 layer targeting.
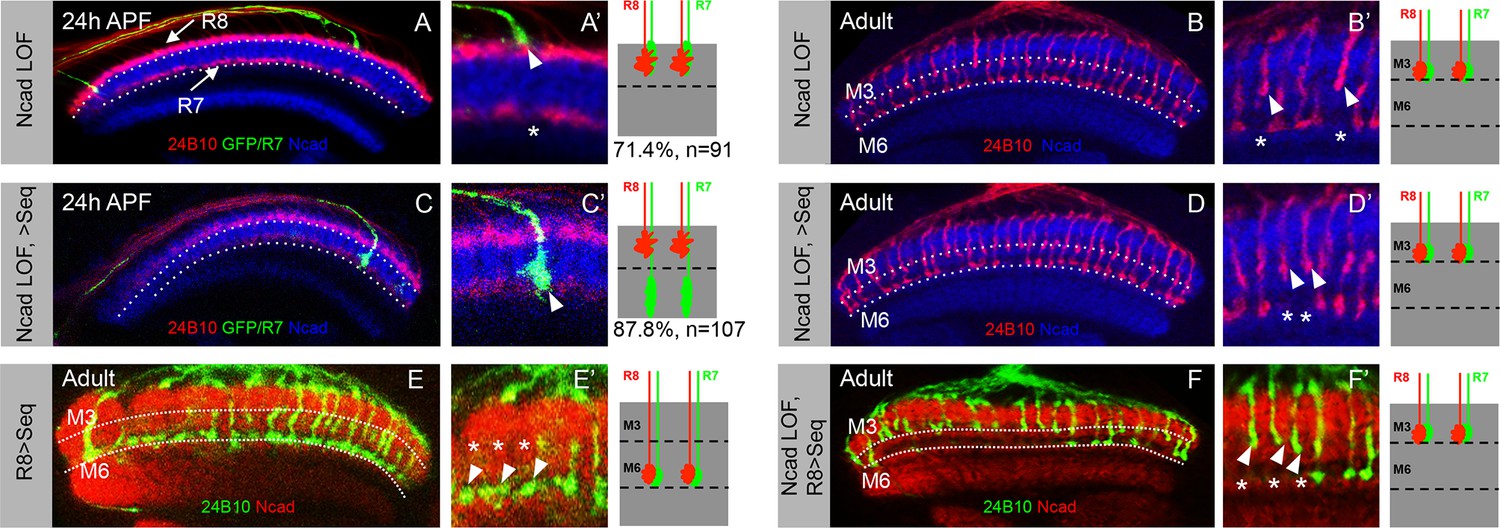
(A–B’) Loss of N-Cadherin leads to mis-targeting of R7 axons to M3 layer. (A, A’) CadN mutant R7 growth cones shift to superficial R8 position in the medulla (A’, arrowhead) leaving gaps in their normal medulla position (A’ asterisk). The CadN mutant R7 axons are generated using GMR-FLP and labelled with elav-Gal4 UAS-mCD8GFP. (B, B’) CadN mutant R7 axons that are initially mis-positioned subsequently mistarget to layer M3 along with R8 axons (B’, arrowhead) leaving a gap in the M6 layer (B’, asterisk). (C–D’) In the absence of N-Cadherin, initial positioning to the temporary deeper medulla layer is not sufficient for M6 layer targeting. (C, C’) Induction of Sequoia expression under weak elav-Gal4 in cadN mutant R7 cells can rescue the initial mis-positioning of their growth cones. The CadN mutant R7 growth cones with induced Sequoia expression reach their normal temporary target layer in the deeper medulla position (C’, arrowhead). (D, D’) Early induction of Sequoia expression is not sufficient to rescue the later R7 axon mis-targeting to layer M3. The CadN mutant R7 axons mis-target to layer M3 in the adult (D’, arrowhead) leaving gaps in layer M6 (D’, asterisk) even though these R7 growth cones are initially positioned in normal medulla layer (C, C’). (E-F’) N-Cadherin is required for mistargeting of R8 axons to M6 layer. (E, E’) Early Sequoia mis-expression in large clones of R8 cells under sens-Gal4 is sufficient for their mis-targeting to M6 layer in the adults (E’ arrowheads) leaving layer M3 empty (E’ asterisk). (F, F’) CadN mutant R8 axons cannot mis-target to layer M6 even after early mis-expression of Sequoia under sens-gal4. Thus, due to absence of N-Cadherin both R7 and R8 axons fail to reach layer M6 leaving it empty (F’ asterisk) and are present in layer M3 (F’ arrowheads).
Figure 7
Role of early growth cone patterning in synaptic layer selection.
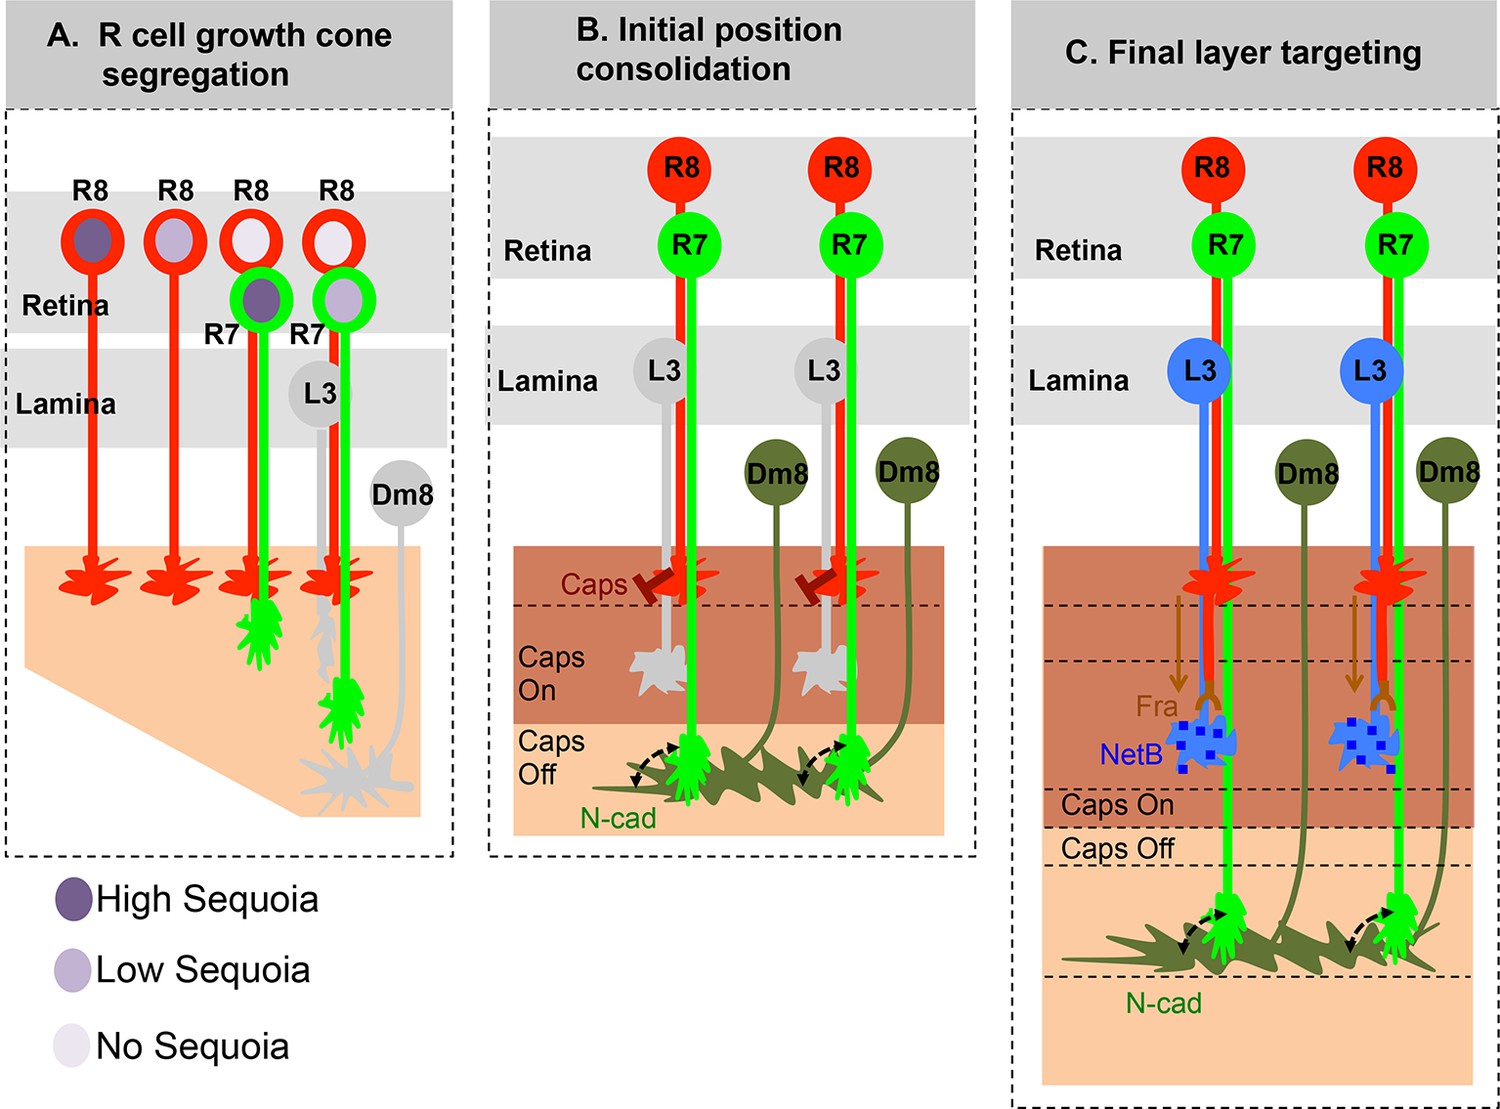
(A) R cell axons arrive asynchronously in the developing medulla field in a pattern that reflects their specification in the eye disc. The growth cones of the same R cell type topographically segregate within the temporary layer. This segregation within a layer is mediated by low inter-ommatidial differences in the Sequoia levels (illustrated for R8 cells). The segregation of growth cones of different cell type (R7/R8) between distinct temporary layers occurs as a result high intra-ommatidial differences in Sequoia levels. The differences in Sequoia levels are an outcome of temporal sequence of photoreceptor specification in the eye disc (Tomlinson and Ready, 1987). Therefore, birth-order dependent differential positioning generates this early patterning of afferent growth cones in the medulla. (B) Once the initial patterning is achieved, the cell adhesion molecules consolidate the growth cones in their distinct temporary layers. In case of R8 growth cones, Capricious mediates afferent-target interactions and thereby stabilizes R8 growth cones in the superficial medulla position. The R7 growth cones, segregated into deeper medulla position most likely interact with neurites of Dm8 cells, the primary post-synaptic target of R7 cells via N-Cadherin (Özel et al., 2015). This sequential process continues until all R cell axons arrive in the developing medulla field, are segregated into and consolidated in distinct temporary layers. (C) Following the Capricious mediated consolidation of R8 growth cones in the superficial medulla and possible R7->Dm8 interaction in the deeper medulla position, axons of both cell types synchronously extend towards their final target layers. The guidance of R8 axons to M3 layer is mediated by localised NetB signal from L3 neurites (Timofeev et al., 2012; Pecot et al., 2014). On the contrary, the R7 axons are suggested to passively dislocate and reach layer M6 via their interactions with Dm8 neurites that are gradually pushed deeper in the medulla as a result of growth of the medulla field (Özel et al., 2015). Furthermore, the extension of R7 axons to reach layer M6, following their initial positioning, requires N-cadherin function (Özel et al., 2015; Ting et al., 2005). Therefore, M6 targeting of R7 axons seems to be a result of pre- and post-synaptic neuron interactions mediated by general synaptogenetic molecules rather than cell type specific factors. Thus, cellular proximity determines M6 layer targeting and establishment of synaptic contacts.
Additional files
-
Supplementary file 1
List of genotypes used in this study.
The table shows detailed genotypes used in each of the experiments shown in figures and arranged to depict genotypes analysed for each representative image in the figures.
- https://doi.org/10.7554/eLife.13715.022
Download links
A two-part list of links to download the article, or parts of the article, in various formats.
Downloads (link to download the article as PDF)
Open citations (links to open the citations from this article in various online reference manager services)
Cite this article (links to download the citations from this article in formats compatible with various reference manager tools)
Birth order dependent growth cone segregation determines synaptic layer identity in the Drosophila visual system
eLife 5:e13715.
https://doi.org/10.7554/eLife.13715


