A SPOPL/Cullin-3 ubiquitin ligase complex regulates endocytic trafficking by targeting EPS15 at endosomes
- Eidgenössische Technische Hochschule Zürich, Switzerland
- University of Zurich, Switzerland
Figures
Figure 1 with 1 supplement
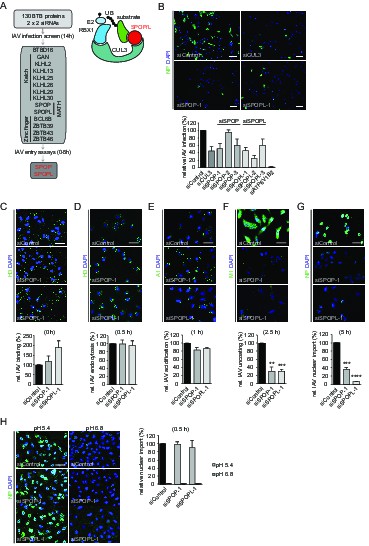
The CRL3 substrate adaptors SPOP and SPOPL are crucial for influenza A virus (IAV) infection and uncoating.
(A) siRNA screen workflow for BTB adaptor proteins with similar IAV infection phenotypes as CUL3 (left). Schematic representation of the CRL3SPOP/L E3 ubiquitin ligase complex (right). CUL3 mediates the formation of ubiquitin chains (UB) to its substrates by binding to the ubiquitin charged conjugating enzyme (E2-UB) via RBX1 on one side while allowing the interaction with the substrate through the substrate adaptor proteins SPOP or SPOPL on the other side. (B) IAV X31 infection assay. Images show A549 cells treated with control siRNA (siControl) or siRNA-depleted of CUL3 (siCUL3), and the BTB-adaptor SPOP (siSPOP-1) or SPOPL (siSPOPL-1) for 72 hr before infection with IAV X31. IAV infection was quantified by co-staining the cells with NP specific antibodies and DAPI to indicate nuclei. Cells siRNA-depleted for the vATPase subunit ATP6V1B2 (siATP6V1B2) were included for positive control. Scale bar = 100 μm; Data are mean + SD, n > 100 cells per sample, N = 4. (C-G) IAV entry assays. A549 cells were treated with control, SPOP- or SPOPL-specific siRNA, and binding of IAV X31 to the cells was monitored by immunofluorescence staining of the hemagglutinin (HA) with anti-H3 antibody (C). The IAV infection was allowed for 0.5 hr to follow IAV endocytosis with HA staining (D), for 1 hr to monitor IAV acidification using A1 antibodies (E), for 2.5 hr to check IAV uncoating by M1 detection (F) and finally for 5 hr to track nuclear import of IAV vRNPs by NP-specific antibodies (G). Nuclei were stained with DAPI and entry steps quantified relative to control. Scale bar = 50 μm; Data are mean + SD, n > 500 cells per sample, N = 3. **p≤0.01, ***p≤0.001; ****p≤0.0001. (H) Acid-induced endocytic-bypass entry assay. IAV nuclear import after acid-induced fusion at the PM was monitored in A549 cells using indirect immunofluorescence staining for NP and counterstaining with DAPI for infection quantitation. Note that pH 5.4 allows acid-induced endocytic-bypass infection of IAV. Scale bar = 50 μm; Data are mean + SD, n > 500 cells per sample, N = 3.
Figure 1—figure supplement 1
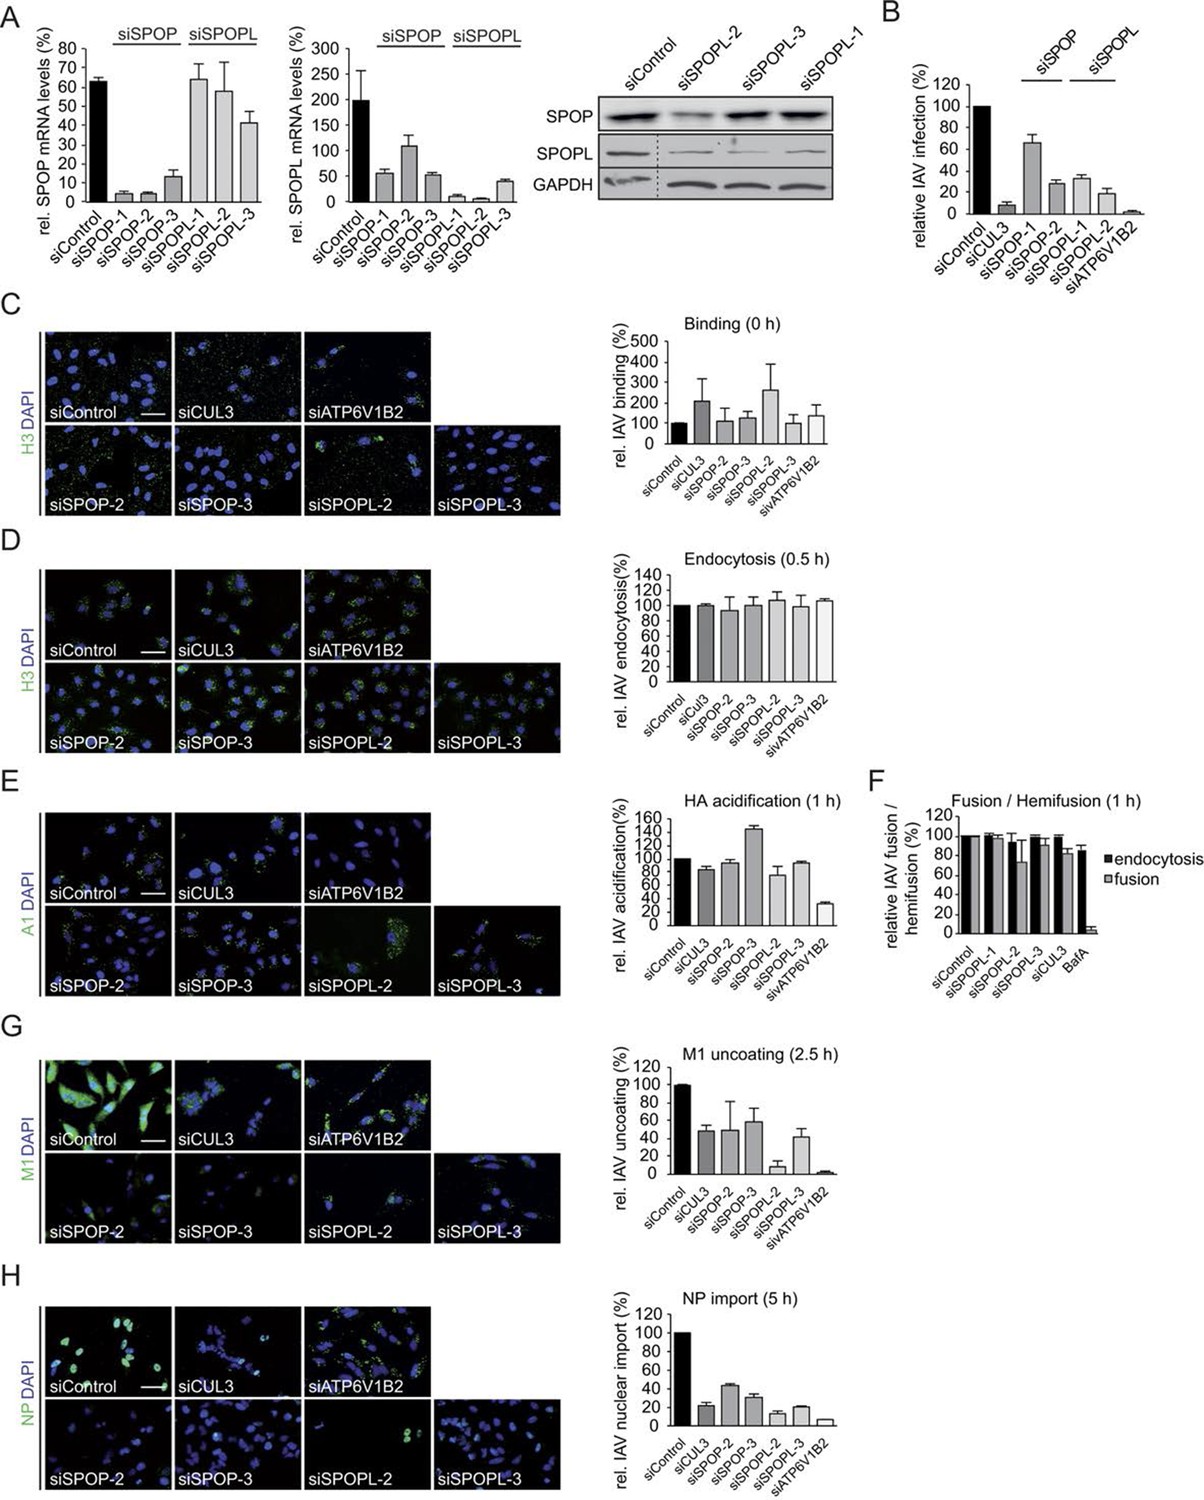
The CRL3 substrate adaptors SPOP and SPOPL are crucial for influenza A virus (IAV) infection and uncoating.
(A) The efficiency of distinct siRNAs targeting SPOP (siSPOP-1 to siSPOP-3) or SPOPL (siSPOPL-1 to siSPOPL-3) were analyzed in HeLa cells by qRT-PCR (left panel). The qRT-PCR measurements were quantified and plotted as mRNA levels relative to GAPDH controls. Data are mean + SD, N = 3. Immunoblotting of cell extracts using an affinity-purified peptide antibody specifically recognizing SPOPL (right panel, see Material and methods). (B) IAV X31 infection assay. HeLa cells treated with siControl, depleted of SPOP (siSPOP1-2), SPOPL (siSPOPL1-2), CUL3 (siCUL3) or the vATPase subunit ATP6V1B2 (siATP6V1B2) were infected with IAV X31, and infected cells were visualized by immunofluorescence staining of the viral protein NP. The assay was quantified as described in the legend to Figure 1 and plotted as percentage (%) of NP positive cells compared to control (siControl). Data are mean + SD, n > 500 cells per sample, N = 3. (C) IAV binding assay. A549 cells treated with siControl oligos or depleted as indicated for SPOP (siSPOP2-3), SPOPL (siSPOPL2-3), CUL3 (siCUL3) or the vATPase subunit ATP6V1B2 (siATP6V1B2) and incubated with the IAV X31 strain (MOI = 100) for 1 hr at 4°C. IAV binding was monitored by immunofluorescence staining of hemagglutinin (HA) with anti-H3 antibody, and quantified by plotting the relative percentage (%) of H3 positive cells treated with siSPOP or siSPOPL compared to siControl. Scale bar = 50 μm. Data are mean + SD, n > 100 cells per sample, N = 3. (D) IAV endocytosis assay. Following binding for 1 hr at 4°C, IAV X31 virus was internalized for 0.5 hr in control, SPOP- and SPOPL-depleted A549 cells. Intracellular staining of HA was used to monitor IAV endocytosis, and quantified by plotting the relative percentage (%) of cells with intracellular H3 treated with siSPOP or siSPOPL compared to siControl. Scale bar = 50μm. Data are mean + SD, n > 100 cells per sample, N = 3. (E) IAV acidification assay. Following binding for 1 hr at 4°C, IAV X31 virus was internalized for 1 hr in control, SPOP- and SPOPL-depleted A549 cells. Acidification of IAV was monitored by A1 immunofluorescence staining detecting the acid-induced conformational switch of HA after IAV entry. The data were quantified by plotting the relative percentage (%) of A1 positive cells treated with siSPOP or siSPOPL compared to siControl. Scale bar = 50 μm. Data are mean + SD, n > 100 cells per sample, N = 3. (F) IAV fusion assay. A549 cells treated for 72 hr with siControl oligos or depleted as indicated with three different siRNAs targeting SPOPL (siSPOPL1-3) or CUL3 (siCUL3) were incubated for 1 hr at 4°C with the IAV X31 strain (MOI = 100), labeled prior to this with R18 dye. The dye allows detecting fusion of the virus with the host membrane by changing its color from red to green. Viral fusion was quantified after 1 hr by FACS analysis and plotted as relative percentage (%) IAV fusion/hemifusion compared to siControl. Bafilomycin treatment for 1 hr prior to infection served as a control, since blocked vesicle acidification inhibits HA acidification and thus IAV fusion, but not endocytosis. Data are mean + SD, n > 5000 cells per sample, N = 3. (G) IAV uncoating assay. Following binding for 1 hr at 4°C, IAV X31 virus was internalized for 2.5 hr in control, siSPOP and SPOPL-depleted A549 cells in the presence of CHX. Uncoating of IAV particles was detected by immunofluorescence staining against M1. Dispersed M1 staining in the cytoplasm represents a successful uncoating event, and was quantified by plotting the relative percentage (%) of M1-dispersed cells treated with siSPOP or siSPOPL compared to siControl. Scale bar = 50 μm. Data are mean + SD, n > 100 cells per sample, N = 3. (H) IAV nuclear import assay. Following binding for 1 hr at 4°C, IAV X31 virus was internalized for 2.5 hr in control, SPOP- and SPOPL-depleted A549 cells in the presence of CHX. Import of NP into the nucleus was detected by indirect immunofluorescence staining with anti-HB64 antibody, and quantified by plotting the relative percentage (%) of nuclear NP-positive cells treated with siSPOP or siSPOPL compared to siControl. Scale bar = 50 μm. Data are mean + SD, n > 100 cells per sample, N = 3.
Figure 2 with 1 supplement
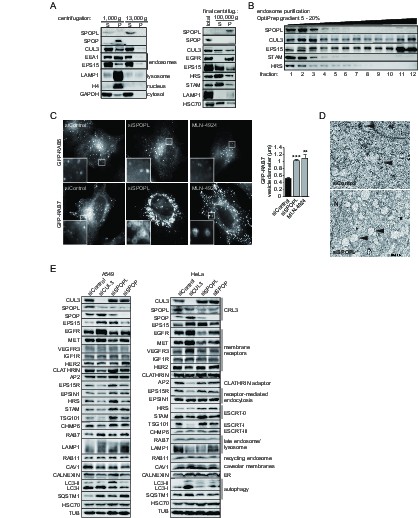
The BTB adaptor SPOP is nuclear, while SPOPL localizes to endosomes and affects endosome maturation.
(A) Extracts prepared from HeLa cells were analyzed by differential centrifugation. The indicated proteins were probed in the supernatant (S) and pellet (P) fractions by immunoblotting after sedimentation of nuclei at 1000 g and after further fractionation of the resulting supernatant at 13,000 or 100,000 g. The cellular organelles detected by the specific antibodies are marked. (B) Endosomal organelles were enriched from HeLa cells by differential centrifugation and then fractionated on a 5 – 20% OptiPrep gradient. After centrifugation, TCA-precipitated gradient fractions (1–12) were analyzed by immunoblotting with specific antibodies against SPOPL, CUL3, EPS15, STAM and HRS. (C) HeLa cells expressing GFP-RAB5 and GFP-RAB7 were treated with siControl or siSPOPL and live cell imaging monitored their expression. A set of untransfected cells was treated with 10 μM MLN-4924 to inhibit CRL activity by preventing neddylation. Scale bar = 10 μm. Regions of interest (squares) are shown at 5x magnification. Vesicle diameter was quantified by Image J. Data are mean + SD, n = 100 vesicles per sample, N = 3. ***p≤0.001; **p≤0.01. (D) HeLa cells were depleted of SPOPL or using siControl, fixed after 72 hr and thin sections analyzed by electron microscopy (EM). MVBs are indicated with a black arrow head. Note the enlarged vacuoles in SPOPL-depleted cells that were found empty, devoid of ILVs. N: nucleus. Scale bar = 2000 nm. (E) A549 and HeLa cells were depleted of CUL3, SPOPL or SPOP for 72 hr, and then cell lysates were prepared and analyzed via immunoblotting with specific antibodies for markers of different cellular compartments. (CRL3 – Cullin-RING ligase 3, ER – endoplasmic reticulum)
Figure 2—figure supplement 1
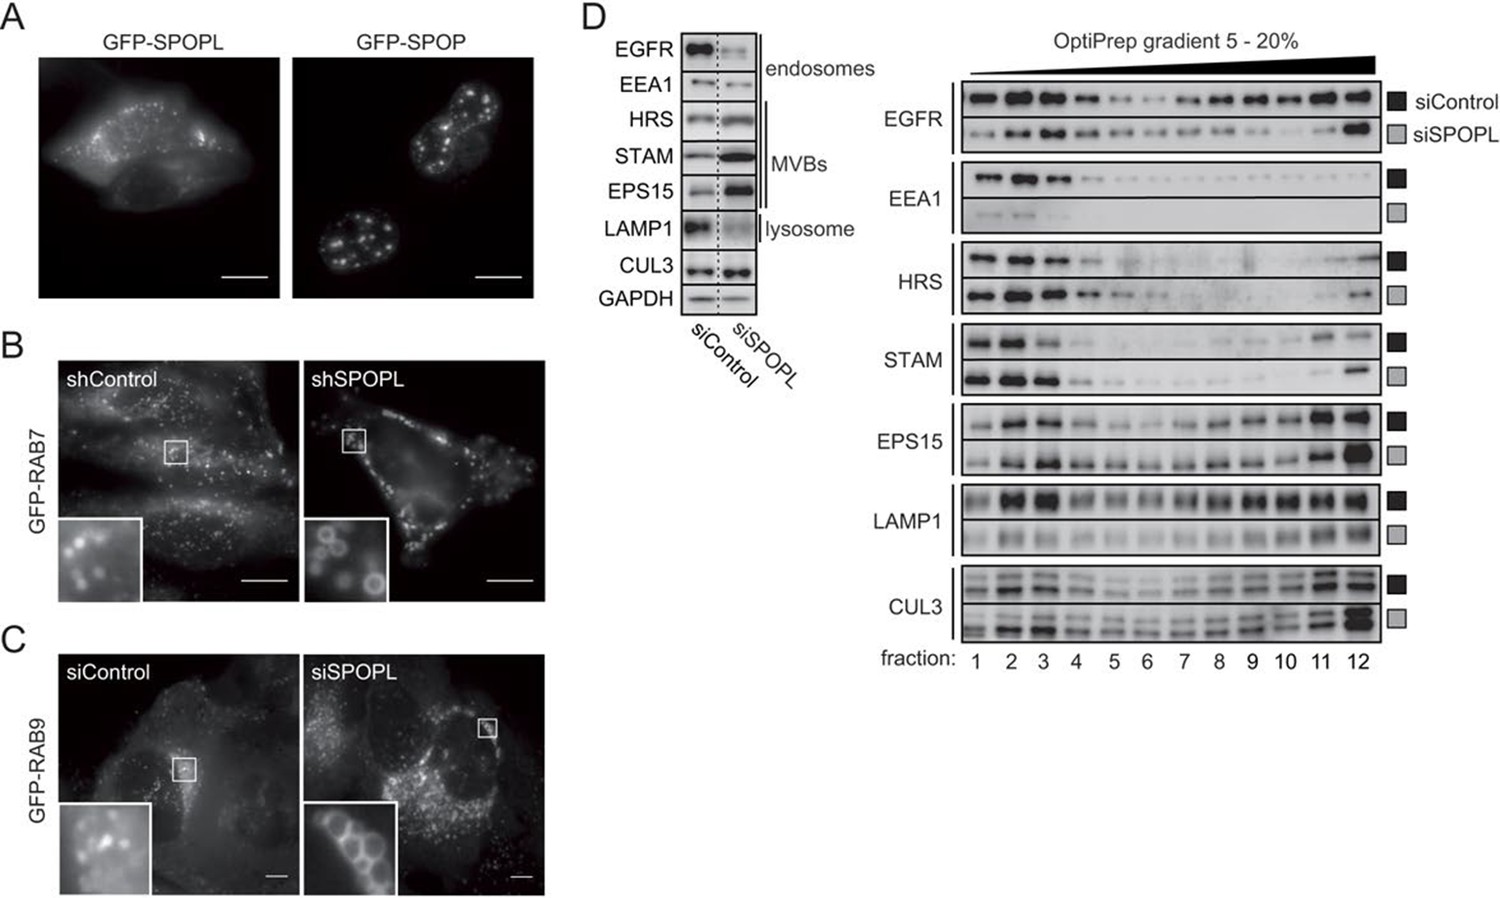
The BTB adaptor SPOP is nuclear, while SPOPL localizes to endosomes and affects endosome maturation.
(A) HeLa cells were transiently transfected with plasmids expressing GFP-SPOPL or GFP-SPOP respectively, and subcellular localization was analyzed 24 hr later by GFP-live cell microscopy. Maximal projections are shown. Note that GFP-SPOPL is mainly cytoplasmic and forms puncta, while GFP-SPOP accumulates in nuclear speckles. Scale bar = 10 μm. (B) HeLa cells stably expressing from the doxycycline (Dox)-inducible promoter GFP-RAB7 and either a shRNA control (shControl) or a shRNA specifically targeting SPOPL (shSPOPL-1) were induced by the addition of doxycycline (1 μg/ml) for 72 hr. The localization of GFP-RAB7 was analyzed in live-cell microscopy. Scale bar = 10 μm. Regions of interest (squares) are shown at 5x magnification. Note the accumulation of highly vacuolated GFP-RAB7-positive vesicles in shSPOPL-expressing cells. (C) HeLa cells stably expressing GFP-RAB9 from the Dox-inducible promoter were transfected with siControl or siRNA depleting SPOPL for 72 hr. GFP-RAB9 was monitored by live cell imaging. Scale bar = 10 μm. Regions of interest (squares) are shown at 5x magnification. (D) HeLa cells were transfected with control siRNA (siControl) or siRNA depleting SPOPL (siSPOPL) for 72 hr. Total cell extracts were analyzed by immunoblotting directly (left panel) or after purification of endosomal organelles by differential centrifugation followed by fractionation on a 5 – 20% OptiPrep gradient (right panel, fractions 1–12). Cellular organelles detected by the specific antibodies are marked.
Figure 3 with 1 supplement
CRL3SPOPL targets EPS15 for proteasome-dependent degradation.
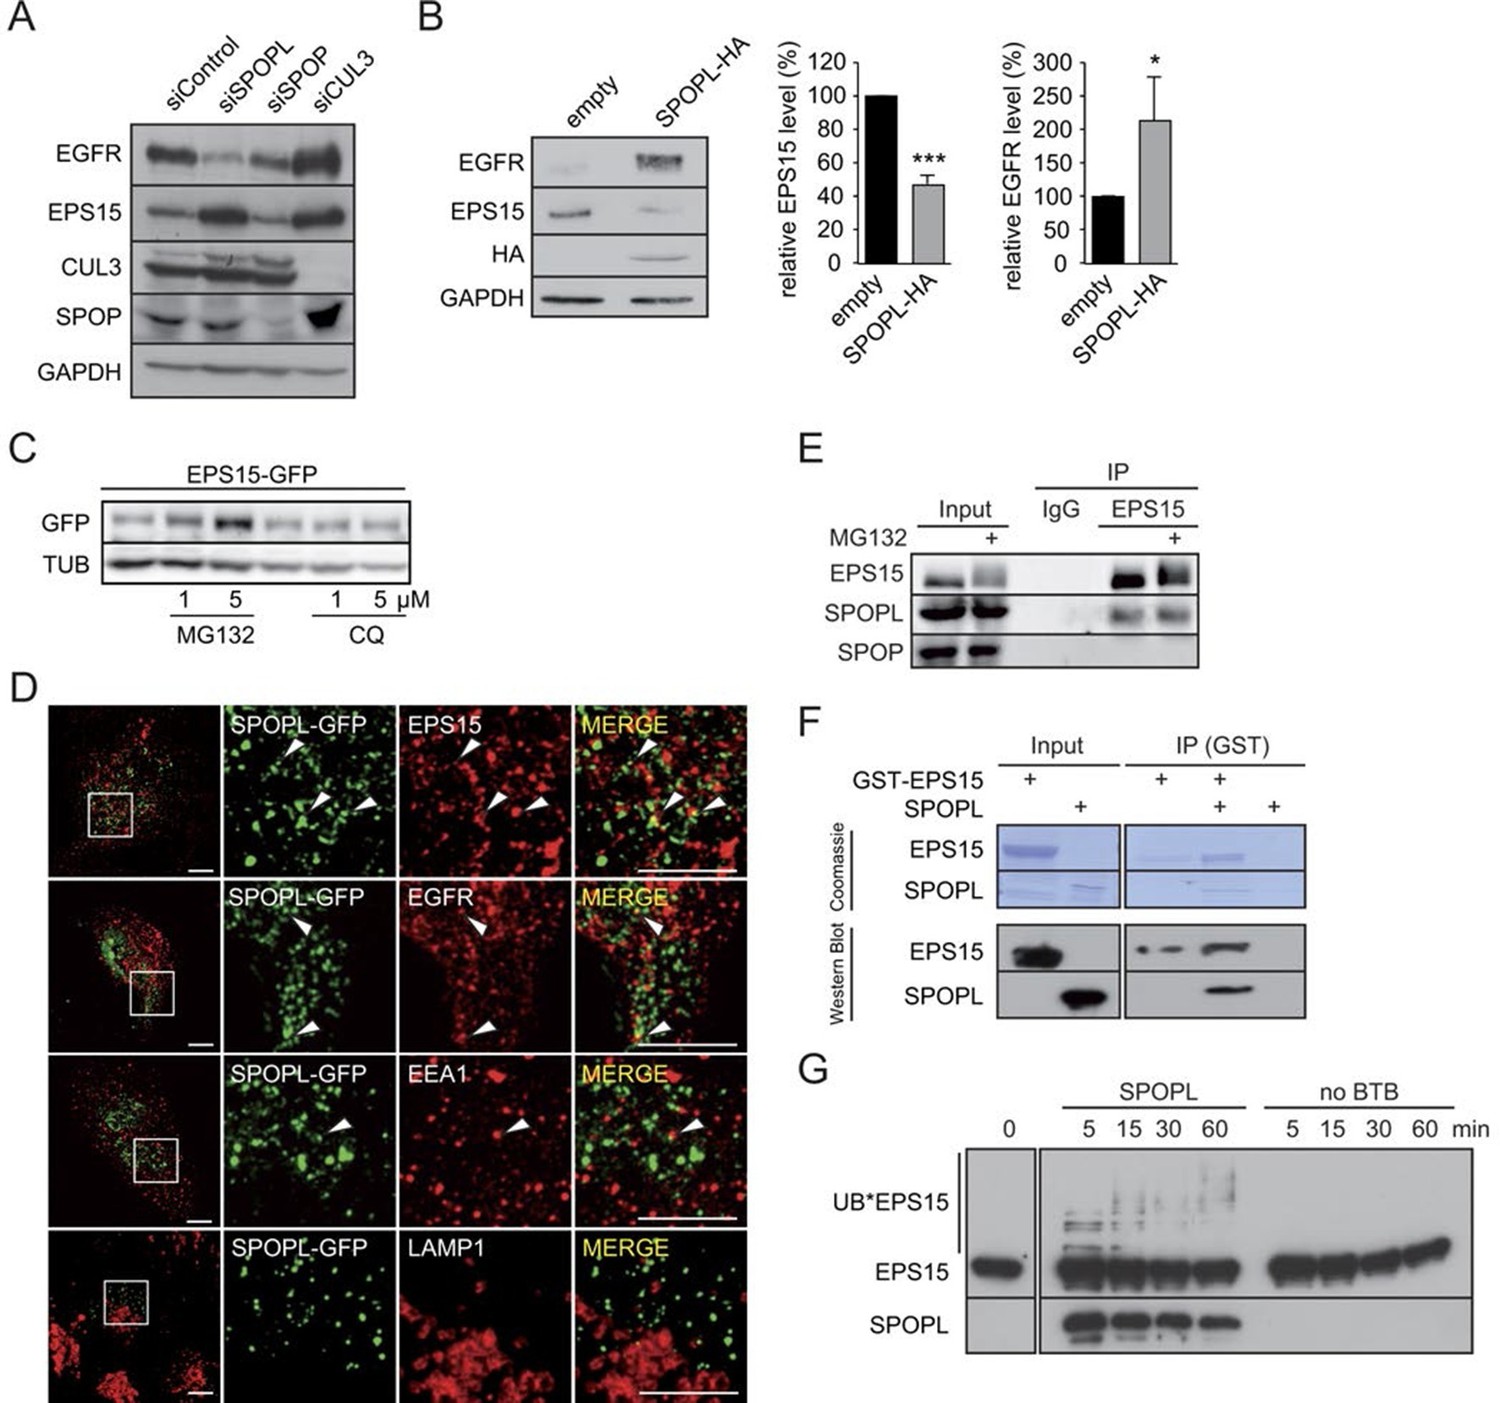
(A) Total cell extracts prepared from HeLa cells treated with control siRNA (siControl) or RNAi oligos targeting SPOPL, SPOP or CUL3 as indicated were analyzed by immunoblotting for EGFR, EPS15, SPOP and CUL3 protein levels. GAPDH controls for equal loading. (B) Total cell extracts prepared from HeLa cells harboring an empty control plasmid (empty) or a plasmid overexpressing HA-tagged SPOPL were analyzed by immunoblotting for EGFR, EPS15 and SPOPL-HA protein levels. GAPDH controls for equal loading. EPS15 and EGFR levels were quantified by Image J. Data are mean + SD, N = 3. ***p≤0.001; *p≤0.05. (C) The levels of EPS15-GFP expressed from the doxycycline-inducible promoter were analyzed by immunoblotting of extracts prepared from HeLa cells for 40 hr with either MG132 or chloroquine (CQ). Tubulin (TUB) controls for equal loading. (D) A549 cells transiently transfected with a plasmid expressing SPOPL-GFP were treated with 10 μM MLN-4924 to stabilize SPOPL-GFP levels. After 6 hr, cells were fixed, stained with specific antibodies and analyzed by confocal immunofluorescence microscopy. Displayed are maximal projections of Z-stack acquisitions, fully covering cell height. Scale bar = 10 μm. Regions of interest (squares) are shown at 4x higher magnification. (E) Endogenous EPS15 was immunoprecipitated (IP) from HEK-293 cells using a specific antibody or unspecific IgG as control, after pretreated with 1 μM MG132 for 30 hr. EPS15 and co-precipitated proteins were eluted and analyzed by immunoblotting using specific antibodies. 40 μg of protein were loaded as input samples. (F) In vitro binding of recombinantly purified SPOPL to GST-EPS15 in GST pull-down experiments was analyzed by Coomassie staining (upper panel) and immunoblotting (lower panel), respectively. (G) In vitro ubiquitination assays. E.coli purified EPS15 and reconstituted CUL3-NEDD8-RBX1 were incubated at 37°C using UBE2R1 (CDC34) as the E2-enzyme and in the presence of SPOPL or without BTB adaptor (no BTB). Aliquots were taken at the indicated time points (minutes) and the presence of EPS15 and SPOPL was analyzed by immunoblotting. UB*EPS15 marks the appearance of ubiquitinated EPS15.
Figure 3—figure supplement 1
CRL3SPOPL targets EPS15 for proteasome-dependent degradation.
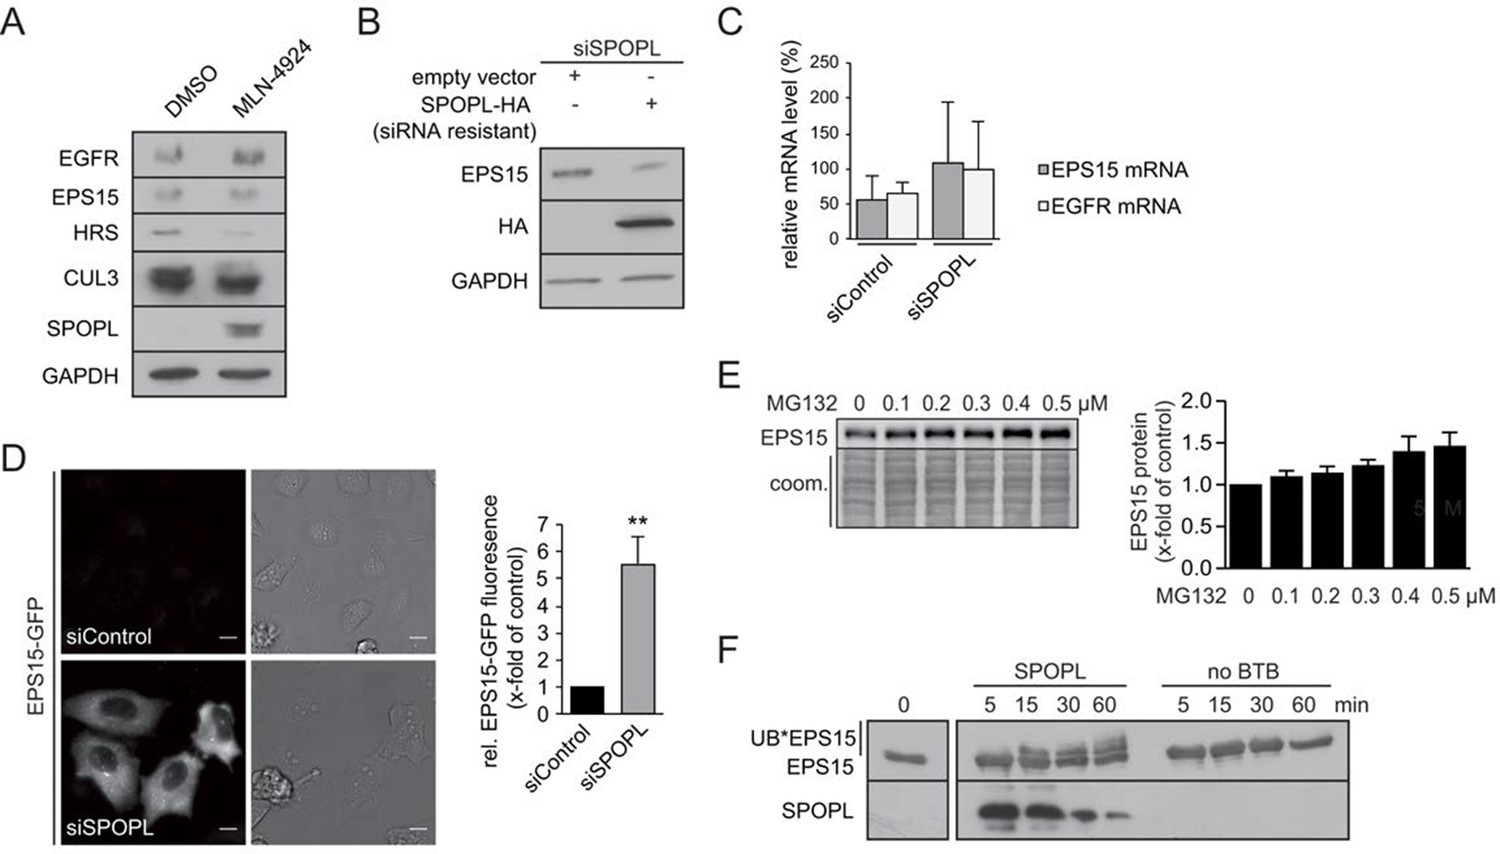
(A) Total cell extracts prepared from HeLa cells treated for 24 hr with DMSO or 10 µM MLN-4924 were analyzed by immunoblotting with specific antibodies recognizing the indicated proteins. The activity of the inhibitor is visible by the reduced levels of neddylated CUL3. (B) HeLa cells were simultaneously transfected with siRNA depleting endogenous SPOPL, and either an empty control plasmid or a plasmid encoding siRNA-resistant SPOPL-HA. The levels of endogenous EPS15 and SPOPL-HA were analyzed by immunoblotting. (C) mRNA expression of EPS15 and EGFR was analyzed by qRT-PCR in HeLa cells treated with siControl or siSPOPL. The relative mRNA levels compared to GAPDH are shown. Data are mean + SD, N = 3. (D) HeLa cell lines stably expressing EPS15-GFP from the inducible doxycycline-promoter were depleted of SPOPL or treated with control siRNA (siControl). EPS15-GFP was analyzed in live cell imaging. EPS15-GFP total fluorescence was plotted as fold change between control and SPOPL-depleted cells. Scale bar = 20 μm. Data are mean + SD, n = 20 cells per sample, N = 3. **p≤0.01. (E) A549 cells were treated with indicated concentrations of MG132 for 40 hr while being kept in OptiMEM reduced serum medium instead of full medium. Afterwards cell lysates were prepared and analyzed by immunoblotting (left side). Quantification of three independent experiments is shown on the right. Data are mean + SEM, N = 3 (F) In vitro ubiquitination assays with E.coli purified EPS15 and reconstituted CUL3-NEDD8-RBX1 in the presence of SPOPL or without BTB adaptor. The reactions were incubated at 37°C using UBE2D1 (UBCH5) as the E2-enzyme. EPS15 and SPOPL were analyzed by immunoblotting. Note the appearance of slower migrating EPS15 forms, representing mono- and di-ubiquitination of EPS15 by the CRL3SPOPL complex in vitro.
Figure 4 with 1 supplement
EPS15 is targeted via a SPOP/SPOPL binding consensus motif.
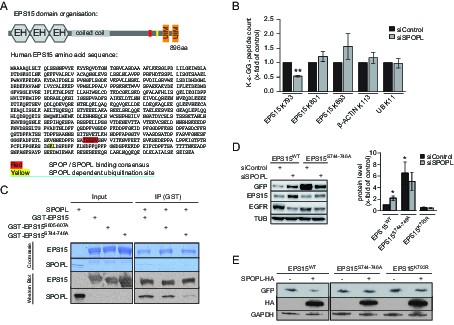
(A) Cartoon of human EPS15 domain-organization and the amino-acid sequence. Indicated by color code are the SPOP/SPOPL binding site (red) and the lysine residue (yellow), which is ubiquitinated in a CRL3SPOPL–dependent manner in vivo. In addition, the amino-terminal Ca2+-binding EF-hand motifs (EH), the coiled-coil domain involved in dimerization and the two carboxy-terminal ubiquitin-interacting motifs (UIMs) involved in ubiquitin-binding are indicated. (B) EPS15 ubiquitin-profiling. Peptides containing EPS15 modification sites were quantified with LC-MS/MS after enrichment of the K-ε-GG motif from whole cell digests of HeLa cells treated with siSPOPL or siControl. Normalized precursor mass intensity profiles for EPS15 sites corresponding to K793, K801 and K693 are shown (raw data in Figure 4—figure supplement 1B). Quantification of the β-Actin K113 and the polyubiquitin K11 linkage peptide control for comparable enrichment. Data are mean ± SD, N = 3. **p≤0.01. (C) Purified SPOPL was incubated as indicated with GST-tagged wild-type EPS15 or GST-EPS15 mutants, where the predicted SPOPL binding motifs have been mutated individually (GST-EPS15S605-S607A and EPS15S744-S746A, respectively), pulled down with glutathione sepharose (IP [GST]) and bound proteins were analyzed by Coomassie blue staining (upper panel) and immunoblotting (lower panels). Note that SPOPL readily binds to GST-EPS15 and GST-EPS15S605-S607A, but this interaction is strongly reduced with the GST-EPS15S744-S746A mutant. (D) HeLa cells stably expressing GFP-tagged wild-type EPS15, the EPS15S744-S746A or the EPS15K793R mutants from a doxycycline-inducible promoter were transfected as indicated (+) with control siRNA or siRNA depleting SPOPL. The levels of EPS15-GFP, EGFR and for control tubulin (TUB) were analyzed by immunoblotting with specific antibodies. Experiments were quantified in Fiji and the EPS15 levels plotted as fold-increase compared to controls. Data are mean ± SEM, N = 4. *p≤0.05. Note that SPOPL depletion does not further increase the levels of both EPS15 mutants. (E) Total cell extracts were prepared from HeLa cells expressing either GFP-tagged wild-type, the EPS15S744-S746A mutant or the EPS15K793R mutant in the presence (+) or absence (-) of HA-tagged SPOPL overexpression. The levels of EPS15-GFP, SPOPL-HA and control GAPDH were analyzed by immunoblotting. Note that overexpression of SPOPL-HA is able to induce degradation of wild-type but not the EPS15S744-S746A-GFP or the EPS15K793R-GFP mutant.
Figure 4—figure supplement 1
EPS15 is targeted via a SPOP/SPOPL binding consensus motif.
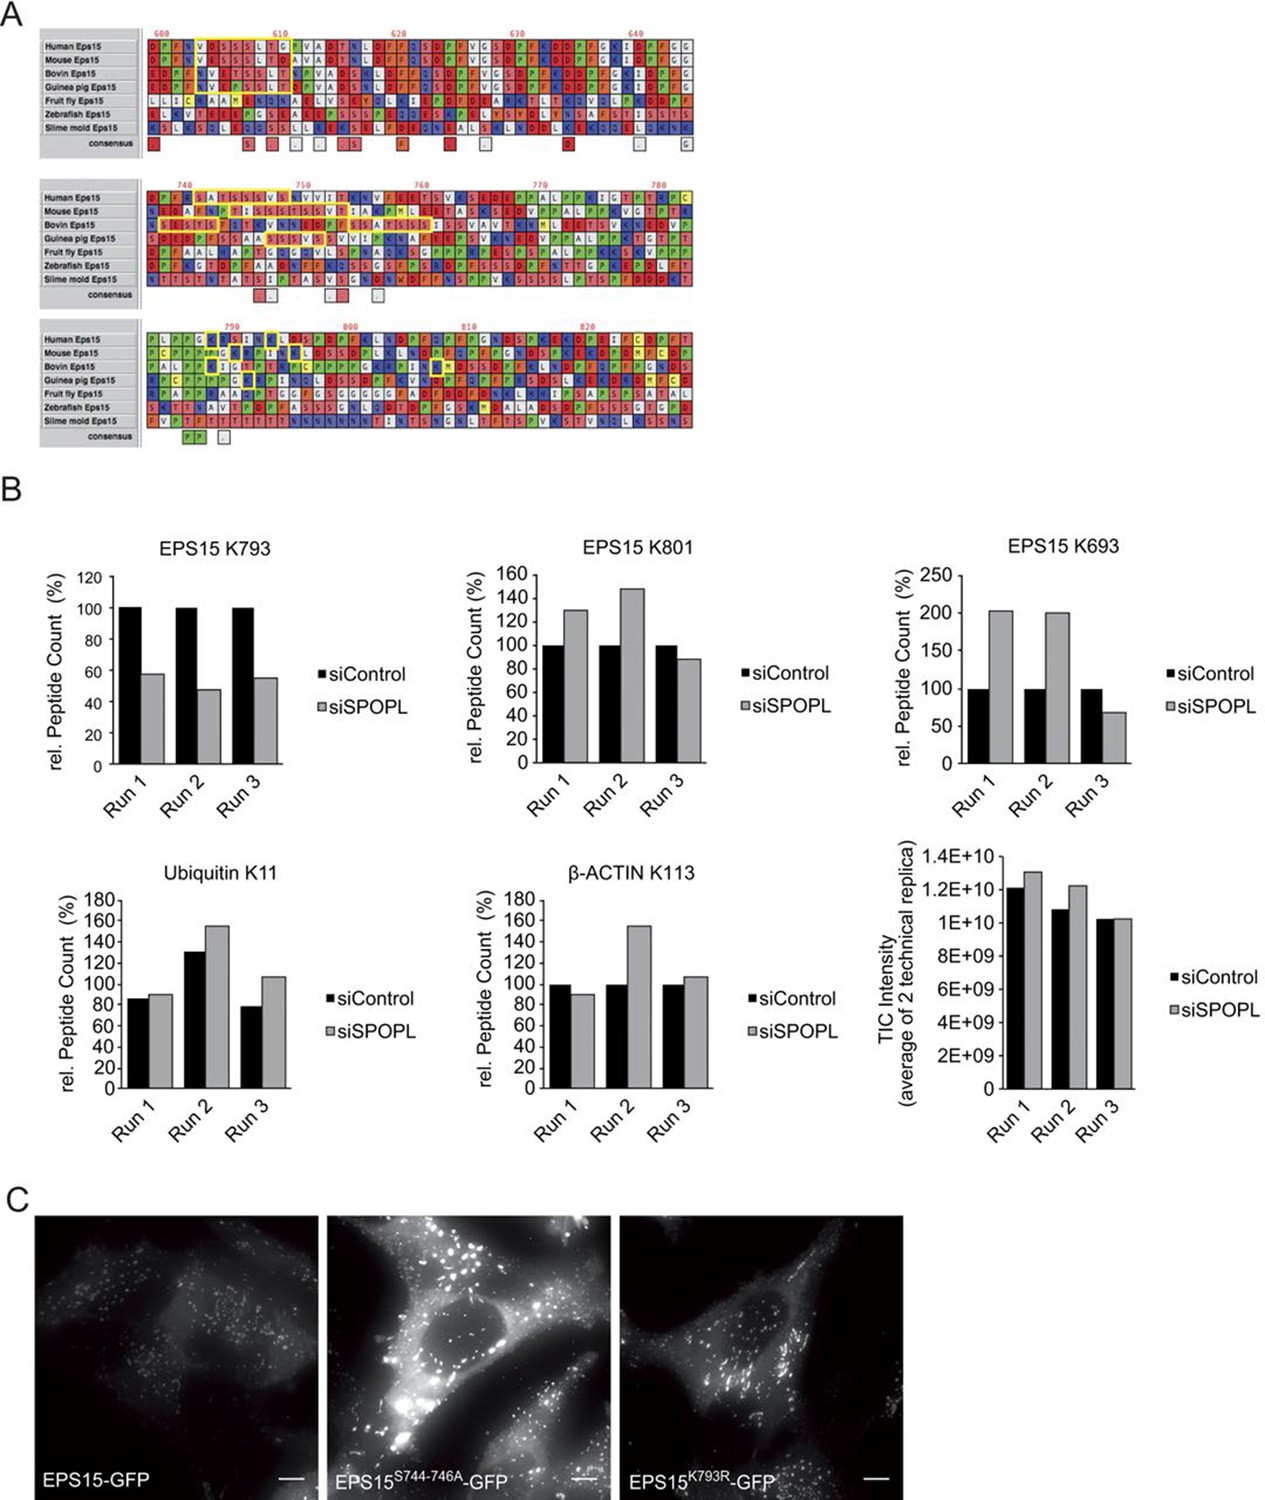
(A) Alignments of the carboxy-terminal domains of EPS15 proteins from various species. Conserved SPOPL-binding motifs and putative ubiquitination sites are highlighted by yellow boxes. (B) Peptides containing EPS15 modification sites were quantified with LC-MS/MS after enrichment of the K-ε-GG motif from whole cell HeLa digests treated with siSPOPL and siControl. Raw intensities for each of the triplicate LC-MS/MS runs are shown with each of the siControl conditions scaled to 100% intensity. Normalized precursor mass intensity profiles for EPS15 sites corresponding to K793, K801 and K693 are shown, with only K793 showing significant downregulation in the depletion condition. Quantification of a peptide corresponding to β-Actin K113 and the poly-ubiquitin K11 linkage peptide is also shown to demonstrate that enrichment variations did not influence the quantification of the EPS15 sites. Additionally, the total ion chromatographic intensities for each run are plotted to provide insight into the consistency of each of the separate experiments performed on different days. Data are mean ± SD, N = 3. (C) HeLa cell lines stably expressing wild-type EPS15-GFP, the EPS15S744-746A-GFP mutant or the EPS15K793R-GFP mutant from the inducible doxycycline-promoter were treated with doxycycline for 3 days, and analyzed by live cell imaging. Displayed are maximal projections of Z-stack acquisitions, fully covering cell height. Scale bar = 10 μm.
Figure 5 with 1 supplement

Ubiquitination of EPS15 by SPOPL regulates EGFR sorting and degradation.
(A) HeLa cells transfected with control siRNA (siControl) or siRNA depleting SPOPL (siSPOPL) were serum-starved for 20 hr and treated with EGF (200 ng/μl) for the indicated times (minutes). EGFR levels and ubiquitination were analyzed in total cell extracts by immunoblotting. TUB controls for equal loading. EGFR levels were plotted as fold-increase compared to basal levels against the time of EGF treatment (right panel). Data are mean ± SEM, N = 5. *p≤0.05. (B) SPOPL-depleted HeLa cells were serum-starved for 20 hr, and pre-treated or not for 30 min with 20 μM chloroquine (CQ). EGF (200 ng/μl) was then added, and EGFR levels analyzed by immunoblotting of total cell extracts prepared at time 0 or after 60 min. TUB controls for equal loading. (C) Total cell extracts were prepared from HeLa cells induced (+) or not (-) to express GFP-tagged EPS15 from the doxycycline (Dox)-inducible promoter and treated with control or SPOPL siRNAs. The levels of EGFR, EPS15-GFP and for control GAPDH were analyzed by immunoblotting. EGFR levels were quantified in Image J. Data are mean + SD, N = 3. (D) Total cell extracts prepared from HeLa cells treated for 3 days with control siRNA or RNAi oligos targeting EPS15 and SPOPL, individually and together, were analyzed by immunoblotting for EGFR and EPS15 protein levels. Equal loading was controlled by immunoblotting for GAPDH. (E) Cells transfected with control siRNA (siControl) or siRNA depleting SPOPL (siSPOPL) were analyzed by indirect immunofluorescence for EPS15 (red) and HRS (green) using super resolution microscopy (SRM) in structured illumination mode. Maximal projection is shown (left panel). Scale bar = 5 μM. The squares are shown at 5x higher magnification in the insets. Co-localization of EPS15 and HRS as well as the number and size of EPS15-positive endosomes was quantified using Fiji (right graphs). Data are mean ± SEM, 20 > n < 10, N = 4; *p≤0.05; **p≤0.01. (F) Cell extracts were prepared from HeLa cells 72 hr after transfection with control siRNA or siRNA targeting SPOPL (siSPOPL), and incubated with control IgG or antibodies against HRS. Co-precipitated proteins (IP) were eluted and analyzed by immunoblotting (IB) for the presence of HRS and EPS15. 40 μg of protein extract was loaded as input samples (left side). The input and IP protein levels were quantified using ImageJ (right side). Data are mean ± SEM, N = 6.
Figure 5—figure supplement 1
Ubiquitination of EPS15 by SPOPL regulates EGFR sorting and degradation.
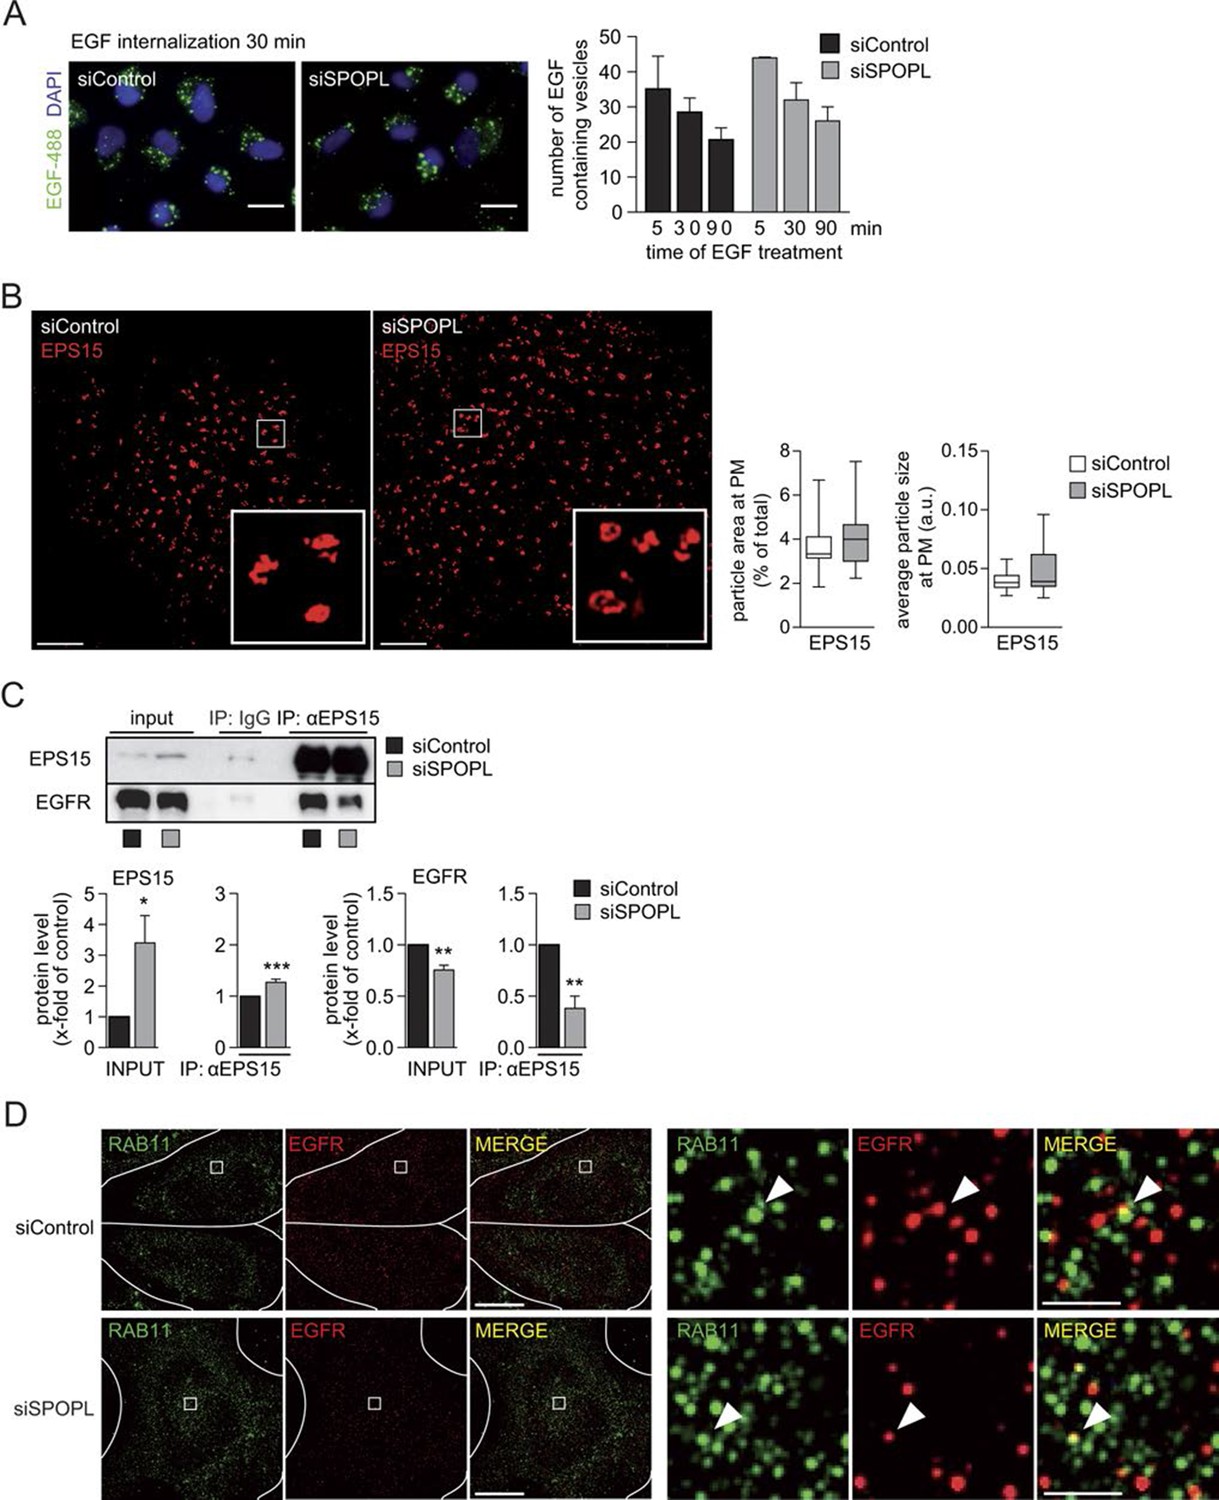
(A) A549 cells were treated with siControl or siSPOPL and starved of growth factors. After 1 hr binding at cold and washing, Alexa488 labeled EGF was allowed to be internalized for indicated times (minutes), and the EGF-positive vesicles were counted. Scale bar = 20 μm. Data are mean + SD, n > 500 cells per sample, N = 3. (B) HeLa cells treated with siControl or siSPOPL were stained for EPS15 by indirect immunofluorescence and analyzed by super-resolution microscopy as described in the legend of Figure 5E. Instead of maximal projections, the image shows a single acquisition layer taken at the very bottom of the cell to specifically visualize the size of EPS15-positive patches at the plasma membrane. Scale bar = 5 μm. Regions of interest (squares) are shown at 5x magnification. The EPS15 particle area and particle size were quantified by Fiji, n = 10 cells per sample, N = 3. (C) Cell extracts prepared from HeLa cells treated for 72 hr with siControl oligos or siSPOPL were immunoprecipitated with control IgG or antibodies against EPS15. The immunoprecipitate (IP) was analyzed by immunoblotting (IB) for the presence of EGFR and EPS15 (upper panel). Appropriate expression of the analyzed proteins was examined by immunoblotting an aliquot of the cell extract (input). The input protein levels and proteins co-immunoprecipitated with EPS15 antibodies were quantified (lower panels). Data are mean ± SEM, N = 3. *p≤0.05; **p≤0.01. (D) HeLa cells treated for 72 hr with siControl (upper row) or siSPOPL (lower row) were stained by indirect immunofluorescence for RAB11 (green) and EGFR (red) and analyzed by super-resolution microscopy in structured illumination mode. The individual images were overlaid to visualize co-localization (MERGE). Scale bar = 10 μm. Regions of interest (squares) are shown at 8x higher magnification on the right. Scale bar = 1 μm. The arrow head marks a recycling vesicle positive for EGFR and RAB11. Note that the number of recycling vesicles is not significantly altered in SPOPL-depleted cells.
Figure 6
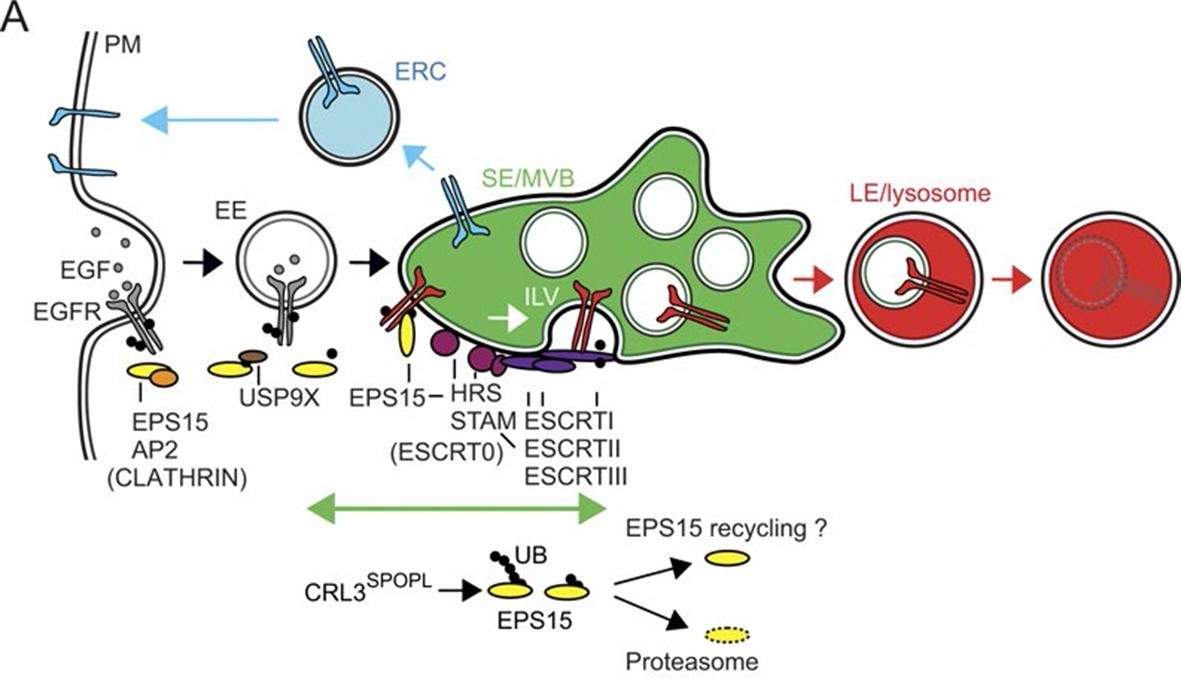
CRL3SPOPL ubiquitinates EPS15 at endosomes EPS15 and thereby regulates EGFR sorting and lysosomal degradation.
Schematic model depicting the major EGFR trafficking routes and highlighting possible roles of EPS15 ubiquitination by CRL3SPOPL at endosomes. EGFR is internalized at the plasma membrane by clathrin-mediated and clathrin-independent endocytosis, which involves recognition of the ubiquitinated receptor by EPS15. EGFR is then either recycled back to the plasma membrane via the endocytic recycling compartment (ERC), or targeted for degradation into late endosomes (LE)/lysosomes after its uptake into sorting endosomes (SE)/ multivesicular bodies (MVBs) by the ESCRT machinery. Loss of CRL3SPOPL activity results in enhanced EGFR sorting into the degradative pathway, suggesting that CRL3SPOPL-mediated ubiquitination of EPS15 at endosomes delays EGFR trafficking to lysosomes. For further explanation, see text.
Author response image 1
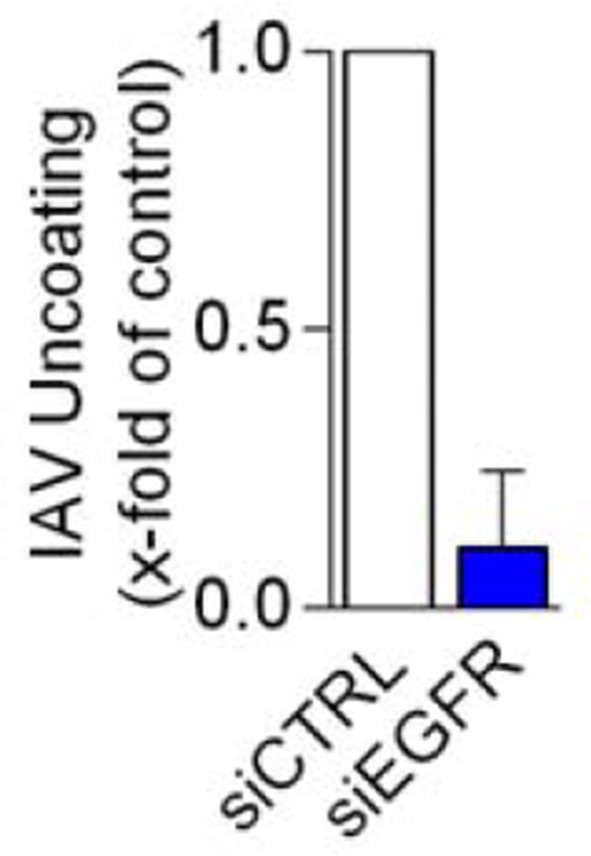
EGFR depletion inhibits influenza A virus uncoating.
https://doi.org/10.7554/eLife.13841.015
Author response image 2
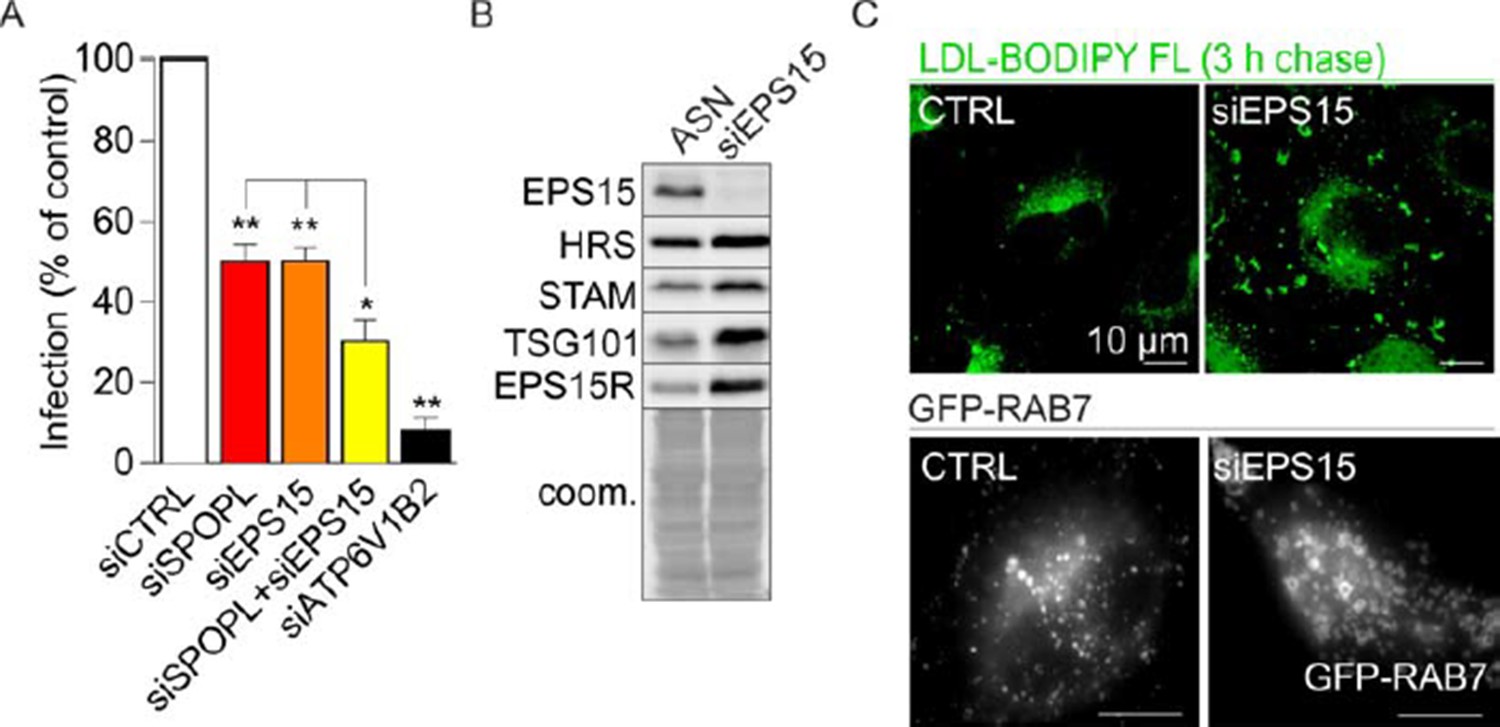
EPS15 depletion affects late endosomal maturation.
(A) Co-depletion of SPOPL an EPS15 has an additive effect on influenza A virus infection. (B) EPS15 depletion stabilizes ESCRT components HRS, STAM and TSG101. (C) EPS15 depletion affects LDL uptake in cells resulting in an accumulation of LDL in enlarged vacuoles (upper panel). Late endosomes, visualized by life-cell microscopy of GFP-RAB7, are enlarged in cells depleted of EPS15 (lower panel).
Additional files
-
Supplementary file 1
siRNA screen identifies BTB domain containing proteins relevant for IAV infection.
A549 cells were depleted of individual BTB domain containing proteins by using up to 4 different siRNAs in a 96-well plate setting. After 72 hr of transfection cells were infected with IAV. Infected cells were visualized by immunofluorescence staining of the viral protein NP. The assay was quantified as described in the legend to Figure 1 and plotted as percentage (%) of NP positive cells compared to control (siControl). BTB domain containing proteins were counted as a hit, if IAV infection was reduced with at least 2 different siRNAs by 49% or more compared to siControl.
- https://doi.org/10.7554/eLife.13841.014
Download links
A two-part list of links to download the article, or parts of the article, in various formats.
Downloads (link to download the article as PDF)
Open citations (links to open the citations from this article in various online reference manager services)
Cite this article (links to download the citations from this article in formats compatible with various reference manager tools)
A SPOPL/Cullin-3 ubiquitin ligase complex regulates endocytic trafficking by targeting EPS15 at endosomes
eLife 5:e13841.
https://doi.org/10.7554/eLife.13841


