Secretion of protein disulphide isomerase AGR2 confers tumorigenic properties
- ERL440 Inserm, Université de Rennes 1, France
- Centre de Lutte Contre le Cancer Eugène Marquis, France
- INSERM U1218, Actions for onCogenesis understanding and Target Identification in ONcology (ACTION), France
- Bergonié Cancer Institute, France
- Université de Bordeaux, France
- University of Gothenburg, Sweden
- Hôpital Haut-Lévêque, France
- Bordeaux Recherche Intégrée en Oncologie, France
Figures
Figure 1
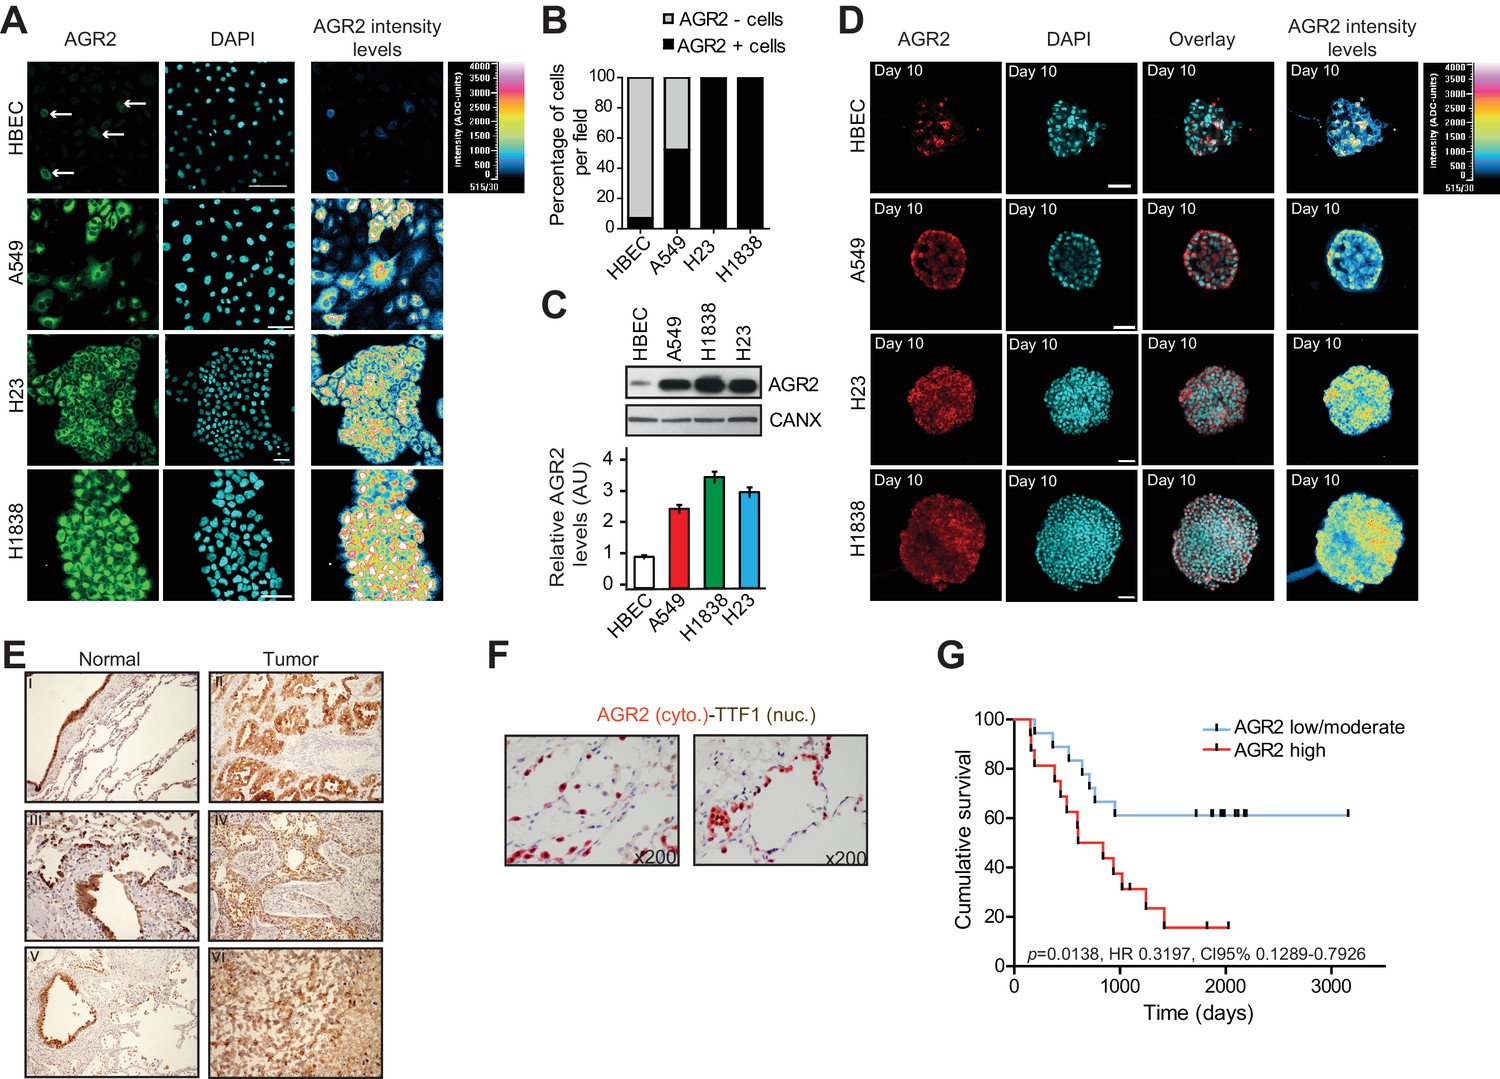
AGR2 is overexpressed in lung cancer cell lines and tumor tissues.
(A) Analysis by immunofluorescence of AGR2 expression in normal human bronchial epithelial cells (HBEC) and three lung cancer cell lines (A549, H23 and H1838) grown in 2D culture. Scale bars, 50 μm. (B) Quantification of AGR2 protein expression in cell lines according to immunofluorescence. The stacked bars show the percent contribution of high and low AGR2-positive cells relative to the total number of cells per field. (C) Expression of AGR2 protein detected by Western blot in a panel of human lung epithelial cell lines. Values correspond to three independent experiments. Data are mean ± SEM. (D) Confocal cross-sections of organoids stained with AGR2 antibody (red) and DAPI (blue) for nucleus, in normal HBECs and three lung cancer cell lines (A549, H23 and H1838). Scale bars, 50 μm. (E) AGR2 expression determined by immunohistochemistry in sections of formalin-fixed paraffin-embedded normal human lung samples and in the different lung adenocarcinoma subtypes. II = squamous cell carcinoma, IV = adenocarcinoma, VI = large cell carcinoma as compared to normal tissues (I,III,V) (x200). (F) Pulmonary lung carcinoma showing brown, nuclear immunostaining for TTF-1 expression and cytoplasmic immunostaining for AGR2 expression (dual color Multiplex TTF-1 + AGR2 immunostain; x200). (G) Kaplan-Meier survival curves of lung cancer patients. The cumulative survival was related to different levels of AGR2 expression: Group 1, low to moderately positive stains (n=17); and Group 2, strongly positive AGR2 stains (n=16), as defined in Materials and methods and Supplementary file 1A.
Figure 2 with 1 supplement
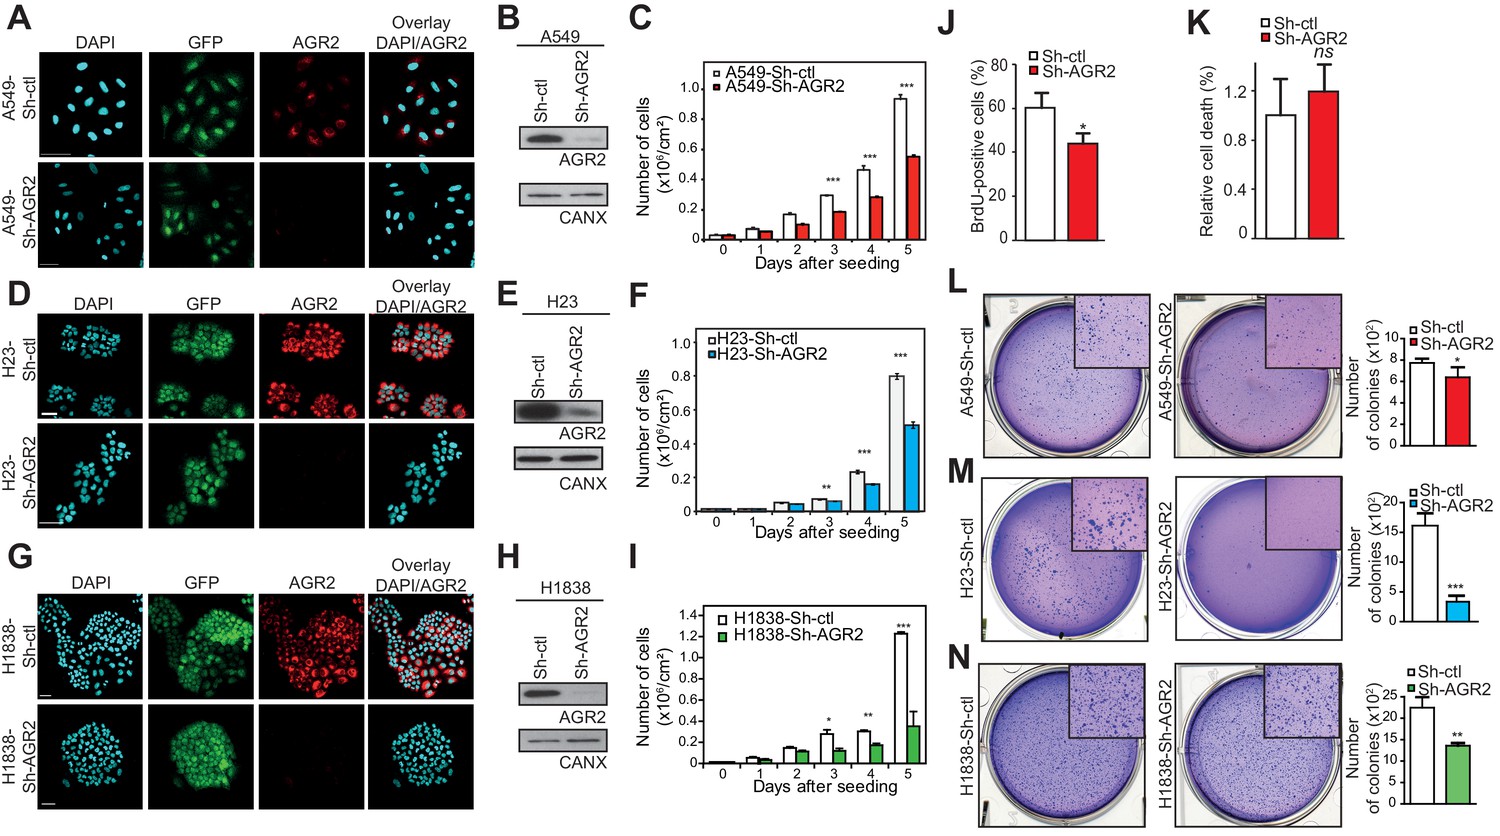
AGR2 knock down in lung cancer cells decreases cell proliferation and malignant transformation.
(A, D, G) Analysis by immunofluorescence of AGR2 depletion in our three lung cancer cell lines (A549, H23, and H1838). Scale bars, 50 μm. (B, E, H) Western blot analysis showing the down-regulation of AGR2 protein levels in control and Sh-AGR2 transfected cells. Calnexin (CANX) concentrations are shown as the loading control. One representative experiment (n = 3) is shown. (C, F, I) Growth of cells harboring Sh-ctl or Sh-AGR2 (three independent experiments). Data are mean ± SEM. (J) Quantification of the percentage of BrdU positive cells. Data are presented as mean ± SEM of at least three independent experiments. *P < 0.05. (K) Quantitation of cell death in AGR2 depleted cells (Sh-AGR2). Results are representative of three independent experiments. The cell death rate was determined by Trypan blue dye-exclusion assay. n.s: not significant. (L–N) Soft agar colony formation of cells expressing Sh-ctl or Sh-AGR2. The graph shows the number of colonies (mean ± SEM.) after 3 weeks of three independent experiments. The p values (determined by Student's t test) are relative to Sh-ctl cells. *p≤0.05. **p≤0.01 and ***p≤0.001. Shown at the left are representative images of the colonies formed by each cell type.
Figure 2—figure supplement 1
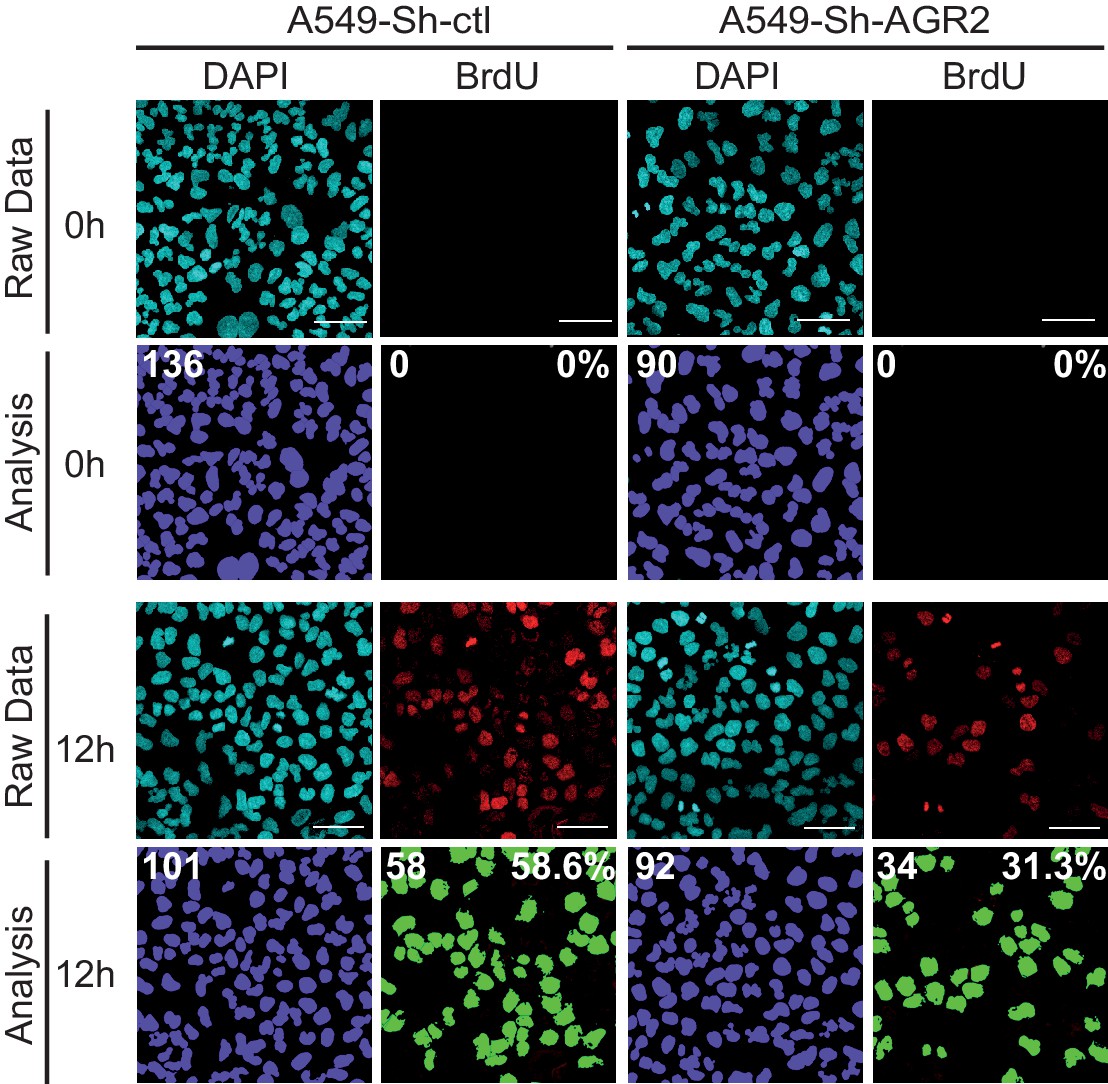
Cell proliferation on A549-Sh-AGR2 depleted cells.
Representative images of A549 control cell (Sh-ctl) and A549-Sh-AGR2 depleted cells (Sh-AGR2) stained for BrdU (red) administrated 12 hr before, and with DAPI (blue). Images were subjected to high throughput imaging (bottom panels, analysis data). After acquisition of the dataset, images were segmented by a watershed transformation to identify individual cells (bottom right). Scale bars: 100 μm.
Figure 3
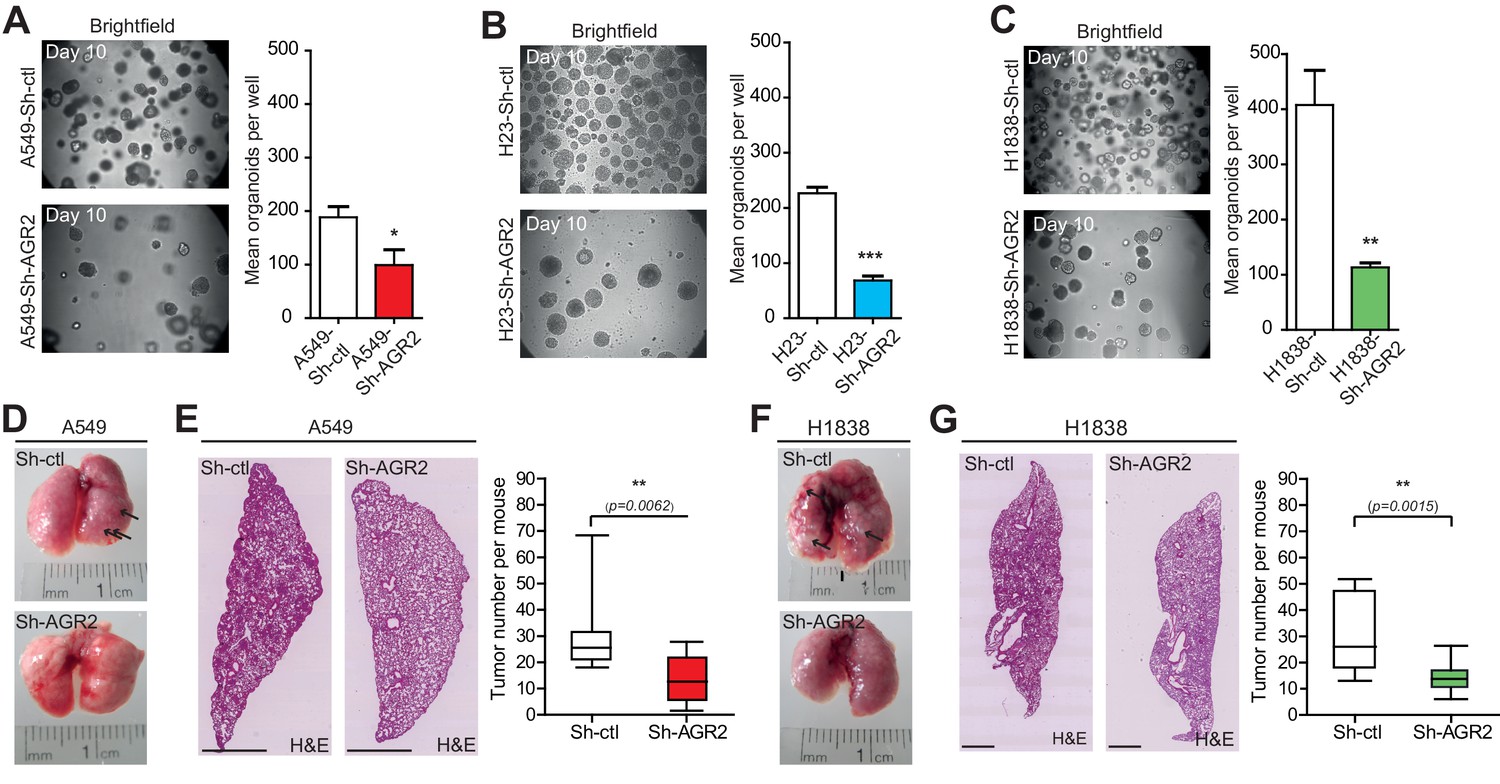
AGR2 knockdown reduces tumorigenicity and metastatic potential.
(A–C) Representative brightfield pictures of tumor organoids grown in 3D from cells harboring Sh-ctl or Sh-AGR2 (three independent experiments). The bar graph shows the mean of organoids per well (mean ± SEM.) after 10 days of culture from three independent experiments. The p values (determined by Student's t test) are relative to Sh-ctl cells. *p≤0.05. **p≤0.01 and ***p≤0.001. (D, F) Representative pictures of the lungs in mice injected with Sh-ctl cells or Sh-AGR2 cells allowed to developed tumors for 2 weeks. Note the extensive lesions (white areas) on the surface of lungs from Sh-ctl mice and the relatively normal appearance of the lungs from Sh-AGR2 mice. (E, G) Representative H&E-stained sections for lungs injected with Sh-ctl cells or Sh-AGR2 cells (montage of x5 magnification of lung sections). Scale bars, 1 mm. Box plot showing the mean number of tumors per mouse in Sh-ctl (n=6) vs Sh-AGR2 (n=6) groups. The p values (determined by Student's t test) are relative to Sh-ctl cells. **p≤0.01.
Figure 4

Enhanced cell proliferation and transformation after AGR2 overexpression in HBECs.
(A) Analysis by immunofluorescence of AGR2 overexpression in HBECs. Scale bars, 50 μm. (B) Analysis of AGR2 sub-cellular localization in infected HEBCs by immunofluorescence. Calnexin (CANX) and Bip (GRP78) are used as an ER localization control and GM130 is used as a Golgi localization control. Scale bars, 50 μm. (C) Up-regulation of AGR2 protein concentrations in control cells (HBEC-EV) and in cells infected with AGR2 (HBEC-AGR2), as analyzed by western blot. Calnexin (CANX) concentrations are shown as the loading control. One representative experiment (n = 3) is shown. (D) Growth of cells stably expressing AGR2 or empty vector (EV) (three independent experiments). Data are mean ± SEM. (E) Quantification of the percentage of BrdU positive cells. Data are presented as mean ± SEM of at least three independent experiments. **p<0.001. (F) Quantitation of cell death in AGR2 overexpression cells. Results are representative of three independent experiments. The cell death rate was determined by Trypan blue dye-exclusion assay. n.s: not significant. (G) Cell proliferation on HBEC overexpressing AGR2 cells. Representative images of control HBECs (HBEC-EV) and HBEC-AGR2 stained for BrdU (red) administrated 12 hr before, and with DAPI (blue). Images were subjected to high throughput imaging (bottom panels, analysis data). After acquisition of the dataset, images were segmented by a watershed transformation to identify individual cells (bottom right). Scale bars: 100 μm. (H) The bar graph shows the mean of organoids per well (mean ± SEM.) after 10 days of culture from three independent experiments. Shown at the left are representative images of the organoids formed by each type of cell HBEC-AGR2 and HBEC-empty vector. The p values (determined by Student's t test) are relative to empty vector infected cells. **p≤0.01 and ***p≤0.001.
Figure 5 with 1 supplement
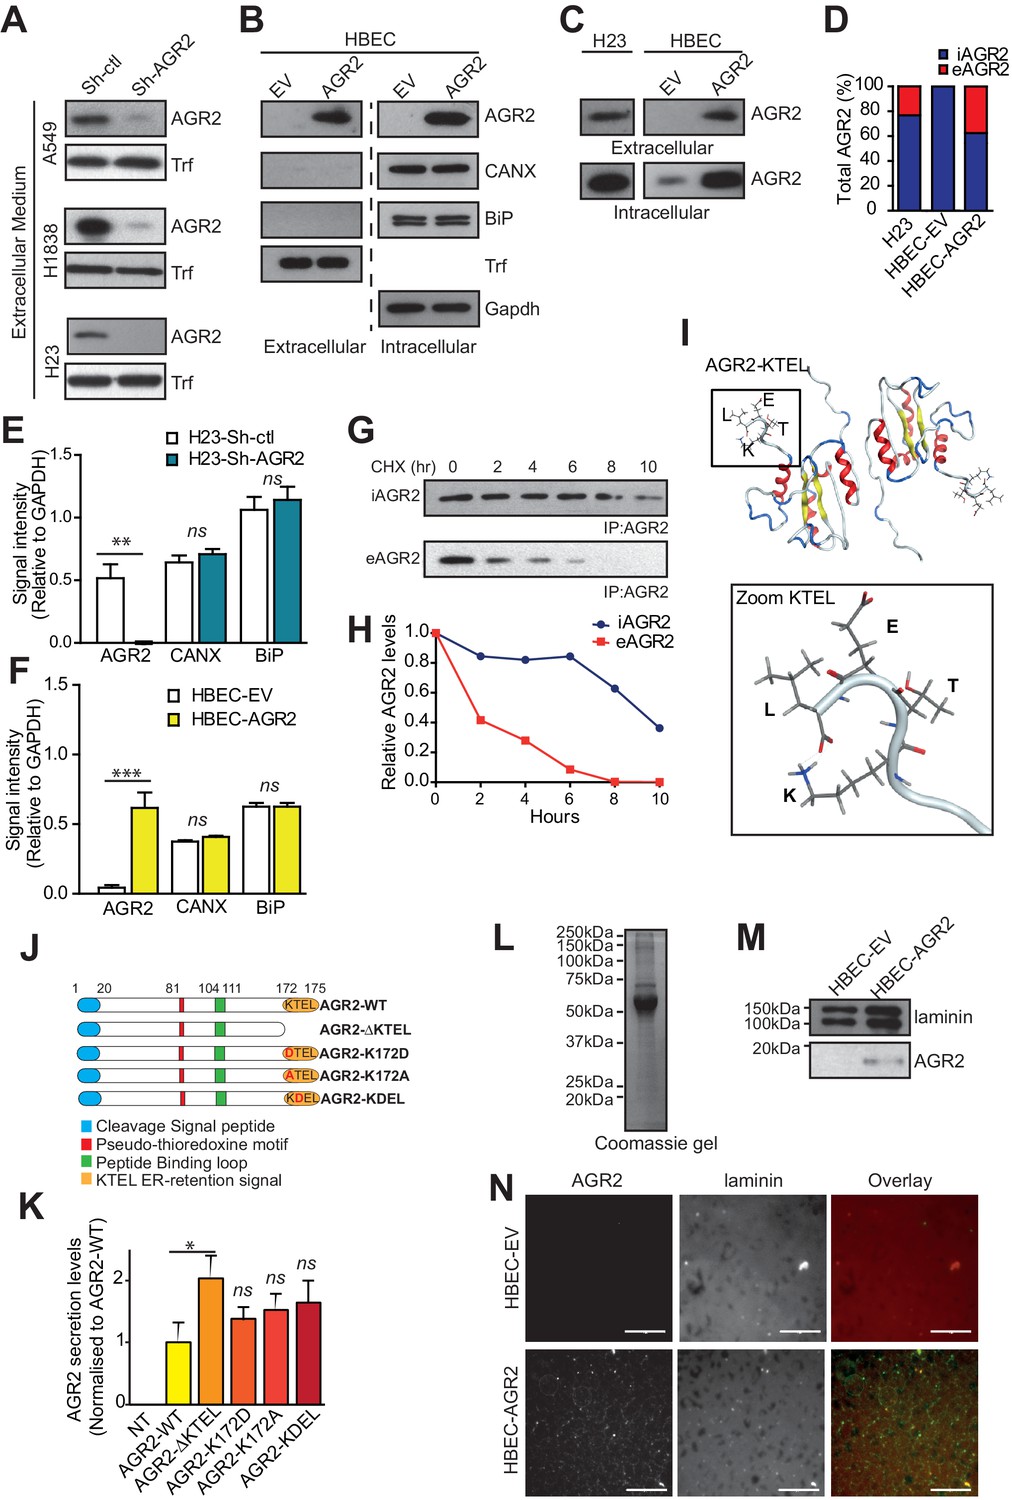
AGR2 is secreted in the extracellular medium and interacts with extracellular matrix (ECM).
(A) Proteins in the conditioned medium were subjected to immunoblotting with anti-AGR2 antibody. Transferrin (Trf) concentrations are shown as the loading control. One representative experiment (n = 3) is shown. (B) Up-regulation of AGR2 protein concentrations in extracellular and intracellular lysates of HBEC infected with either empty vector (HBEC-EV) or AGR2 (HBEC-AGR2), as analyzed by western blot. Trf concentrations are shown as the loading control for extracellular lysates and GAPDH concentrations are shown as loading control for intracellular lysates. The transmembrane protein Calnexin (CANX) and the KDEL containing protein BiP are shown as control ER-resident proteins in extracellular and intracellular lysates. One representative experiment (n = 3) is shown. (C) Levels of extracellular and intracellular AGR2 protein detected by immunoblotting in H23 organoids as compared to the levels of extracellular and intracellular AGR2 protein in HBEC organoids expressing (HBEC-AGR2) or not (HBEC-EV) AGR2. One representative experiment (n = 3) is shown. (D) The stacked bars show the relative percentage of intracellular vs extracellular AGR2. (E,F) Quantification of the relative signal intensity of AGR2 and two other ER-resident proteins (CANX and Bip) compared to GAPDH in intracellular lysates from AGR2-depleted and control H23 organoids (E) or from AGR2 overexpressing and control HBEC organoids (F). (G) H23 cells were treated with CHX (cycloheximide) for the indicated periods (hours) before cell lysates and extracellular medium were prepared as described in Materials and methods. AGR2 was immunoprecipitated in intracellular and extracellular lysates with a monoclonal AGR2-specific antibody and then detected by immunoblot analysis. (H) The densitometric quantification of the remaining protein expressed as relative to the starting amount is shown in the diagram. (I) Structure model of the KTEL motif (K172-T173-E174-L175) of AGR2, PDB ID 2LNS. The four residues (KTEL) of the ER retention motif are shown in the zoom (bottom panel). (J) Schematic representation of the AGR2 point or deletion mutants (red: thioredoxin-like domain; orange: ER-retention motif). (K) Impact of the thioredoxin-like domain and of the ER-retention motif on AGR2 secretion. Quantification of the relative amount of secreted AGR2 for all the mutants. AGR2 secretion was normalized in each experiment and is compared to control non-transfected HEK-293T cells (NT). Data are mean ± SEM. *p<0.05. (L–M) Cell-derived matrices were generated from HBEC-EV and HBEC-AGR2 cells after 8 days of culture. Proteins were solubilized, separated by SDS-PAGE and stained with Coomassie Blue (L) or immunoblotted for Laminin or AGR2 (M). (N) Cell-derived matrices from HBEC-EV and HBEC-AGR2 cells were processed for immunofluorescence, stained with anti-laminin (red) and anti-AGR2 antibodies (green) and images were collected by microscopy. Scale bars: 100 μm.
Figure 5—figure supplement 1
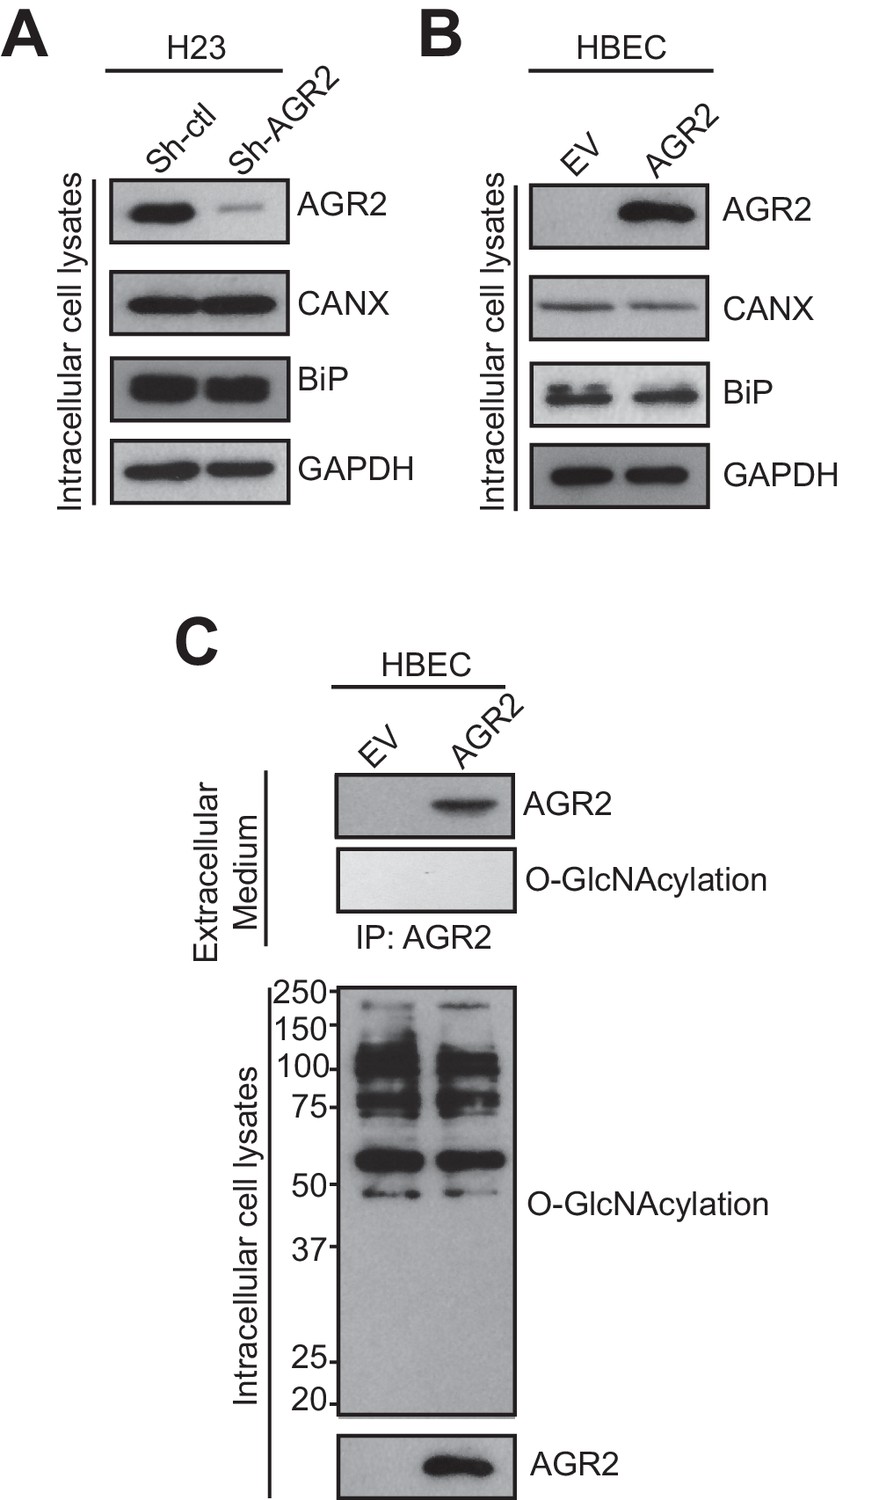
AGR2 expression does not alter the secretory pathway and AGR2 secreted is not O-GlcNacylated.
(A) Proteins in the intracellular lysate in H23 organoids silenced (Sh-AGR2) or not (Sh-ctl) for AGR2 were subjected to immunoblotting with anti-AGR2 antibody. GAPDH is shown as loading control. The transmembrane protein Calnexin (CANX) and the KDEL containing protein BiP are shown as control ER-resident proteins in intracellular lysates. One representative experiment (n = 3) is shown. (B) Proteins in the intracellular lysate in HBEC infected with either empty vector (EV) or AGR2, as analyzed by immunoblot with anti-AGR2 antibody. GAPDH concentrations are shown as loading control. The transmembrane protein Calnexin (CANX) and the KDEL containing protein BiP are shown as control ER-resident proteins in intracellular lysates. One representative experiment (n = 3) is shown. (C) Extracellular AGR2 from medium organoid lysates of HBEC organoids infected with either empty vector (EV) or AGR2 was immunoprecipitated with anti-AGR2 antibody and immunoblotted with anti-AGR2 or anti-O-GlcNAc antibodies. Intracellular organoid lysates were also probed with anti-AGR2 and anti-O-GlcNAc antibodies. One representative experiment (n = 3) is shown.
Figure 6 with 2 supplements
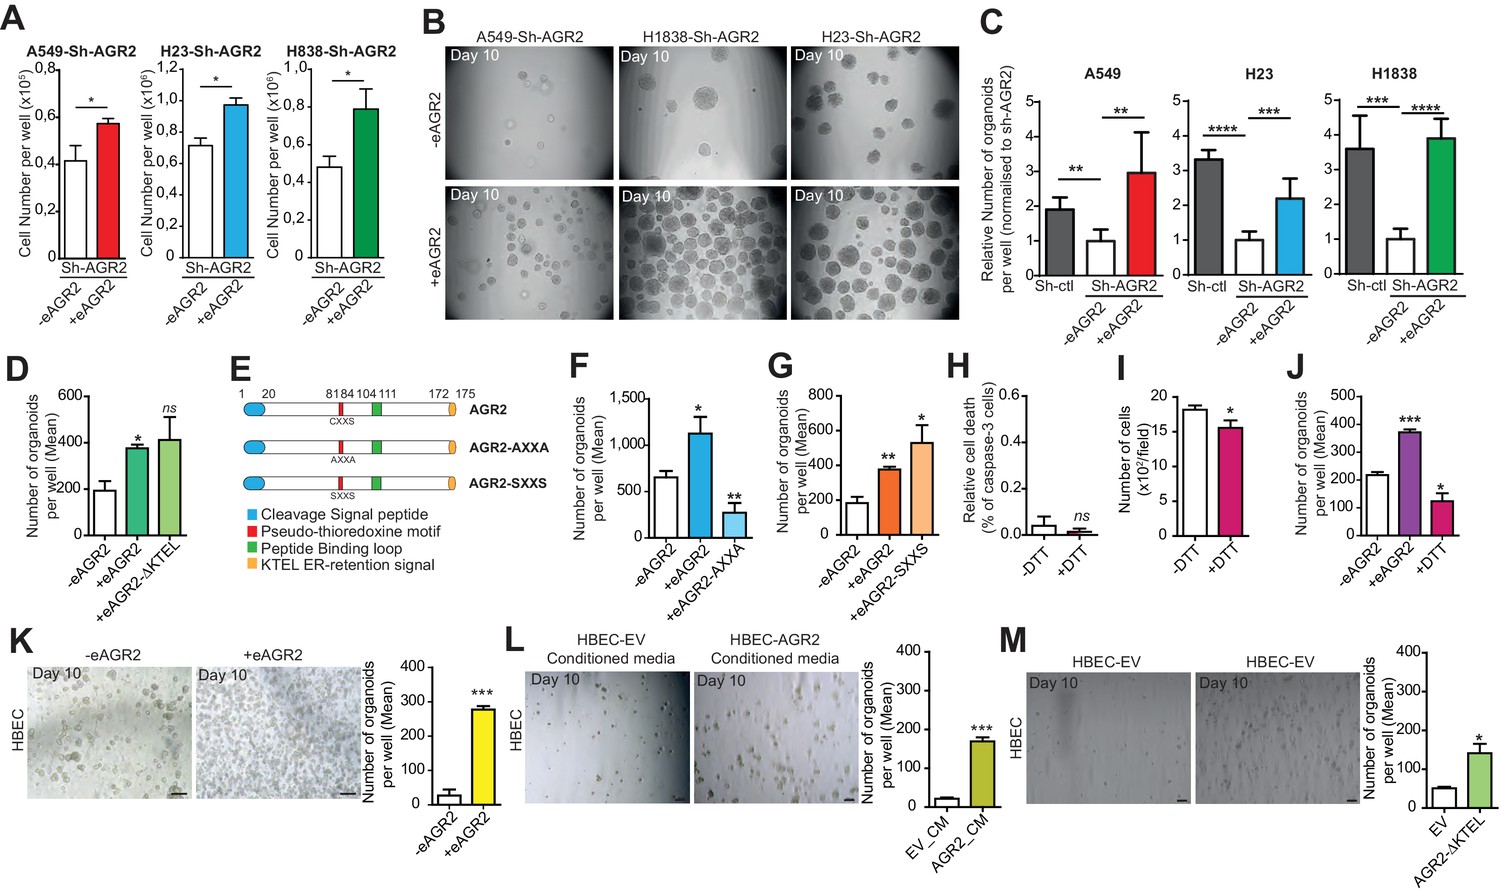
Extracellular AGR2 boosts the organoid-initiating frequency.
(A) Quantification of the numbers of cells per wells following the addition of AGR2 in the extracellular medium (+eAGR2). Data are represented as mean ± SEM of at least 3 independent experiments. *p<0.05. (B) Representative brightfield images of tumor organoids grown in 3D from cells harboring Sh-AGR2 in presence (+eAGR2) or not (-eAGR2) of AGR2 in the ECM (n = 3). (C) The bar graphs show the mean of organoids per well (mean ± SEM.), after 10 days in presence (+eAGR2) or not (-eAGR2) of AGR2 in the ECM, (n = 3). The P values are relative to untreated cells. **p≤0.01, ***p≤0.001 and ****p≤0.0001. (D) The bar graphs show the number of organoids per well in absence (-eAGR2) of AGR2 as compared to cells in presence either of AGR2-AXXA mutant (+eAGR2-AXXA) or AGR2 wt (+eAGR2). (E) Schematic representation of AGR2 showing the distribution of AGR2’s principal domains and its mutants AXXA and SXXS. (F) The bar graphs show the number of organoids per well in absence (-eAGR2) of AGR2 as compared to cells in presence either of AGR2-AXXA mutant (+eAGR2-AXXA) or AGR2 wt (+eAGR2). (G) The bar graphs show the number of organoids per well in the absence (-eAGR2) of AGR2 as compared to cells in presence either of AGR2-SXXS mutant (+eAGR2-SXXS) or AGR2 wt (+ eAGR2). (H) Quantitation of cell death in H23-Sh-AGR2 depleted cells (Sh-AGR2) in absence (-DTT) or in the presence (+DTT) of DTT. Results are representative of three independent experiments. The cell death rate was determined by the percentage of caspase-3 positive cells. n.s: not significant. (I) Growth of cells in H23-Sh-AGR2 depleted cells (Sh-AGR2) in absence (-DTT) or in presence of (+DTT) DTT (three independent experiments). Data are mean ± SEM. *p<0.05. (J) The bar graphs show the number of H23-Sh-AGR2 depleted organoids per well in absence (- eAGR2) of AGR2 as compared to cells in presence either AGR2 wt (+eAGR2) or DTT (+DTT). Data are mean ± SEM. *p<0.05 and ***p≤0.001. (K) Representative images of the organoids formed by HBEC in the presence (+eAGR2) or absence (-eAGR2) of AGR2 in the ECM. The bar graph shows the mean of organoids per well (mean ± SEM., n = 3). The p values are relative to untreated cells. ***p≤0.001. (L) Representative images of the organoids formed by HBEC in the presence of conditioned medium from HBEC-vector cells (EV_CM) or in the presence of conditioned medium from HBEC-AGR2 cells (AGR2_CM) in the ECM. The bar graph shows the mean of organoids per well (mean ± SEM., n = 3). The p values are relative to untreated cells. ***p≤0.001. (M) Representative images of the organoids formed by HBEC overexpressing AGR2-AXXA (HBEC-AGR2-AXXA) or not (HBEC-EV). The bar graph shows the mean of organoids per well (mean ± SEM., n = 3). *p<0.05.
Figure 6—figure supplement 1
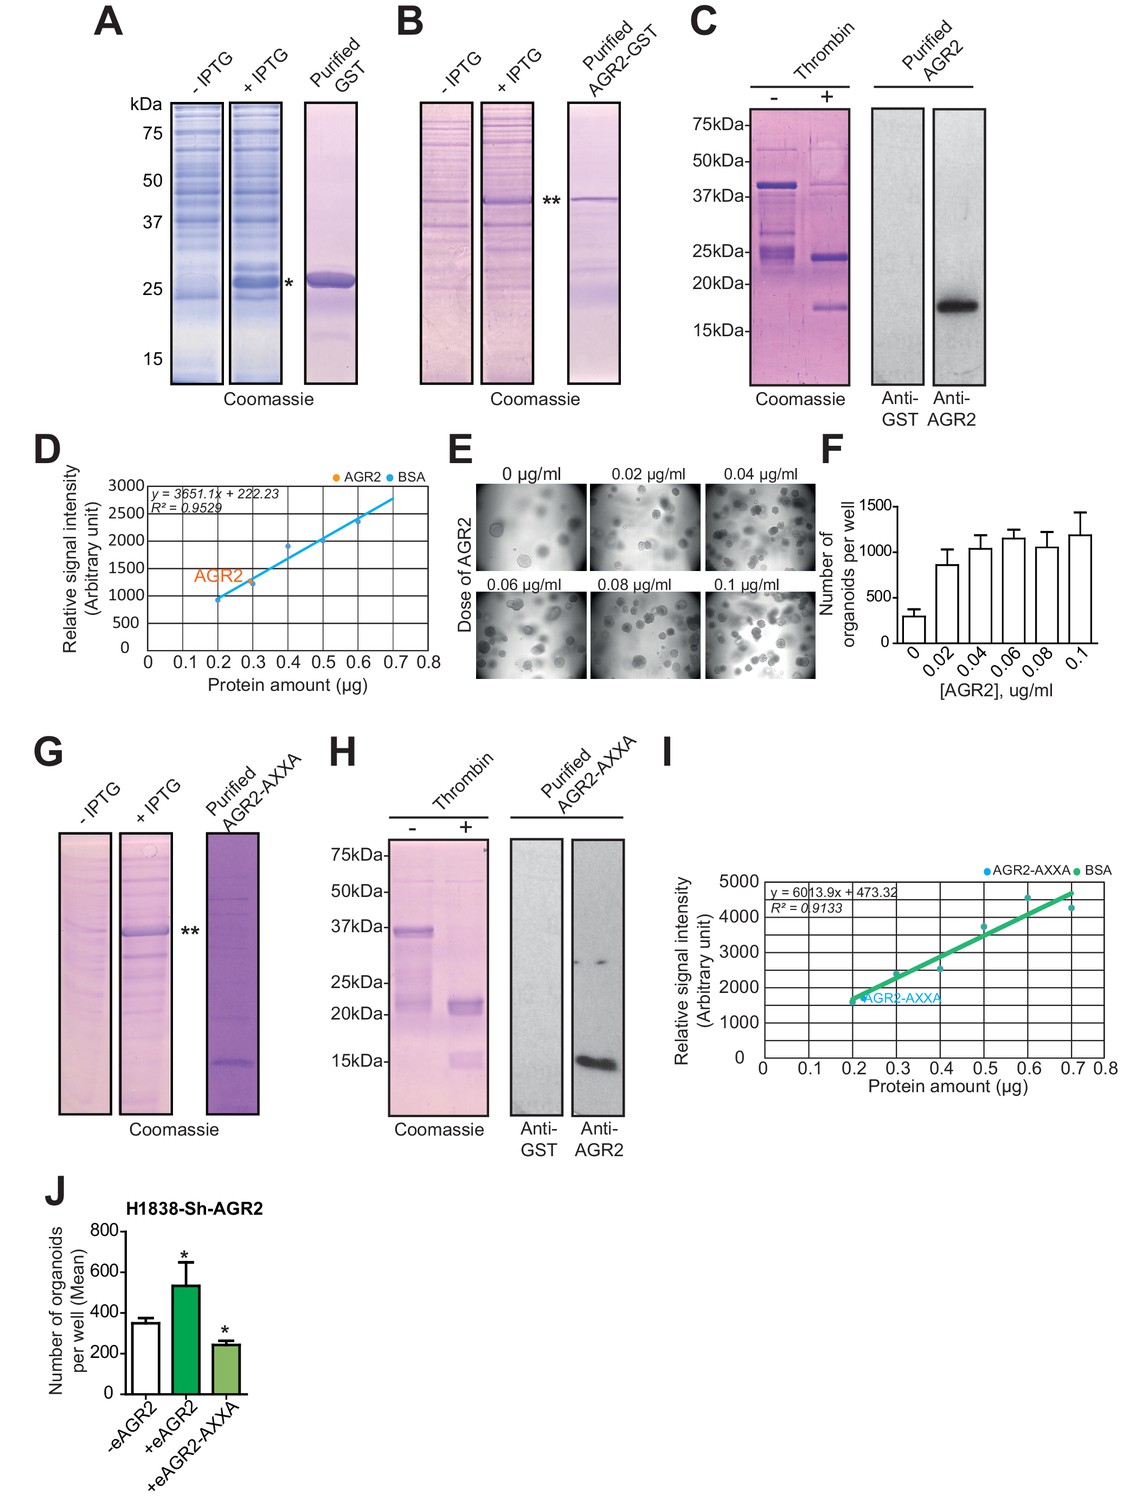
AGR2 and AGR2 thioredoxin mutant (AGR2-AXXA) purification and activity on organoids formation.
(A) Coomassie stained SDS-PAGE gel showing GST induction with IPTG (left panels) and purified GST control proteins (right panel). Asterisk (*) indicate GST product. (B) Coomassie stained SDS-PAGE gel showing GST-AGR2 induction with IPTG (left panels) and purified AGR2-GST proteins (right panel). Asterisk (**) indicate AGR2 fused to GST product. (C) Coomassie stained SDS-PAGE gel showing GST-AGR2 cleaved with thrombin (left panels) and purified AGR2 was confirmed using an anti-AGR2 or anti-GST antibody. (D) The concentration of the purified AGR2 was obtained from a Bovine serum albumin (BSA) standard curve. (E) Representative images of the organoids formed following different dose of AGR2 (+) as compared to untreated cells (-). (F) The bar graph shows the mean of organoids per well (mean ± SEM) after 10 days of culture from three independent experiments. (G) Coomassie stained SDS-PAGE gel showing AGR2-AXXA-GST induction with IPTG (left panels) and AGR2-AXXA-GST cleaved with thrombin (right panel). Asterisks (**) indicate AGR2-AXXA-GST product. (H) Coomassie stained SDS-PAGE gel showing AGR2-AXXA-GST cleaved with thrombin (left panels) and purified AGR2-AXXA was confirmed using an anti-AGR2 or anti-GST antibody. (I) The concentration of the purified AGR2-AXXA was obtained using a Bovine serum albumin (BSA) standard curve. (J) The bar graphs show the number of organoids per well in absence (-eAGR2) of eAGR2 as compared to organoids in presence either of AGR2-AXXA mutant (+eAGR2-AXXA) or AGR2 wt (+eAGR2) in H1838 Sh-AGR2 depleted cells. Data are mean ± SEM. *p<0.05.
Figure 6—figure supplement 2
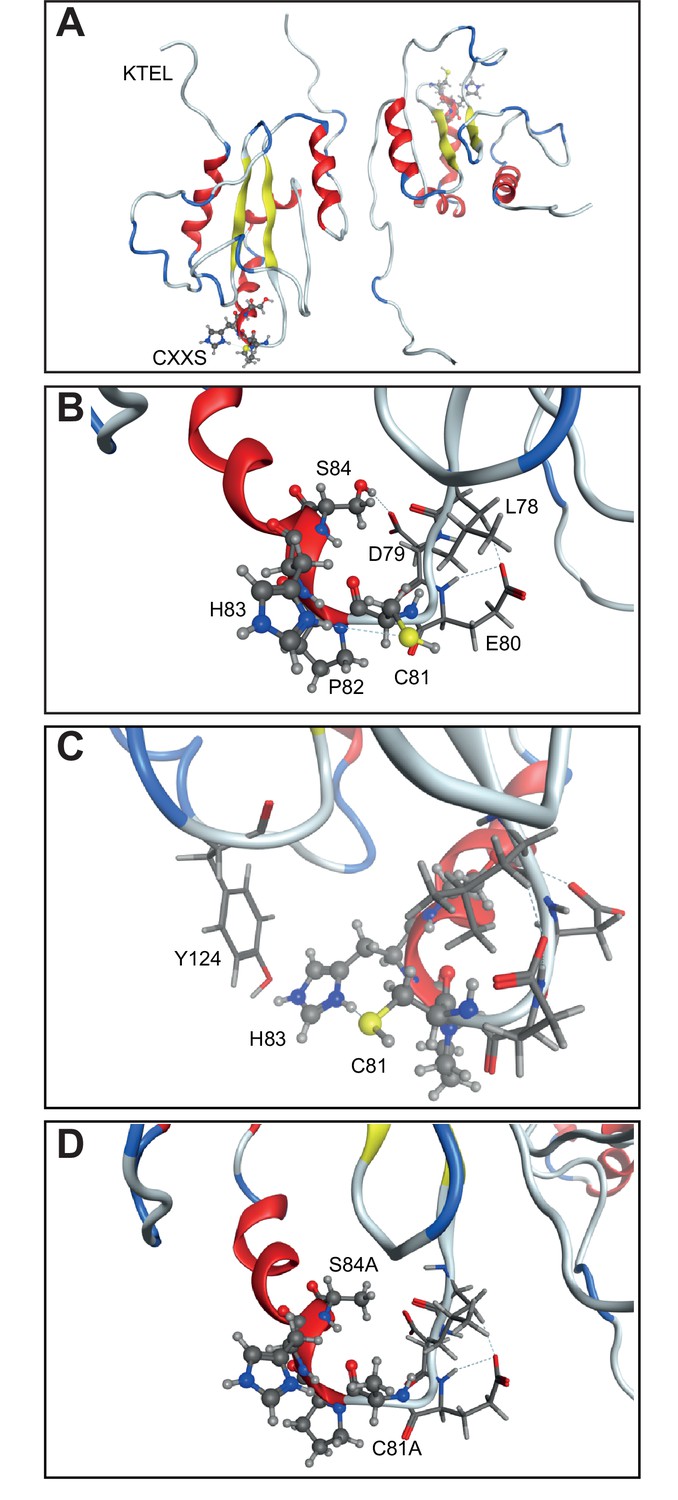
Structure model showing the CXXS (81–84) sequence.
(A) The CXXS residues (ball-and-stick model in bottom left and top right) in the AGR2 crystal structure to relate to the position of these vs the KTEL motif. (B) Zoom in of CXXS motif along with residues 78–80 (stick model). S84 forms hydrogen bonded interaction with the carboxylic acid of D79 side chain and backbone carbonyl of L78. (C) Y124 (stick model) from an adjacent loop interacts with H83, which in turn forms a hydrogen bond to C81; providing a good interaction network. (D) AXXA mutant. In silico mutation of C81 and S84 into Alanine illustrates the loss of interactions as compared to that seen in (B) between S84 and L78/D79, and in (C) between Y127-H83-C81.
Figure 7
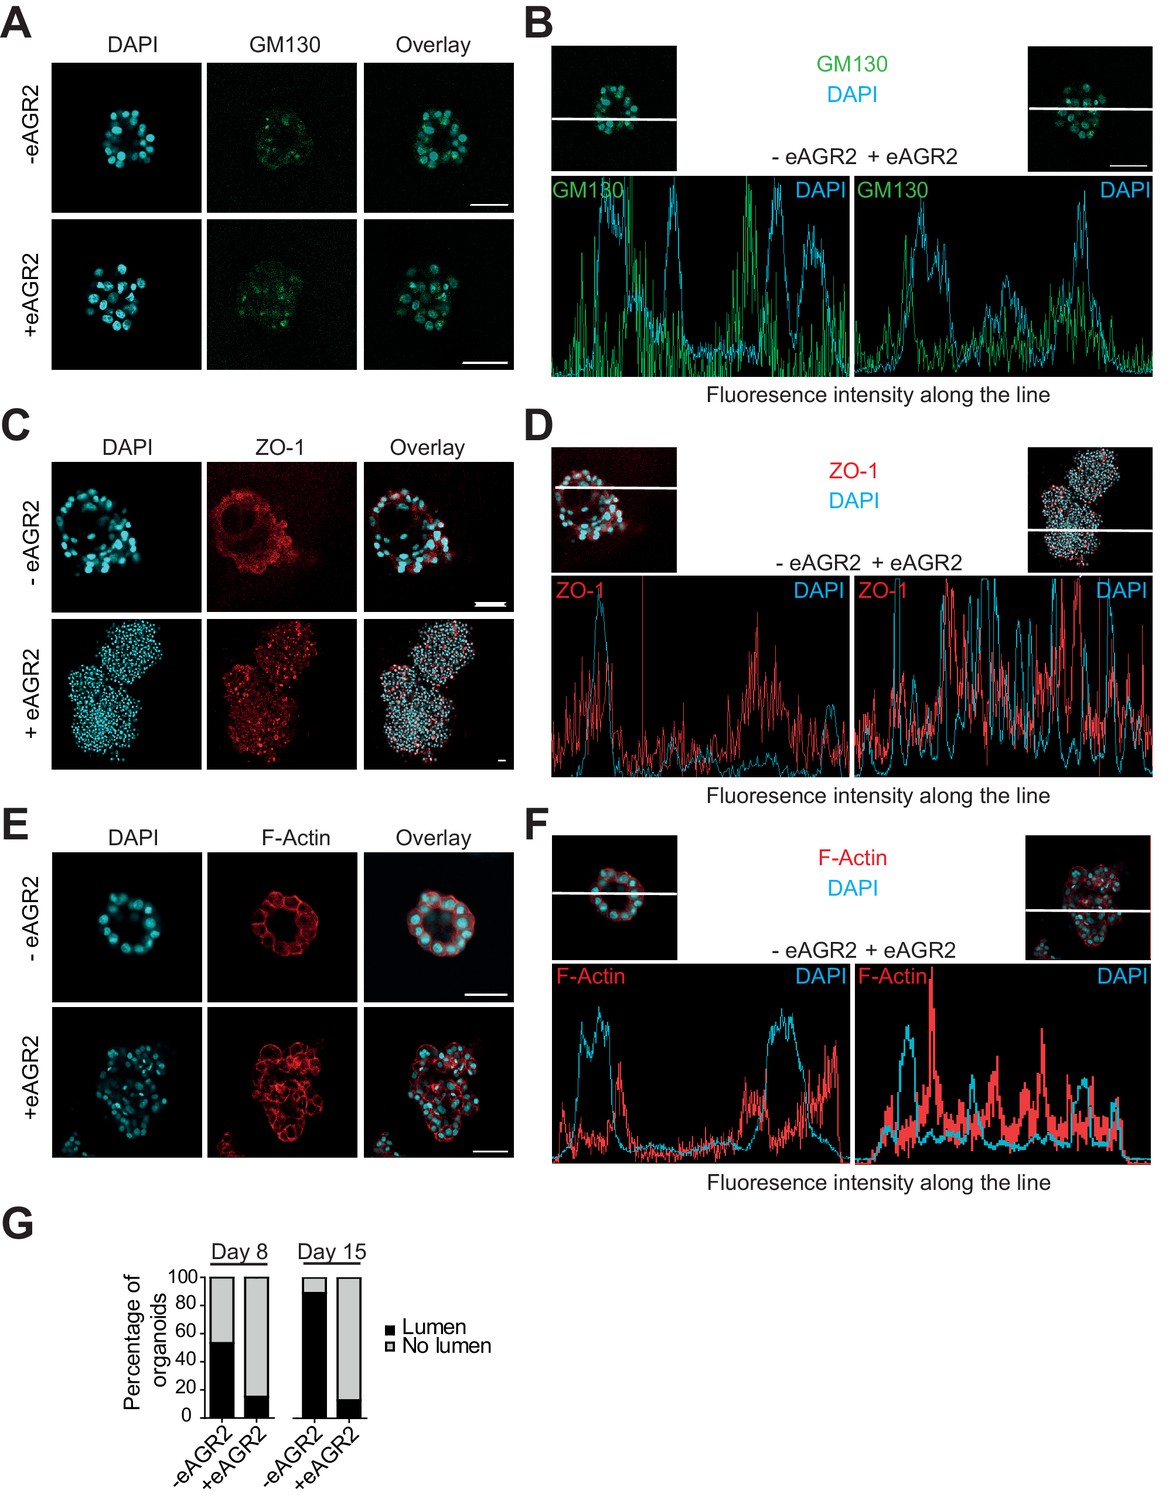
Extracellular AGR2 disrupts apico-basal polarity and lumen formation.
(A, C, E) HBEC cultured organoids in the presence (+ eAGR2) or absence (-eAGR2) of AGR2 in the ECM, stained for GM130 (A), ZO-1 (B) and F-Actin (C). Scale bars, 50 μm. Note the repositioning or fragmentation of Golgi following the presence of eAGR2. (B, D, F) Fluorescence intensity profile along the white line across the organoid in the presence (+ eAGR2, right panel) or absence (-eAGR2, left panel) of AGR2 in the ECM, stained with DAPI and GM130 (B), ZO-1 (D) and F-Actin (F). (G) Quantification of organoids with lumens; n>100 for each condition, (n=3).
Figure 8
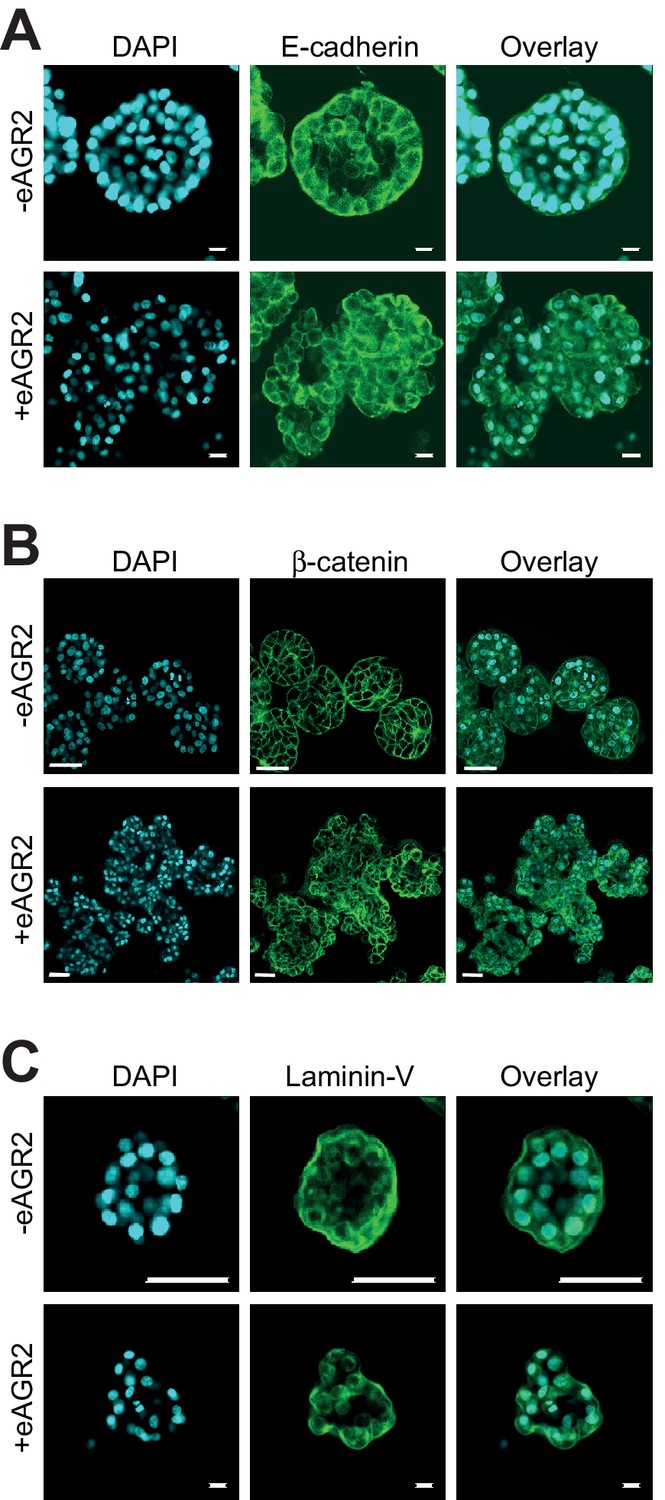
Extracellular AGR2 disrupts cell-cell adhesion.
Confocal cross-sections of HBEC organoids in the presence (+eAGR2) or absence (-eAGR2) of AGR2 in the ECM stained with E-Cadherin (A), β-catenin (B), or Laminin-V (C), and DAPI (blue) for nucleus. Scale bars, 50 μm.
Figure 9 with 1 supplement
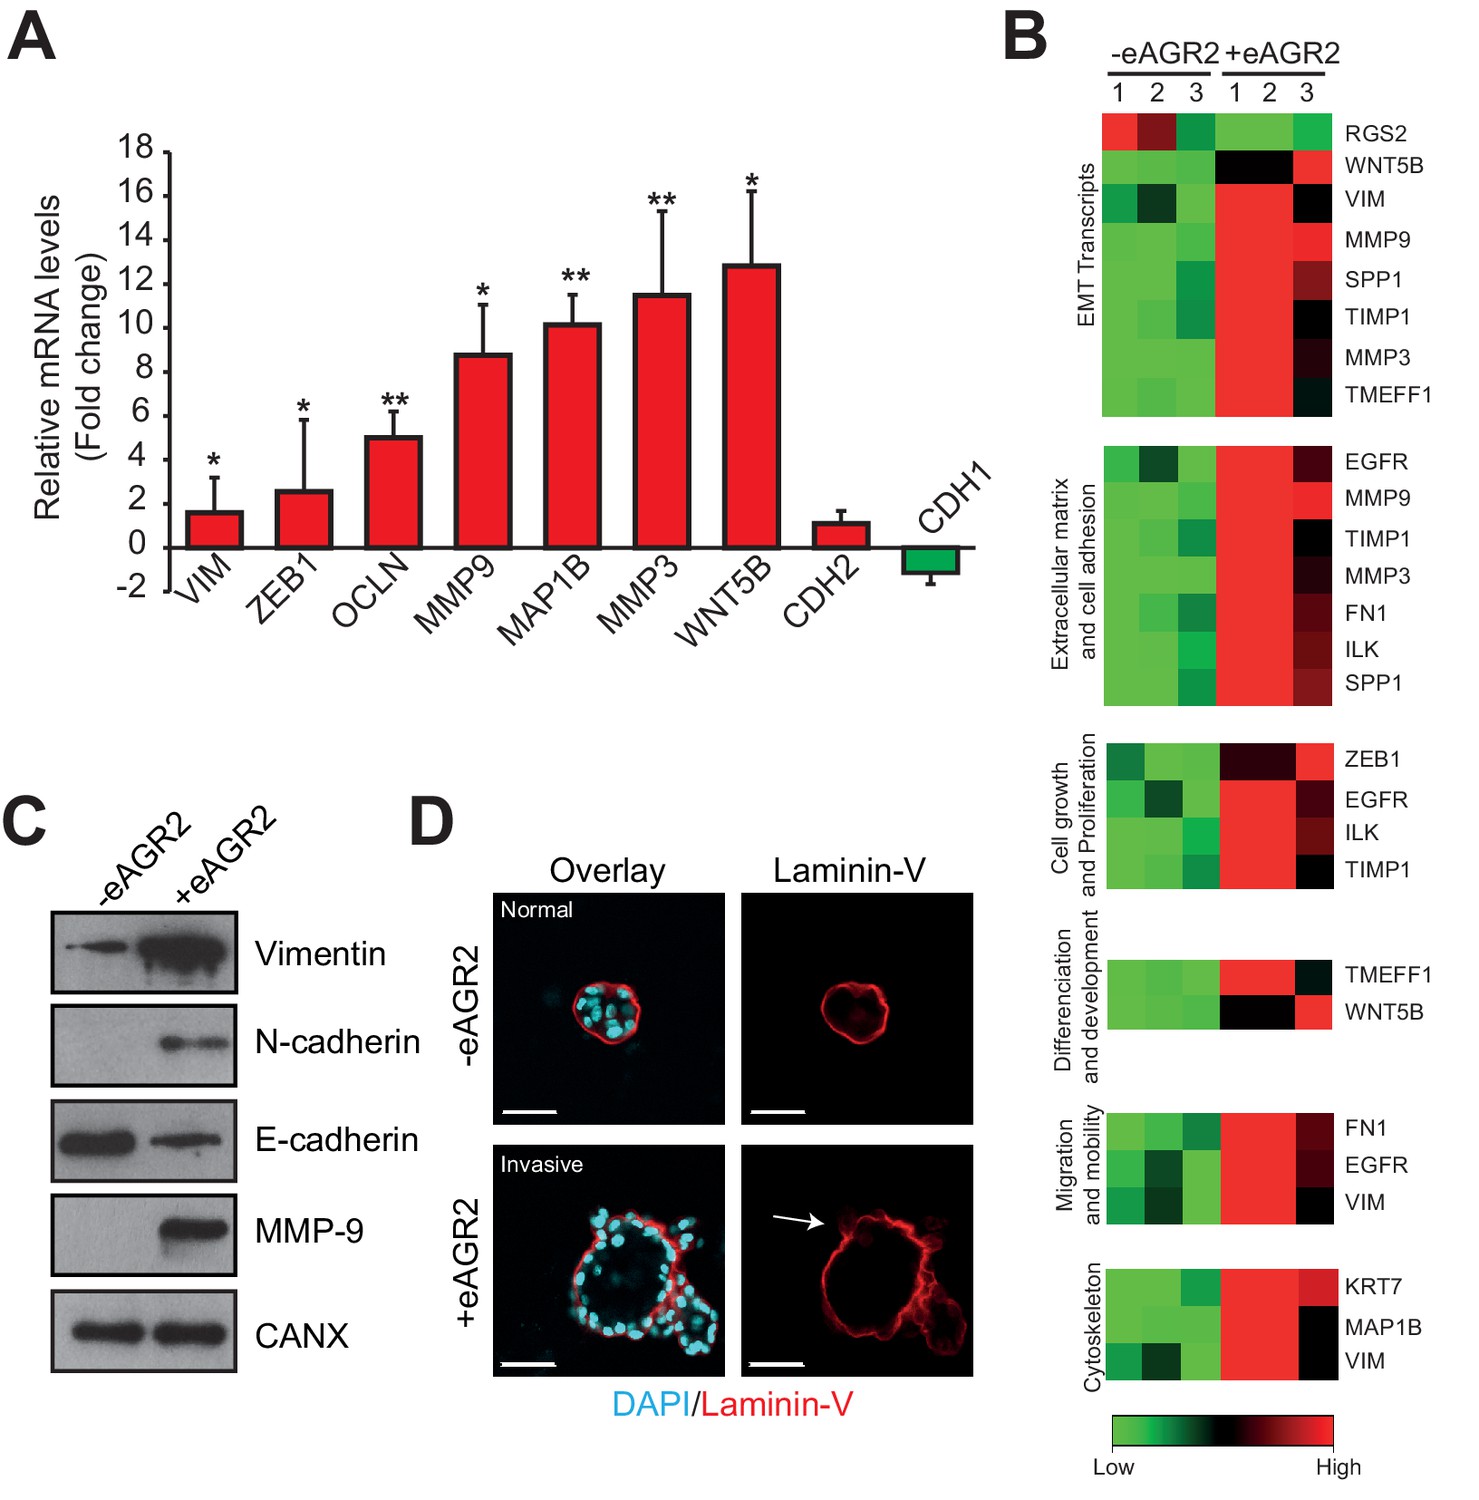
Extracellular AGR2 promotes EMT and invasive structures.
(A) Transcript expression of the EMT transcriptional effectors from the array validated by qRT-PCR. Quantitative PCR levels were normalized to B2M expression. *p≤0.05. **p≤0.01. (B) A focused EMT qRT-PCR array was utilized to assess EMT-regulated genes modulated by eAGR2 in HBEC cells. Samples for array data were derived from three independent replicates of the biological experiments. (C) Down-regulation of E-Cadherin and up-regulation of Vimentin, N-Cadherin and MMP9 protein concentrations in organoids in presence of AGR2 in the ECM (+ eAGR2) compared to organoids in absence of AGR2 in the ECM (- eAGR2), as analyzed by western blot. Calnexin (CANX) concentration is shown as loading control. One representative experiment (n = 3) is shown. (D) Invasion phenotype induced by eAGR2 on matrigel/collagen mixture. Organoids are fixed and stained with anti-Laminin 5 antibody. Arrows show loss of laminin at the basement membrane on invasive structures.
Figure 9—figure supplement 1
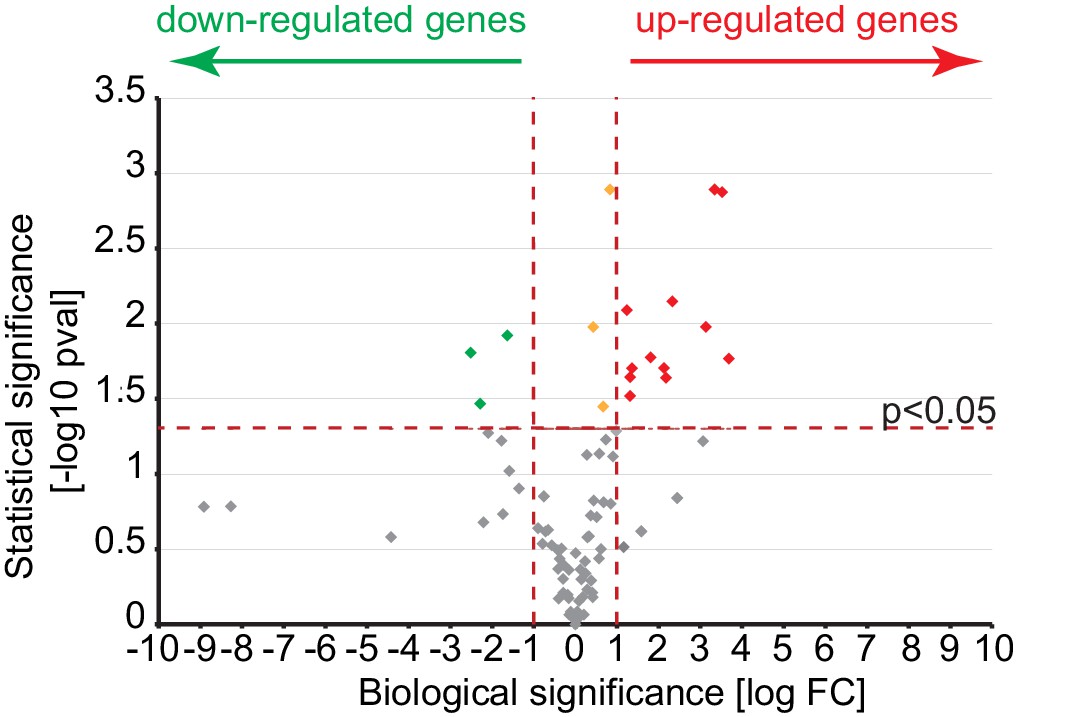
A volcano plot representation of differentially expressed gene in comparison of cultures growing in absence or presence of eAGR2.
The log Fold Change of the gene expression levels observed in the two conditions is reported on the X axis, while the –log 10 of the p-value of the statistical test of differential expression (t-test) is shown on the Y axis. The horizontal black dotted line represents the threshold of statistical significance of 0.05 for the p-value (1.3 for the -log10 p-value). Genes having Log Fold Change below that threshold are considered not statistically significant (gray dots). Genes with p-value equal or greater than the threshold are considered biologically down-regulated (green dots), up-regulated (red dots) or not biologically significant (orange dots) if their Fold Change is respectively less than or equal to 0.5, greater than or equal to +2 and between 0.5 and 2 (Log Fold Change <= -1, >= +1 and between -1 and +1).
Additional files
-
Supplementary file 1
Table 1A and Table 1B.
(A) AGR2 staining and clinicopathological characteristics of human lung cancer tissues samples analysed. (B) Gene Table of EMT Signaling pathway.
- https://doi.org/10.7554/eLife.13887.017
Download links
A two-part list of links to download the article, or parts of the article, in various formats.
Downloads (link to download the article as PDF)
Open citations (links to open the citations from this article in various online reference manager services)
Cite this article (links to download the citations from this article in formats compatible with various reference manager tools)
Secretion of protein disulphide isomerase AGR2 confers tumorigenic properties
eLife 5:e13887.
https://doi.org/10.7554/eLife.13887


