Activation of individual L1 retrotransposon instances is restricted to cell-type dependent permissive loci
- Institute for Research on Cancer and Aging of Nice, France
- University of Nice-Sophia Antipolis, France
- Ecole Normale Supérieure, France
- Ecole Normale Supérieure de Lyon, France
Figures
Figure 1 with 1 supplement
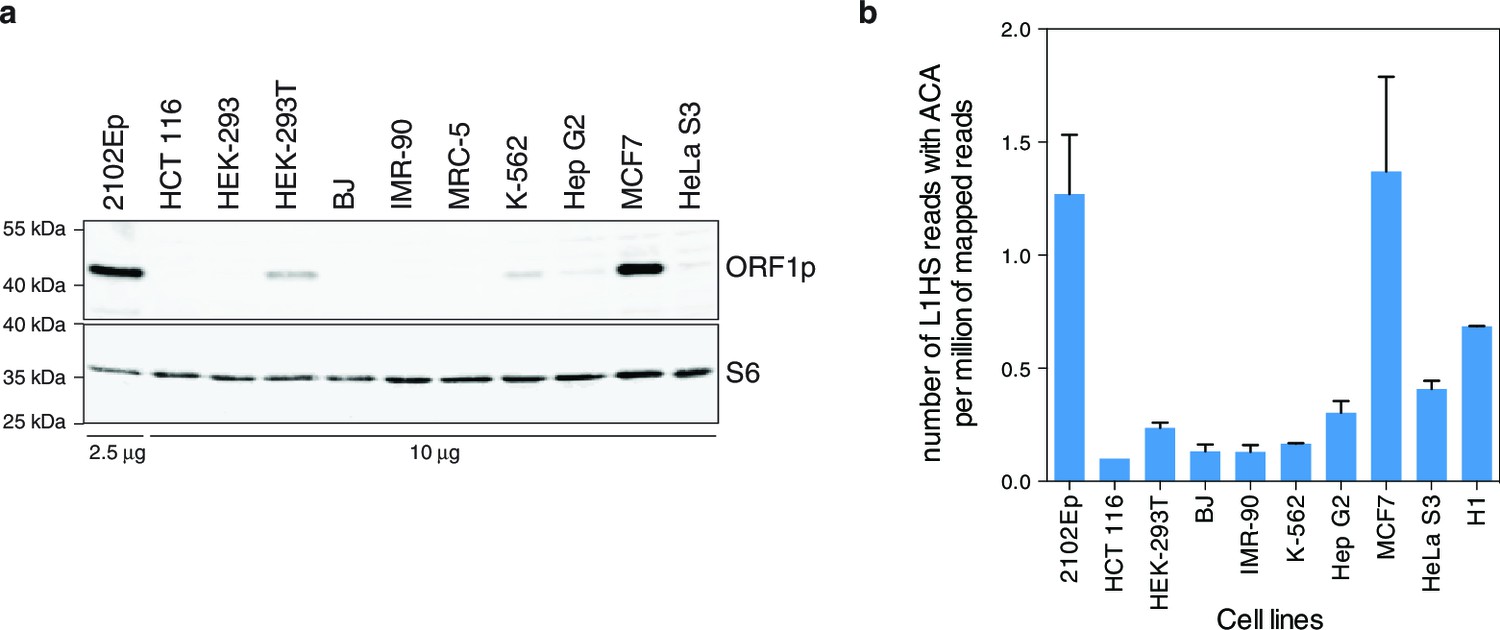
Global expression of L1HS elements in a panel of human somatic cell lines.
(a) ORF1p immunoblot analysis of L1 RNP accumulation in the indicated cell lines. Top, ORF1p immunoblot. Bottom, S6 Ribosomal Protein immunoblot as loading control. The quantity of RNP loaded is indicated at the bottom of the gel. (b) Global estimate of L1HS-Ta RNA levels obtained by counting RNA-seq reads mapping against the L1HS consensus and containing the Ta-specific ACA diagnostic signature, normalized by the total number of reads mapping in the human reference genome (hg19) (mean ± s.e.m., n=2 except for MCF-7 where n=4, and HCT 116 where n=1). This analysis is based on stranded polyA+ RNA-seq data (Supplementary file 1). None were available for MRC-5 and HEK-293 cells, but data obtained from the hESC line H1 were included. See also Figure 1—figure supplement 1.
Figure 1—figure supplement 1
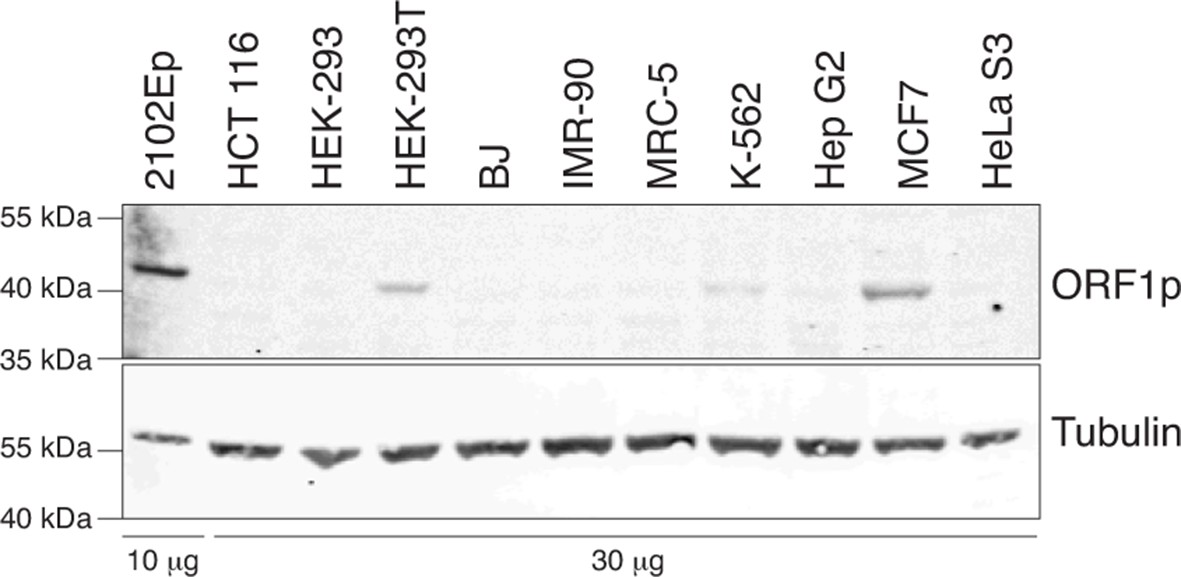
Analysis of L1 ORF1p expression in whole cell extracts of various cell lines by immunoblot.
Top, ORF1p immunoblot. Bottom, Tubulin immunoblot as loading control. The quantity of whole cell extracts loaded is indicated at the bottom of the gel.
Figure 2 with 1 supplement
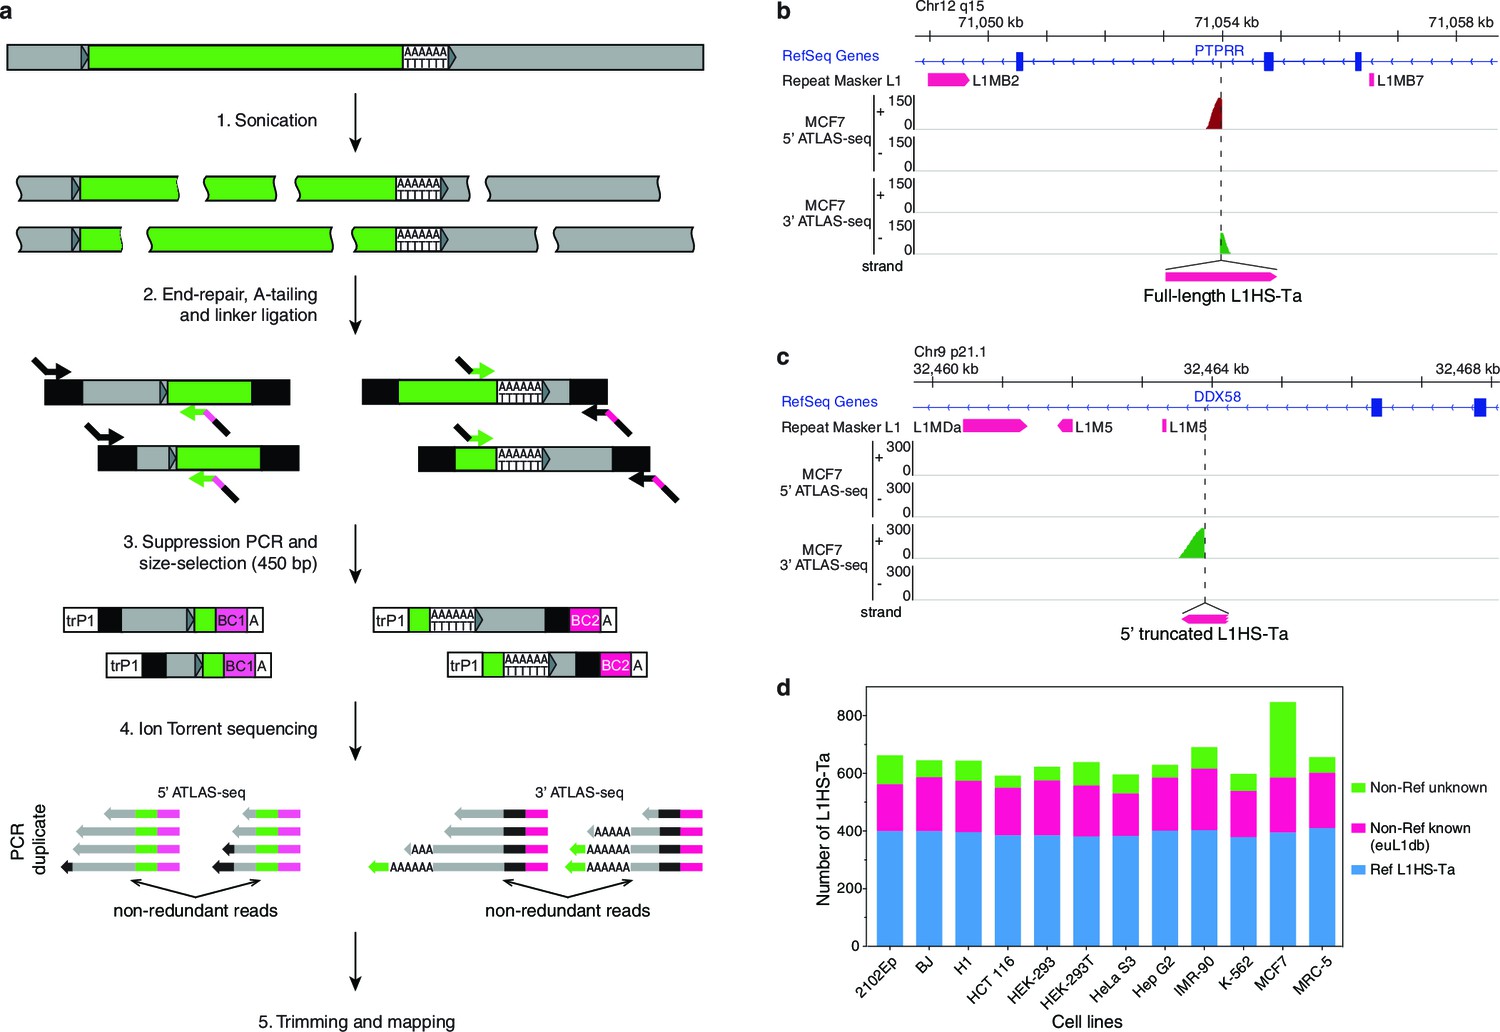
The genetic landscape of L1HS-Ta insertional polymorphisms in 12 human somatic cell lines.
(a) Principle of the ATLAS-seq procedure. The subsequent in silico steps are described in Figure 2—figure supplement 1a. (b–c), Modified IGV genome browser views (Thorvaldsdóttir et al., 2013) of two non-reference polymorphic L1 instances detected in MCF7 cells (b, full length L1, note the two adjacent 5'- and 3'-ATLAS-seq peaks; c, truncated L1). (d) L1HS-Ta insertions found in the various cells of the studied panel. See also Figure 2—figure supplement 1.
Figure 2—figure supplement 1
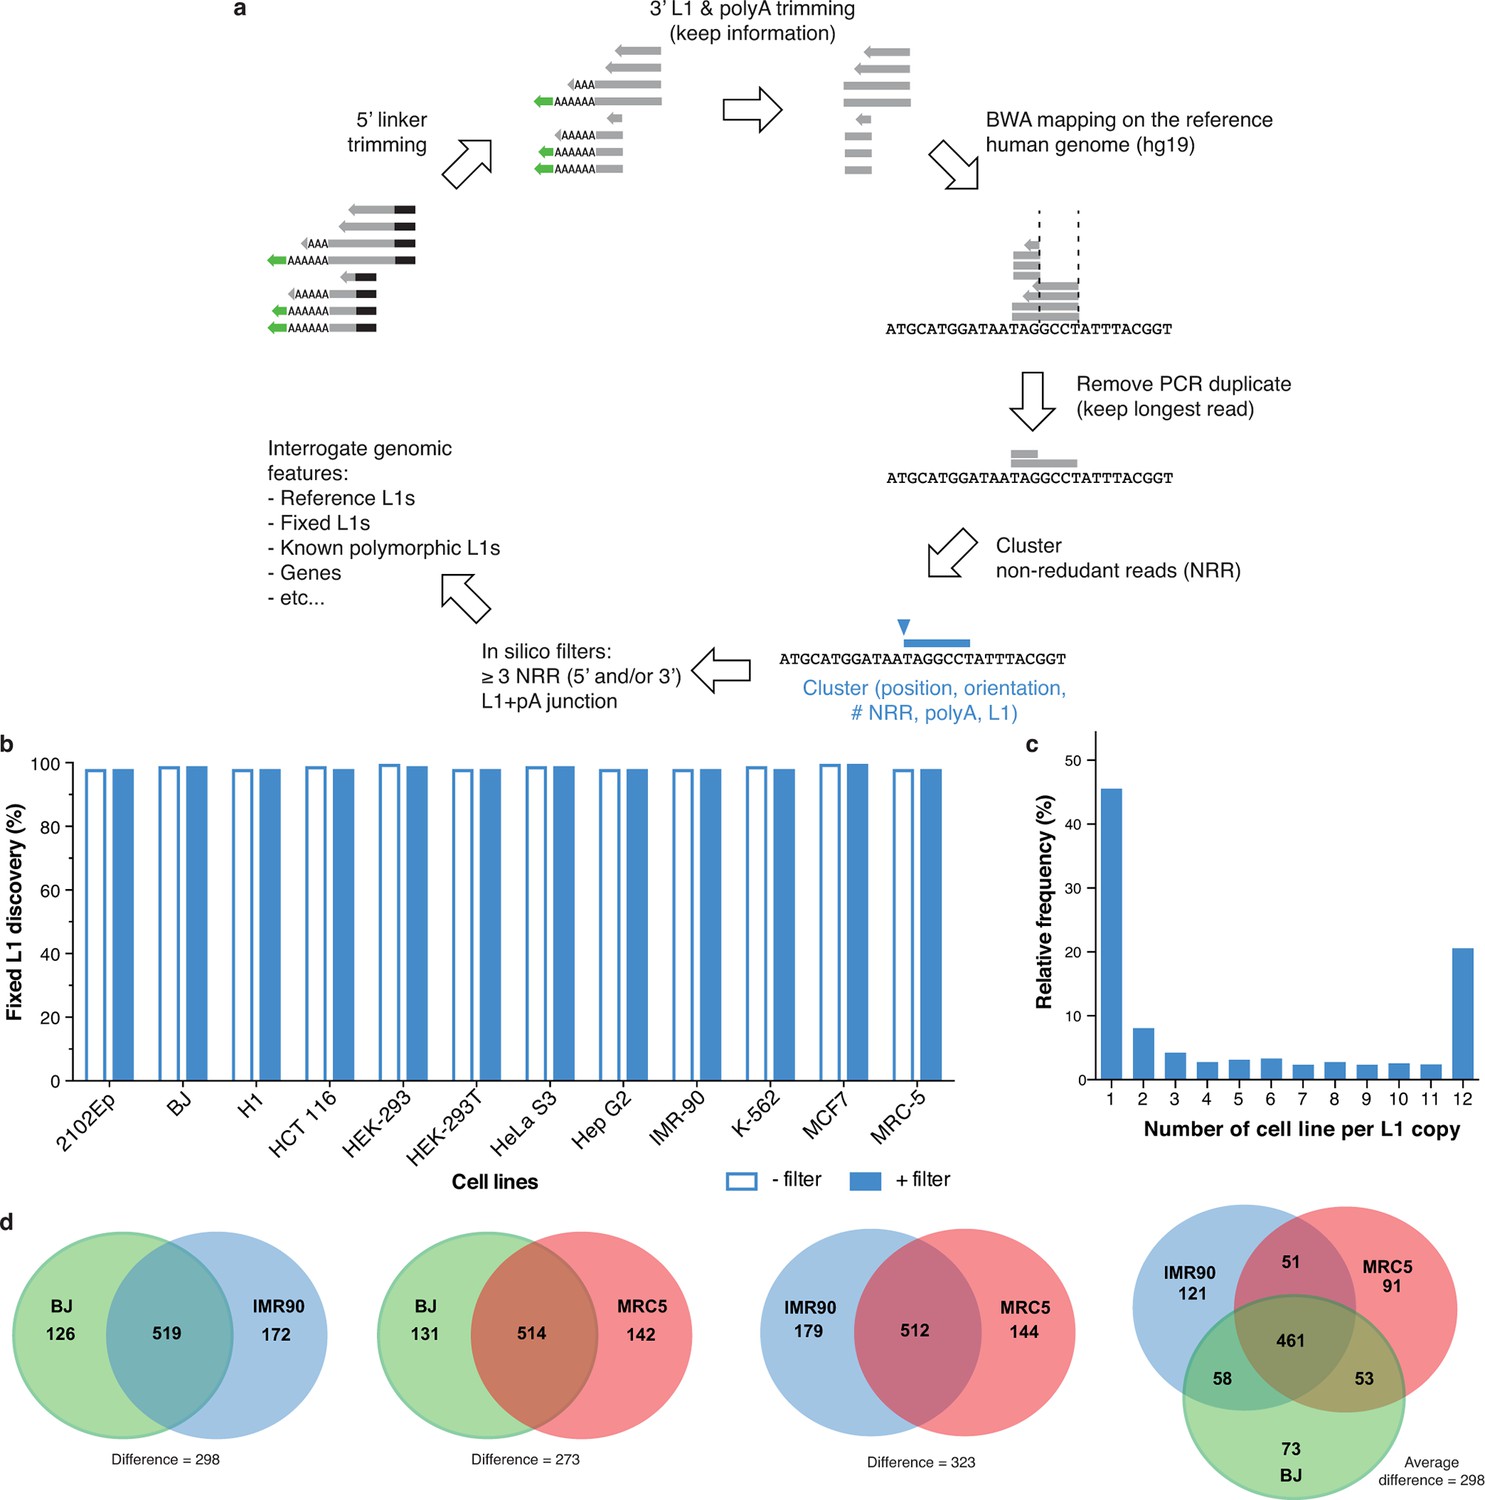
Fixed and polymorphic L1HS-Ta elements mapped by ATLAS-seq.
(a) A scheme summarizing the principle of ATLAS-seq sequencing data analysis. (b) Barchart showing the discovery rate of fixed L1HS-Ta elements before (empty bars) and after (plain blue bars) implementation of in silico filters, in each of the analyzed cell lines. (c) Extent of L1HS-Ta insertional polymorphisms among the 12 cell lines analyzed by ATLAS-seq. (d) Venn-Diagram representing the number of common L1HS-Ta insertions, and the extent of L1-mediated structural variation, in three normal diploid cell lines (fibroblasts).
Figure 3 with 2 supplements
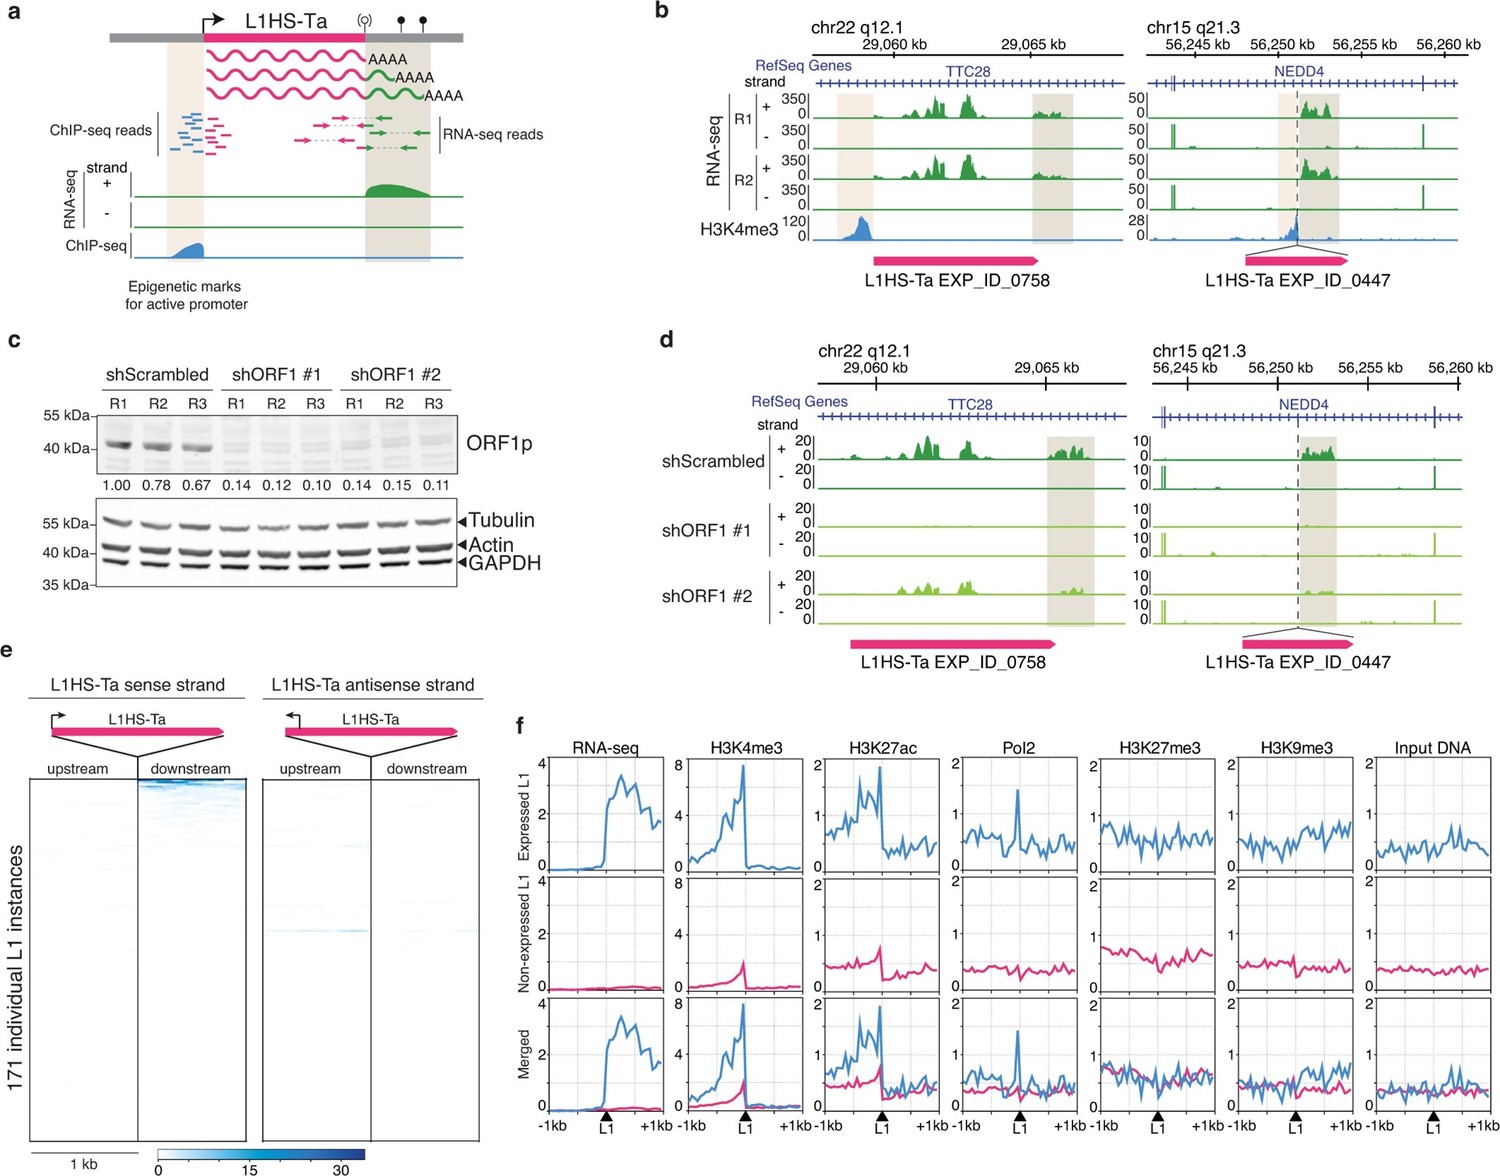
Detection of transcriptionally active L1HS-Ta elements at individual copy resolution in MCF7 cells.
(a) Theoretical scheme representing the outcome of RNA-seq and ChIP-seq read mapping at polymorphic L1 loci. The informative regions are highlighted in beige. (b) Genome browser views of reference (left, TTC28 locus) and non-reference (right, NEDD4 locus) L1 instances integrated with RNA-seq (green) and H3K4me3 ChIP-seq data (blue). R1 and R2, replicate #1 and #2, respectively. (c) shRNA-mediated ORF1p knock-down. Top, immunoblot for ORF1p. Bottom, immunoblot for Actin, Tubulin and GAPDH as loading controls. R1, R2, and R3 are independent knock-down replicates performed in parallel and used subsequently for RNA-seq. Relative ORF1p levels normalized by the loading controls and scrambled shRNA controls are indicated between the two membranes. (d) Modified IGV genome browser views (Thorvaldsdóttir et al., 2013) of the TTC28 (left) and NEDD4 (right) L1 instances with RNA-seq data upon ORF1p shRNA-mediated knock-down. The informative L1 downstream region is highlighted in beige. Only one biological replicate out of three is shown for the sake of clarity. (e) Heat maps showing RNA-seq read accumulation 1 kb upstream and 1 kb downstream of each L1 copy. The downstream signal on the L1 strand (left heat map) is indicative of L1 sense promoter activity, while the upstream signal on the L1 antisense strand (right heat map) reflects L1 antisense promoter activity. L1 instances (rows) are sorted by decreasing L1 level of expression on the sense strand and the order is identical for the antisense strand. (f) Chromatin and transcription status around expressed (blue, FPKM of downstream RNA-seq tag>0.05) and non-expressed L1HS-Ta instances (pink). The indicated ChIP-seq and RNA-seq signals for each class of L1HS-Ta copies were aggregated and plotted centered around the position of the L1 insertion site. Note that the internal L1 region, when available (reference L1), is not included, but only its flanks. See also Figure 3—figure supplements 1 and 2.
Figure 3—figure supplement 1
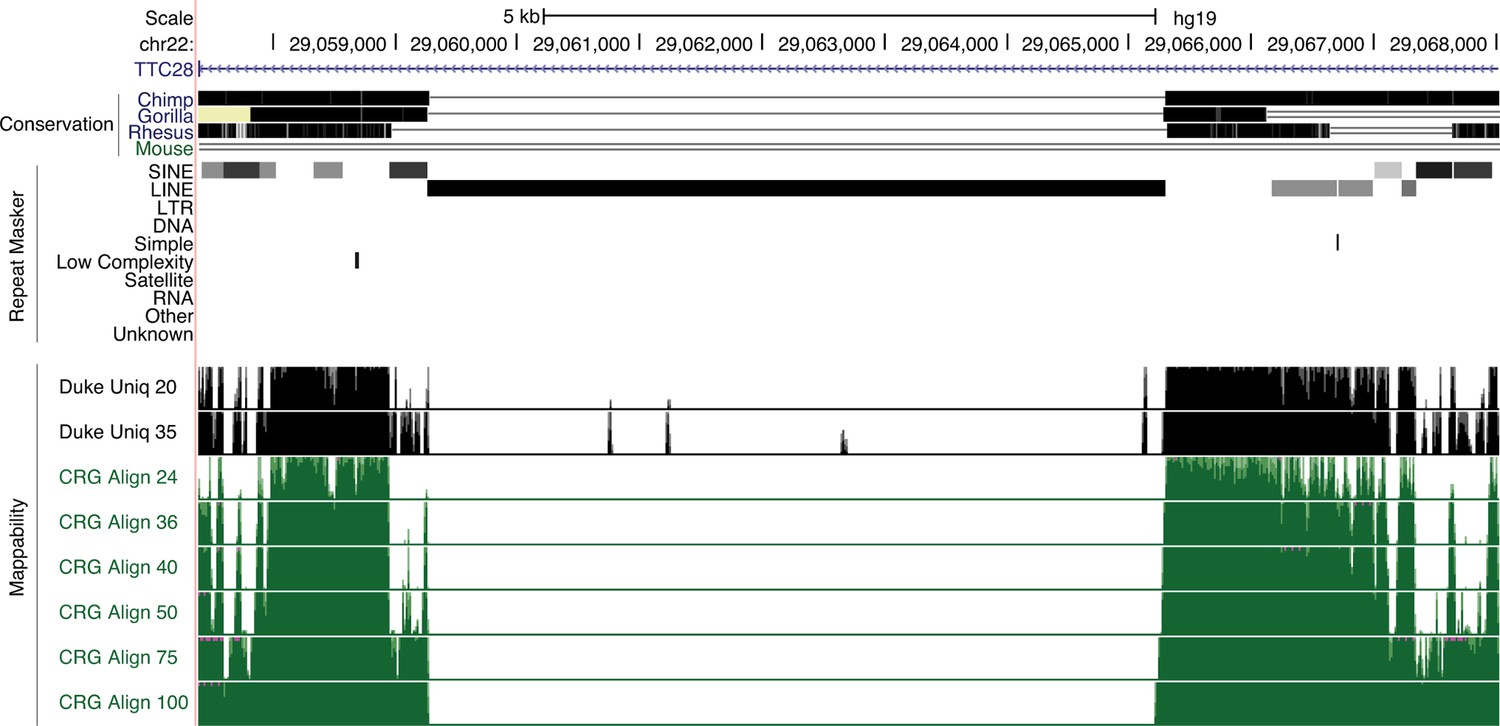
L1HS-Ta loci belongs to low mappability genomic regions.
Genome browser view showing an L1HS-Ta element in the TTC28 locus. This insertion is evolutionary young (human-specific, not present in other Primates). UCSC mappability tracks are shown in black and green. Numbers on the left refer to read length. Increasing read length resolve mappability issues in older repeats (more divergent) flanking the L1HS-Ta, but not the L1HS-Ta itself.
Figure 3—figure supplement 2
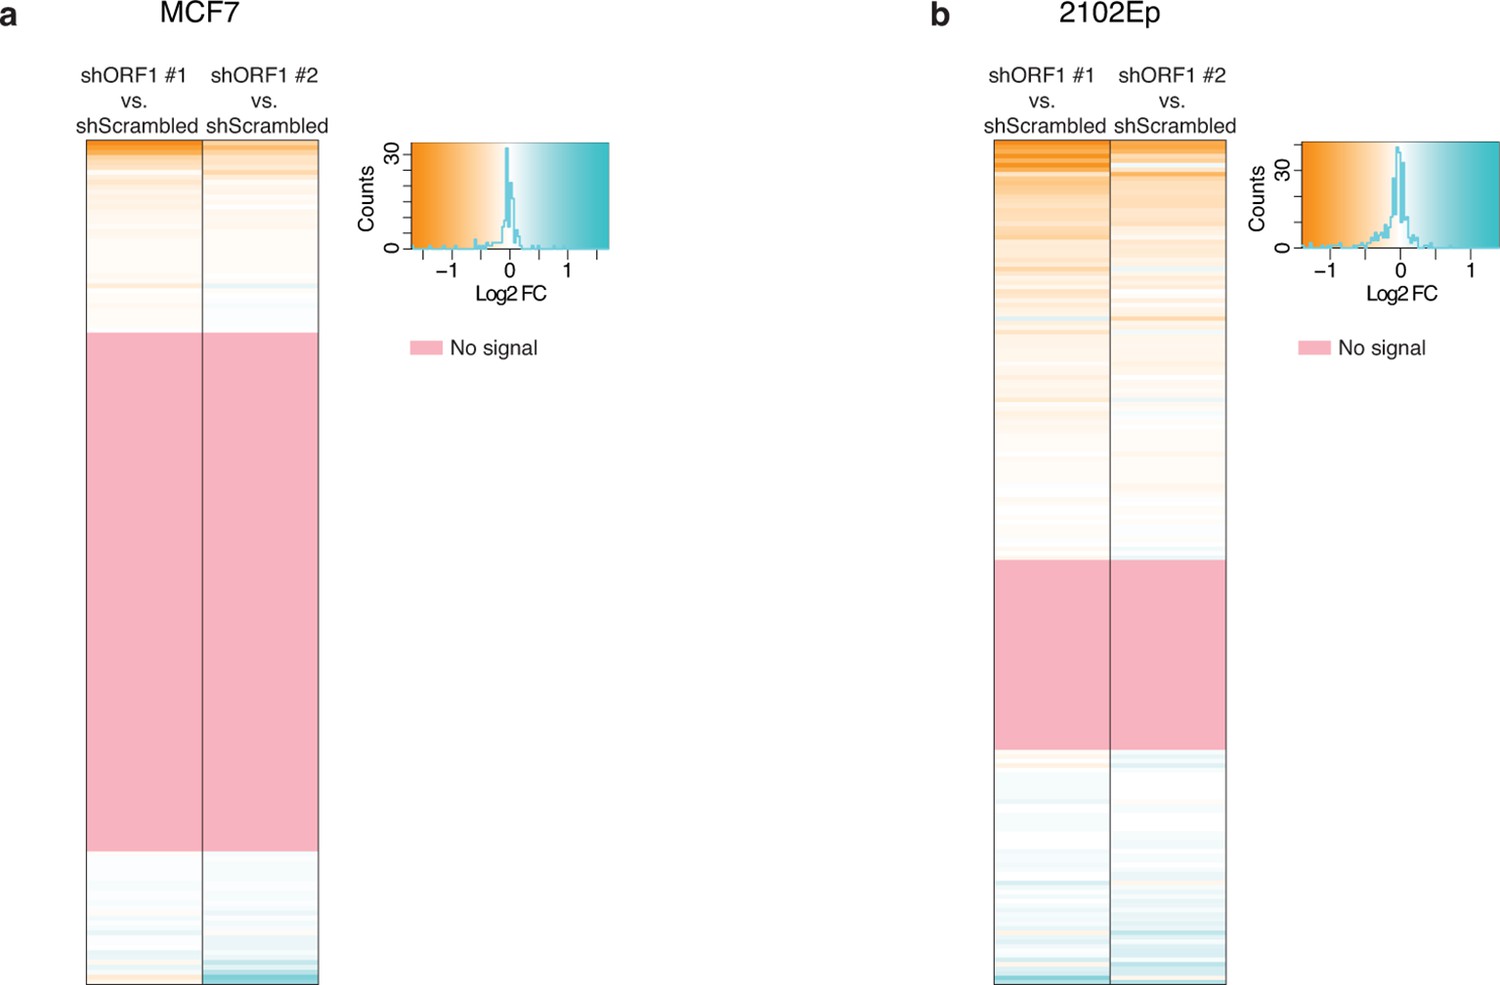
Impact of shRNA-mediated ORF1 knockdown on RNA levels for each L1HS-Ta genomic instance.
Heat maps showing for each L1HS-Ta instance (row) the Log2 fold change (Log2FC) of RNA-seq signals for each ORF1 shRNA versus a scrambled shRNA control (n=3). (a) MCF7 cells. (b) 2102Ep cells. The pink rows reflect L1HS-Ta copies for which no RNA-seq signal could be detected (and therefore the ratio could not be calculated).
Figure 4 with 3 supplements
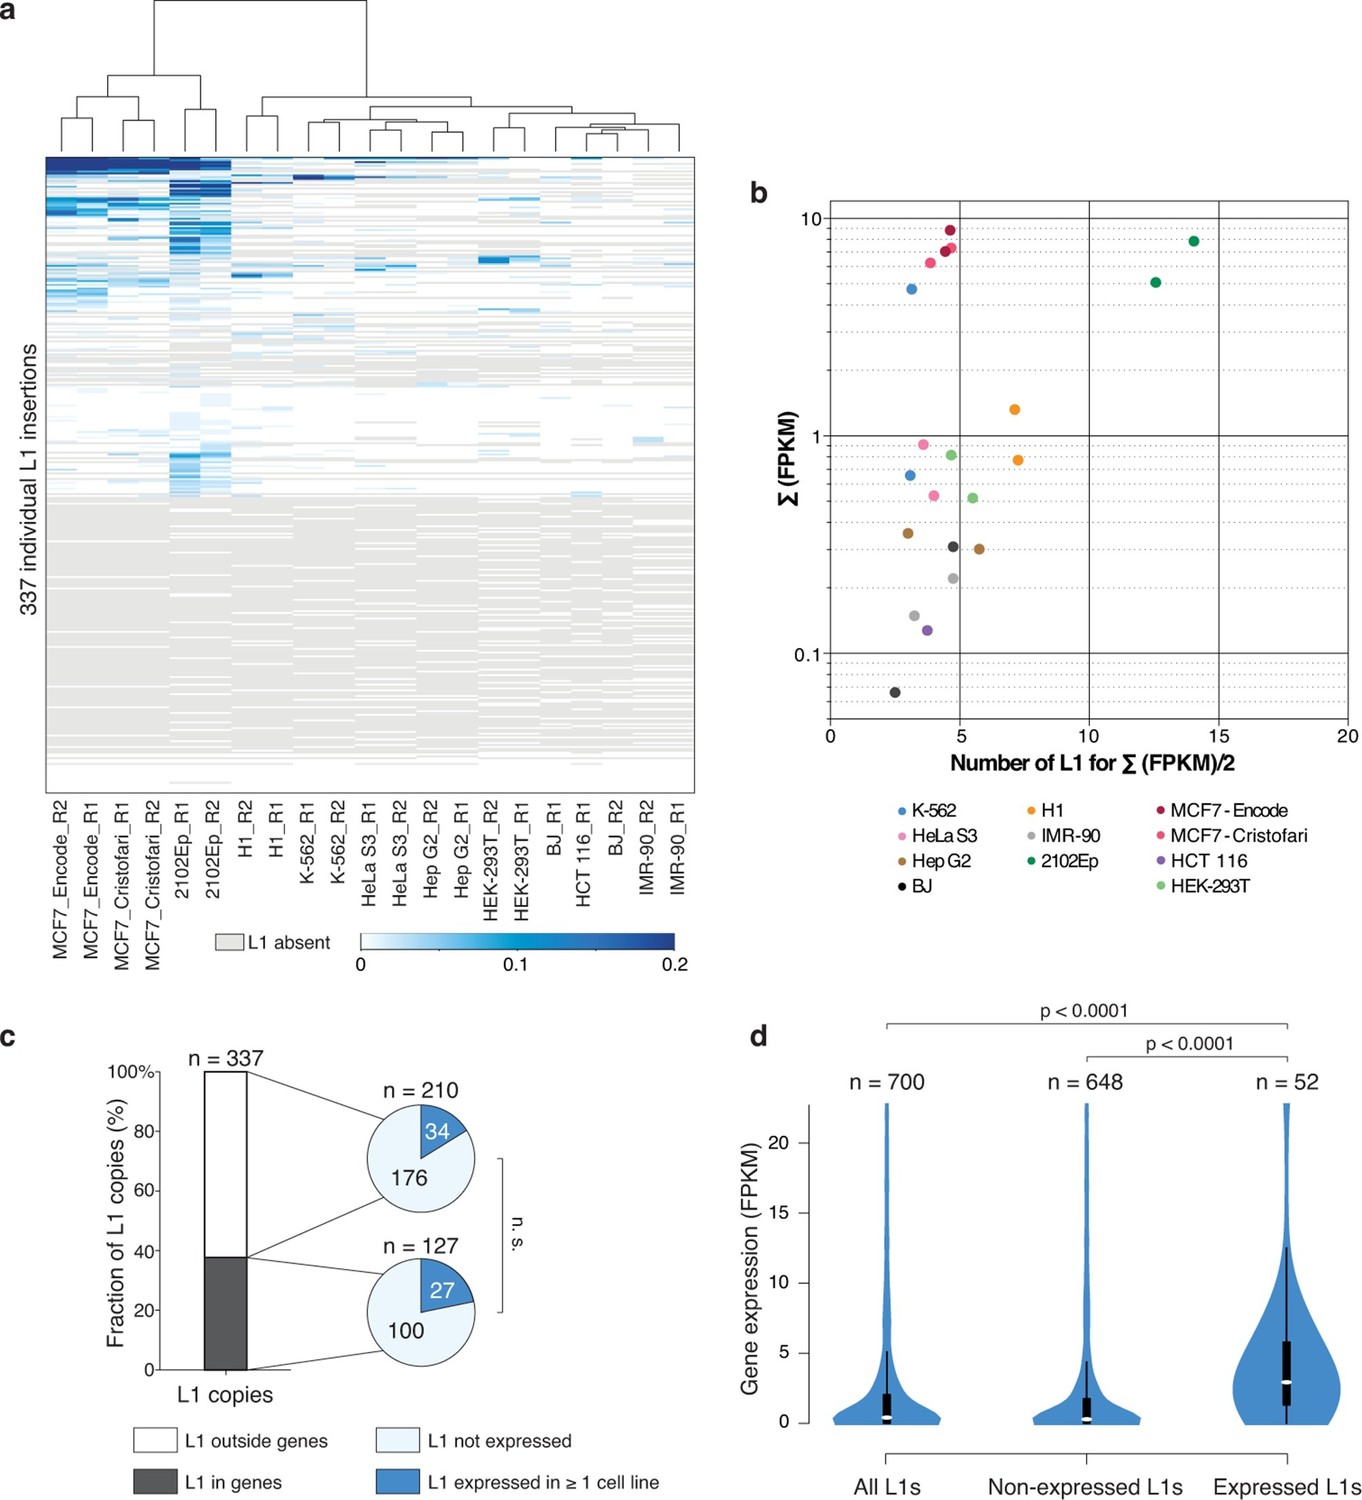
Locus- and cell-type-specific reactivation of individual L1HS-Ta copies in normal and transformed cells.
(a) Heat map displaying expression levels of each L1 instance in each of the analyzed cell lines. Expression level is defined as the number of RNA-seq fragments mapped in a 1 kb-window downstream of a particular L1 copy and on the same strand, normalized by the total amount of mapped fragment (FPKM). Grey, absent polymorphic L1 copy. Most cell lines have at least two RNA-seq replicates (R1 and R2), which cluster based on their L1 expression profiles, showing their cell-line specificity. (b) The bulk of L1HS-Ta transcripts is produced by a limited number of loci. Scatter plot showing the number of L1 copies contributing to half of the total pool of L1HS-Ta transcripts. The y-axis represents the total L1 downstream tag FPKM count for each cell line. The x-axis represents the number of L1 loci contributing to half of this total FPKM. (c) Distribution of expressed and non-expressed L1 insertions in genic and non-genic regions. Bar chart indicating the fraction of L1 copies in genic (dark grey) and non-genic (white) regions with associated pie charts indicating the proportion of non-expressed L1 (light blue) and L1 expressed in at least 1 cell line of the panel (dark blue). The distribution of expressed L1 insertions is not statistically different between genic and non-genic regions (p=0.117, binomial test). (d) Expression levels of genes associated with non-expressed or expressed L1 copies. Values of gene expression are considered independently for each cell line of the panel, and distributed whether the L1 insertion is expressed (>0.05 FPKM) or not (≤0.05 FPKM) in each particular cell line. White oval shows the median; black box lower and upper limits indicate the 25th and 75th percentiles, respectively; whiskers extend to 1.5 times the interquartile range; violin shape represents density estimates of data and extend to extreme values (out of scale range). Genes containing expressed L1s are more expressed than genes containing non-expressed L1s (p<0.001, Kolmogorov-Smirnov test). See also Figure 4—figure supplements 1, 2 and 3.
Figure 4—figure supplement 1
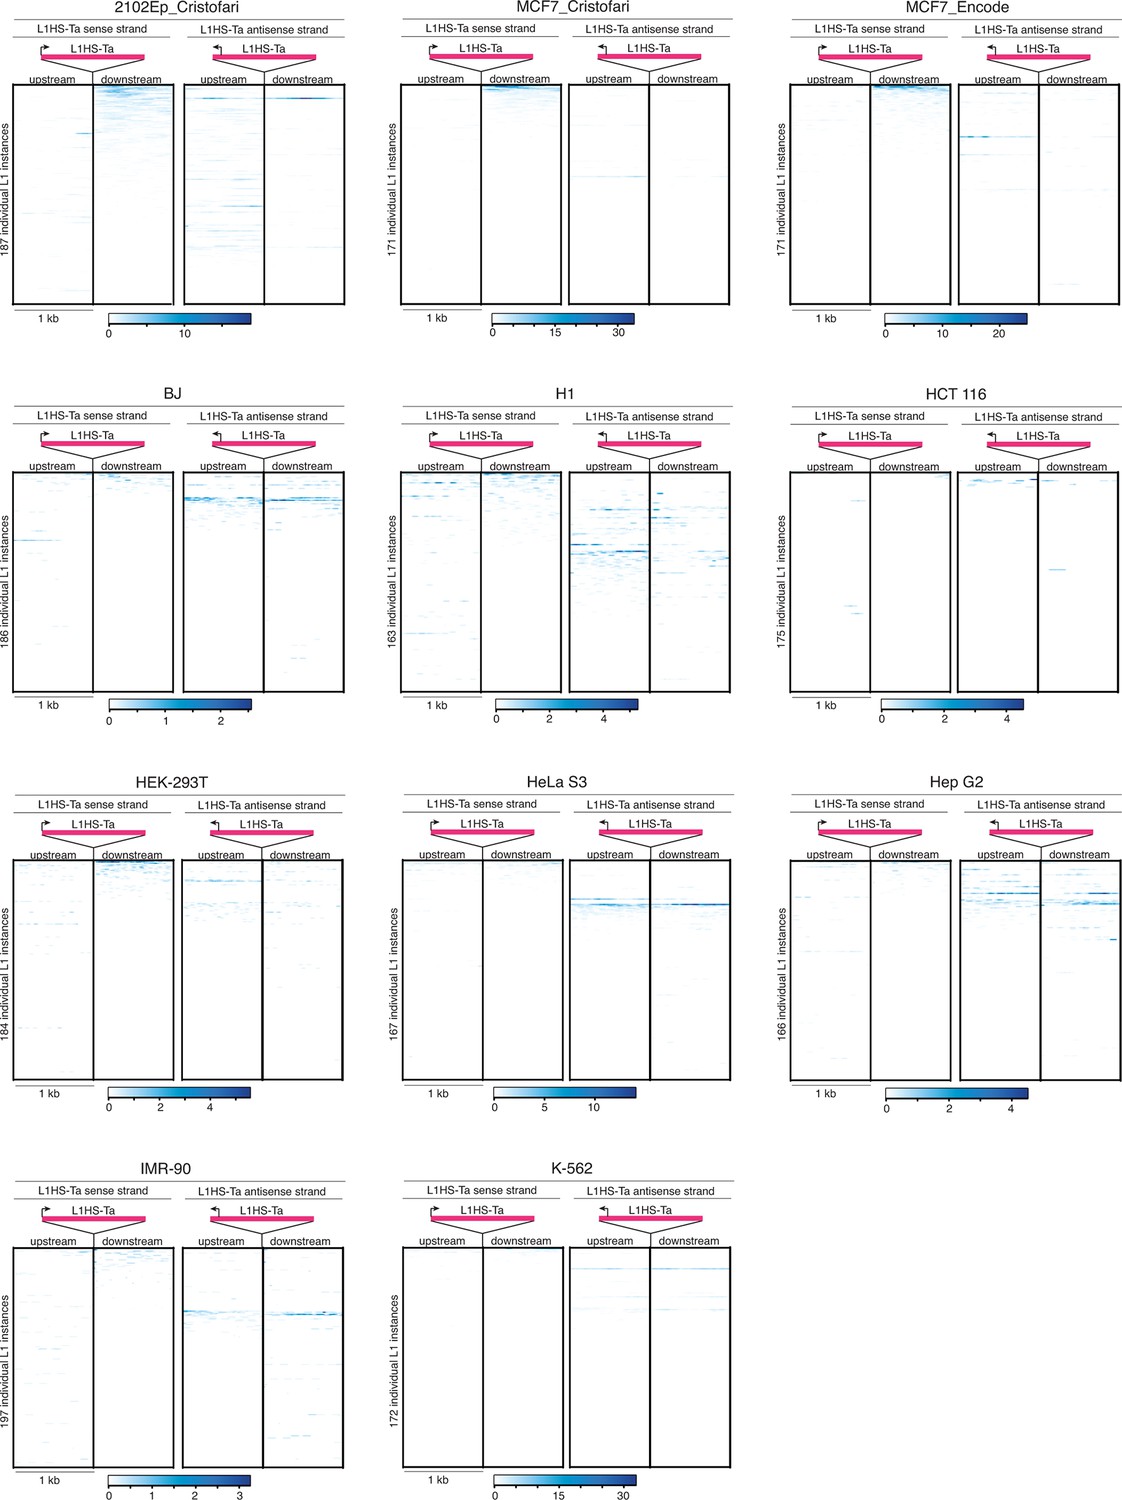
Heat maps for L1HS-Ta loci individual expression in various cell lines.
Legend is identical to Figure 3e. MCF7 RNA-seq data are from the ENCODE Project (MCF7_ENCODE) and from this study (MCF7_Cristofari).
Figure 4—figure supplement 2
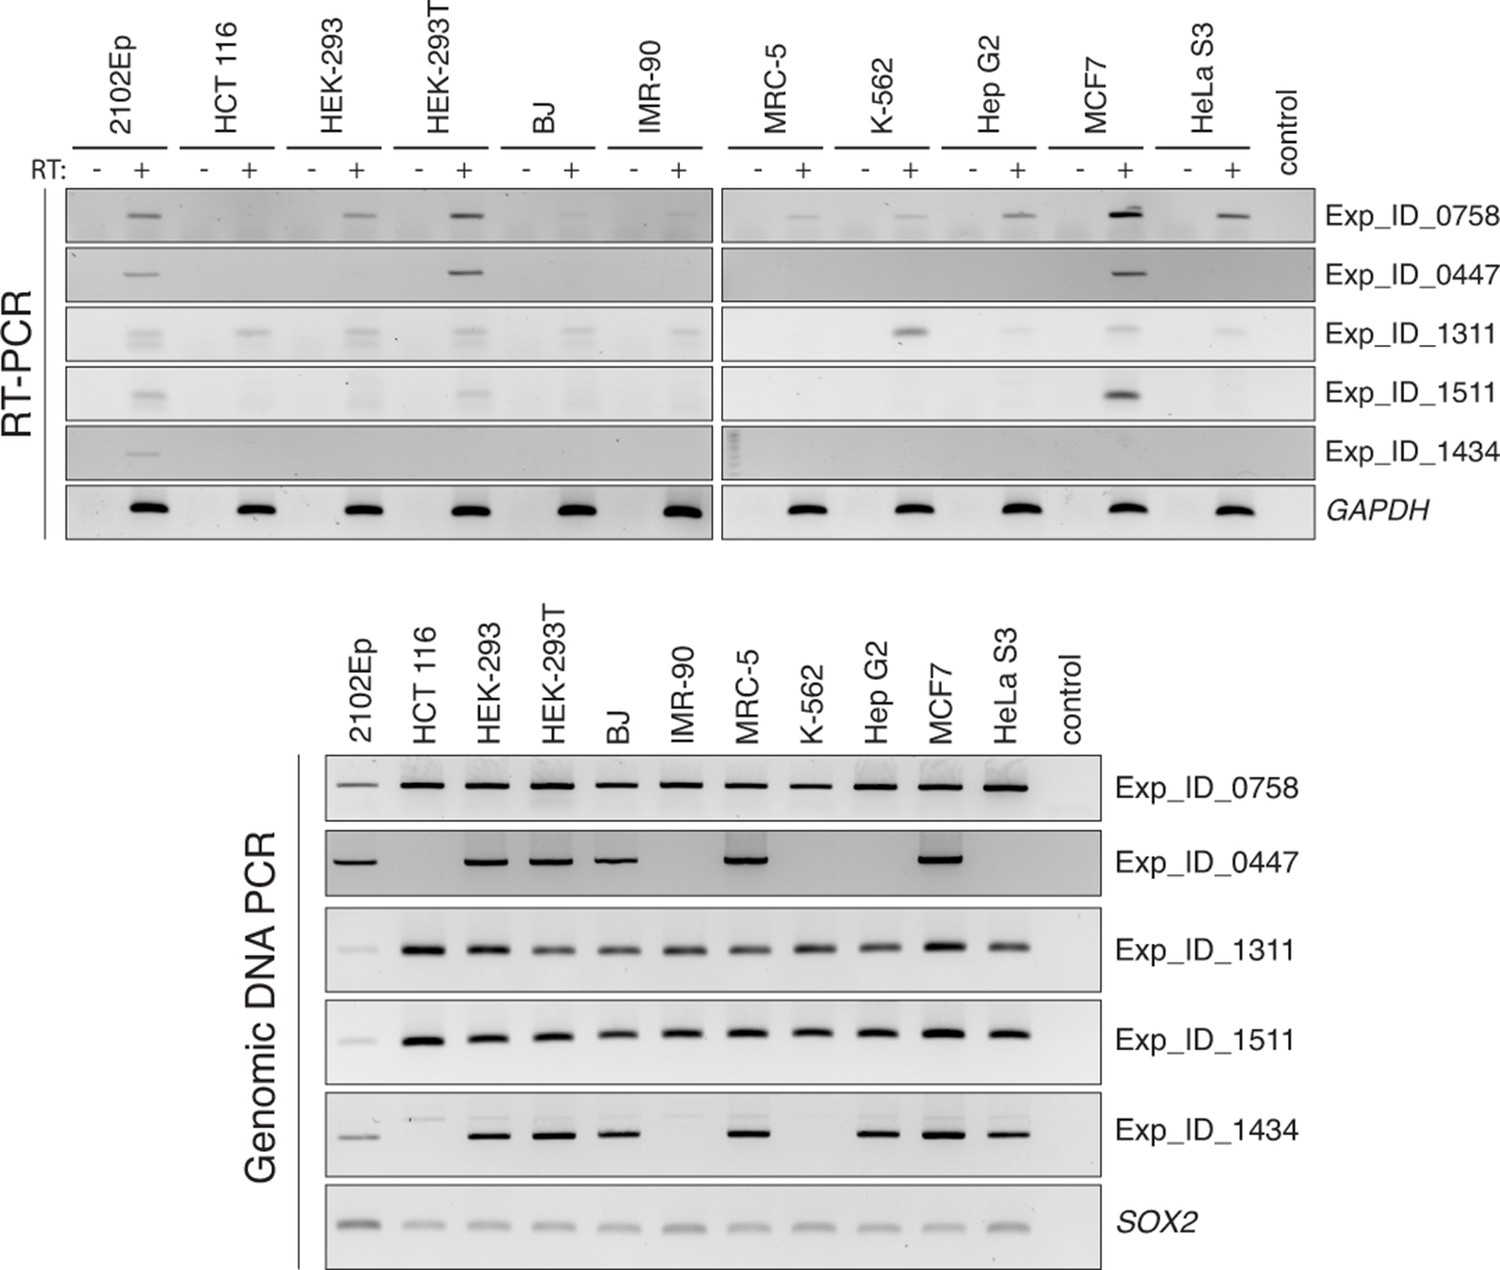
RT-PCR validation of individual L1 expression across several cell lines.
PCR primers are anchored in the L1 internal sequence and in the flanking genomic region, respectively. Each RT-PCR included a control reaction without RT (-) to exclude possible genomic DNA contamination. Top, RT-PCR reactions. Bottom, PCR on genomic DNA using the same primers, showing polymorphic L1 copies among the various cell lines, and validating PCR conditions. RT, reverse transcriptase.
Figure 4—figure supplement 3
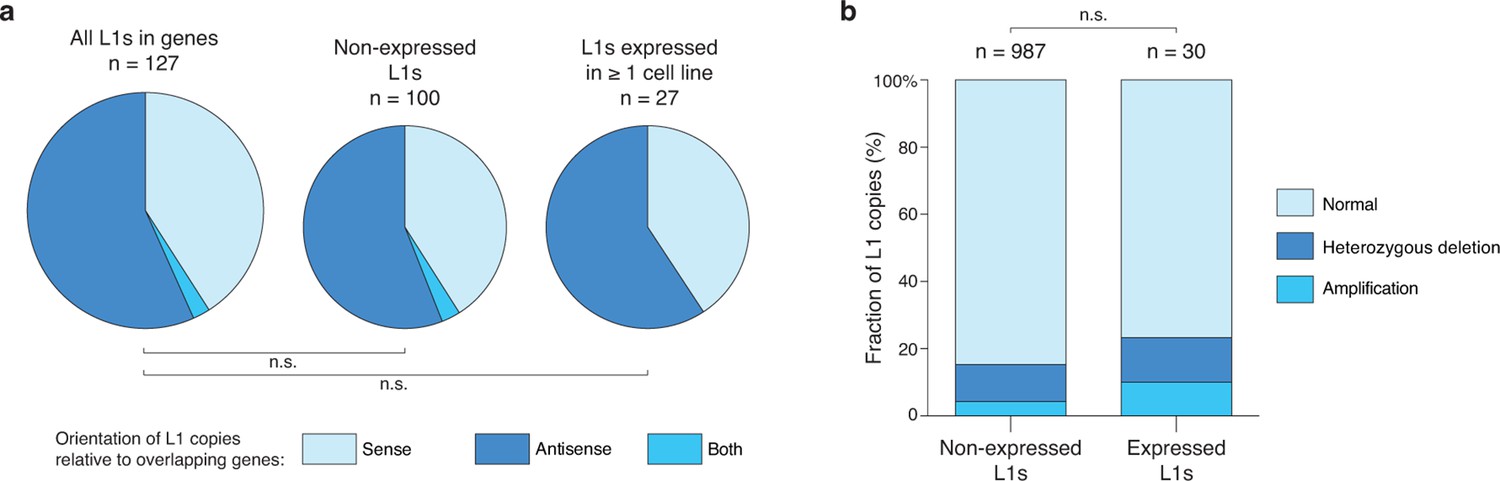
Relationship of expressed L1HS-Ta copies with genes and ploidy.
(a) Distribution of genic L1HS-Ta full-length copies regarding the orientation relative to the overlapping genes. Pie charts indicate the proportion of sense (light blue) and antisense (dark blue) L1 insertions relative to genes. In some instances, the L1 insertion overlaps two genes with both sense and antisense orientation (labeled “both” in the pie charts, coral blue). L1 copies are more frequent in the antisense orientation with no statistical difference between non-expressed and expressed L1 copies (p=0.259, binomial test). (b) Distribution of L1 insertions regarding the presence or absence of copy number variation in the genomic region. Status of the genomic regions are considered independently for each cell line of the panel, when data are available, and distributed whether the enclosed L1 insertion is expressed (>0.05 FPKM) or not (≤0.05 FPKM) in each particular cell line. Expressed L1 copies are not significantly enriched in amplified regions (p=0.138, Chi-square test).
Figure 5
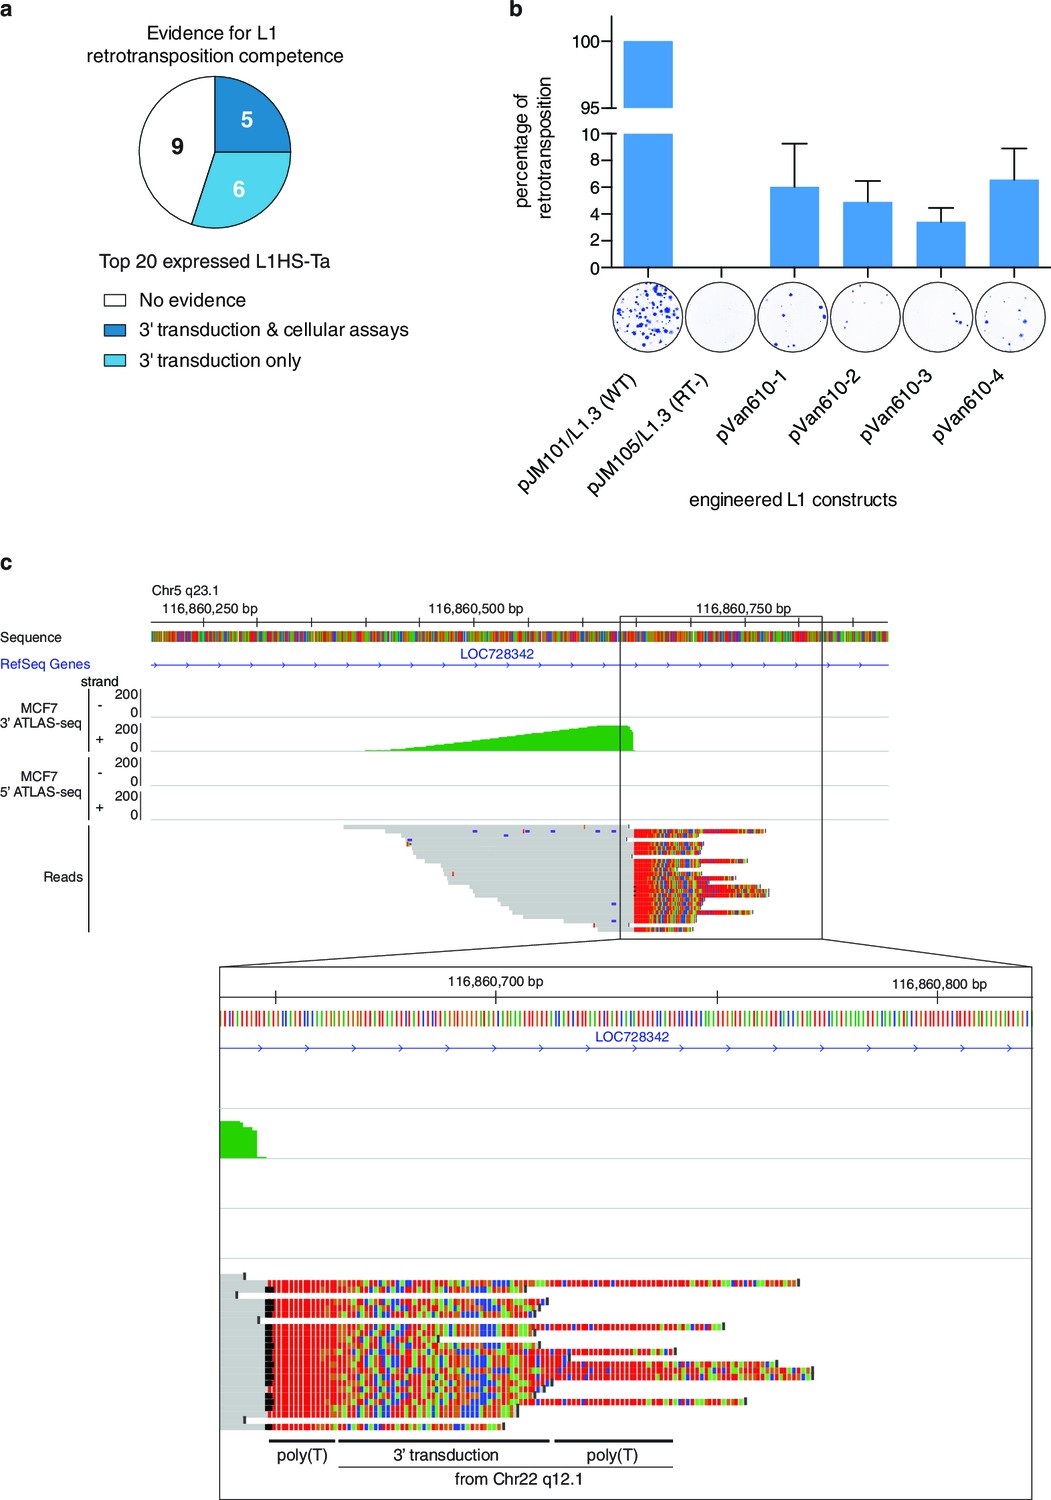
Evidence of retrotransposition capability for selected L1HS-Ta copies.
(a) Evidence of retrotransposition competence for the top 20 most expressed L1 copies across all cell lines analyzed. Cellular assays refer to retrotransposition cellular assays of plasmid-borne L1 instances, whose expression is driven by either the native L1 5’ UTR alone (Brouha et al., 2003) or supplemented by a strong CMV promoter ([Beck et al., 2010] and Figure 5b). These assays measure L1 intrinsic biochemical activity, independently of their actual expression in their genomic context. Three-prime transduction refers to the existence of progeny copies containing a 3' transduction, which can be traced back to the original locus and reflect a retrotransposition event. (b) Retrotransposition assay in cultured cells for MCF7 L1 copy EXP_ID_0447 (NEDD4 locus). A full length transcribed L1HS-Ta copy present in the genome of MCF7 cells was subcloned by PCR in an expression vector containing a reporter gene to measure retrotransposition activity and generated four independent clones (pVan610-1 to -4). In transfected HeLa cells, de novo retrotransposition events of engineered L1 copies lead to the introduction of a functional genomic copy of the neomycin phosphotransferase gene, which expression confers resistance to G418. Resistant foci were stained and counted to monitor retrotransposition activity compared to the positive (pJM101/L1.3, wild type L1HS-Ta) and negative (pJM105/L1.3, mutant L1HS-Ta) control conditions. The value of G418 resistant colonies obtained with the positive control was set to 100%. A picture of a representative well with stained colonies is displayed for illustrative purposes under each bar of the graph. The average value of three biological replicates is displayed with error bars corresponding to the standard deviation among the three biological replicates. (c) Detection of 3' transductions in ATLAS-seq data. This in silico screen identifies L1HS-Ta copy (progeny element) with ATLAS-seq clusters containing reads with non-aligning subsequences (soft-clipped), which uniquely map downstream and adjacent to another full length L1HS locus (progenitor element). The panel shows a genome browser view of such a 3' transduction, originating from a full length L1HS-Ta in the TTC28 gene (22q12.1). The soft-clipped region of the reads is shown in color (base code: T, red; A, green; C, blue; G; orange). As expected, the transduced region is flanked by 2 poly(A) tails (poly(T) here since it is located on the reverse genomic strand).
Figure 6
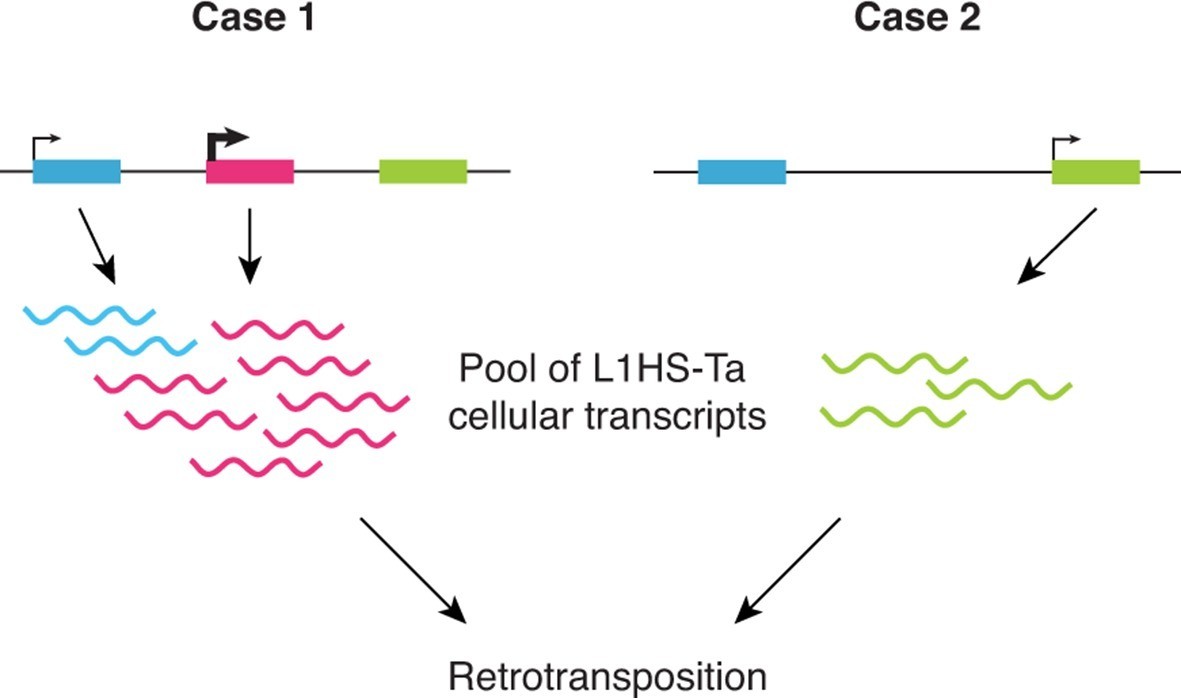
Schematic model showing the highly locus-specific and variable expression of L1HS-Ta elements among different somatic cell types and individuals.
The colored boxes correspond to L1HS-Ta copies, some being polymorphic (pink). The model is developed in the main text.
Additional files
-
Supplementary file 1
Description of the cell lines and RNA-seq datasets used in this study.
Note that HEK-293T data were ambiguously named in the original publication, as 'HEK-293' in the main text, but as 'HEK-293T' in the method section (Sultan et al., 2014). We solved this ambiguity by searching for RNA-seq reads matching the SV40 virus and Neomycin-resistance gene sequences, which confirmed the nature of the cells as being 'HEK-293T'.
- https://doi.org/10.7554/eLife.13926.016
-
Supplementary file 2
Oligonucleotides used in this study, RNA-seq and ATLAS-seq statistics.
Note that primers used to PCR-validate L1 insertions are described in Supplementary file 3 along with the PCR results.
- https://doi.org/10.7554/eLife.13926.017
-
Supplementary file 3
Coordinates of all L1HS-Ta elements mapped in a panel of 12 human cell lines, evidence for 3’ transductions, and correspondence between insertion IDs.
See first sheet for legend.
- https://doi.org/10.7554/eLife.13926.018
-
Supplementary file 4
ATLAS-seq PCR validation results obtained in HEK-293T cells.
- https://doi.org/10.7554/eLife.13926.019
-
Supplementary file 5
Levels of expression, retrotransposition capability and lineages of the full length L1HS-Ta copies mapped by ATLAS-seq.
- https://doi.org/10.7554/eLife.13926.020
Download links
A two-part list of links to download the article, or parts of the article, in various formats.
Downloads (link to download the article as PDF)
Open citations (links to open the citations from this article in various online reference manager services)
Cite this article (links to download the citations from this article in formats compatible with various reference manager tools)
Activation of individual L1 retrotransposon instances is restricted to cell-type dependent permissive loci
eLife 5:e13926.
https://doi.org/10.7554/eLife.13926


