Noise modulation in retinoic acid signaling sharpens segmental boundaries of gene expression in the embryonic zebrafish hindbrain
- University of California, Irvine, United States
- Wentworth Institute of Technology, United States
Figures
Figure 1 with 2 supplements
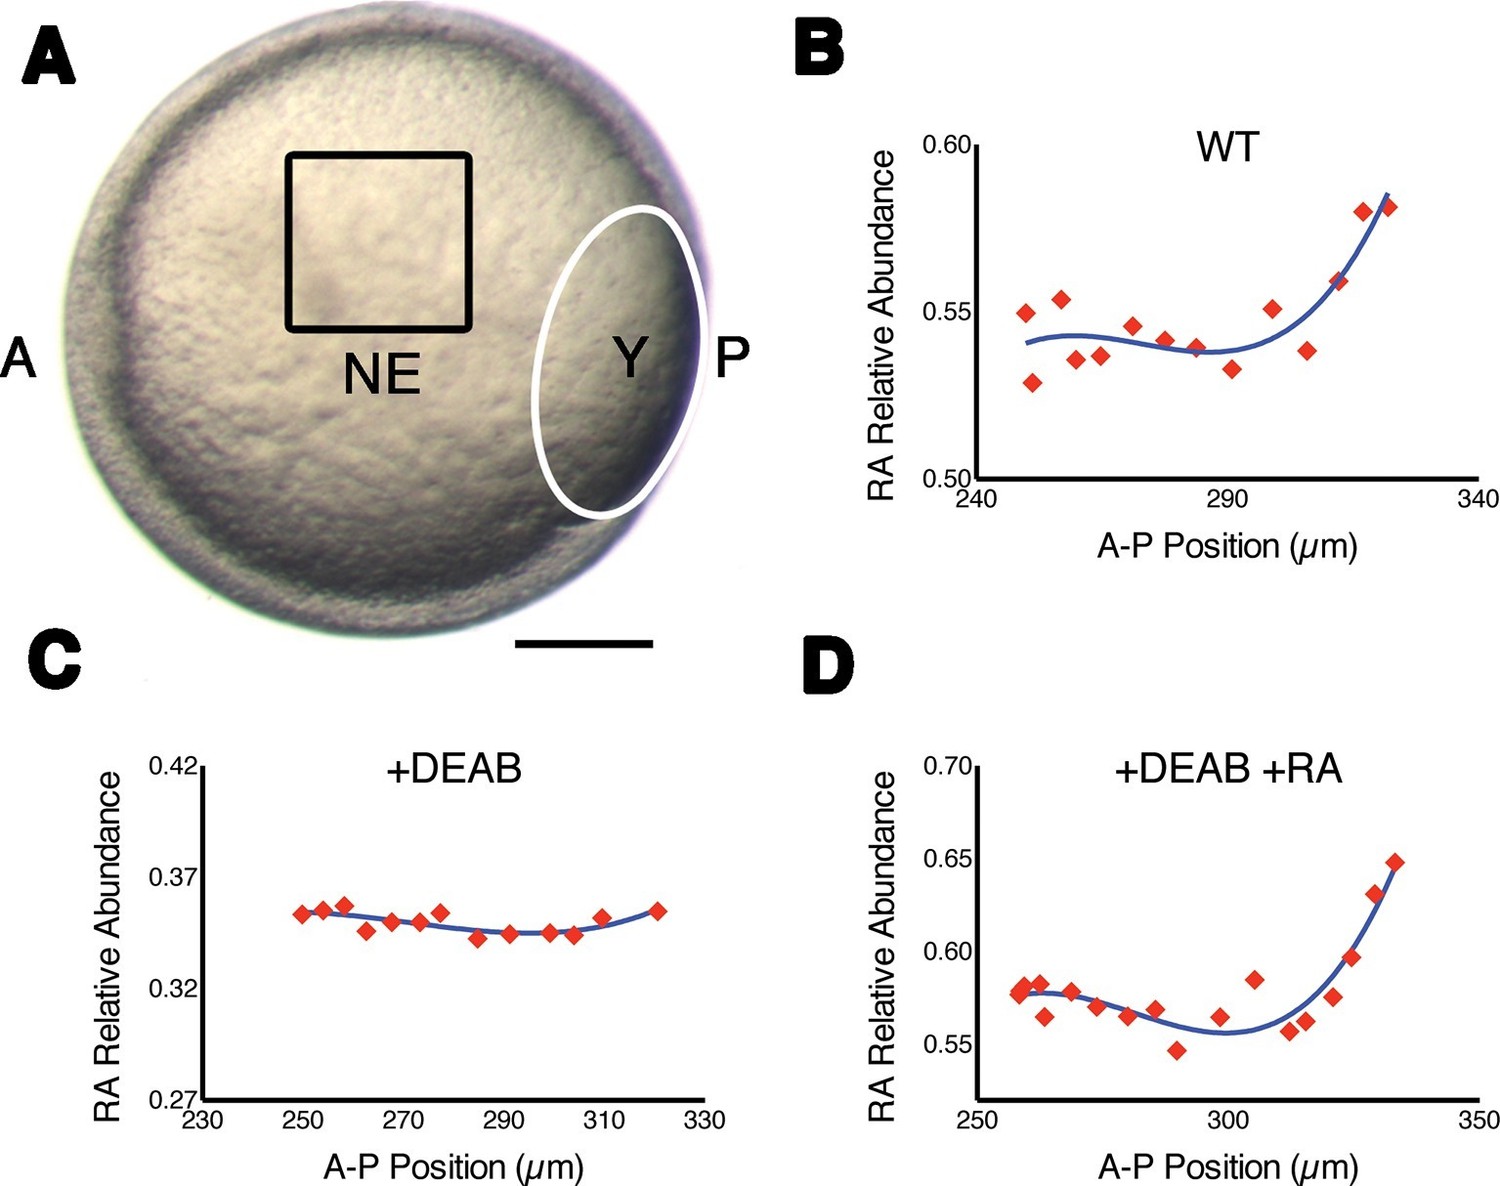
Measuring RA gradients in zebrafish embryos with Phasor-FLIM.
(A) Example of a zebrafish embryo at mid-gastrula stage (8.5 hr post-fertilization) with the imaging area (black square – encompassing positions 230–330 in B-D) in the neural ectoderm (NE) centered ~200 μm from the advancing blastoderm margin (white line) (A: anterior, P: posterior, Y: yolk). Scale bar = 150 μm. (B-D) Plots of the relative abundance of RA (as the difference 1-dRA) versus position in μm along the A-P axis (anterior to the left) in WT (B), DEAB-treated (C), and DEAB-treated embryos co-treated with 0.7 nM exogenous RA (D). Solid curves in (B-D) represent best fit.
Figure 1—figure supplement 1
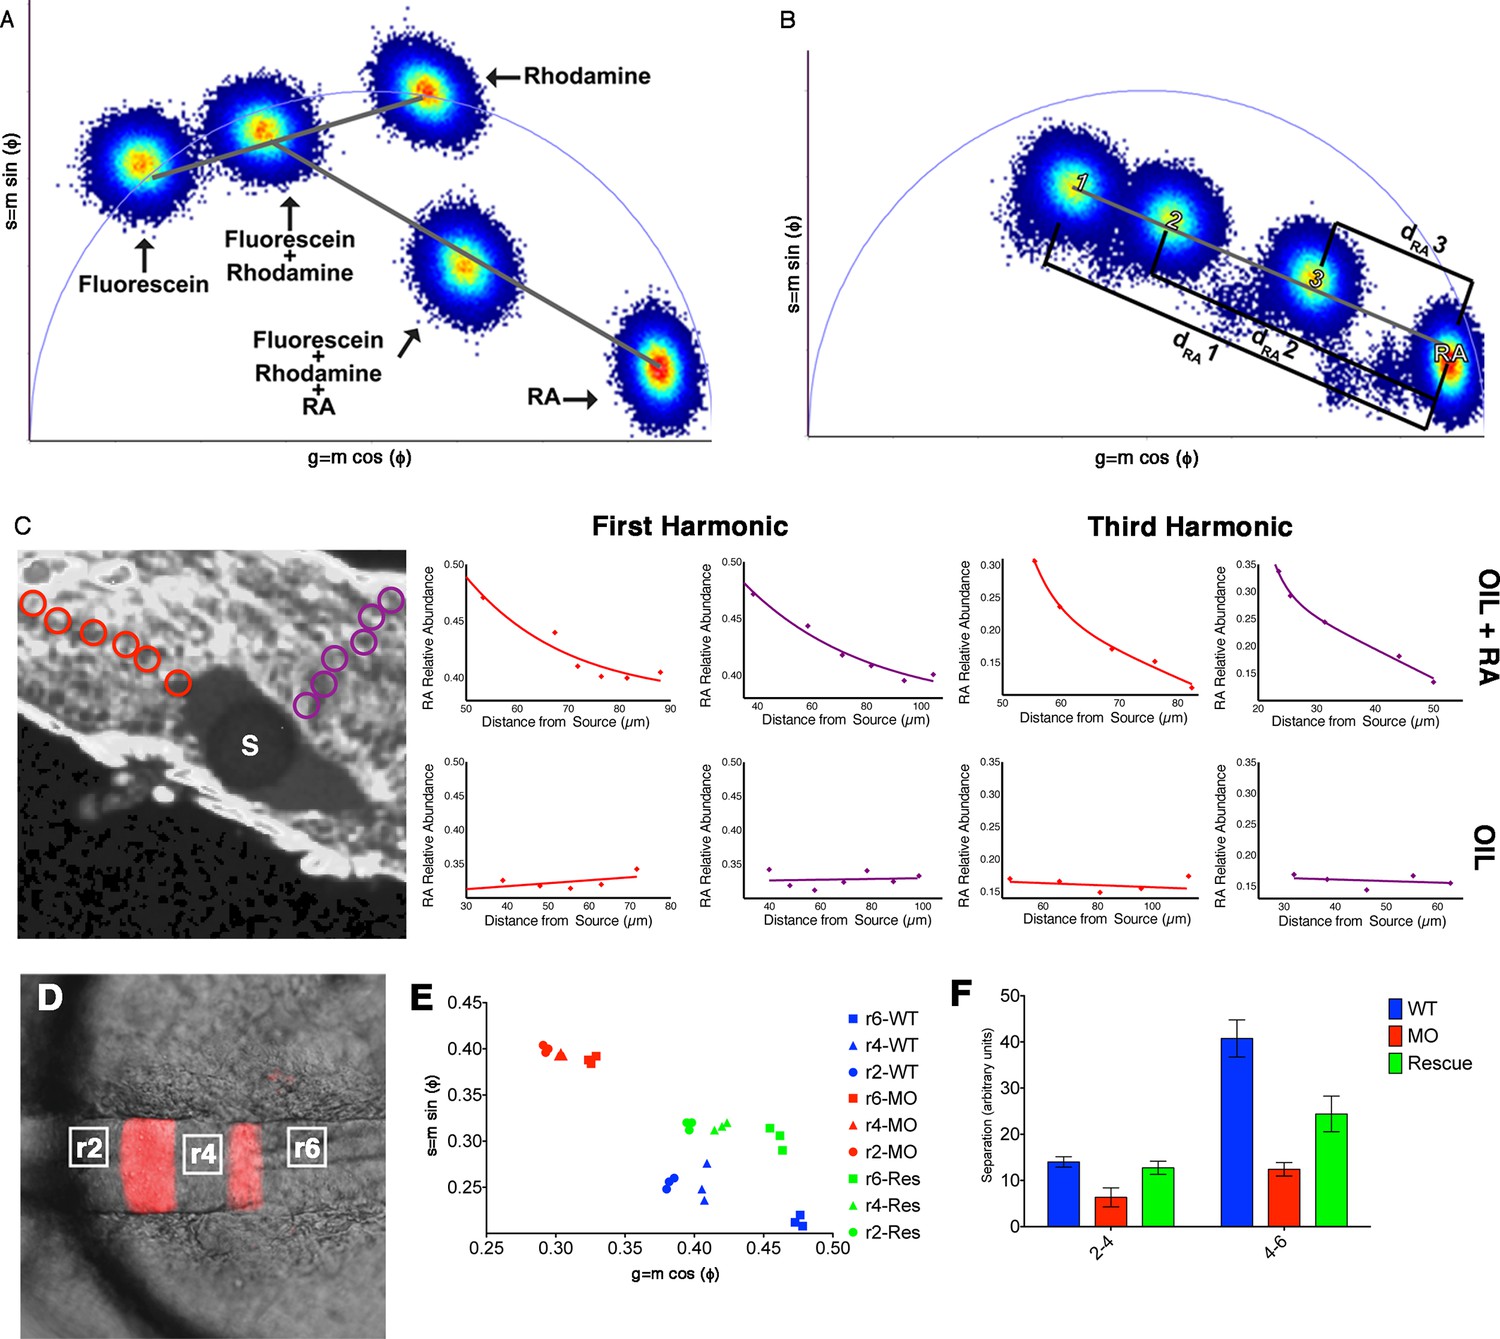
Phasor-FLIM detects relative levels of RA.
(A) Schematic representation of how shifts in measurements displayed on the phasor plot reflect relative levels of each component in a complex mixture. Each plotted position is the weighted linear composition of the positions of all of the autofluorescent constituents (rhodamine, fluorescein and RA) of the mixture. (B) Graphic representation of the measured distance used to calculate the relative abundance of RA (1-dRA). The diameter of the phasor plot equals 1 and thus, the function 1-dRA can never reach zero (even in total absence of RA). (C) Fluorescence intensity image of a zebrafish embryo with an implanted, RA-infused oil droplet to create an ectopic source (S); scale bar = 50 um. Red and purple circles represent the positions measured and graphed for the oil + RA embryo (top row). The plots represent the relative abundance of RA (as the difference 1-dRA) with respect to distance from the source (lines represent best fit curves). Analysis of the RA distribution from an ectopic RA source at the 3rd harmonic, corresponding to measurements at the 1st harmonic, reveals that the observed differences are due to changes in the relative abundance of RA. Embryos injected with oil alone (bottom row) show no detectable differences in the distribution or RA with distance. Plots presented are representative figures from 6–12 embryos from each condition, with three independent datasets. (D) mCherry fluorescence in r3 and r5 combined with DIC in a living Tg(shhb:KalTA4,UAS-E1b:mCherry) transgenic zebrafish hindbrain (anterior to the left) used for FLIM measurements. White boxes represent areas assessed by FLIM in E and F. (E) Phasor plot showing typical FLIM signatures for these three areas in wildtype embryos (blue), embryos injected with Aldh1a2-MO (red) or injected with Aldh1a2-MO and subsequently rescued by transplanting WT paraxial mesoderm (green). The FLIM signatures in rhombomeres of MO-injected embryos lie further away from that of absolute RA, indicating reduced RA concentration. Transplanted WT mesoderm partially rescues the positions of FLIM-signatures for each rhombomere in the phasor plot. (F) Quantification of the distances of r2-r4 and r4-r6 in the phasor space. The separation of RA levels in these rhombomeres is significantly reduced in MO-injected embryos and rescued by transplanted WT mesoderm.
Figure 1—figure supplement 2

Regression analysis of RA gradient shape.
(A) Fit results for ordinary least squares regression analyses of the pooled dataset. Note that the red line for the exponential fit is hidden under the linear and quad2 fits. Column 2 shows the p-values for a t-test on each coefficient. In the quadratic case, the linear term was not significant, and thus it was re-fit as Quadratic 2. Column 4 shows the correctness of the fit as the adjusted R2. Each of the fits (with all significant terms) explains similar amounts of the variance, and thus it is hard to differentiate between curve types. However, in each case there is a highly-significant (p<10–14 with associated F-test values similar) increasing trend, indicating the presence of a gradient. (B) To compare anterior and posterior portions of the gradient, we split the dataset at x = 310 and ran the fits on the two portions. x < 310. Results were almost identical to the full fit (A). As before, the linear term in the two-term quadratic was not significant. x > 310. Results were almost identical to the full fit (A), including the exponential curve. Here the quadratic fit is clearly not statistically significant, indicating it is not a mix of behaviors. (C) The exponential curve is based on the linear fit of x with the logarithm of [RA]. Note that the magnitude of differences in [RA] is sufficiently small that the logarithmic change basically becomes a translation. Thus on the semi-translated data lower points in the middle cause the linear fit of the log to have a small slope, making the exponential of the coefficient small enough to make its resulting fit look linear. Thus, given measured differences in relative RA abundance, exponential, linear, and quadratic fits are indistinguishable, even at the tail end of the gradient.
Figure 2 with 1 supplement
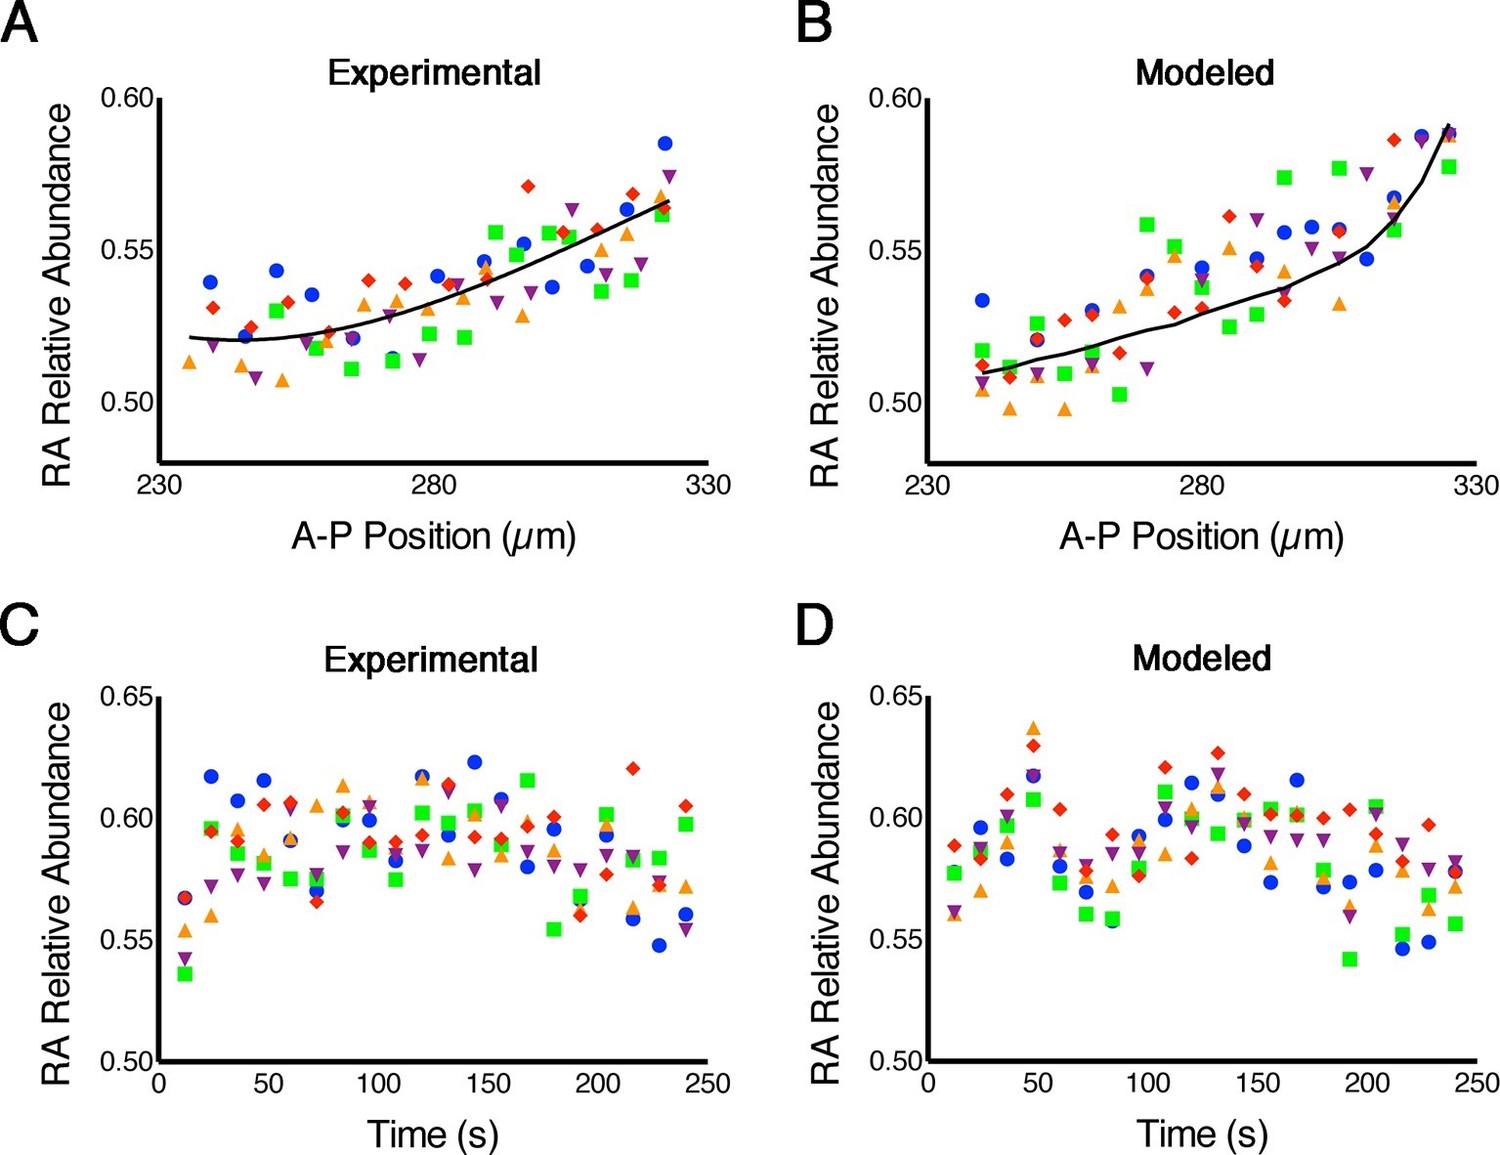
RA gradients are noisy in space and time.
(A, B) Spatial noise. Plots show relative abundance of RA in five parallel rows of cells (each color corresponds to a different row) along the A-P axis of the neural ectoderm within a single embryo. (A) Experimental – each point represents the integrated signal of 40 consecutive FLIM measurements (2.7 min) (solid line represents best fit). (B) Computational – line represents the mean of 500 model simulations. (C, D) Temporal noise. Graphs show variability in relative abundance of RA in five single cells (each color corresponds to a different cell) at equivalent A-P positions over time. (C) Experimental – FLIM measurements were taken every 12 s. (D) Computational – colors correspond to individual cells for each stochastic realization. See also Supplementary file 1.
Figure 2—figure supplement 1
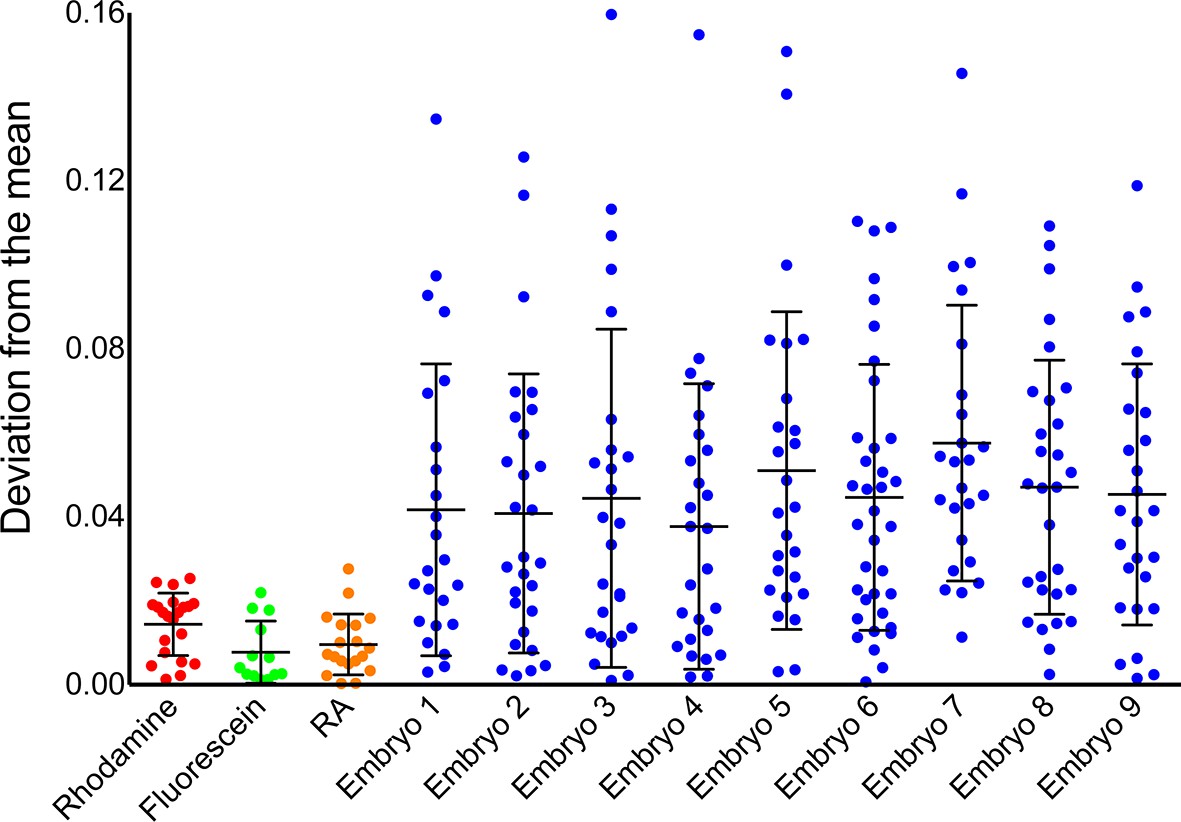
Instrument noise cannot account for noise in phasor-FLIM measurements of RA.
Comparison of temporal noise in FLIM measurements of three different solutions (fluorescein in aqueous KOH, pH 9.0, rhodamine in water and RA in DMSO) and single cells in 9 different wildtype (WT) embryos. The graph represents the deviation from the mean position on the phasor plot for the solutions and the deviation from the mean abundance of RA for the cells. Each point corresponds to values at a single time point and the lines represent the mean and standard deviation. The variability in the measurements from cells is larger than those for solutions and vastly exceeds the maximum theoretical uncertainty due to photon shot noise.
Figure 3 with 1 supplement
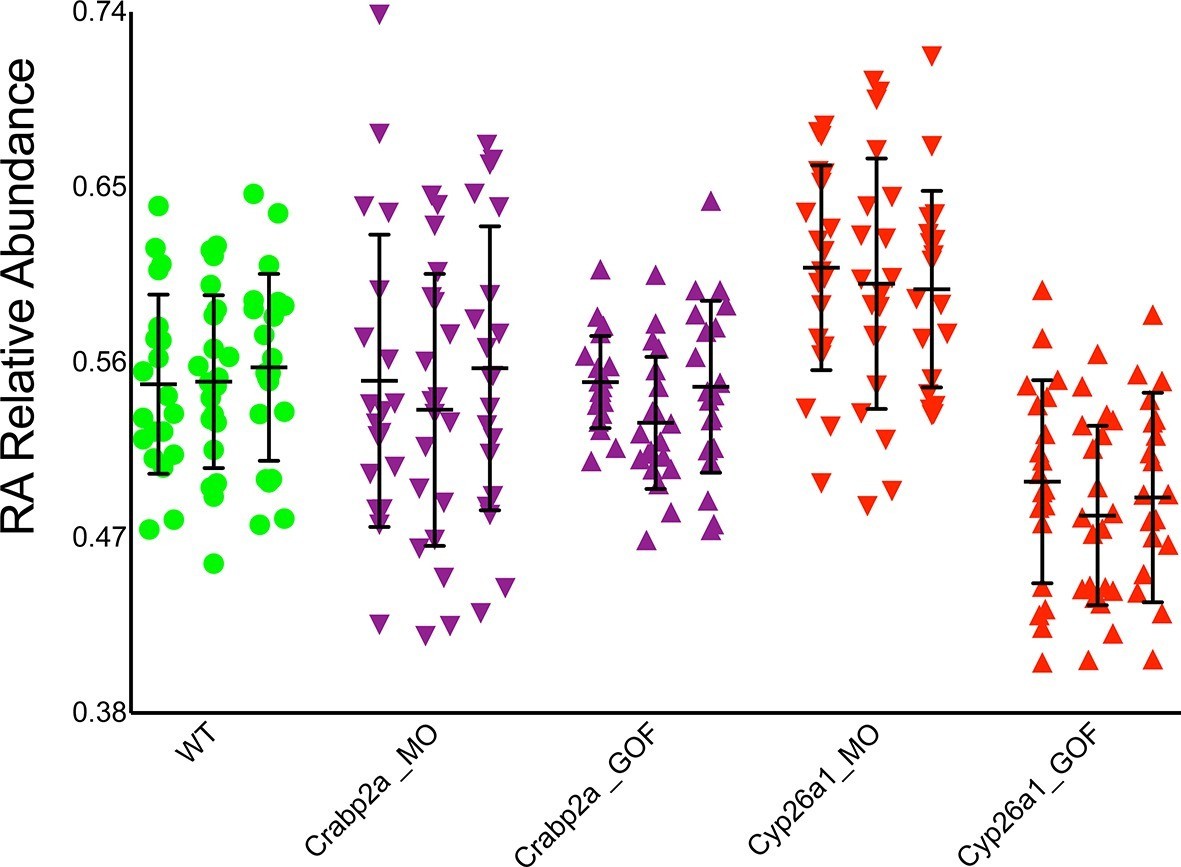
Crabp2a but not Cyp26a1 attenuates level of noise in RA.
Analysis of the temporal distribution of RA’s relative abundance in wildtype (WT), Crabp2a morpholino (MO)-injected, Crabp2a mRNA-injected (gain-of-function - GOF) and Cyp26a1 MO and mRNA-injected zebrafish embryos. Each column shows the signal obtained for a single representative cell and each point corresponds to a single time point. Lines represent the mean and standard deviation. Embryos with reduced or increased levels of Crabp2a show increased and decreased variability in RA, respectively, while altering Cyp26a1 changes the mean concentrations but not the variance.
Figure 3—figure supplement 1
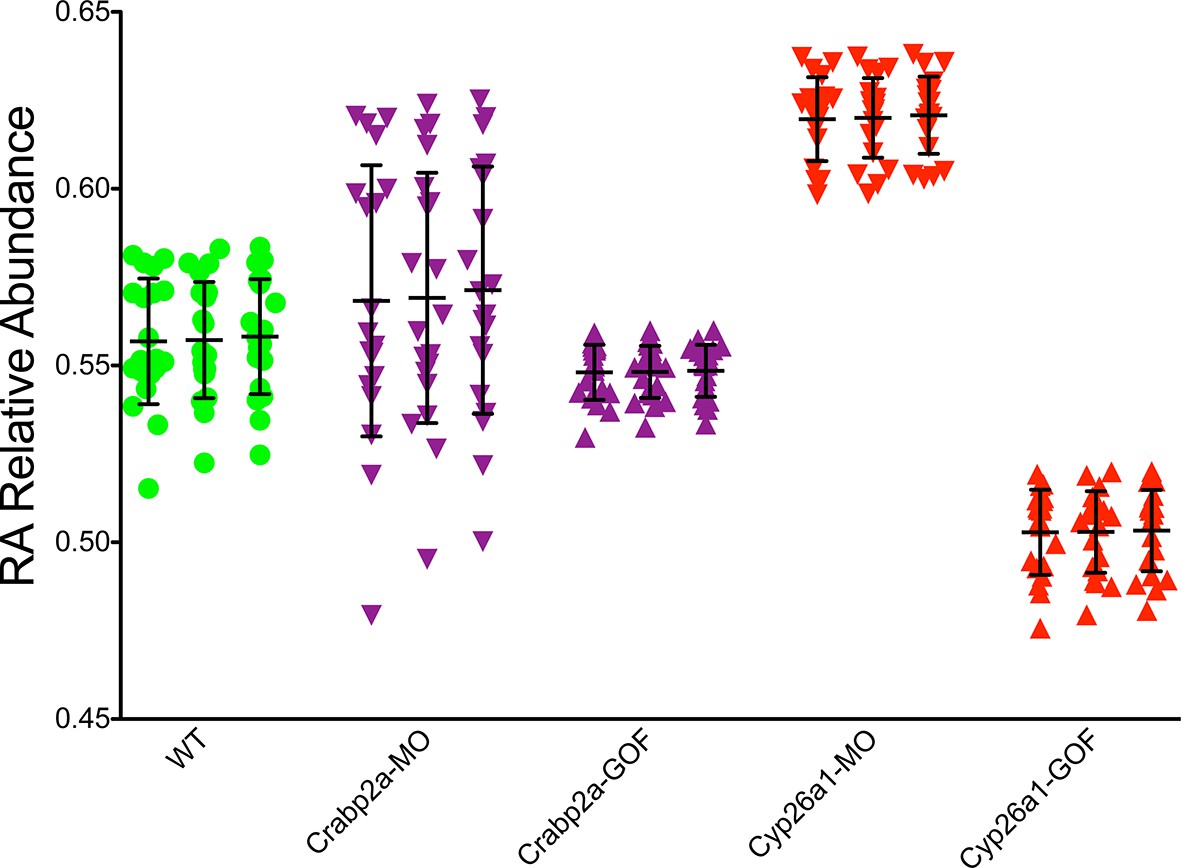
Crabp2a actively modulates RA signal noise.
Results of three realizations of our stochastic mathematical model analyzing the temporal distribution of RA’s relative abundance in wildtype (WT), Crabp2a morpholino (MO)-injected, Crabp2a mRNA (gain-of-function - GOF) injected, Cyp26a1 MO-injected and Cyp26a1 mRNA-injected zebrafish embryos. Each column shows the signal obtained for a single realization for a single cell. Each point corresponds to a single time point. Lines represent the mean and standard deviation. Embryos with altered Crabp2a expression show changes in the variability in free intracellular RA, while embryos with altered Cyp26a1 expression show changes in the mean levels of RA as in the experimental case shown in Figure 3.
Figure 4 with 1 supplement
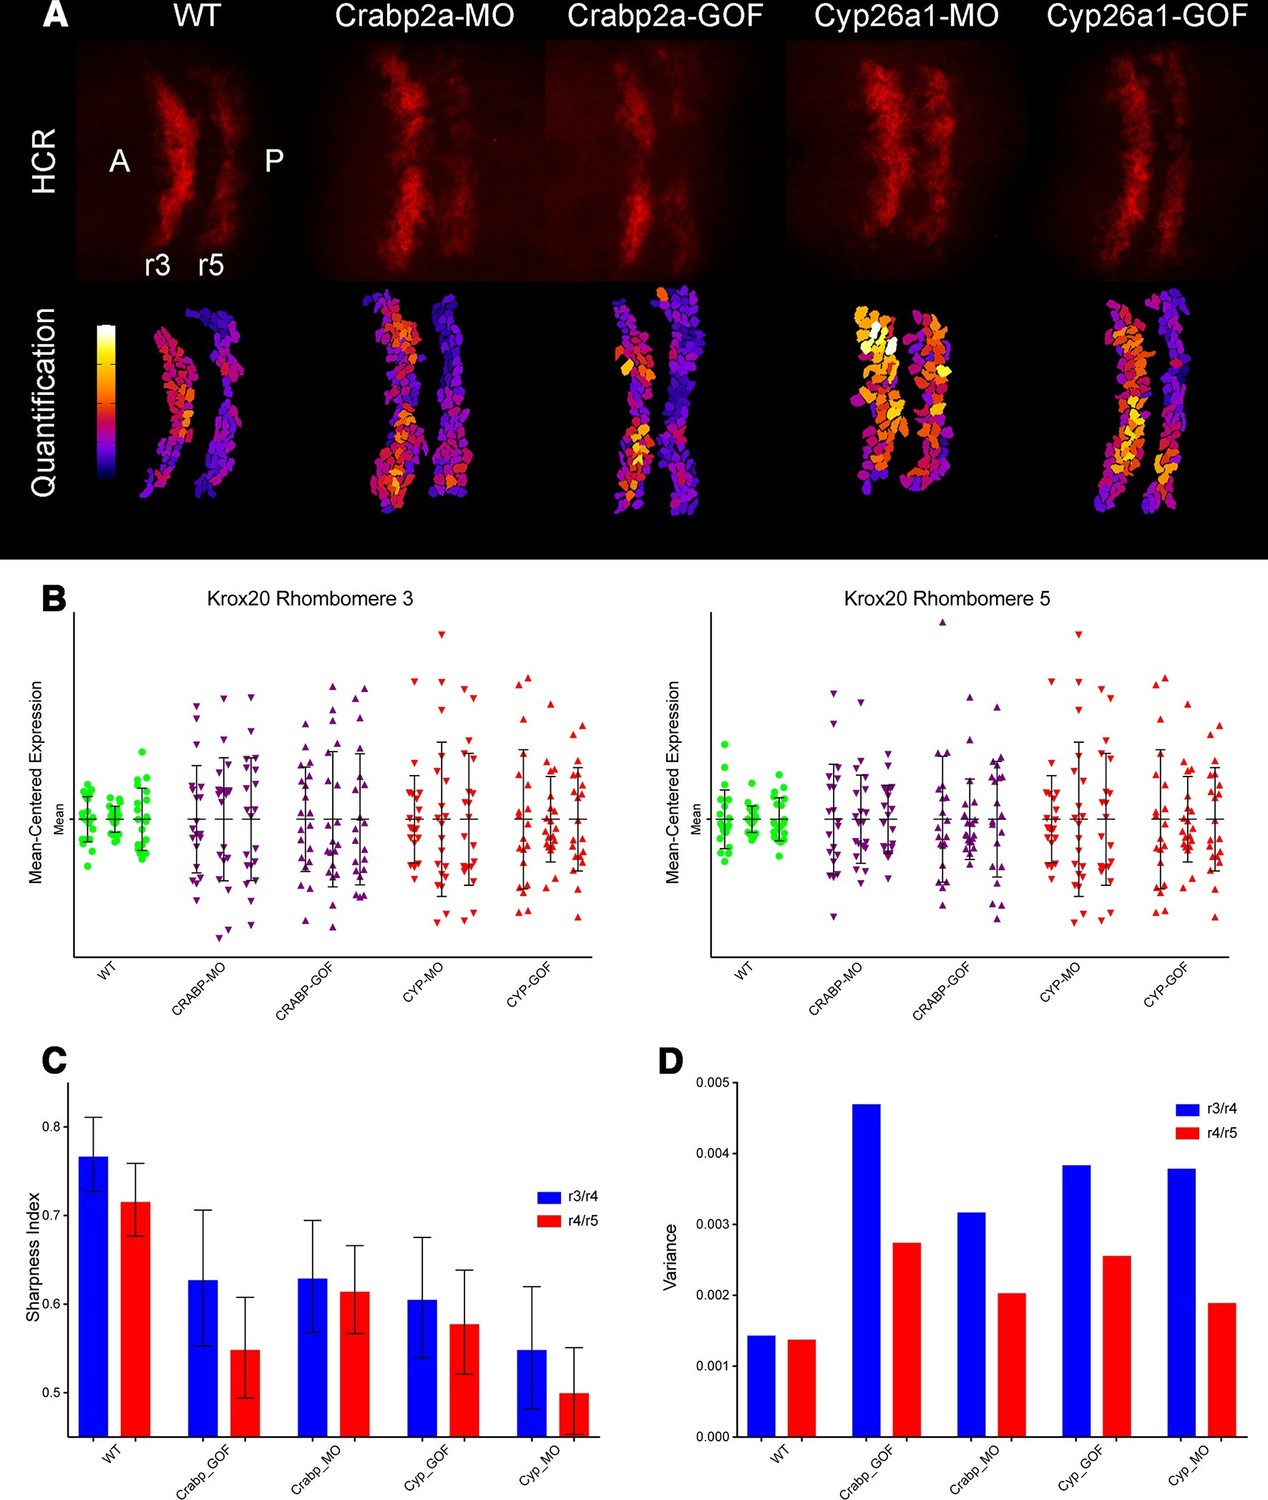
Both Crabp2a and Cyp26a1 attenuate noise in krox20 expression and facilitate rhombomere boundary sharpening.
(A) Representative Z projections of r3 and r5 (dorsal views, anterior to the left) analyzed by hybridization chain reaction (HCR) for krox20 (r3, rhombomere 3; r5, rhombomere 5; A, anterior; P, posterior). We performed all HCR analyses on raw 3D data and later generated Z-projections and enhanced contrast to simplify presentation. Colors correspond to total krox20 RNA in each cell as measured by total fluorescence intensity bracketed for maximum and minimum for the 5 conditions and represented in a linear scale. (B) Mean-centered analysis of krox20 expression of a subset of cells for r3 and r5 from 3 randomly selected embryos for each condition. (C) Sharpness indices of the r3/r4 boundary (blue) and r4/r5 boundary (red) for embryos from each of the treatment conditions. Bars correspond to s.d. (D) Analysis of the variance in boundary sharpness from the quantification in (C). All perturbations yielded significant differences from wild-type controls, as noted in the Statistical Analysis. Therefore no asterisks were included to indicate columns representing statistical significance.
Figure 4—figure supplement 1
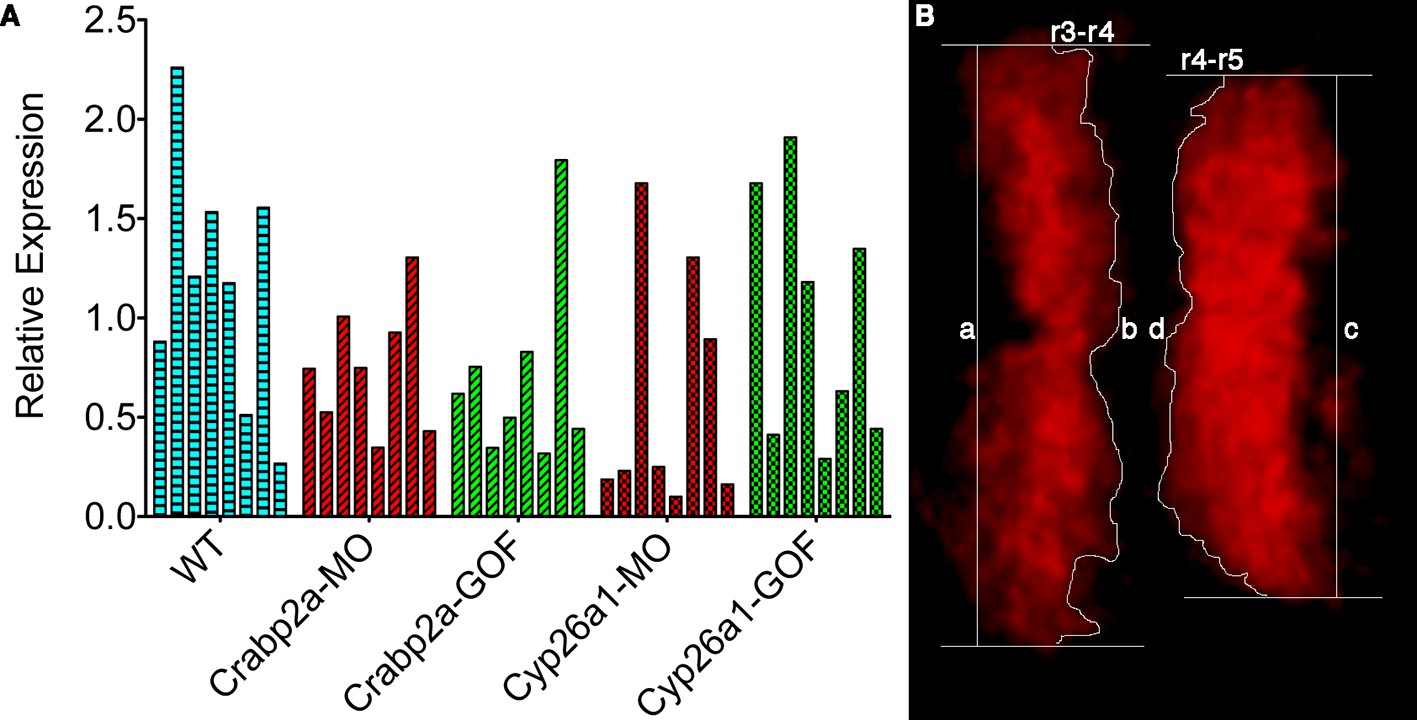
Single embryos show highly variable mean levels of krox20 expression and boundary sharpness.
(A) Embryos were injected with mRNA coding for the membrane-bound GFP-CAAX and morpholinos (MO) against Crabp2a or Cyp26a1 or mRNA coding for Crabp2a-Myc or Cyp26a1-Myc or water (WT). Ef1α was used as the standard and a homogeneous collection of mRNA from 100 wildtype embryos was used as the reference for the △△Ct method. Experiments were run in triplicates and repeated 4 (four) times. (B) A sharpness index was calculated using the ratio between the measured length of the theoretical sharp boundary and the actual measured length of the boundary of krox20 expression, consistent with previous models (Zhang et al., 2012). In this example, sharpness of the r3-r4 boundary is the ratio of a/b and the index for the r4-r5 boundary is the ratio c/d.
Author response image 1
Raw (not contrast enhanced) z-projections of the 3D stacks utilized to quantify the HCR data (Krox20 gene expression and boundary sharpness).
https://doi.org/10.7554/eLife.14034.015
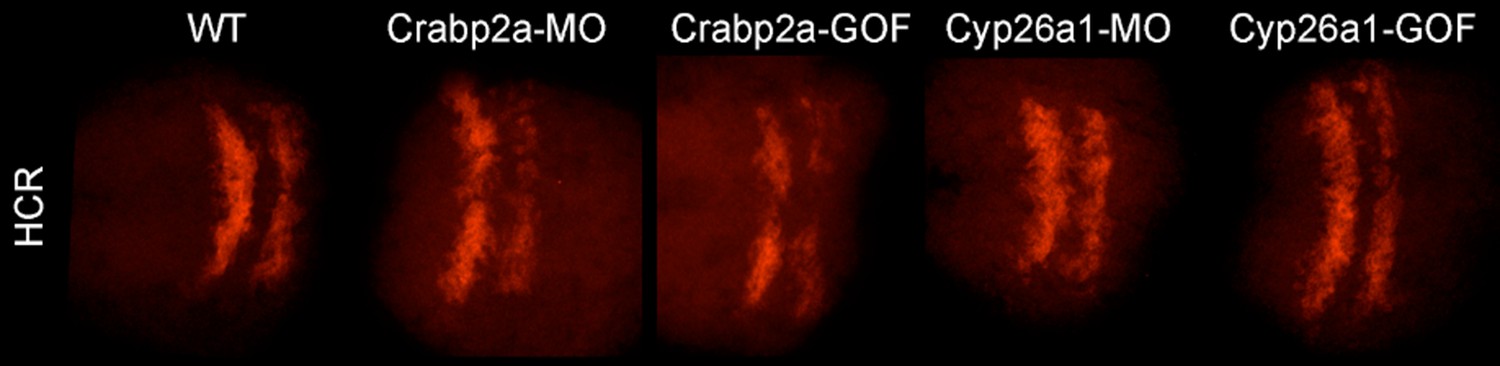
Author response image 2
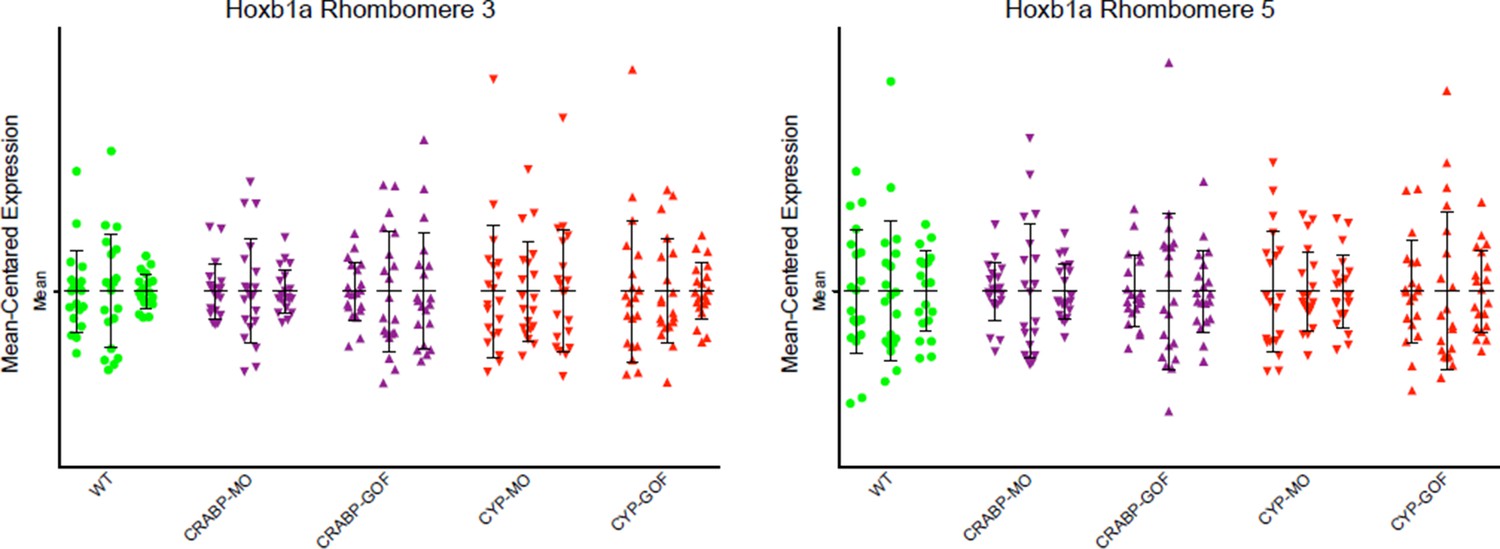
Mean-centered analysis of hoxb1a expression of a subset of cells for r3 and r5 from 3 randomly selected embryos for each indicated treatment.
The results show no significant differences between the treatments and the WT controls
Videos
Video 1
3D rendering of HCR dataset.
3D rendering shows the specific HCR signal on rhombomeres 3 and 5 (red) with very low non-specific signal in surrounding tissue, which appears evenly distributed. DAPI signal (blue) demarcates nuclei of cells that are either Krox20 positive (red) or negative (no signal).
Tables
Table 1
Sequences of the probes used for HCR corresponding to the specific genes as indicated and flanked by the corresponding adaptor sequences (B1 or B2). P1, P2, etc. corresponds to the different probes used for each gene.
| Probe | Sequence |
|---|---|
| Krox20_B1-P1 | 5'-GAGGAGGGCAGCAAACGGGAAGAGTCTTCCTTTACGATATTAGAAGTGGCTGGGGGAGACTGAGGATGCAGGTGACGAGGATGCTGAGGATATATAGCATTCTTTCTTGAGGAGGGCAGCAAACGGGAAGAG-3' |
| Krox20_B1-P2 | 5'-GAGGAGGGCAGCAAACGGGAAGAGTCTTCCTTTACGATATTGTGGAAAGGAACGCAGACGGGTCTTGATAGACCTCTCCGCATCCAGAGTAATATAGCATTCTTTCTTGAGGAGGGCAGCAAACGGGAAGAG-3' |
| Krox20_B1-P3 | 5'-GAGGAGGGCAGCAAACGGGAAGAGTCTTCCTTTACGATATTAGGTTGGAAAAAGCCGGCGTAGTCCGGGATTATAGGGAACAACCCAGAGTATATAGCATTCTTTCTTGAGGAGGGCAGCAAACGGGAAGAG-3' |
| Krox20_B1-P4 | 5'-GAGGAGGGCAGCAAACGGGAAGAGTCTTCCTTTACGATATTGTTAGAGGAGGCGGTAATTTGAAAGAGTCCAGCGGGCAGGAGAACGGTTTATATAGCATTCTTTCTTGAGGAGGGCAGCAAACGGGAAGAG-3' |
| Hoxb1a_B2-P1 | 5'-CCTCGTAAATCCTCATCAATCATCCAGTAAACCGCCAAAAAAGTGTGGAAAGGGCCCGGGAACGCCTGGTCCAAGTGGTGGTATCCAGCCTAAAAAAGCTCAGTCCATCCTCGTAAATCCTCATCAATCATC-3' |
| Hoxb1a_B2-P2 | 5'-CCTCGTAAATCCTCATCAATCATCCAGTAAACCGCCAAAAACAGTTCCACCATAGGTAAGGCCCATGCCAGTTTGATTTTGGTGCTGGTGAAAAAAAGCTCAGTCCATCCTCGTAAATCCTCATCAATCATC-3' |
| Hoxb1a_B2-P3 | 5'-CCTCGTAAATCCTCATCAATCATCCAGTAAACCGCCAAAAATGTTGAGCATAGTCCGAGTTGGCGCAGGCCTGTGTCCCATAACTTGTTGTAAAAAAGCTCAGTCCATCCTCGTAAATCCTCATCAATCATC-3' |
| Hoxb1a_B2-P4 | 5'-CCTCGTAAATCCTCATCAATCATCCAGTAAACCGCCAAAAAAGTACGCACCGGCCATAGAGCCATAGTGTGGACTGGCATTTGATGTTGAAAAAAAAGCTCAGTCCATCCTCGTAAATCCTCATCAATCATC-3' |
| Hoxb1a_B2-P5 | 5'-CCTCGTAAATCCTCATCAATCATCCAGTAAACCGCCAAAAAGAGTGATCAGATTGATCCTCGAGGTCTTTAGACGAAGTGGAGGAAGCAGGAAAAAAGCTCAGTCCATCCTCGTAAATCCTCATCAATCATC-3' |
Additional files
-
Supplementary file 1
(A) Stochastic mathematical modeling.
(B) Modeling parameters
- https://doi.org/10.7554/eLife.14034.014
Download links
A two-part list of links to download the article, or parts of the article, in various formats.
Downloads (link to download the article as PDF)
Open citations (links to open the citations from this article in various online reference manager services)
Cite this article (links to download the citations from this article in formats compatible with various reference manager tools)
Noise modulation in retinoic acid signaling sharpens segmental boundaries of gene expression in the embryonic zebrafish hindbrain
eLife 5:e14034.
https://doi.org/10.7554/eLife.14034


