Single molecule analysis reveals reversible and irreversible steps during spliceosome activation
- University of Wisconsin-Madison, United States
- Brandeis University, United States
- Howard Hughes Medical Institute, University of Massachusetts Medical School, United States
Figures
Figure 1 with 2 supplements
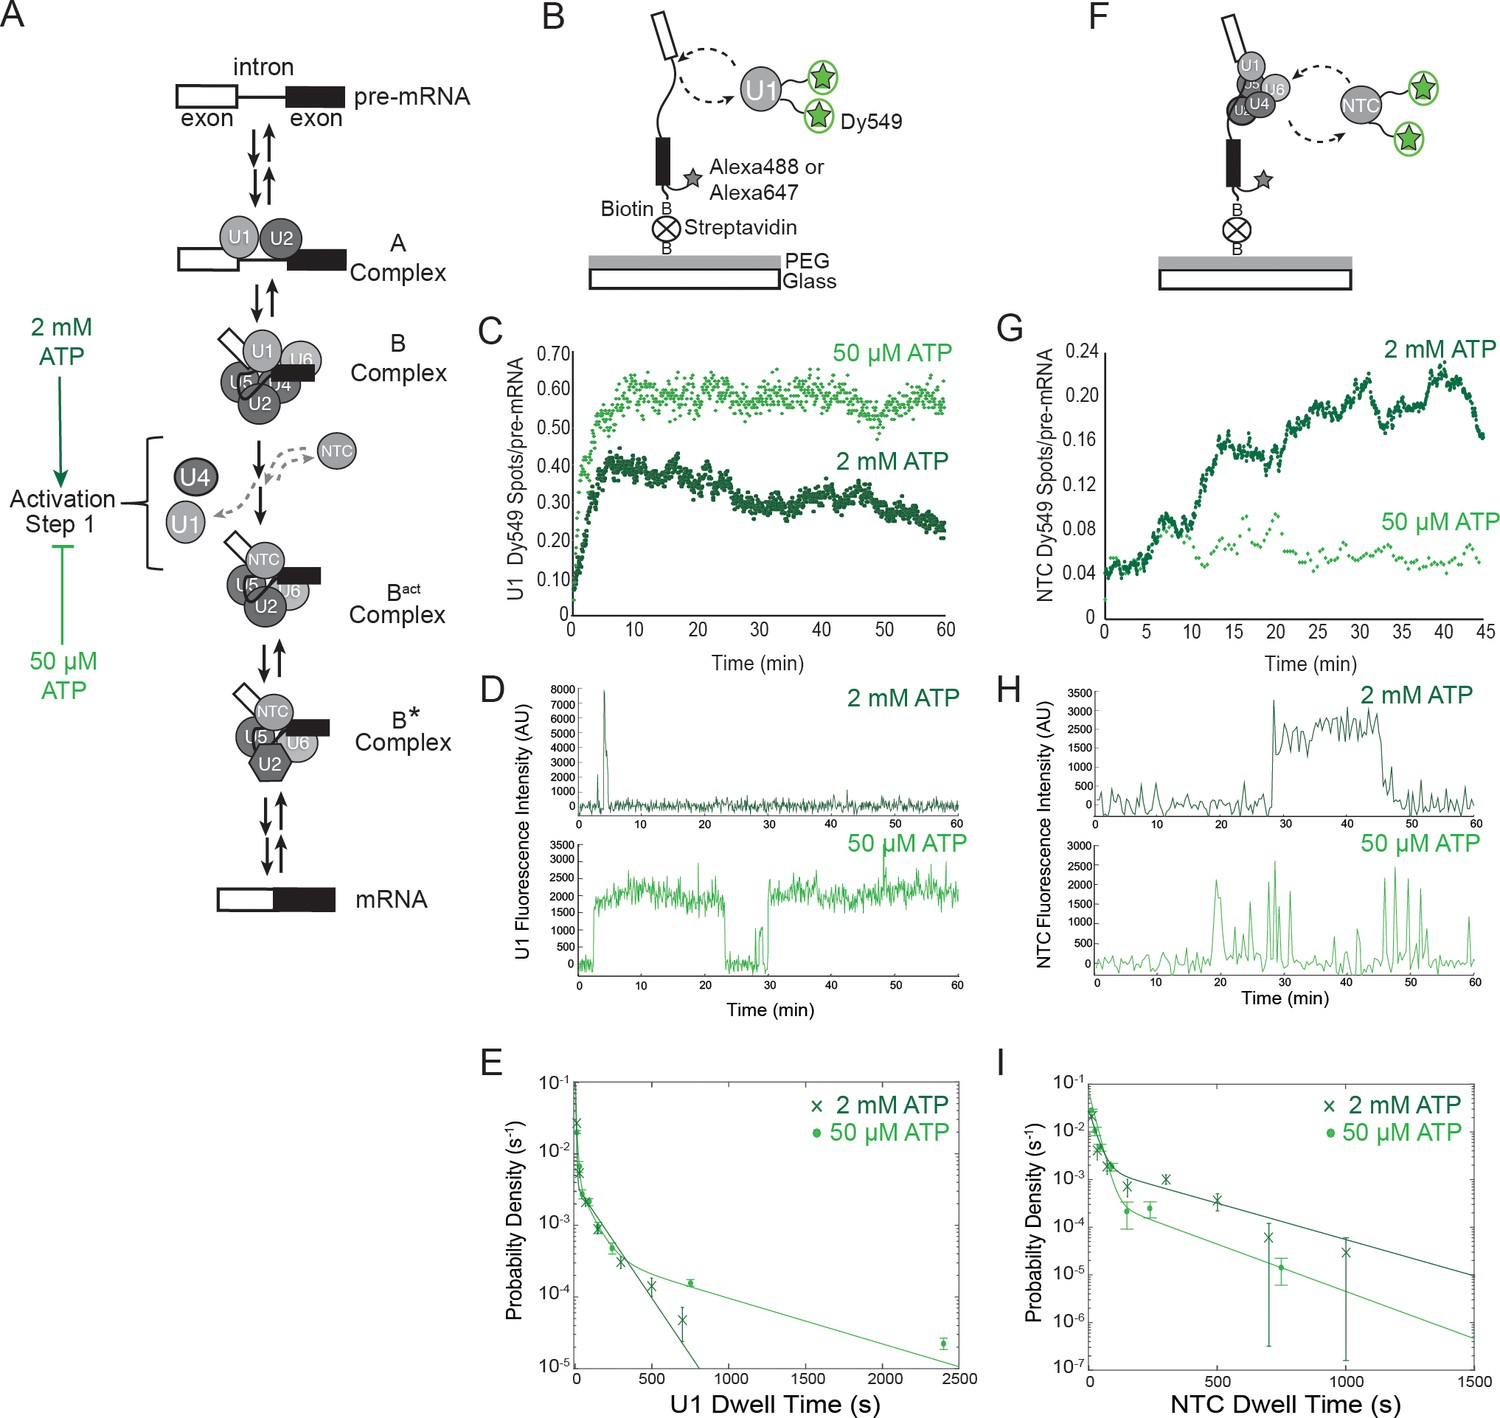
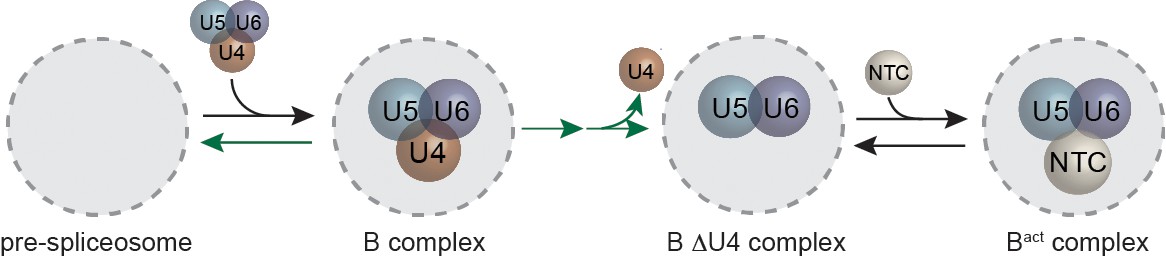
Cartoon of major steps in spliceosome assembly and activation and impact of 2 mM (dark green) and 50 µM (light green) ATP concentrations on U1 and NTC interactions with pre-mRNA.
(A) Spliceosome assembly and activation. snRNPs interact with the pre-mRNA to form the A complex, containing U1 and U2 associated with the 5' SS and BS, respectively. The U4/U6.U5 tri-snRNP is then recruited to form B complex. At 2 mM ATP, activation can proceed and result in release of U1 and U4 and acquisition of the NTC to form Bact. Subsequent steps then lead to splicing. At 50 µM ATP, the first step of activation is inhibited. (B) Schematic of a two-color CoSMoS experiment for observing U1 binding dynamics. The U1 snRNP contained two green-excited (Dy549) fluorophores attached to two different proteins while the pre-mRNA was immobilized to the slide surface and contained a single Alexa 488 or Alexa 647 fluorophore. (C) Time record of the number of U1 fluorescence spots relative to the number of surface-tethered pre-mRNA molecules at 2 mM and 50 µM ATP. (D) Example fluorescence intensity records showing binding of U1 to individual pre-mRNA molecules at 2 mM and 50 µM ATP. (E) Probability density histogram of dwell times for U1 at 2 mM and 50 µM ATP (N = 535 events on 166 pre-mRNAs at 50 µM ATP). Results at 2 mM ATP were originally reported by Hoskins et al. and those data sets were used to generate this new figure for comparison (Hoskins et al., 2011). Lines represent fits of the distributions of dwell times to multi-exponential equations. (F) Schematic of a two-color CoSMoS experiment for observing NTC binding dynamics. (G) Time record of the number NTC fluorescence spots relative to the number of surface-tethered pre-mRNA molecules at 2 mM and 50 µM ATP. (H) Example fluorescence intensity records showing binding of the NTC to individual pre-mRNA molecules at 2 mM and 50 µM ATP. (I) Probability density histogram of dwell times for the NTC at 2 mM and 50 µM ATP (N = 234 events on 169 pre-mRNAs at 50 µM ATP). Results at 2 mM ATP were originally reported by Hoskins et al. and those data sets were used to generate this new figure for comparison (Hoskins et al., 2011). Lines represent fits of the distributions of dwell times to multi-exponential equations. Parameters for fits in (E) and (I) are shown in Figure 1— source data 1.
-
Figure 1—source data 1
Fit parameters describing the distribution of dwell times observed for the U1 and NTC subcomplexes.
- https://doi.org/10.7554/eLife.14166.004
Figure 1—figure supplement 1
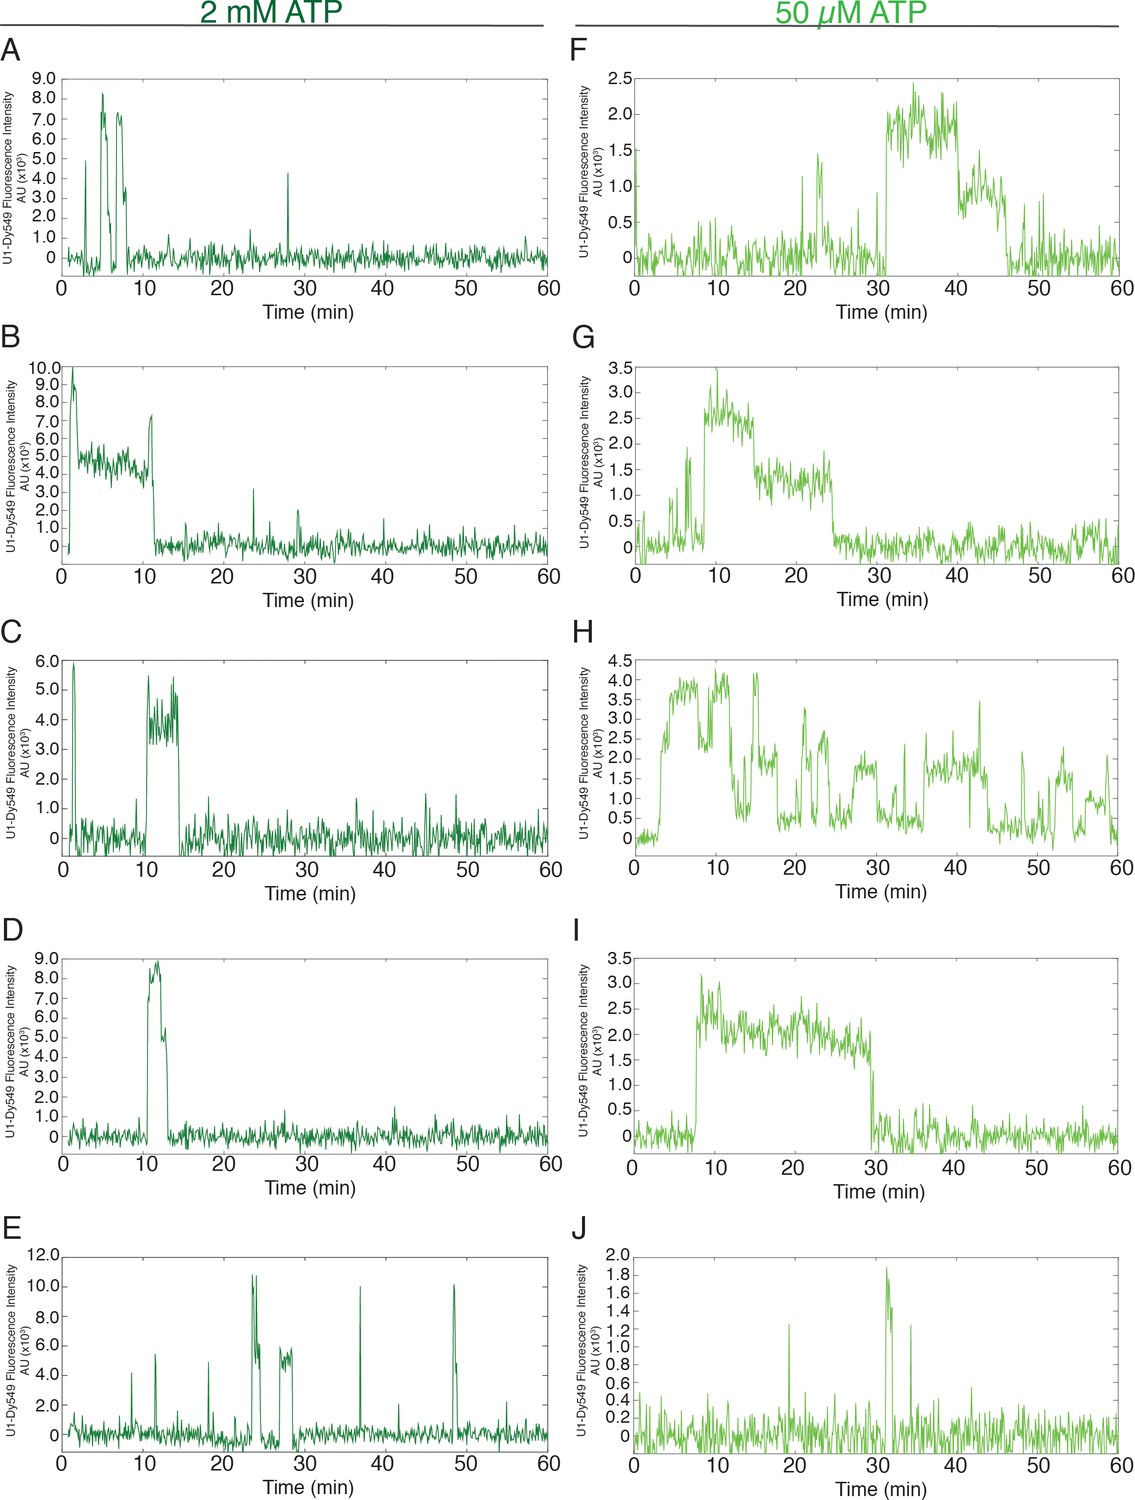
Additional examples (to supplement those shown in Figure 1D) of fluorescence intensity traces showing individual U1-SNAP subcomplexes co-localizing with surface-tethered pre-mRNA in the presence of 2 mM (A–E, dark green) or 50 µM (F–J, light green) ATP.
https://doi.org/10.7554/eLife.14166.005
Figure 1—figure supplement 2

Additional examples (to supplement those shown in Figure 1H) of fluorescence intensity traces showing individual NTC-SNAP subcomplexes co-localizing with surface-tethered pre-mRNA in the presence of 2 mM (A–E, dark green) or 50 µM (F–J, light green) ATP.
https://doi.org/10.7554/eLife.14166.006
Figure 2 with 2 supplements
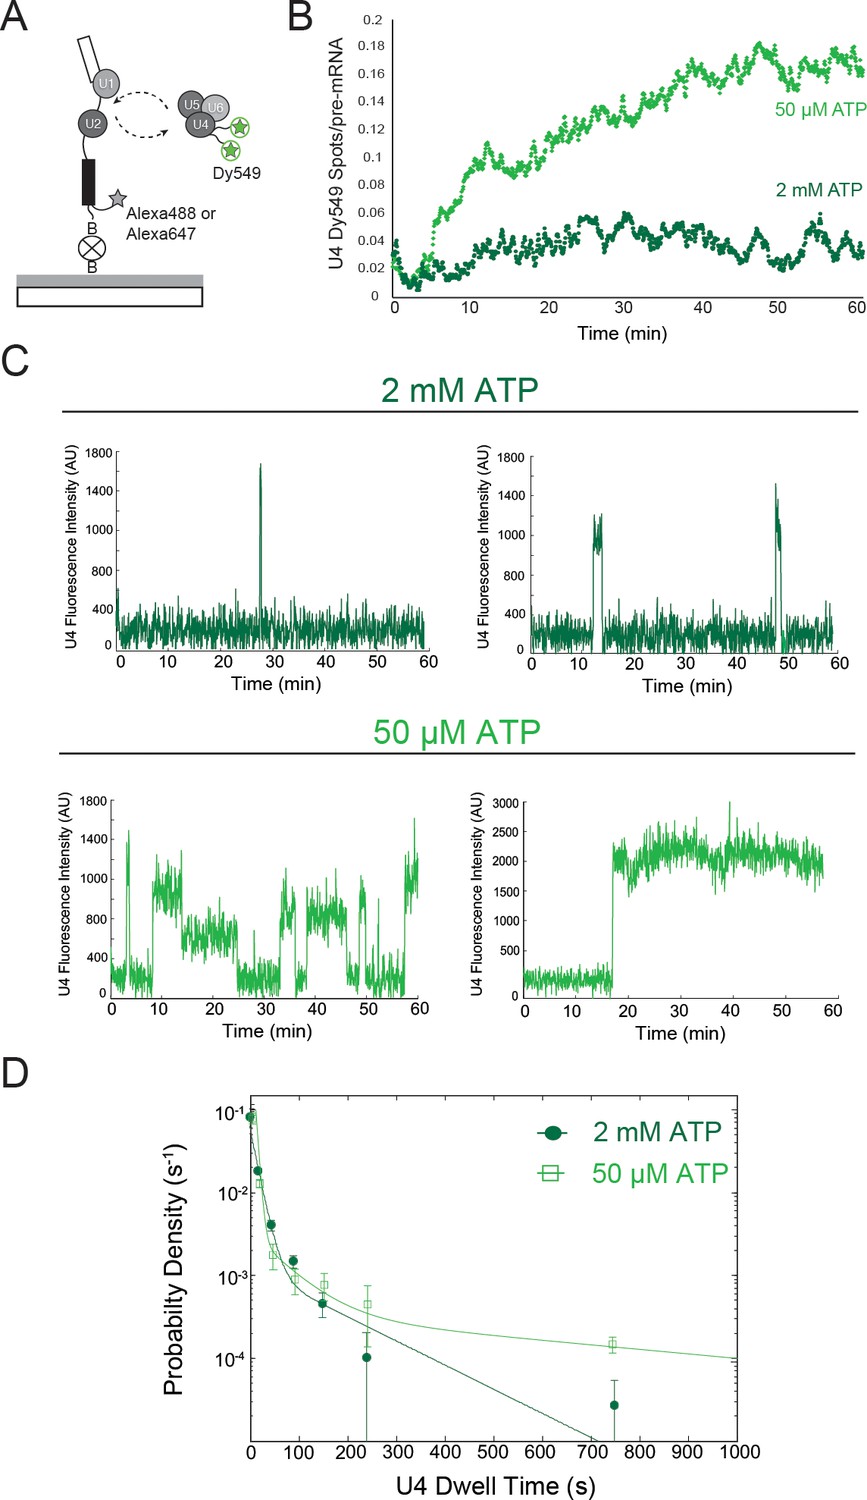
Two-color CoSMoS observation of U4 dynamics at 2 mM (dark green) and 50 µM (light green) ATP.
(A) Schematic of an experiment for observing U4 binding dynamics with a design similar to that in Figures 1B and 1F. (B) Time record of the number U4 fluorescence spots relative to the number of surface-tethered pre-mRNA molecules at 2 mM and 50 µM ATP. (C) Example fluorescence intensity records showing binding events of U4 to single pre-mRNA molecules at 2 mM and 50 µM ATP. (D) Probability density histogram of dwell times for the U4 at 2 mM (N = 336 events on 229 pre-mRNAs) and 50 µM ATP (N = 151 events on 226 pre-mRNAs). Lines represent fits of the distributions of dwell times to multi-exponential equations; fit parameters for U4 are given in Figure 2—source data 2.
-
Figure 2—source data 1
Oligonucleotides used for generating yeast strains.
- https://doi.org/10.7554/eLife.14166.009
-
Figure 2—source data 2
Fit parameters describing the distribution of dwell times observed for the U4 subcomplex.
- https://doi.org/10.7554/eLife.14166.010
Figure 2—figure supplement 1
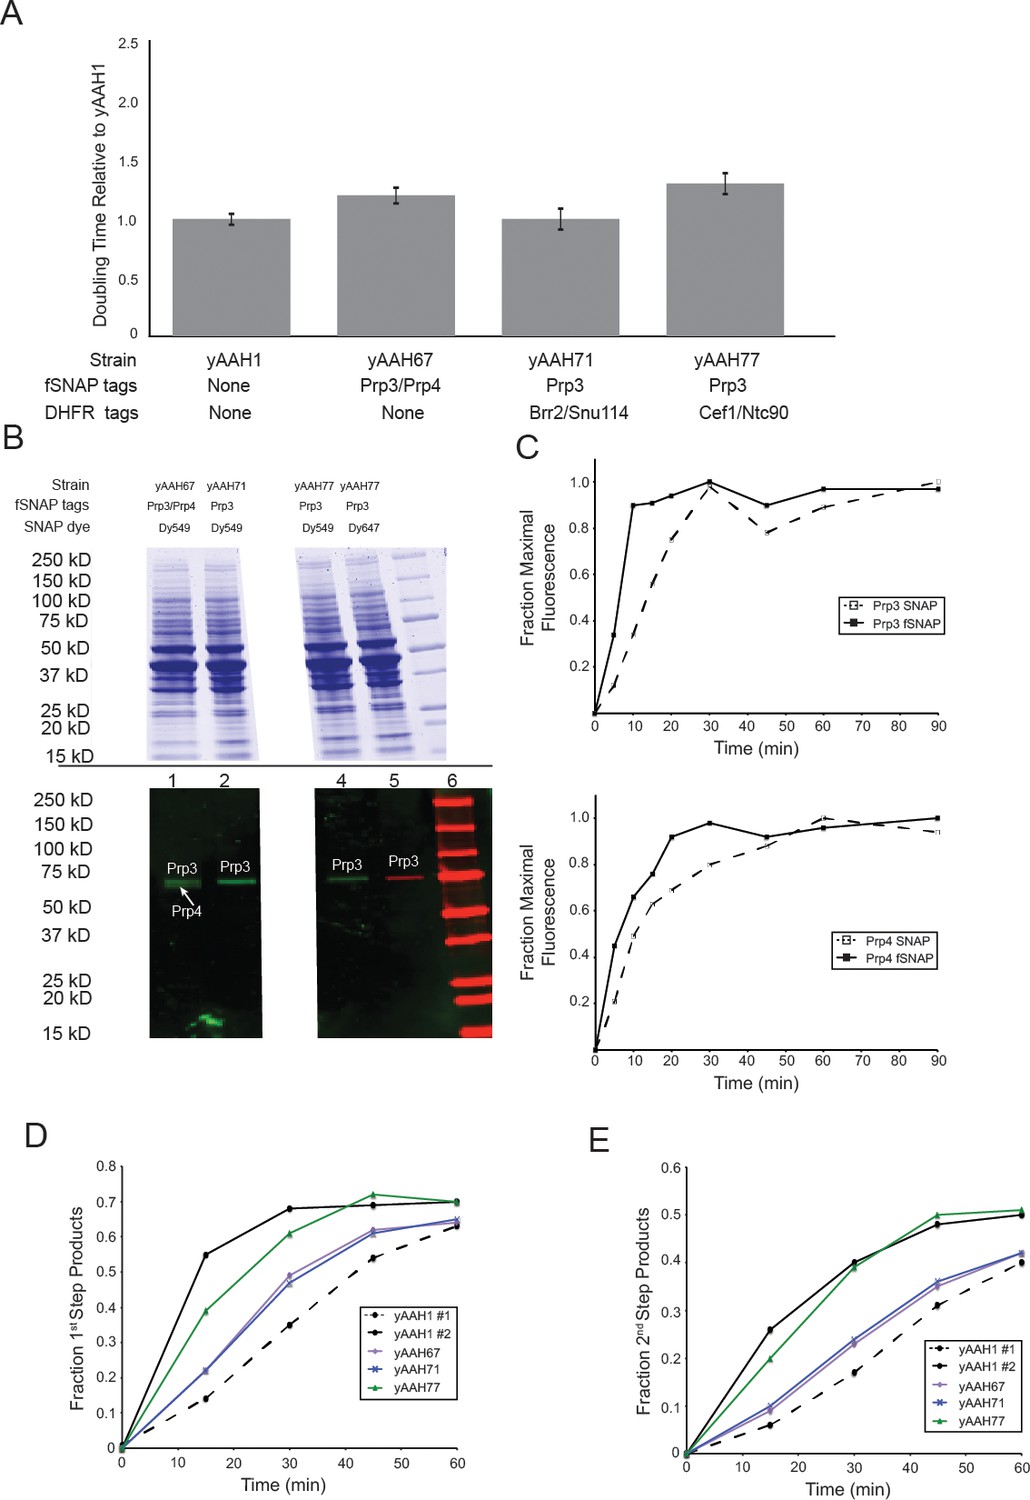
Characterization of U4-labeled yeast strains and splicing extracts.
(A) Relative doubling times (± SD) of strains containing SNAP tags on U4 proteins Prp3 and/or Prp4 compared to the parental, WT strain (yAAH1). (B) SDS-PAGE analysis of extracts made from U4-labeled yeast. The gel was first imaged by fluorescence (bottom) to identify fluorescently-labeled, SNAP-tagged U4 proteins. The gel was then subsequently stained with Coommassie blue (top). SNAP-labeled U4 proteins migrated at their expected molecular weights. Lane 6 contains prestained molecular weight markers (BioRad). Gel images show two separated regions from the same gel with intervening lanes removed for clarity. (C )Labeling kinetics of SNAP- or SNAPf-tagged U4 proteins Prp3 and Prp4 with benzylguanine dyes. (D) Results from in vitro splicing assays showing the accumulation of the fraction products that had completed the 1st chemical step in splicing (lariat intron-3' exon and mRNA) over time for U4-labeled extracts compared with the parental, WT strain. (E) Results from in vitro splicing assays showing the accumulation of the fraction of 2nd step product (mRNA) over time for U4-labeled extracts compared with the parental, WT strain. yAAH1 #1 and #2 in D and E represent two different preparations of WCE from the same parental, WT strain yAAH1.
Figure 2—figure supplement 2
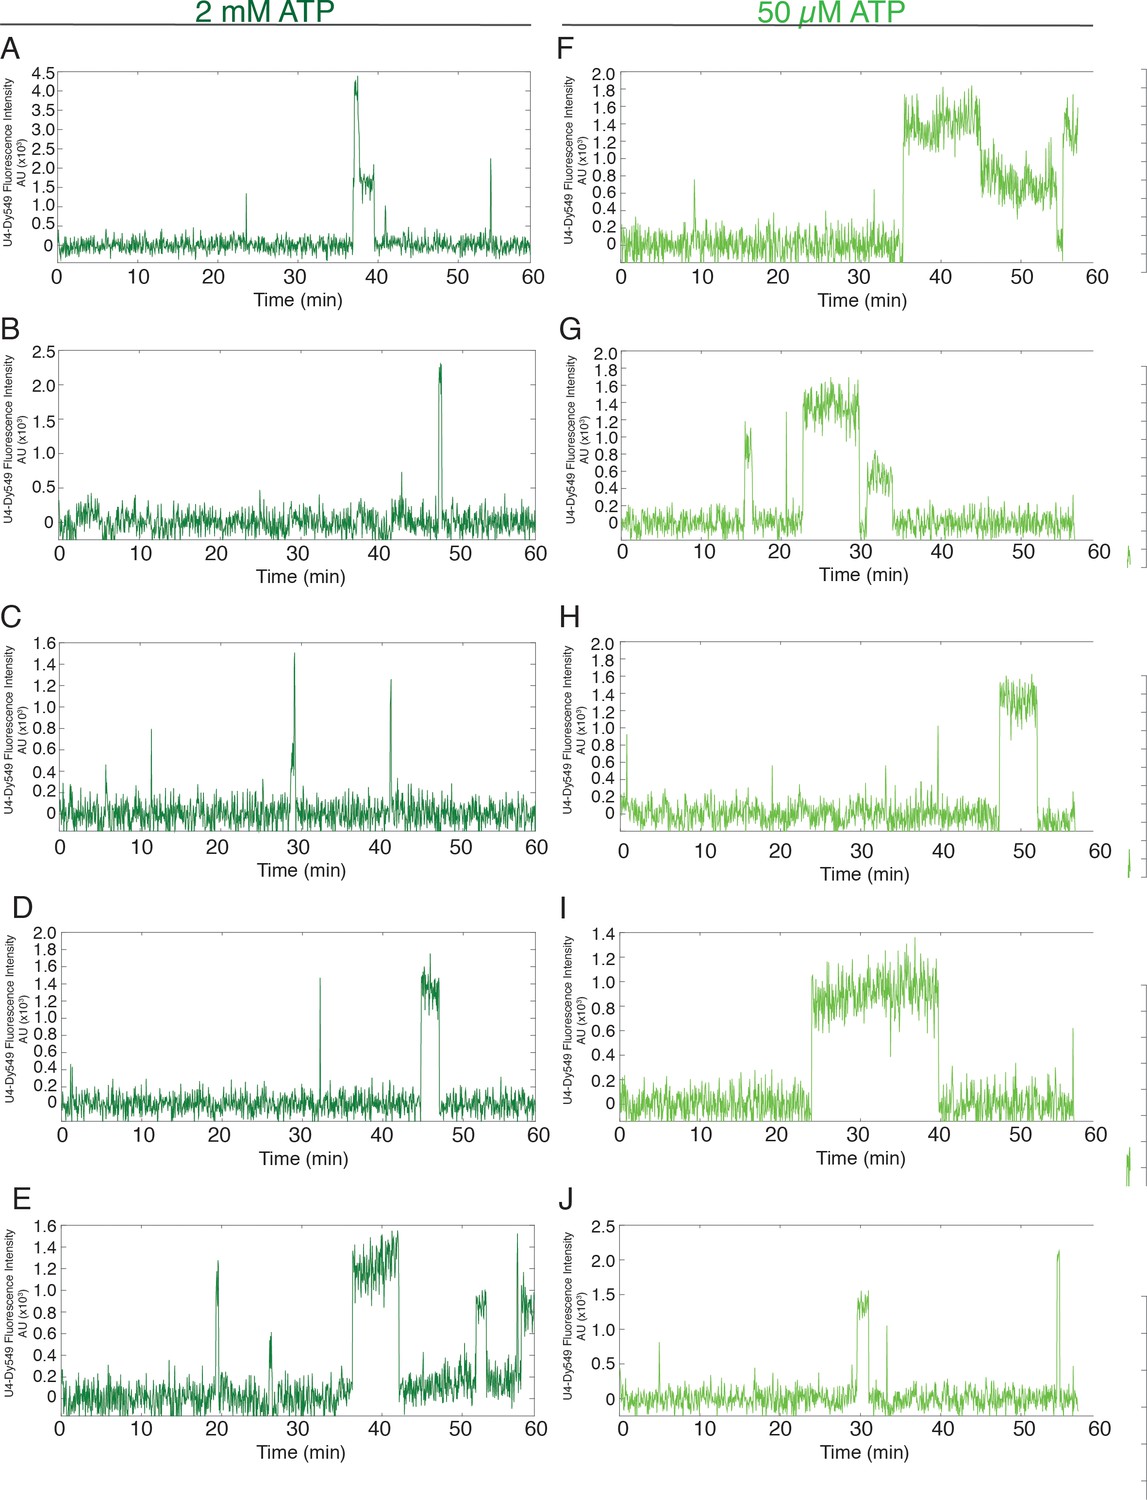
Additional examples (to supplement those shown in Figure 2C) of fluorescence intensity traces showing individual U4-SNAP subcomplexes co-localizing with surface-tethered pre-mRNA in the presence of 2 mM (A–E, dark green) or 50 µM (F–J, light green) ATP.
https://doi.org/10.7554/eLife.14166.012
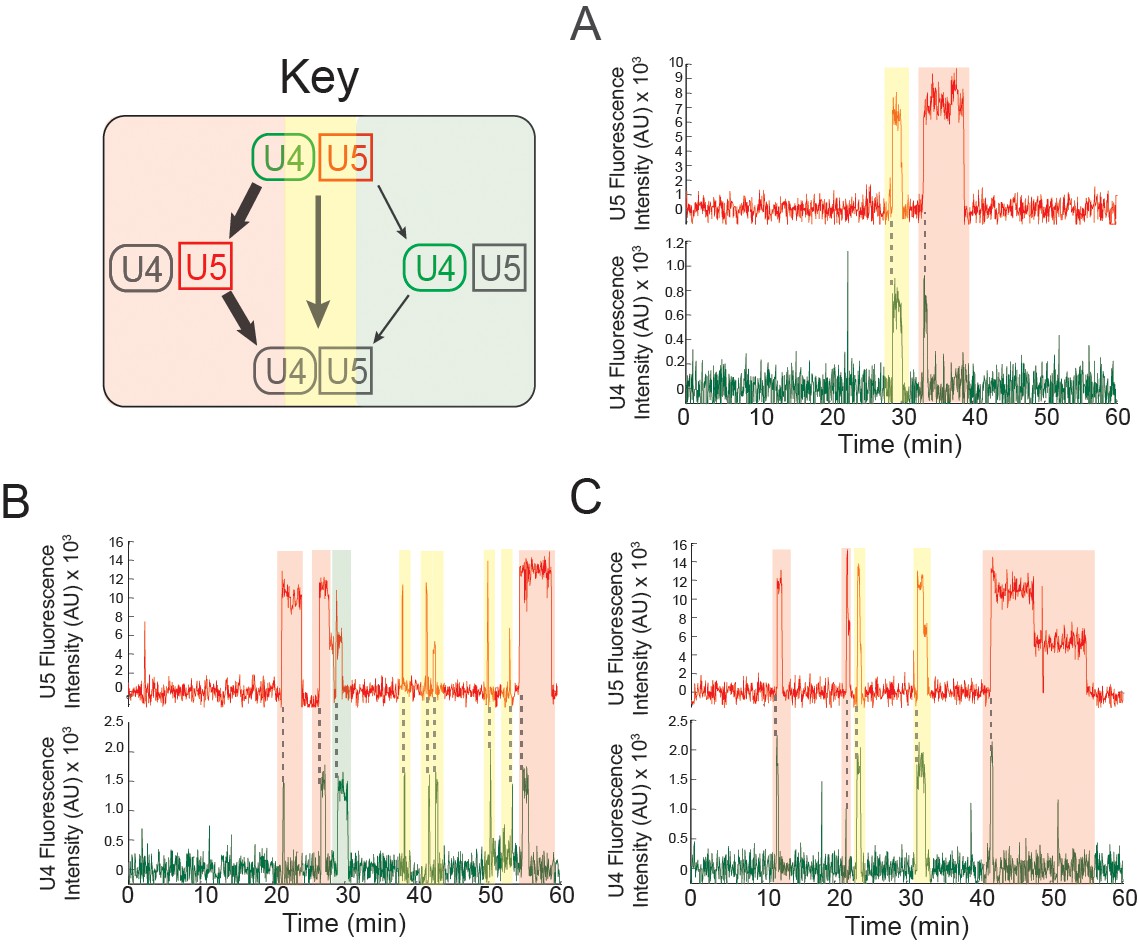
Figure 3 with 3 supplements
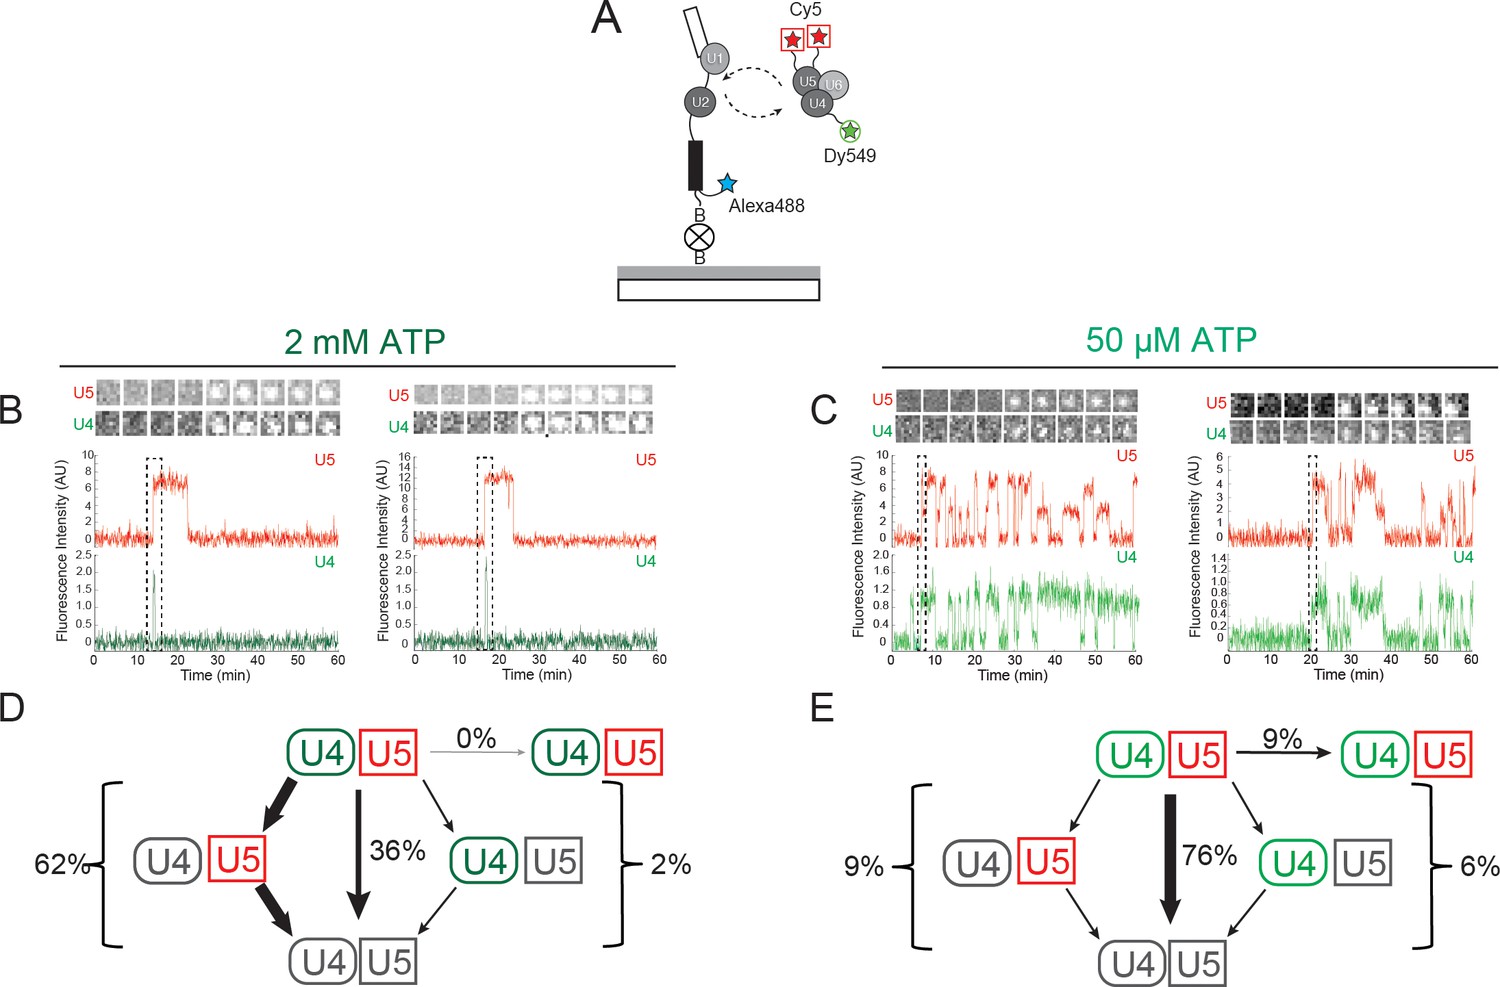
Three-color CoSMoS observation of U4 and U5 binding dynamics at 2 mM and 50 µM ATP.
(A) Schematic of a three-color experiment in which U5 was labeled with two red-excited (Cy5) fluorophores, U4 was labeled with a single green-excited (Dy549) fluorophore, and the surface-tethered pre-mRNA was labeled with a single blue-excited (Alexa488) fluorophore. (B and C) Representative time records at 2 mM (B) or 50 µM ATP (C), each showing peaks in fluorescence intensity corresponding to colocalization of U4 (green) and U5 (red) with the same individual pre-mRNA molecule. Dashed rectangles mark examples of the simultaneous appearance of U4 and U5 spots; galleries show consecutive images (~0.7 × 0.7 µm) taken from those parts of the recording showing that spot appearance is simultaneous. (D and E) Routes for loss of either the U4 or U5 fluorescent spots at 2 mM (D, N = 128) or 50 µM ATP (E, N = 207) in two typical experiments collected under otherwise identical conditions. Red and green shapes represent observation of fluorescence from the corresponding Dy549 (green-excited) or Cy5 (red-excited) fluorophores on U4 or U5, respectively; grey shapes represent the absence of fluorescence. Percentages represent the fraction of U4/U5 complexes in which fluorescence disappeared by the indicated pathway; more prevalent pathways are emphasized with thicker arrows.
Figure 3—figure supplement 1
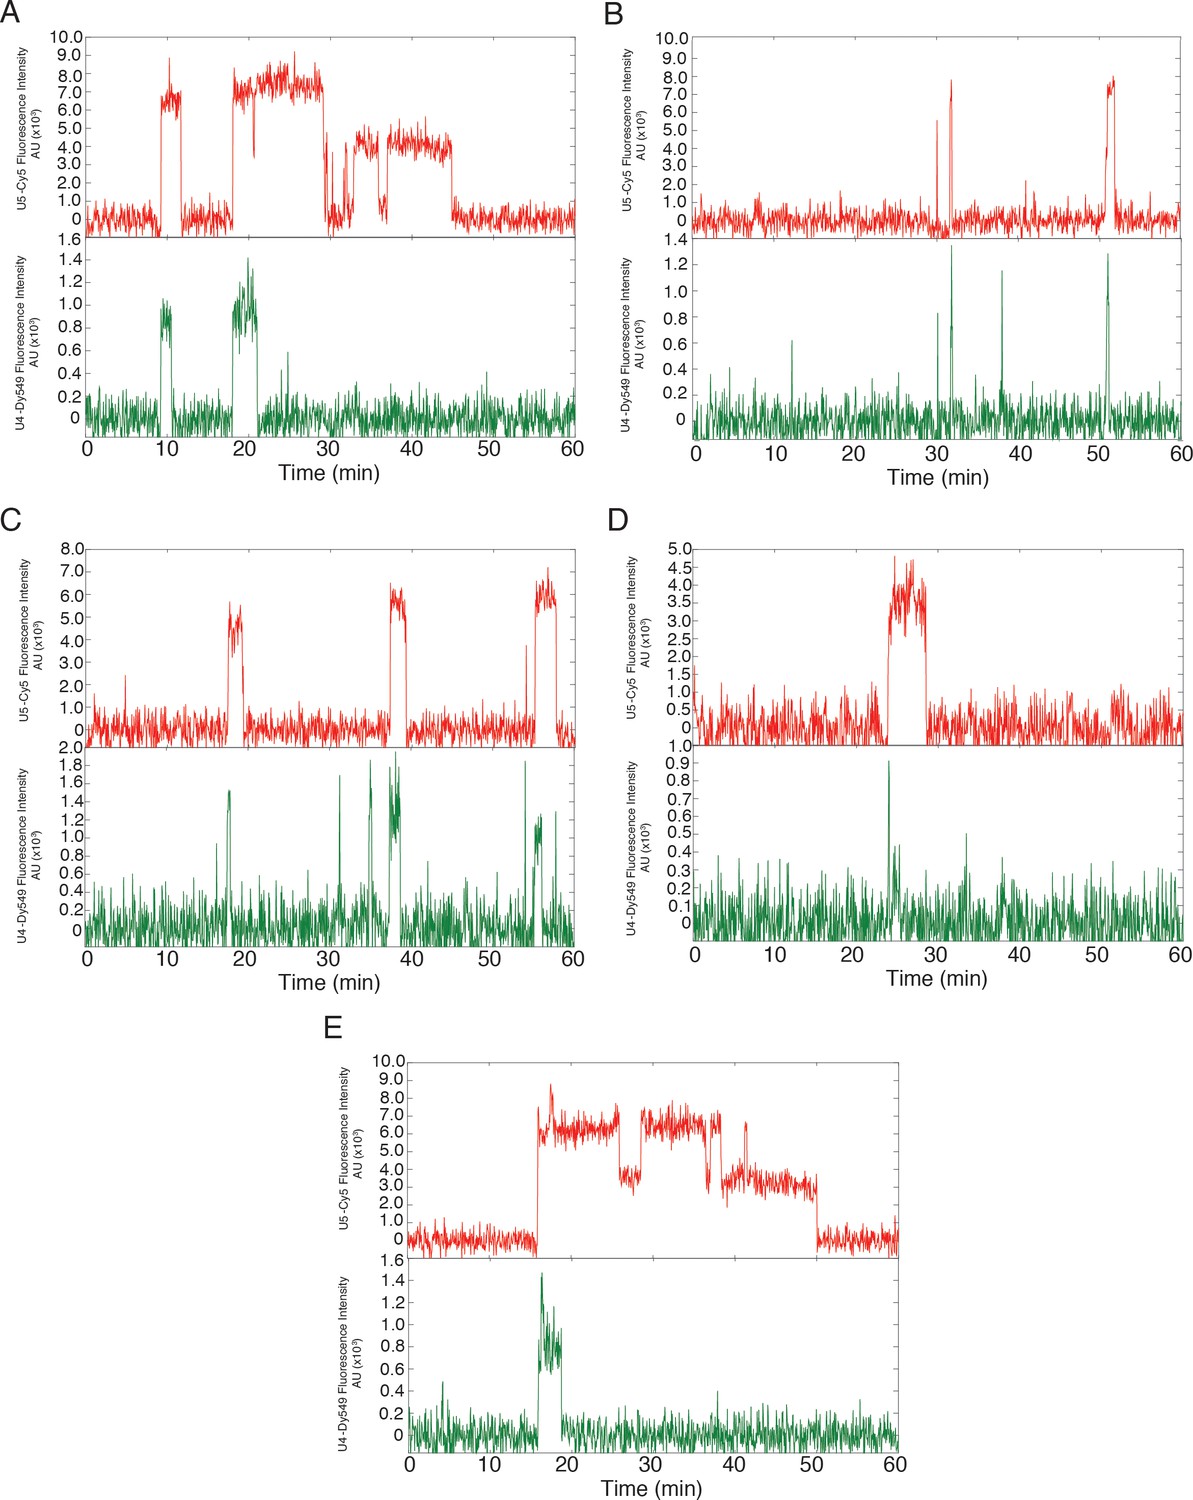
Additional examples (to supplement those shown in Figure 3B) of fluorescence intensity traces showing individual U5-DHFR subcomplexes (red) co-localizing with U4-SNAP subcomplexes (dark green) on surface-tethered pre-mRNA in the presence of 2 mM ATP.
https://doi.org/10.7554/eLife.14166.015
Figure 3—figure supplement 2

Additional examples (to supplement those shown in Figure 3C) of fluorescence intensity traces showing individual U5-DHFR subcomplexes (red) co-localizing with U4-SNAP subcomplexes (light green) on surface-tethered pre-mRNA in the presence of 50 µM ATP.
https://doi.org/10.7554/eLife.14166.016
Figure 3—figure supplement 3

Probability density histogram of dwell times (points) for U4 recorded at 150 (blue) and 450 µW (red) laser powers, and global fit to a two-exponential model that includes power-proportional photobleaching.
The fit (lines, superimposed with one another) showed no evidence for photobleaching under these conditions.
Figure 4 with 1 supplement
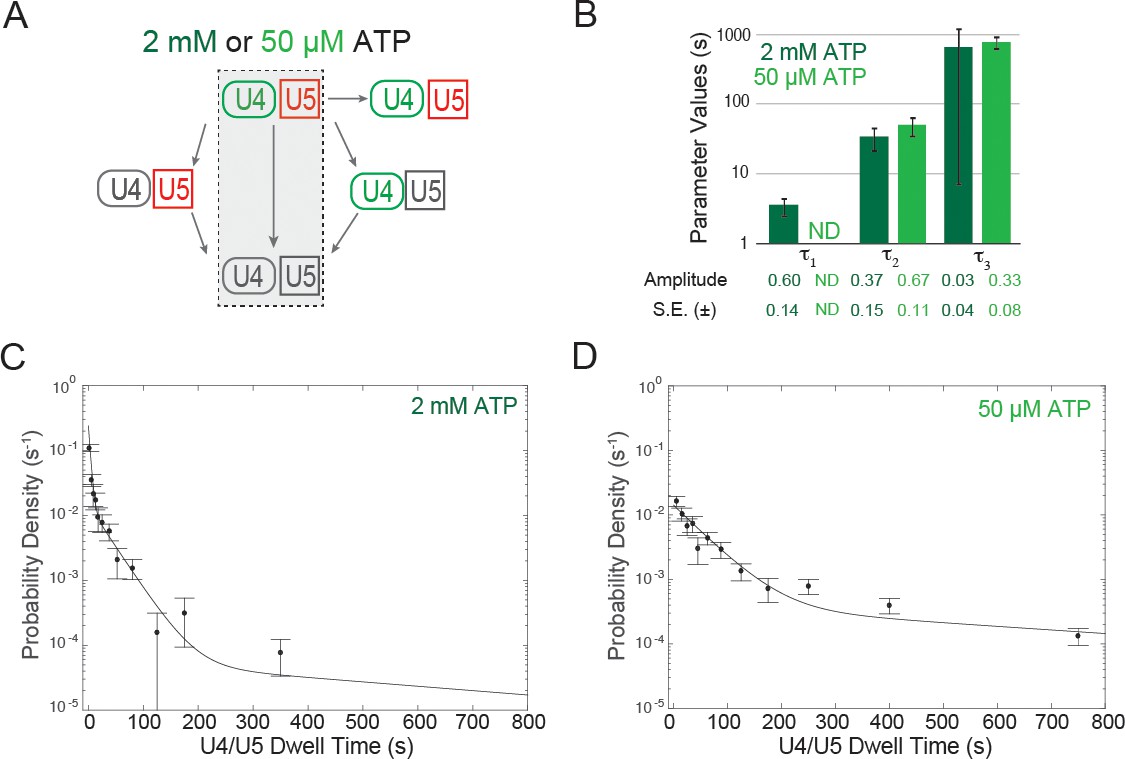
Dwell time analysis at 2 mM and 50 µM ATP of complexes containing both U4 and U5 for which the two snRNPs both arrived at and departed from the pre-mRNA simultaneously.
(A) Routes for loss of snRNP fluorescence (as in Figure 3D,E); shading indicates a subset of events, interpreted as tri-snRNP dissociation, that are analyzed in this figure. (B) Fit parameters (± S.E.) describing the distribution of U4/U5 dwell times at 2 mM and 50 µM ATP (see also Figure 4—source data 1). The shortest dwell time component (here described as τ1) appeared absent at 50 µM ATP (ND, Not Determined). (C, D) Probability density histogram of U4/U5 dwell times observed at 2 mM ATP (C; N = 128 events on 471 pre-mRNAs) or 50 µM ATP (D; N = 164 events on 210 pre-mRNAs). Lines represents fits of the dwell time distributions with equations containing three (C) or two (D) exponential terms that yielded the parameters reported in (B).
-
Figure 4—source data 1
Fit parameters describing the distribution of dwell times observed for U4/U5 complexes that arrived and departed simultaneously
- https://doi.org/10.7554/eLife.14166.020
Figure 4—figure supplement 1
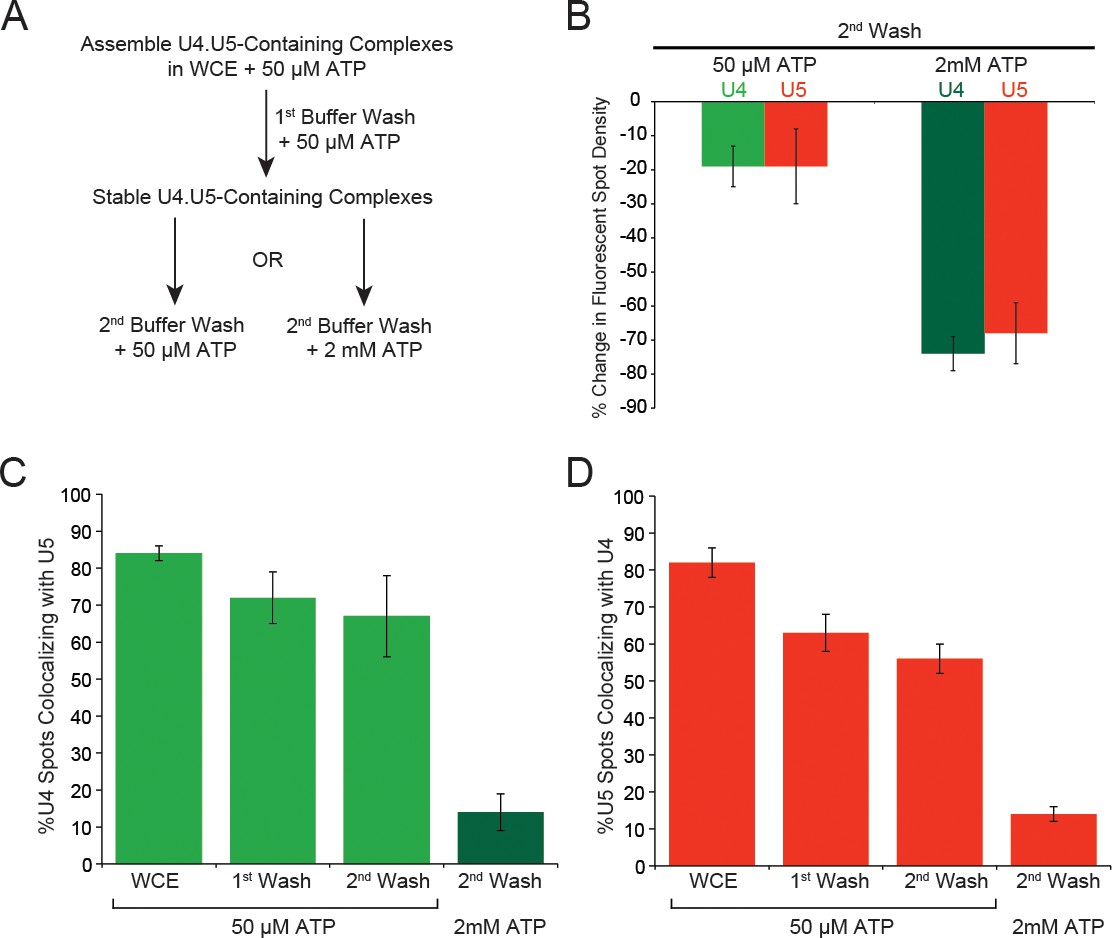
ATP dependence of discard of U4.U5 complexes assembled at 50 µM ATP.
(A) Flowchart depicting the experimental design. During each wash step the imaging chamber (~20–30 µL) was washed with 100 µL of the same buffer used in single molecule assays but without yeast WCE and with the indicated amount of ATP. (B) Quantification of changes in U4 or U5 fluorescent spot density in fields of view after the second wash step with 50 µM or 2 mM ATP. (C) Analysis of the fraction of U4 fluorescent spots that colocalize with U5 fluorescence in fields of view in WCE and after each wash step. (D) Analysis of the fraction of U5 fluorescent spots that colocalize with U4 fluorescence in fields of view in WCE and after each wash step. Each bar plotted in B–D represent the average of data obtained from 5–10 different fields of view ±SD.
Figure 5

Dwell time analysis at 2 mM ATP of complexes containing both U4 and U5 for which the two snRNPs both arrived at the pre-mRNA simultaneously but in which U4 fluorescent spot disappearance preceded U5 spot disappearance.
(A) Routes for loss of snRNP fluorescence (as in Figure 3D,E); shading indicates a subset of events, interpreted as spliceosome activation, that are analyzed in this figure. (B) Probability density histogram of dwell times for U4 molecules in the analyzed subset ( N = 244 events on 471 pre-mRNAs). The line represents a fit of the dwell time distribution to a convolution function. (C) Probability density histogram of dwell times for U5 molecules in the departure pathway subsequent to U4 departure (; N = 207 events on 471 pre-mRNAs). The line represents a fit of the dwell time distribution to an equation containing two exponential terms. (D) The dwell time of each U5 () plotted against the dwell time of U4 () in the same complex. Fit parameters for (C) and (D) are given in Figure 5—source data 1.
-
Figure 5—source data 1
Fit parameters describing the distribution of dwell times observed for U4 or U5 after simultaneous U4/U5 Arrival and U4 loss preceding U5 loss.
- https://doi.org/10.7554/eLife.14166.023
Figure 6 with 1 supplement
Examples of pre-mRNA molecules in which different outcomes result from individual tri-snRNP binding events at 2 mM ATP.
Events are color-coded according to the pathways shown in the Key. The same pre-mRNA molecule may interact with the tri-snRNP by releasing U4 and U5 simultaneously or proceeding through activation (A-C). Some pre-mRNA molecules exhibited multiple rounds of activation (B and C).
Figure 6—figure supplement 1
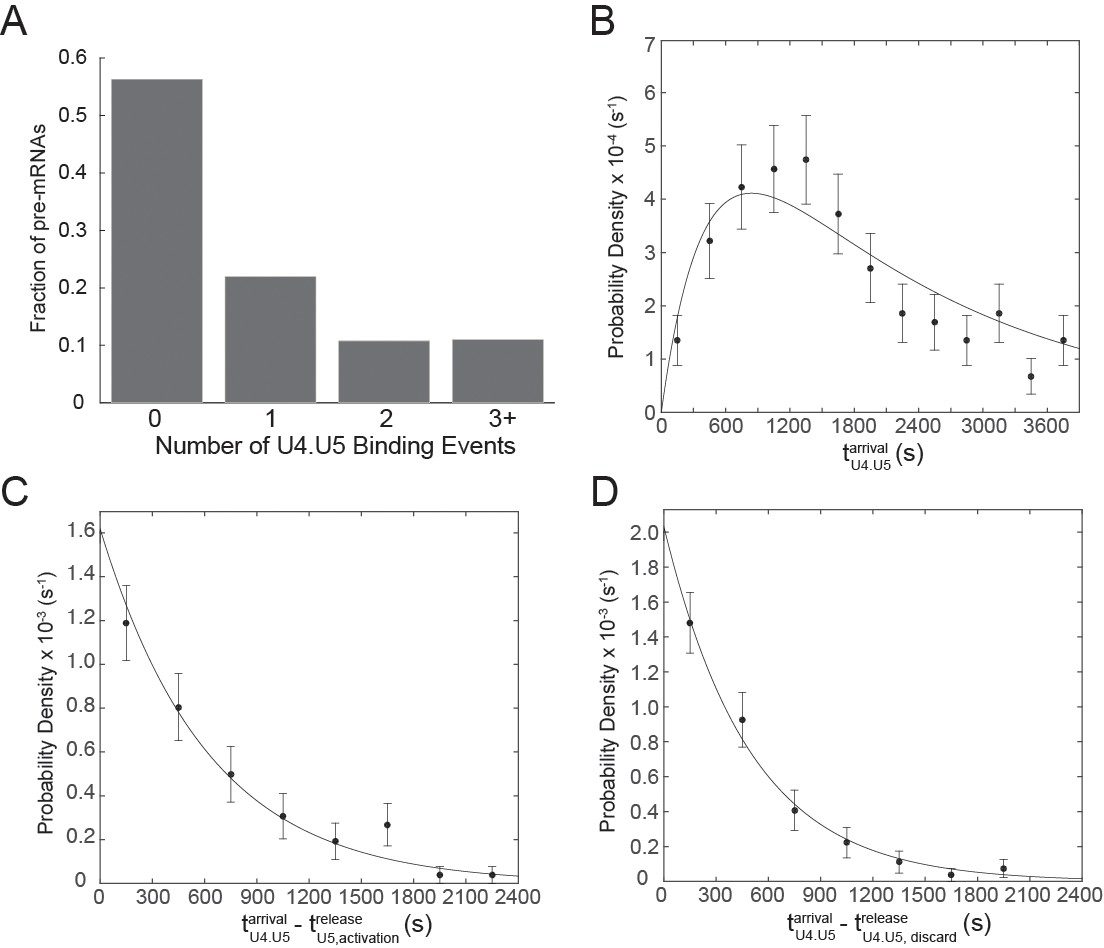
Analysis of multiple tri-snRNP binding events at 2mM ATP.
(A) Frequency of tri-snRNP binding events observed on single pre-mRNAs (N= 471 pre-mRNAs). (B) Probability density histogram of arrival times for the first U4.U5 complex () to bind each pre-mRNA. The line represents a fit of the arrival time distribution to a convolution function with fitted parameters of τ1 = 2,105±886 s and τ2 = 417±260 s (N = 197 events). (C) Probability density histogram of arrival times for U4.U5 complexes following events in which U4.U5 bound simultaneously to the pre-mRNA and U4 release preceded U5 release (). The line represents a fit of the arrival time distribution to an equation with a single fitted parameter of τ = 617±66 s (N = 87 events). (D) Probability density histogram of arrival times for U4.U5 complexes following events in which U4.U5 bound and released simultaneously from the pre-mRNA (). The line represents a fit of the arrival time distribution to an equation with a single fitted parameter of τ = 492±52 s (N = 90 events).
Figure 7 with 1 supplement

Three-color CoSMoS observation of U4 and NTC binding dynamics at 2 mM ATP.
(A) Schematic of the experiment, in which the NTC was labeled with two red-excited (Cy5) fluorophores, U4 was labeled with a single green-excited (Dy549) fluorophore, and the surface-tethered pre-mRNA contained a single blue-excited (Alexa488) fluorophore. (B and C) Representative traces showing peaks in fluorescence intensity corresponding to colocalization of U4 (dark green) and NTC (red) with single pre-mRNA molecules. Raw images (~0.9×0.9 µm) corresponding to portions of the trace segments enclosed by the dashed boxes are included above the traces. The times of U4 release () and NTC arrival () are determined from these data as shown. Subtraction of from time yields a positive number if the NTC arrived prior to U4 release or a negative number if the NTC arrived after U4 release. (D) Probability density histogram showing the delay between NTC arrival and U4 loss (gray). The first and last bins (limits of -3600 – -200 and 200 – 3600 s, respectively) were truncated in the figure for clarity. Most often (79% of N = 293 total events on 402 pre-mRNAs), the NTC arrived soon after loss of the U4 signal (). A randomized control histogram (see Materials and methods) is also shown (red). Comparison of gray and red curves suggests that U4 departed after NTC arrival in <19% of complexes.
Figure 7—figure supplement 1
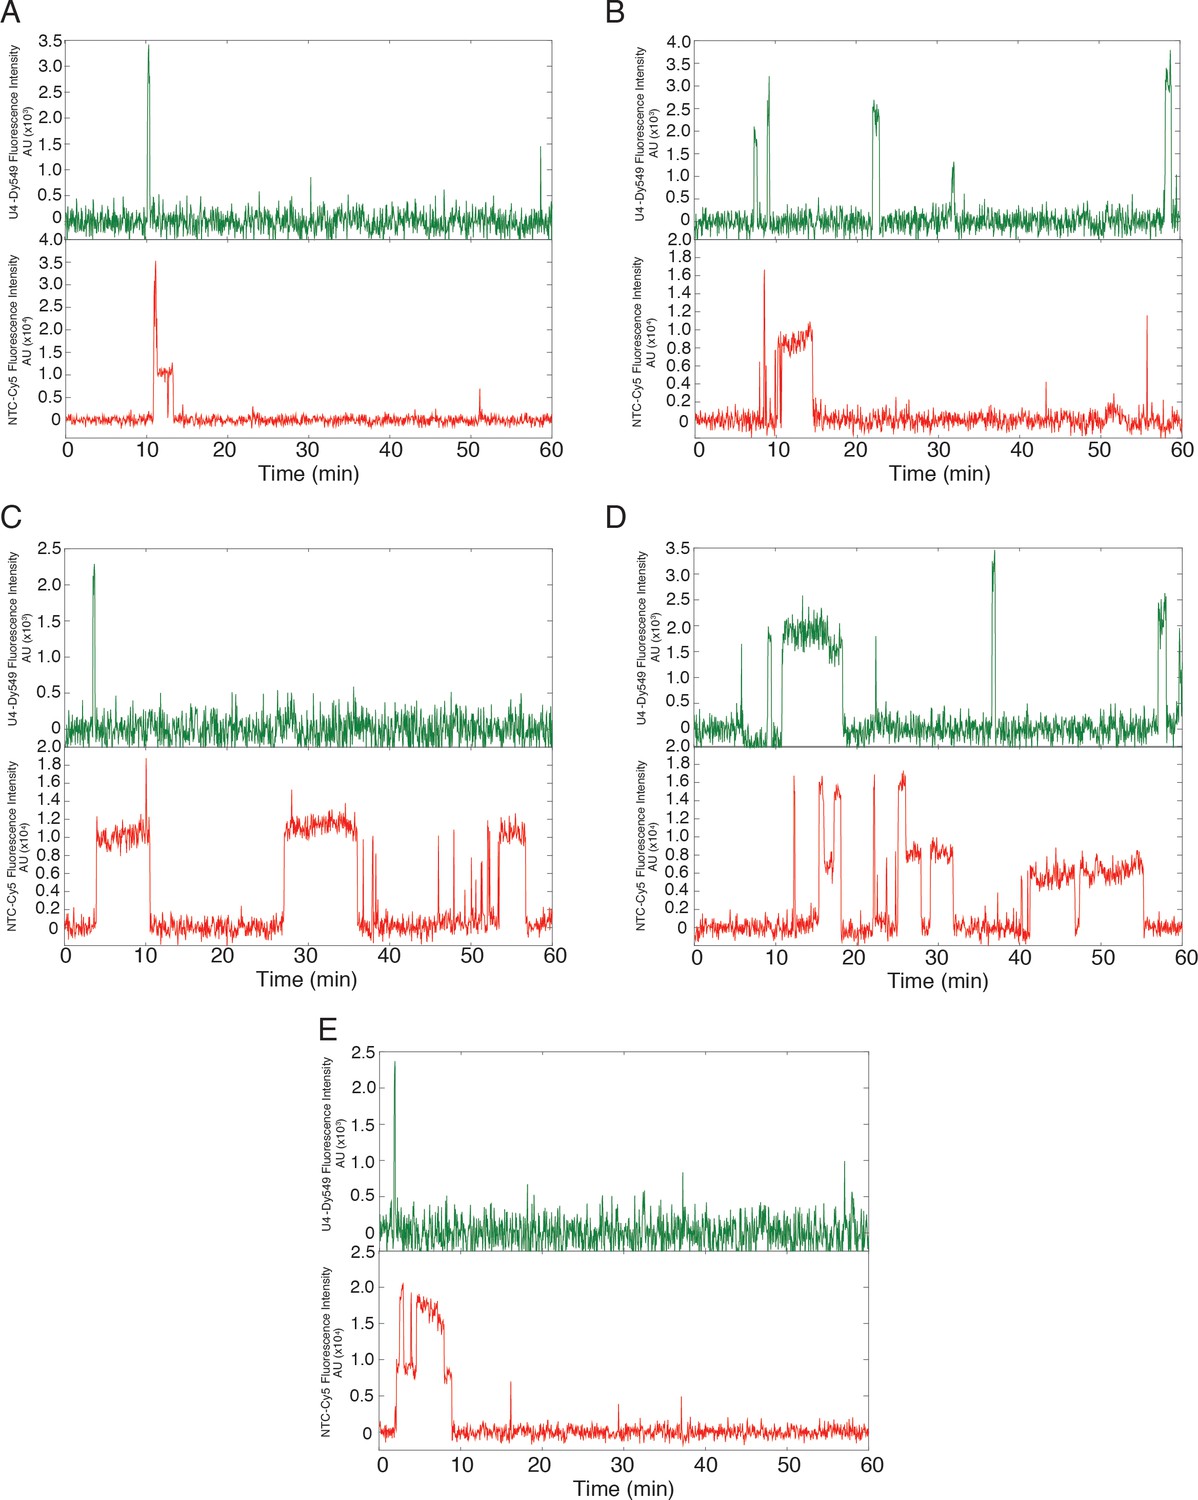
(A-E) Additional examples (to supplement those shown in Figure 7) of fluorescence intensity traces showing individual NTC-DHFR subcomplexes (red) co-localizing with U4-SNAP subcomplexes (dark green) on surface-tethered pre-mRNA in the presence of 2 mM ATP.
https://doi.org/10.7554/eLife.14166.027
Figure 8
Model for tri-snRNP recruitment and spliceosome activation highlighting the predominant pathways observed in our experiments.
The spliceosome and its other snRNP components are shown schematically as a grey circle. Additional observed kinetic components are not included in this simplified model. ATP stimulates both tri-snRNP discard and activation (green arrows). During activation, U4 loss occurs through a multi-step process and is irreversible. NTC joins the spliceosome after U4 release.
Videos
Video 1
Surface accumulation of the U4 snRNP on surface-tethered pre-mRNAs (not shown) under both low (50 µM) and high (2 mM) ATP conditions.
Spliceosome activation is prevented at low ATP. White spots represent fluorescent U4 subcomplexes labeled with Dy549-SNAPf tags. This movie was obtained from recordings (60 min) of 1 s duration frames recorded at 3 s intervals. To reduce the movie file size, only every third frame was included from 0 to 45 min in the movie file, and the movie is played back at 20 frames/s. Each of the two recordings shows a ~20 x 20 µm field of view, and the two individual movie files were combined using Apple Keynote software.
Video 2
Surface accumulation of the U4 and U5 snRNPs on surface-tethered pre-mRNAs (not shown) under both low (50 µM) and high (2 mM) ATP conditions.
Spliceosome activation is prevented at low ATP. White spots represent fluorescent U4 or U5 subcomplexes labeled with Dy549-SNAPf tags or Cy5-TMP tags, respectively. This movie was obtained from recordings (60 min) of 1 s duration frames recorded at 3 s intervals. To reduce the movie file size, only every third frame was included from 0 to 45 min in the movie file, and the movie is played back at 20 frames/s. Each of the four recordings shows a ~20 x 20 µm field of view, and the four individual movie files were combined using Apple Keynote software.
Tables
Table 1
Yeast strains and labeled proteins.
| Strain | SNAP Tag Labelsa | DHFR Tag Labels | Genotype | References |
|---|---|---|---|---|
| yAAH0001 BJ2168 | None | None | MATa prc1–407 prb1–1122 pep4–3 leu2 trp1 ura3–52 gal2 | Parental Strain |
| yAAH0006 | U1: Snp1, Prp40 | None | yAAH001 + snp1::snp1-SNAP-HYG + prp40::prp40-SNAP-NAT | Hoskins et al., 2011 |
| yAAH0020 | NTC: Cef1, Ntc90 | None | yAAH001 + cef1::cef1-SNAP-HYG + ntc90::ntc90-SNAP-NAT | Hoskins et al., 2011 |
| yAAH0067 | U4: Prp3, Prp4 | None | yAAH001 + prp3::prp3-SNAPf-Hyg + prp4::prp4-SNAPf-NAT | this work |
| yAAH0071 | U4: Prp3 | U5: Brr2, Snu114 | yAAH001 + prp3::prp3-SNAPf-NAT + brr2::brr2-DHFR-HYG + snu114::snu114-DHFR-BLE | this work |
| yAAH0077 | U4: Prp3 | NTC: Cef1, Ntc90 | yAAH001 + prp3::prp3-SNAPf-NAT + cef1::cef1-DHFR-HYG + ntc90::ntc90-DHFR-BLE | this work |
-
aStrains yAAH0067, 71, and 77 were labeled with the fast SNAP (SNAPf) tag
Download links
A two-part list of links to download the article, or parts of the article, in various formats.
Downloads (link to download the article as PDF)
Open citations (links to open the citations from this article in various online reference manager services)
Cite this article (links to download the citations from this article in formats compatible with various reference manager tools)
Single molecule analysis reveals reversible and irreversible steps during spliceosome activation
eLife 5:e14166.
https://doi.org/10.7554/eLife.14166


