Activation of GCN2 kinase by ribosome stalling links translation elongation with translation initiation
- Howard Hughes Medical Institute, The Jackson Laboratory for Mammalian Genetics, United States
- Universitat Pompeu Fabra, Spain
- The Jackson Laboratory for Genomic Medicine, United States
- University of Connecticut Health Center, United States
- University of California, San Diego School of Medicine, United States
- University of California, United States
Figures
Figure 1 with 4 supplements
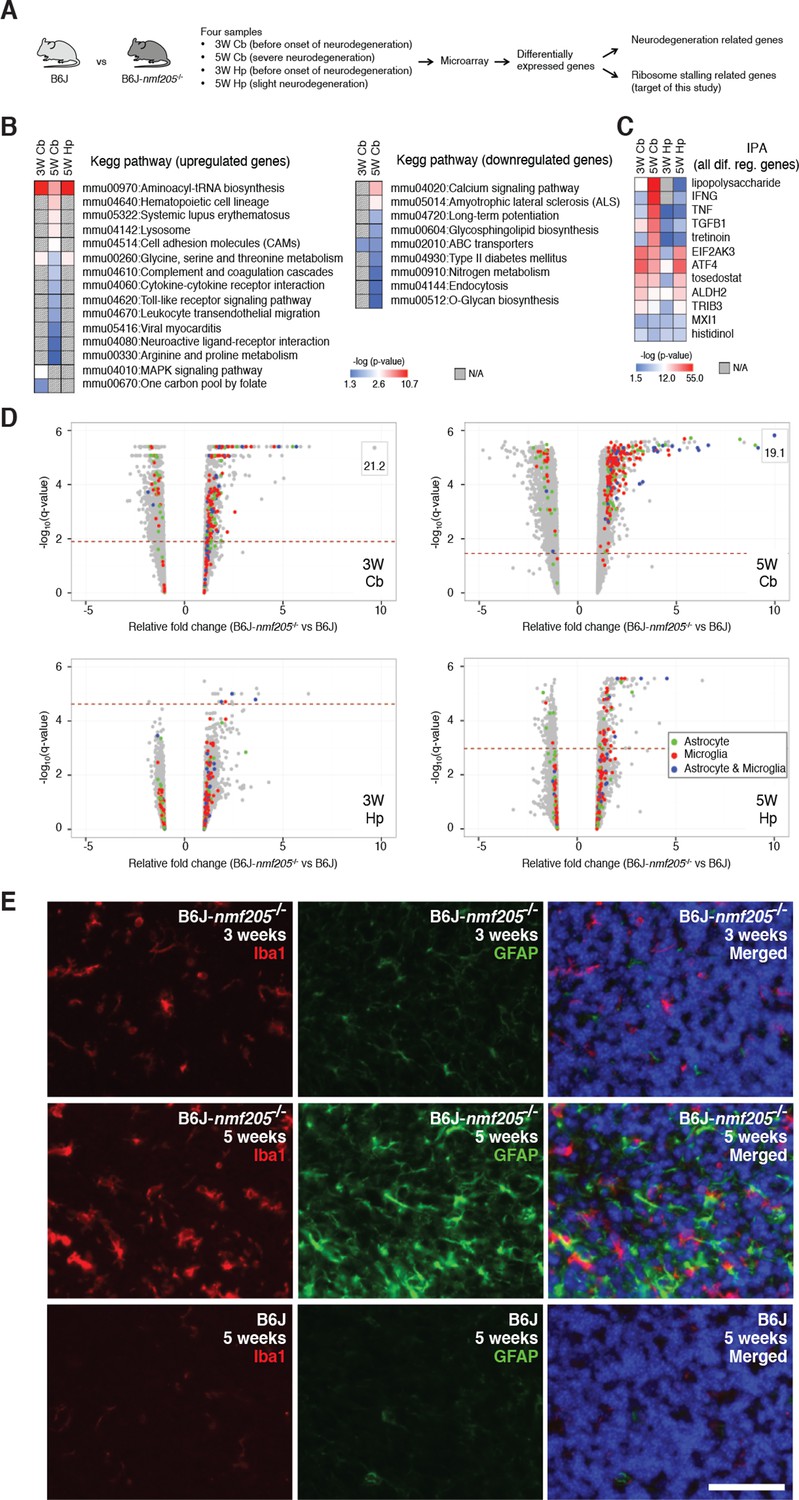
Transcriptional profiling of B6J-Gtpbp2nmf205-/- mutant mice.
(A) To segregate genes associated with ribosome stalling from genes nonspecifically induced during neurodegeneration, microarray analysis was performed on the cerebellum (Cb) and hippocampus (Hp) from B6J and B6J-Gtpbp2nmf205-/- (B6J-nmf205-/-) mice at 3-weeks (3W) and 5-weeks (5W) of age. (B) Enriched pathways among genes that were up or downregulated in the B6J-Gtpbp2nmf205-/- brain were obtained by Kegg pathway analysis. Note that upregulated gene pathways exhibited more robust p-values. (C) Ingenuity Pathway Analysis (IPA) upstream regulator analysis of B6J-Gtpbp2nmf205-/- upregulated genes demonstrates ATF4 and EIF2AK3 activation in the 3- and 5-week hippocampus and cerebellum. Inflammatory-related upstream regulators are also strongly activated of in the 5-week-old mutant cerebellum. (D) Volcano plots of –log10q-values and relative fold changes of all genes. Genes previously shown to be expressed in microglia (red), astrocytes (green), or in both microglia and astrocytes (blue) are indicated, with all other genes shown in gray. Genes with very high levels of induction are shown in boxes to fit on the scale. The horizontal dashed lines indicate a false discovery rate of 0.1. Note the strong induction of genes activated in both microglia and astrocytes in the 5-week-old B6-Gtpbp2nmf205-/- cerebellum. (E) Immunofluorescence using antibodies to Iba1 (microglia) and GFAP (astrocytes) was performed on sections of B6J and B6J-Gtpbp2nmf205-/- cerebellum at indicated ages. Microglia and astrocytes were activated in the mutant cerebellum with highest levels of activation at 5 weeks of age. Sections were counterstained with Hoechst 33342 to visualize nuclei as shown in merged. Scale bar, 50 μm.
-
Figure 1—source data 1
Significantly changed genes.
- https://doi.org/10.7554/eLife.14295.004
-
Figure 1—source data 2
GO & IPA analysis.
- https://doi.org/10.7554/eLife.14295.005
-
Figure 1—source data 3
Inflammatory genes.
- https://doi.org/10.7554/eLife.14295.006
Figure 1—figure supplement 1
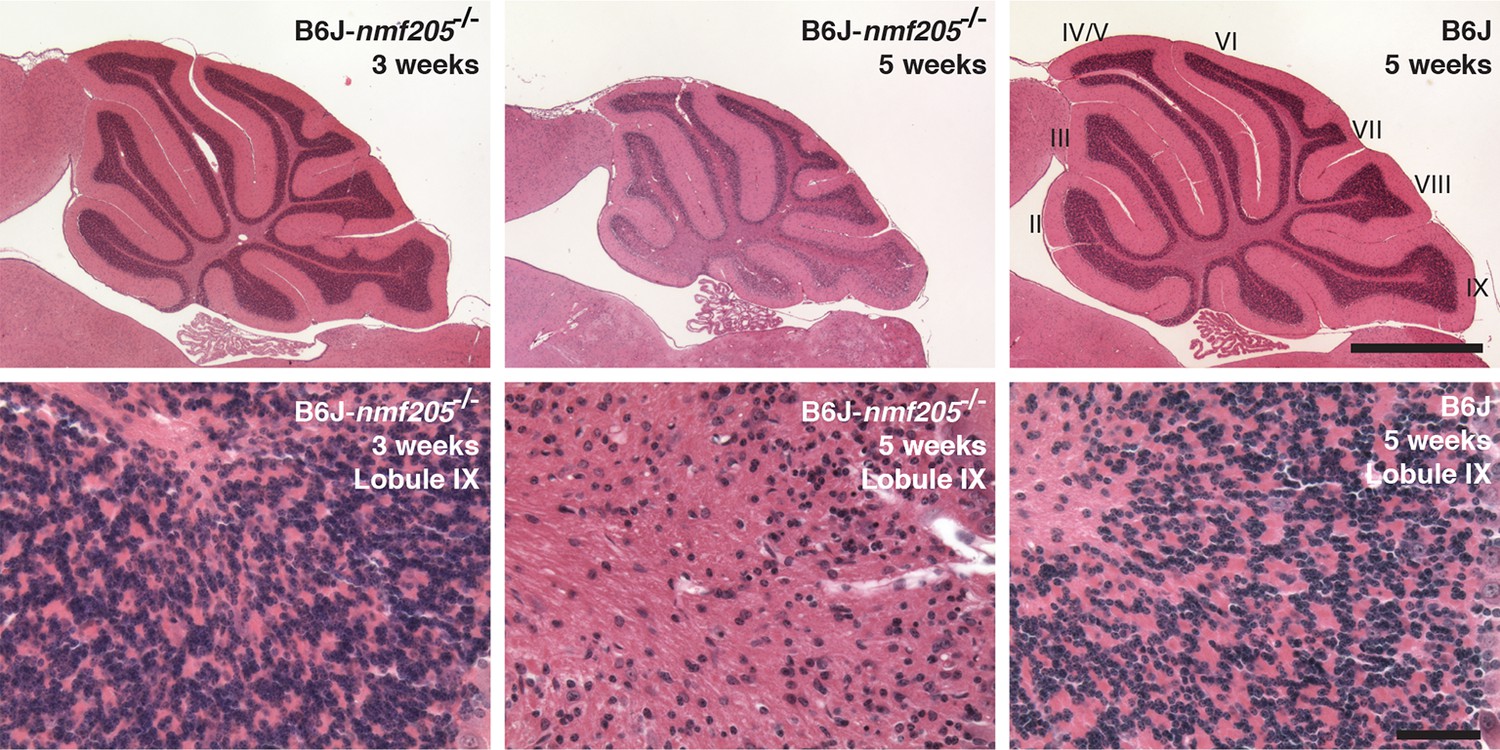
Progressive neurodegeneration in B6J-Gtpbp2nmf205-/-mice.
Hematoxylin and eosin-stained sagittal sections of the B6J-Gtpbp2nmf205-/- (B6J-nmf205-/-) and B6J cerebellum at the ages shown. Higher-magnification images of cerebellar lobule IX are shown. Scale bars, 1 mm (upper row), and 50 μm (lower row).
Figure 1—figure supplement 2
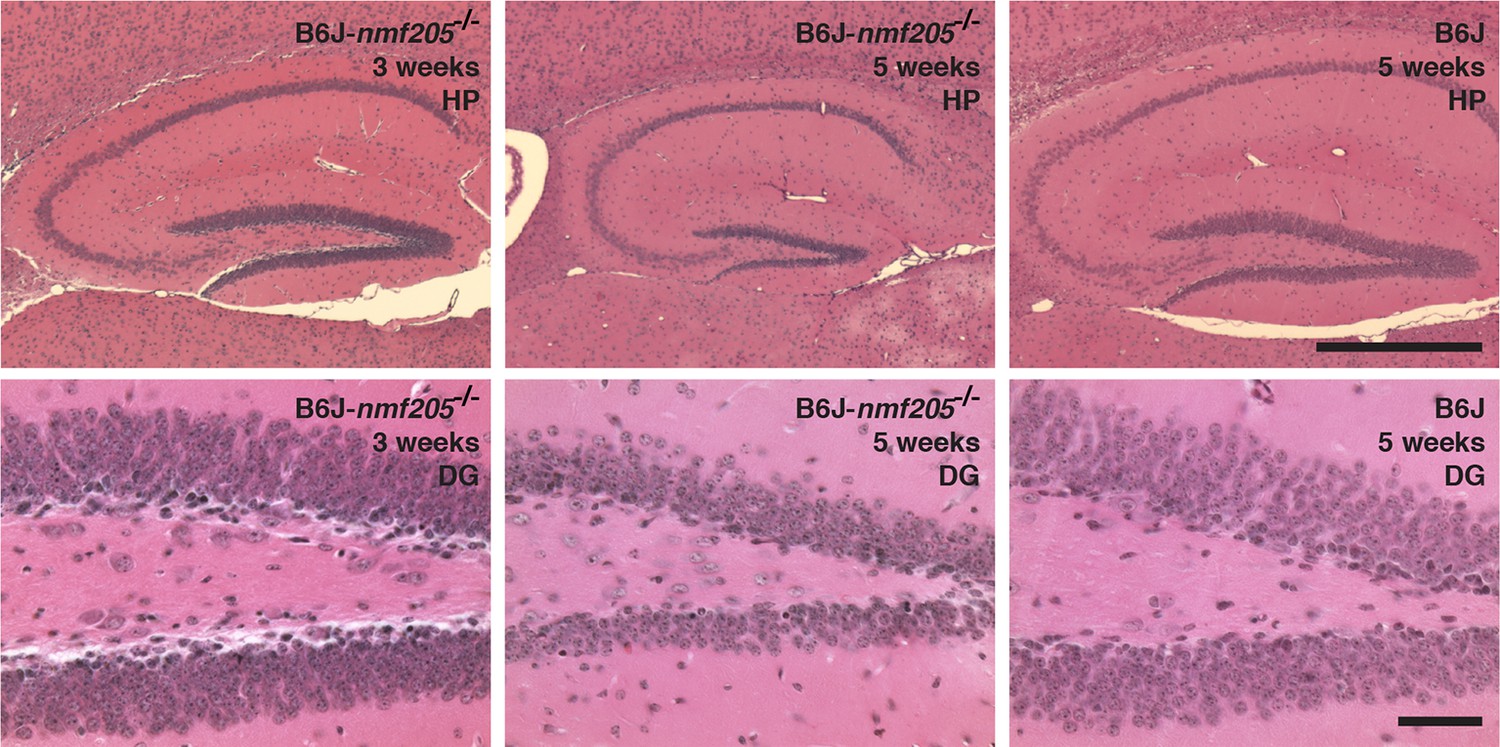
Neurodegeneration is reduced in hippocampus of B6J-Gtpbp2nmf205-/- mice.
Hematoxylin and eosin-stained sagittal sections of hippocampus (HP) in B6J-Gtpbp2nmf205-/- (B6J-nmf205-/-) at 3- and 5-weeks of age and B6J (wild type) at 5-weeks of age. Higher-magnification images of the dentate gyrus (DG) are shown. Scale bars, 500 μm (top row), and 50 μm (bottom row).
Figure 1—figure supplement 3
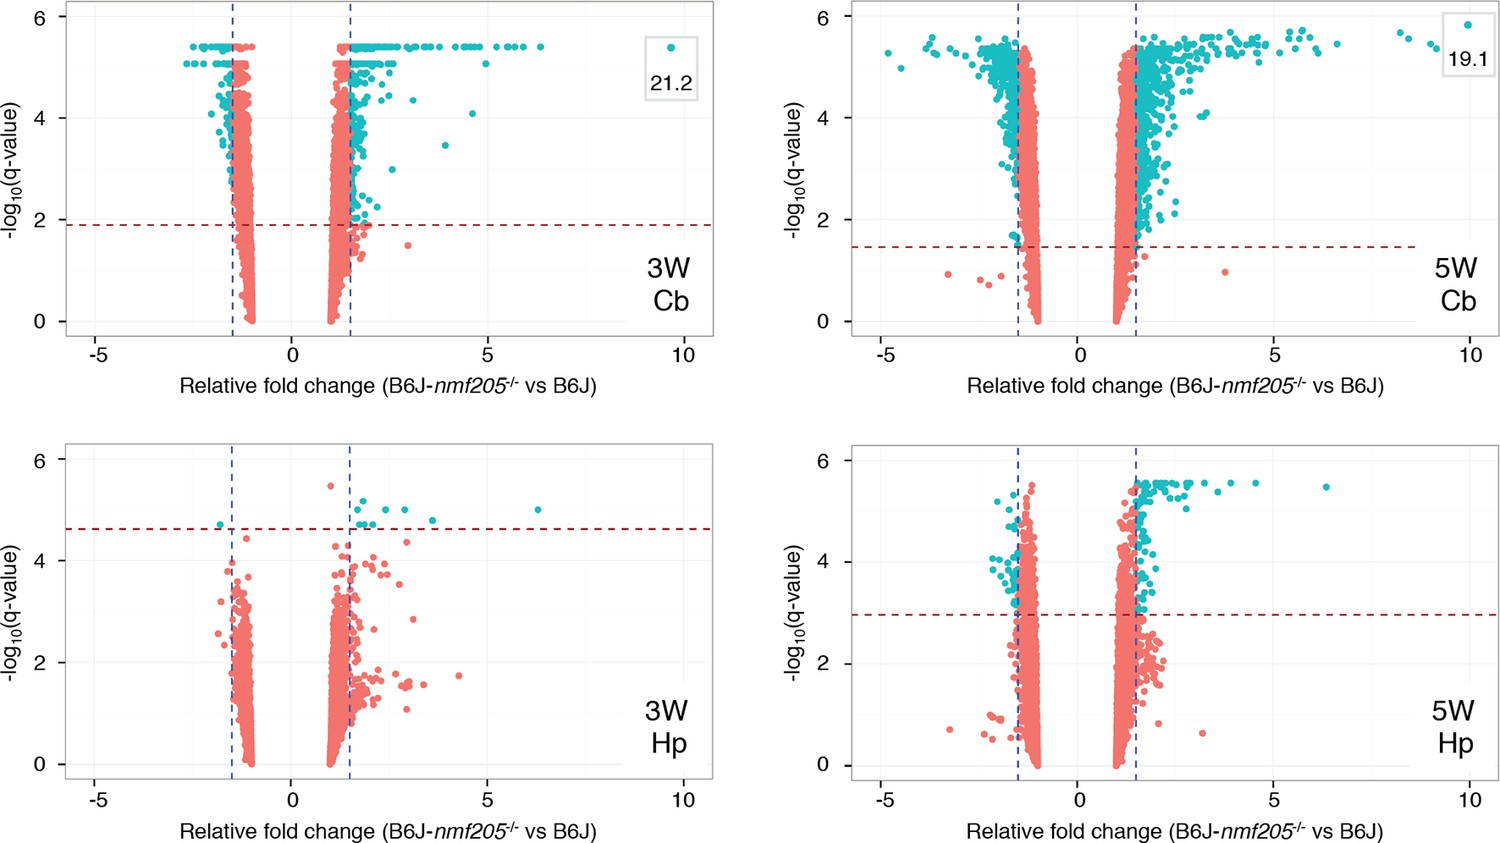
Microarray analysis of the B6J and B6J-Gtpbp2nmf205-/- cerebellum.
Volcano plots of microarray results of cerebellar and hippocampal transcripts from 3- and 5-week-old B6J and B6J-Gtpbp2nmf205-/- (B6J-nmf205-/-) mice. Thresholds of a relative fold change of 1.5 fold (vertical lines) and a q-value of 0.05 (horizontal lines) were adopted for this study.
Figure 1—figure supplement 4

The inflammatory response in the B6J-Gtpbp2nmf205-/- hippocampus.
Antibodies against Iba1 and GFAP assessed activation of microglia and astrocyte, respectively in CA1 (A) and dentate gyrus (B) of B6J and B6J-Gtpbp2nmf205-/- (B6J-nmf205-/-). Sections were counterstained with Hoechst 33,342 to visualize nuclei as shown in merged images. For comparative purposes, images were taken with an identical exposure time as those in Figure 1E. Scale bar, 50 μm.
Figure 2
ATF4 downstream genes are robustly activated in B6J-Gtpbp2nmf205-/- mutant brain.
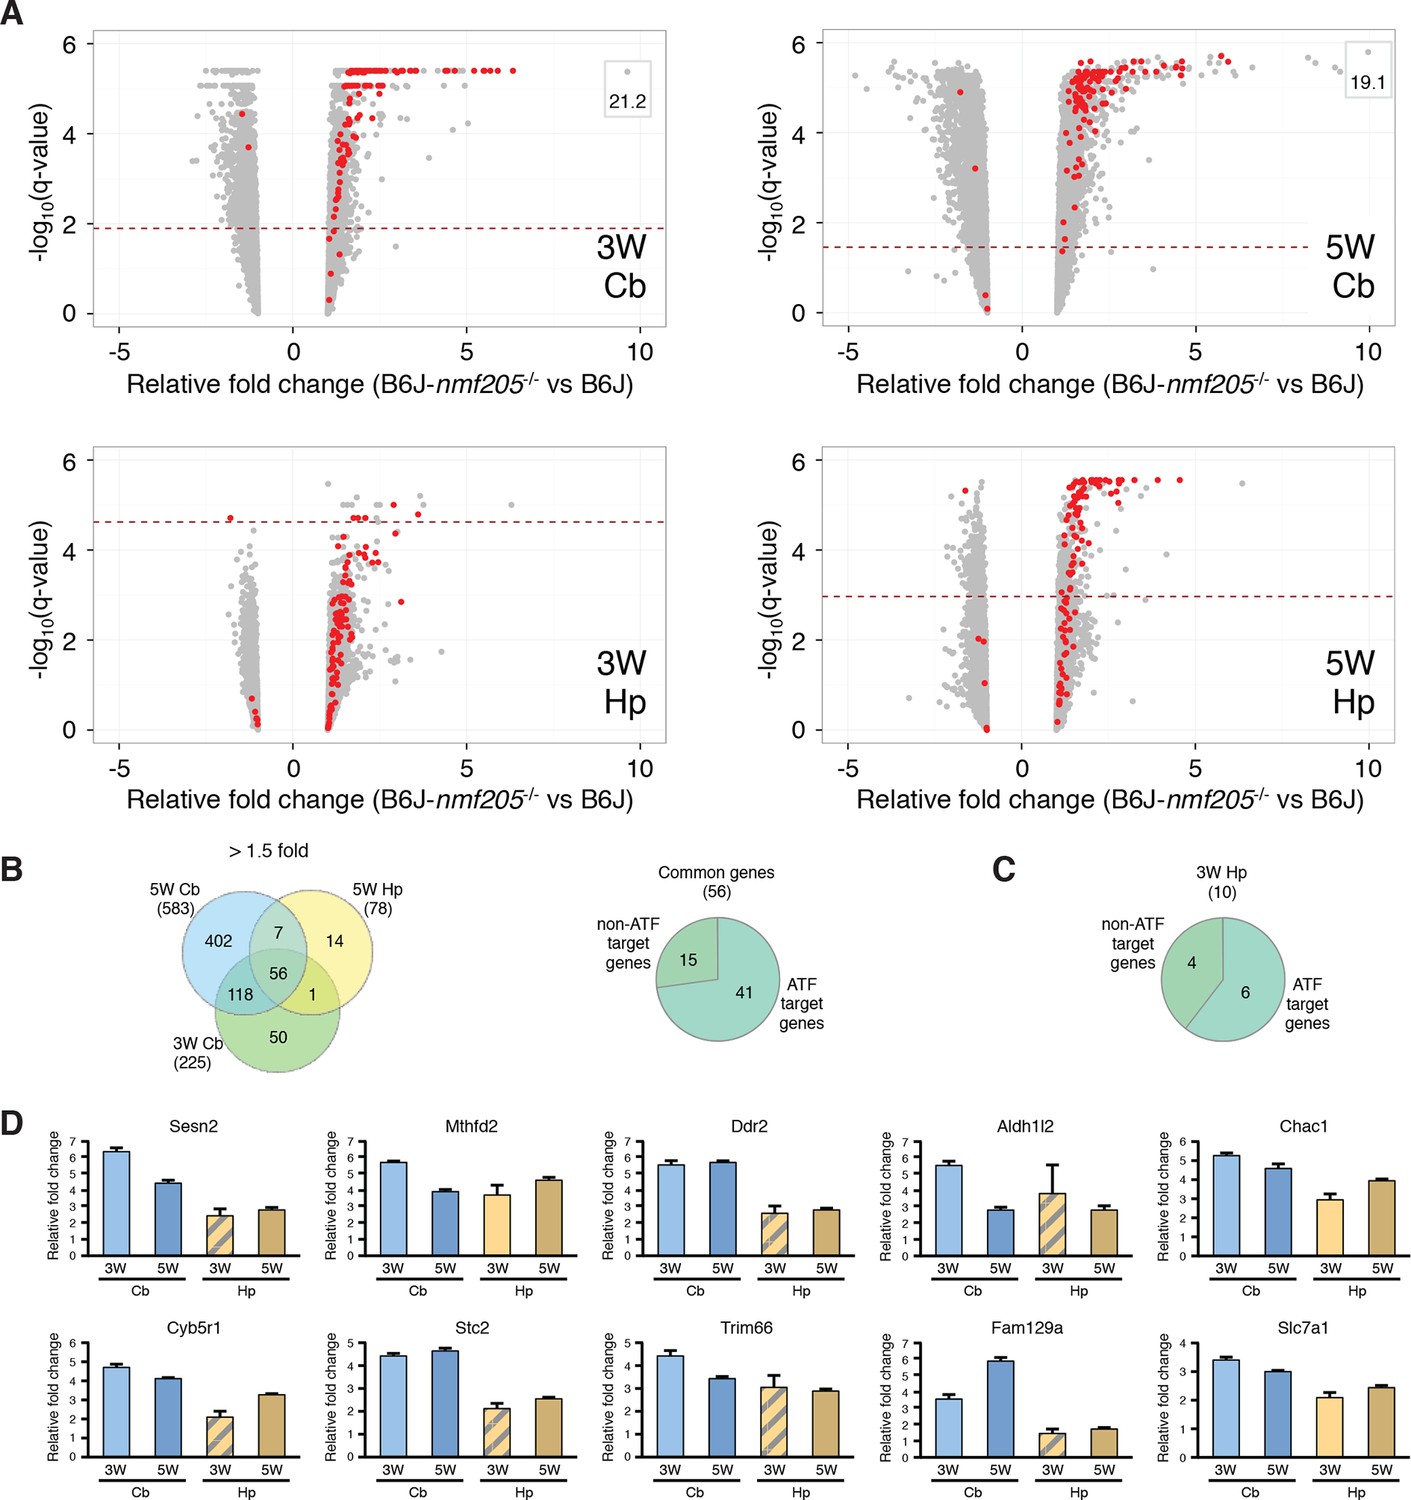
(A) Volcano plots of ATF4 downstream genes demonstrating activation of the ATF4 pathway in the B6J- Gtpbp2nmf205-/- (B6J-nmf205-/-) brain. Fold change and q values of all genes are shown and ATF4 target genes, obtained from previous ChIP-Seq studies as described in the text, are red. Genes with very high levels of induction are shown in boxes to fit on the scale. Note that although induction of ATF4 downstream genes is observed in all groups, upregulation of these genes occurs earlier and is most robust in the cerebellum. (B) Venn diagram of differentially expressed genes between B6J and B6J-Gtpbp2nmf205-/- 3-and 5-week cerebellum and 5-week hippocampus. Note that a large number of genes (56 genes) are consistently upregulated between cerebellum and hippocampus and that most of these genes are known ATF4 target genes. (C) The distribution of ATF4 target genes in the upregulated gene set from the B6J-Gtpbp2nmf205-/- 3-week hippocampus. (D) The relative fold change (RFC) of the top ten upregulated genes in the 3-week-old B6J- Gtpbp2nmf205-/- cerebellum for each time point and brain region. RFCs depicted with solid bars were significant changes (p<0.05) and those depicted by hatched bars were not.
-
Figure 2—source data 1
Differentially expressed ATF4 target genes.
- https://doi.org/10.7554/eLife.14295.012
-
Figure 2—source data 2
Common differentially expressed genes.
- https://doi.org/10.7554/eLife.14295.013
Figure 3 with 4 supplements

GCN2 mediates eIF2α phosphorylation and ATF4 activation in the B6J-Gtpbp2nmf205-/- brain.
(A) Western blot analysis of cerebellar extracts from 3-week-old mice incubated with the antibodies shown (left panel). The relative abundance of phospho-eIF2α (Ser51) to total eIF2α was averaged for three biological replicates (right panel). Values are shown relative to B6J. (B) The effect of Gcn2 deletion on the 146 genes upregulated or the 191 genes downregulated by 1.5 fold (padj < 0.01) in the cerebellum of B6J-Gtpbp2nmf205-/- (B6J-nmf205-/-) relative to that of B6J (left and right diagram, respectively). ATF4 target status of the 83 genes that are upregulated in the B6J-Gtpbp2nmf205-/- cerebellum relative to B6J and that also have a significant decrease in expression in the B6J-Gtpbp2nmf205-/-; Gcn2-/- cerebellum relative to B6J- Gtpbp2nmf205-/- (middle diagram). (C) Fold change of upregulated ATF4 downstream genes from B6J-Gcn2-/-, B6J-Gtpbp2nmf205-/-, and B6J-Gtpbp2nmf205-/-; Gcn2-/-mice relative to B6J expression. The 10 most upregulated genes in cerebellum of B6J-Gtpbp2nmf205-/-mice relative to that B6J are shown. Note that the increased expression of these GCN2-ATF4 downstream genes in the B6J-Gtpbp2nmf205-/- cerebellum was completely suppressed by deletion of Gcn2. Error bars = SEM. *p<0.05, **p<0.01, and ***p<0.001 (one-way ANOVA, A, C).
-
Figure 3—source data 1
GCN2 RNA-Seq.
- https://doi.org/10.7554/eLife.14295.015
-
Figure 3—source data 2
GCN2-regulated ATF4 target genes.
- https://doi.org/10.7554/eLife.14295.016
-
Figure 3—source data 3
GCN2 RNA-Seq GO & KEGG analysis.
- https://doi.org/10.7554/eLife.14295.017
Figure 3—figure supplement 1
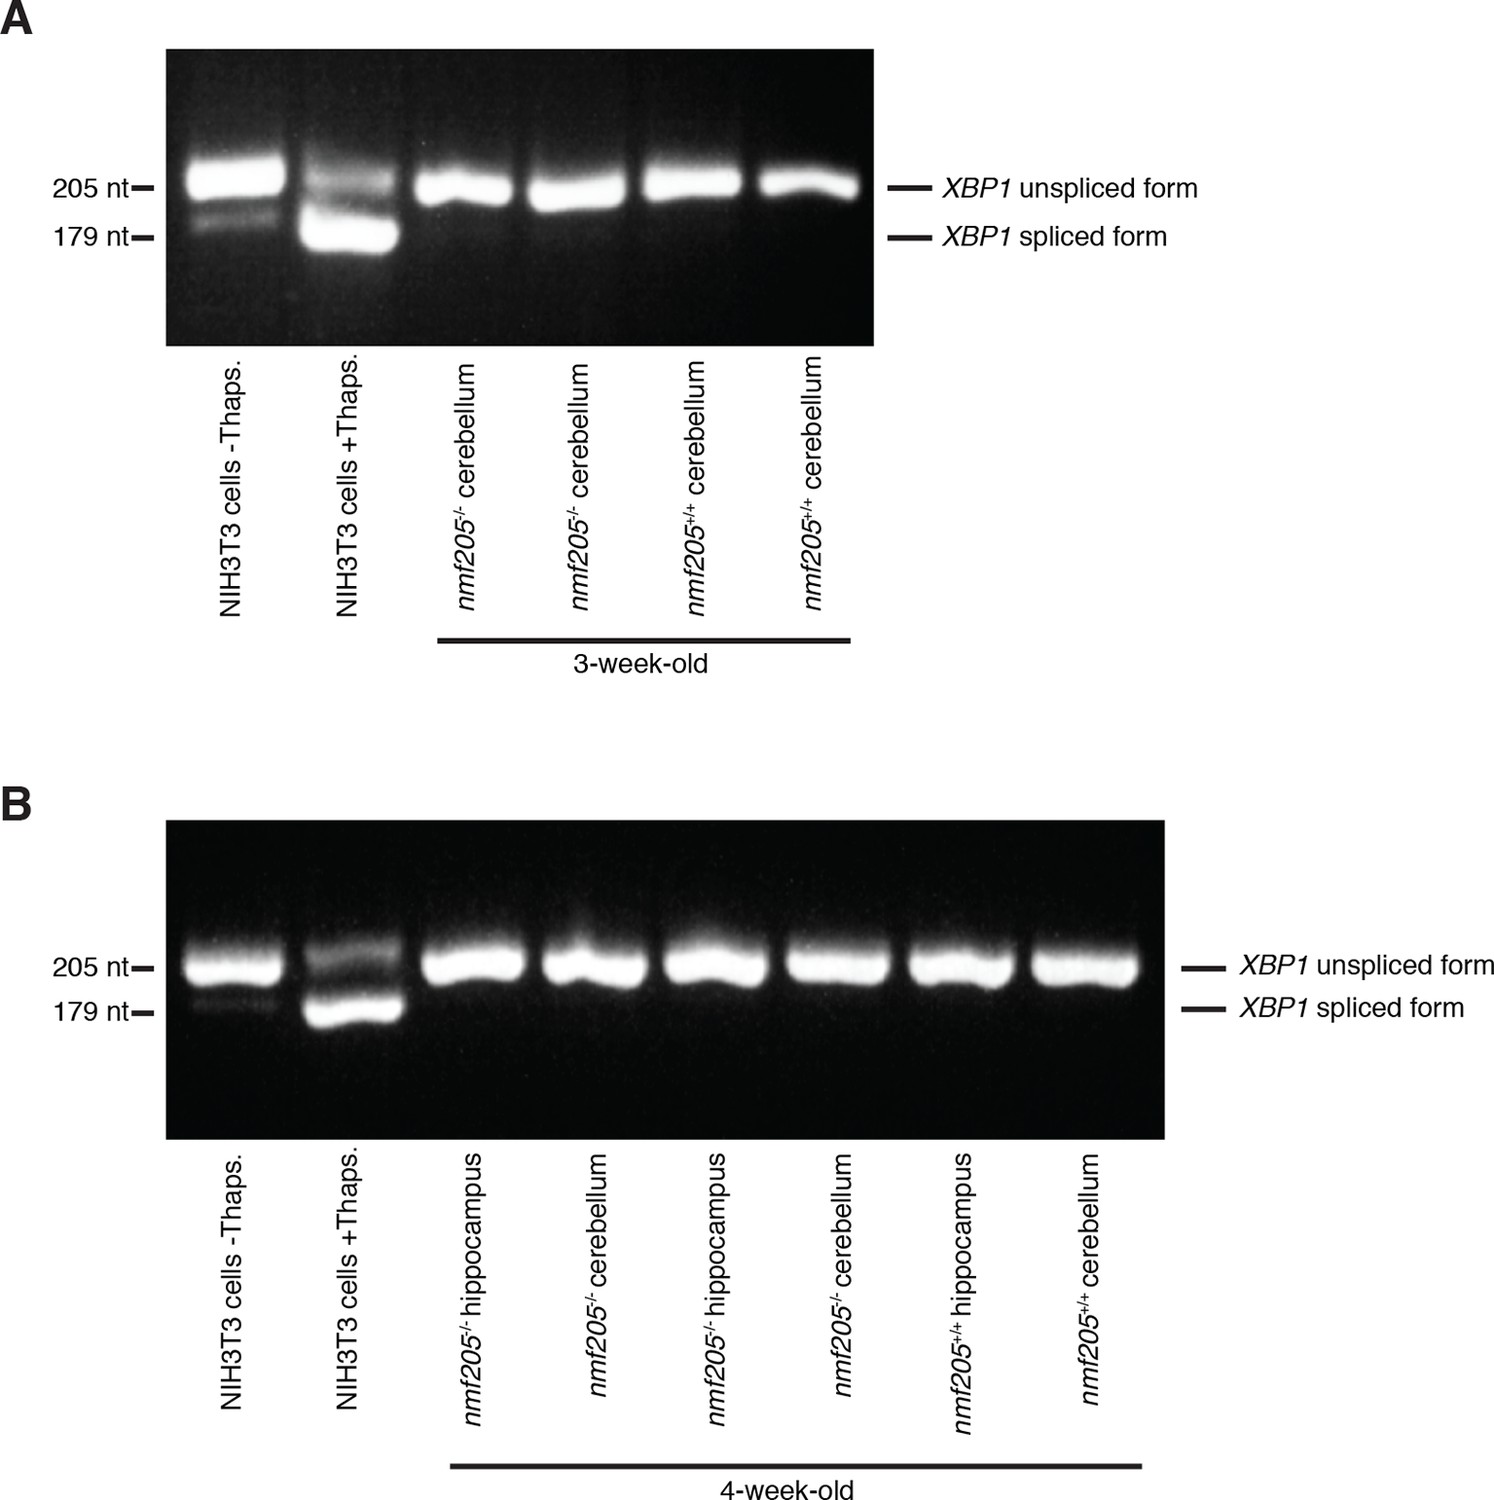
Absence of changes in Xbp1 splicing in the B6J-Gtpbp2nmf205-/- brain.
RT-PCR was performed to assess splicing of the Xbp1 mRNA in 3-week-old cerebellum (A), and 4-week-old cerebellum and hippocampus (B) in B6J-Gtpbp2nmf205-/- (B6J-nmf205-/-) mice. NIH3T3 cells were untreated or treated with thapsigargin (Thaps.) as a negative and positive control, respectively, for Xbp1 splicing.
Figure 3—figure supplement 2
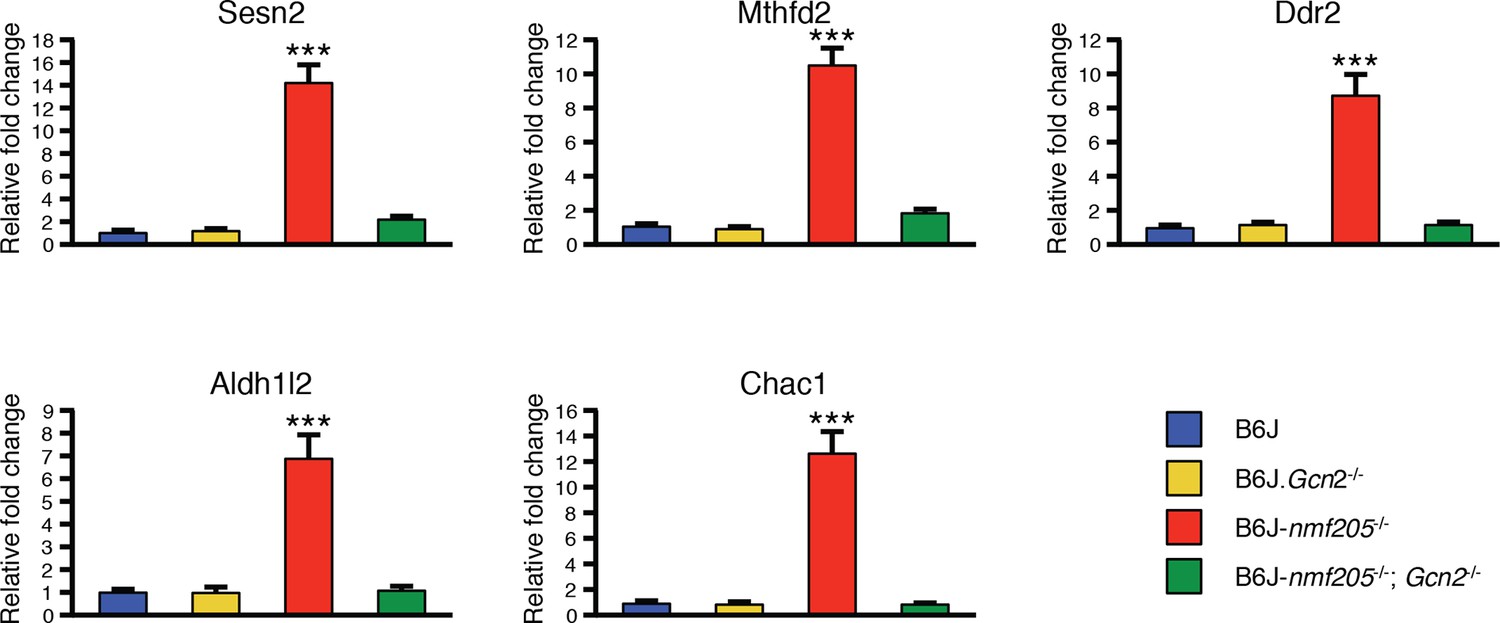
Quantitative RT-PCR showing the induction of ATF4 downstream genes is under the control of GCN2.
RT-qPCR was performed on the cerebellar transcripts from B6J, B6J.Gcn2-/-, B6J-Gtpbp2nmf205-/- (B6J-nmf205-/-), and B6J- Gtpbp2nmf205-/- (B6J-nmf205-/-); Gcn2-/- 3-week-old mice for the top 5 ATF4 downstream genes that had the highest relative fold change in the 3-week-old B6J-Gtpbp2nmf205-/- cerebellum in the microarray study. Expression levels were normalized by Gapdh expression, and relative fold change was calculated relative to the expression of the B6J cerebellum. Three mice from each genotype were analyzed and error bars indicate SEMs. ***p<0.001.
Figure 3—figure supplement 3
RNA-Seq analysis.
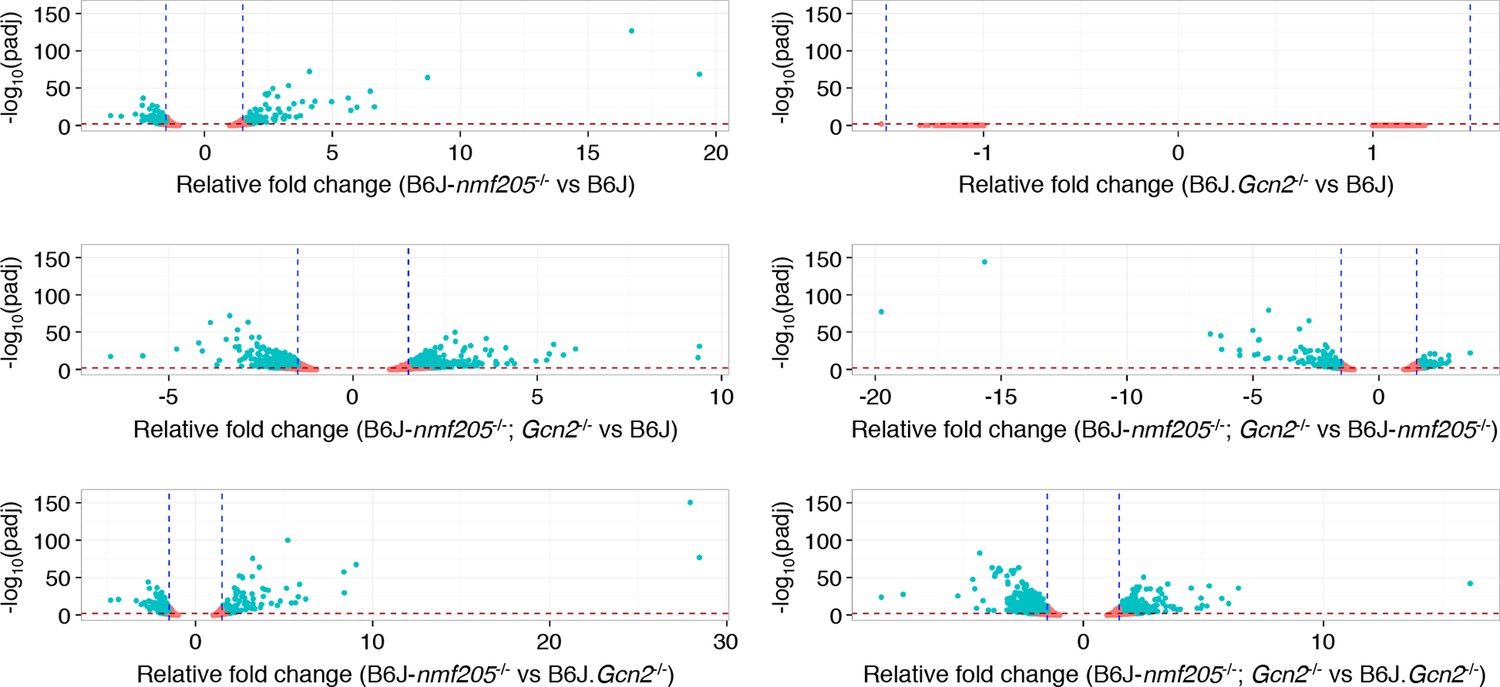
Volcano plots of pairwise genotype comparisons of transcripts from RNA-SEQ analysis performed on the cerebellum of 3-week-old B6J, B6J. Gcn2-/-, B6J-Gtpbp2nmf205-/- (B6J-nmf205-/-), and B6J-Gtpbp2nmf205-/- (B6J-nmf205-/-); Gcn2-/- mice. Thresholds of a relative fold change of 1.5 fold (vertical lines) and a p-value of 0.05 (horizontal lines) were adopted for this study.
Figure 3—figure supplement 4
Deletion of Gcn2 decreases expression of ATF4 target genes in the B6J cerebellum.
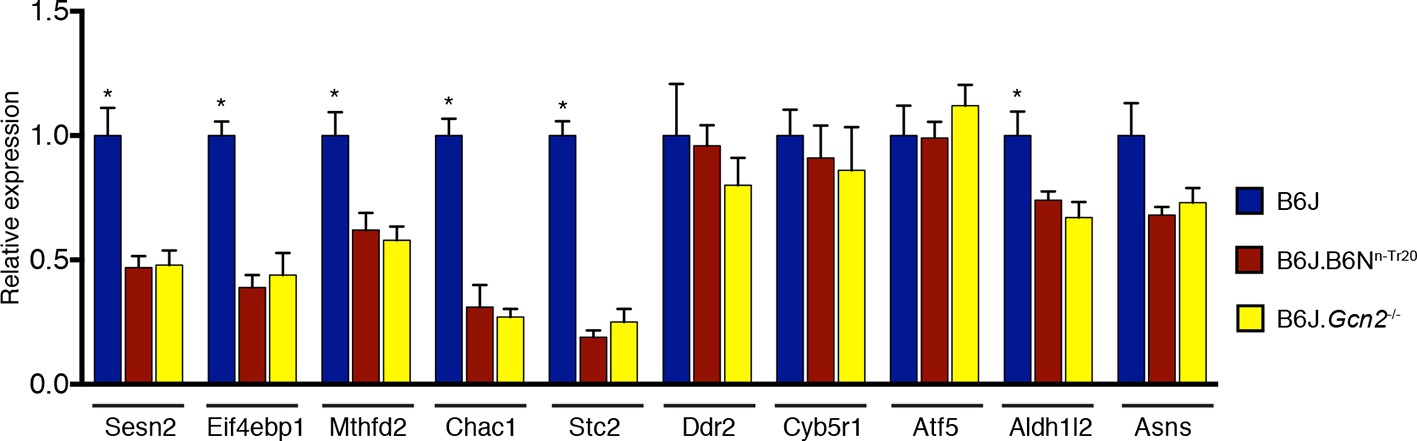
RT-qPCR analysis was performed on ATF4 target genes in the cerebellum from 2-month-old B6J, B6J.B6Nn-Tr20 and B6J. Gcn2-/- mice. Expression levels were normalized to Gapdh expression (n=4 mice per genotype). Error bars = SEM. *p<0.05 (Student's t tests).
Figure 4 with 2 supplements
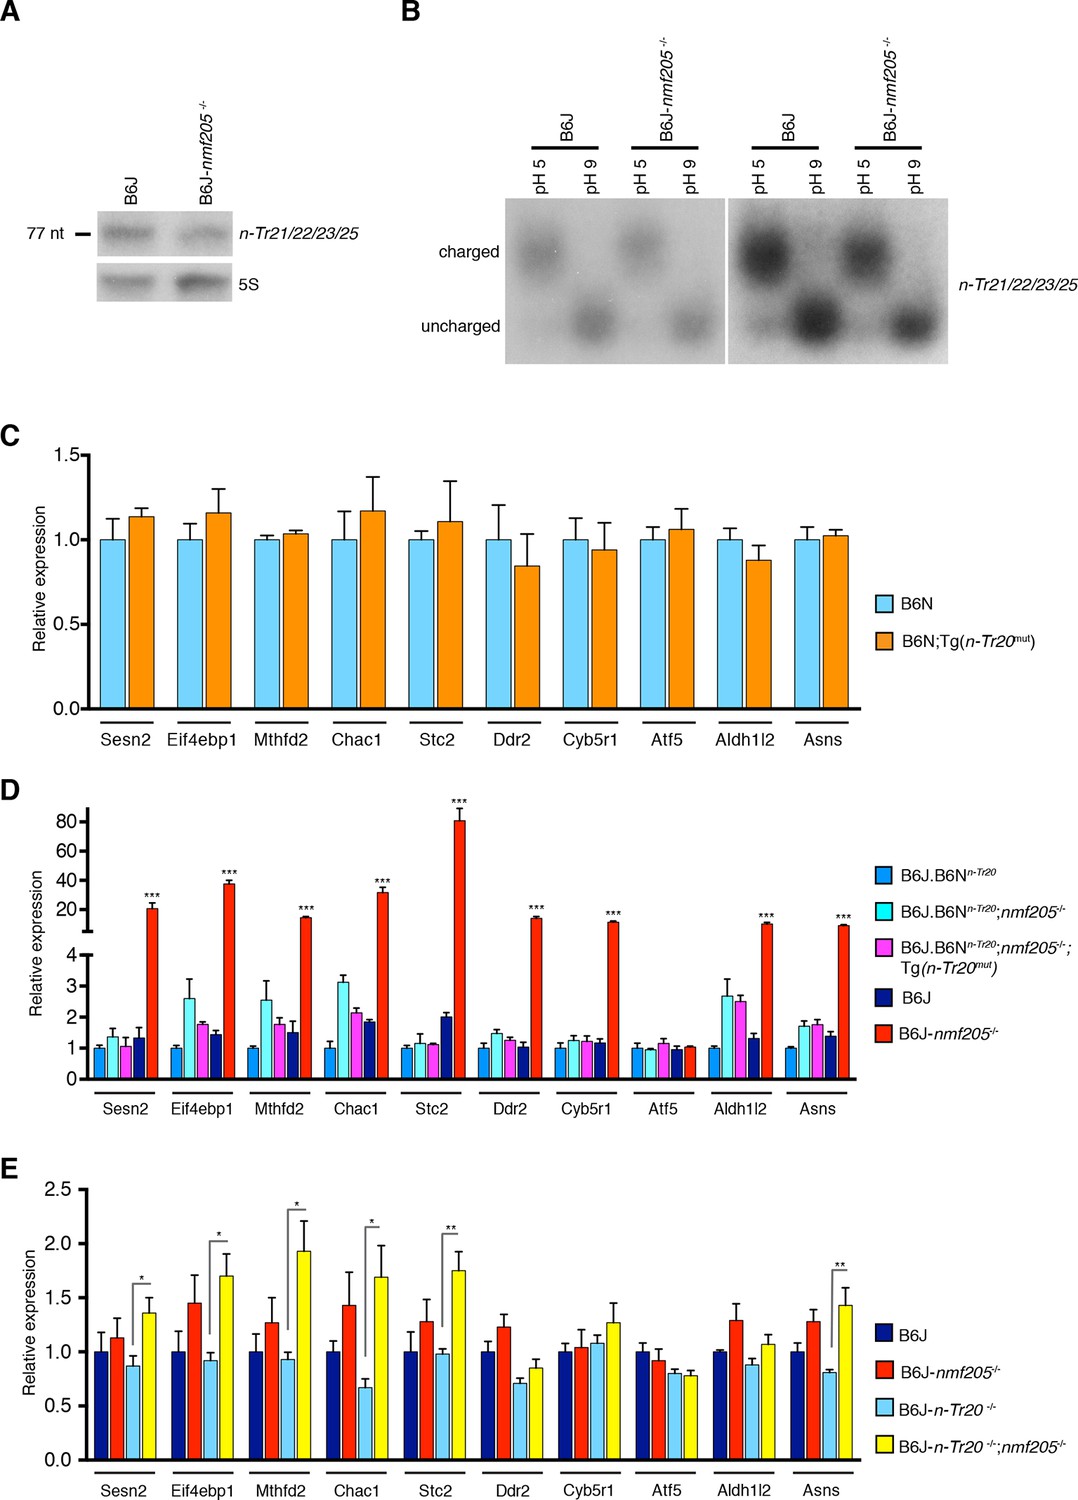
GCN2 activation in the B6J-Gtpbp2nmf205-/- brain is independent of uncharged tRNAArgUCU and unprocessed n-Tr20 tRNA.
(A) Northern blot analysis of cerebellar RNA from 3-week-old B6J and B6J-Gtpbp2nmf205-/- (B6J-nmf205-/-) mice using pooled probes to n-Tr21/22/23/25 tRNAs to assess the expression levels of the tRNAArgUCU isodecoder family. 5S was used as internal control. (B) Charged (pH 5) and uncharged (pH 9) tRNAArgUCU levels in the 3-week-old B6J and B6J-Gtpbp2nmf205-/- cerebellum. Note that the levels of uncharged tRNAArgUCU are negligible in both the B6J-Gtpbp2nmf205-/- and B6J cerebellum. A short (right) and a longer (left) exposure are shown. (C–E) RT-qPCR analysis of expression of ATF4 target genes. (C) Overexpression of the mutant n-Tr20 tRNA does not change expression of ATF4 targets in the 3-week-old cerebellum although increased levels of unprocessed n-Tr20 are present. (n=3 mice per genotype) (D) Overexpression of the mutant n-Tr20 tRNA does not change expression of ATF4 targets even in the Gtpbp2nmf205-/- mutant cerebellum at 3 weeks of age. (n=3) (E) ATF4 targets are significantly upregulated in the P0 brain of B6J-n-Tr20-/-; Gtpbp2nmf205-/- mice, although no unprocessed or uncharged forms of n-Tr20 are present. (n=4 mice per genotype) Error bars = SEM. *p<0.05, **p<0.01, and ***p<0.001 (Student's unpaired two-tailed t tests, C, E; one-way ANOVA, D).
Figure 4—figure supplement 1
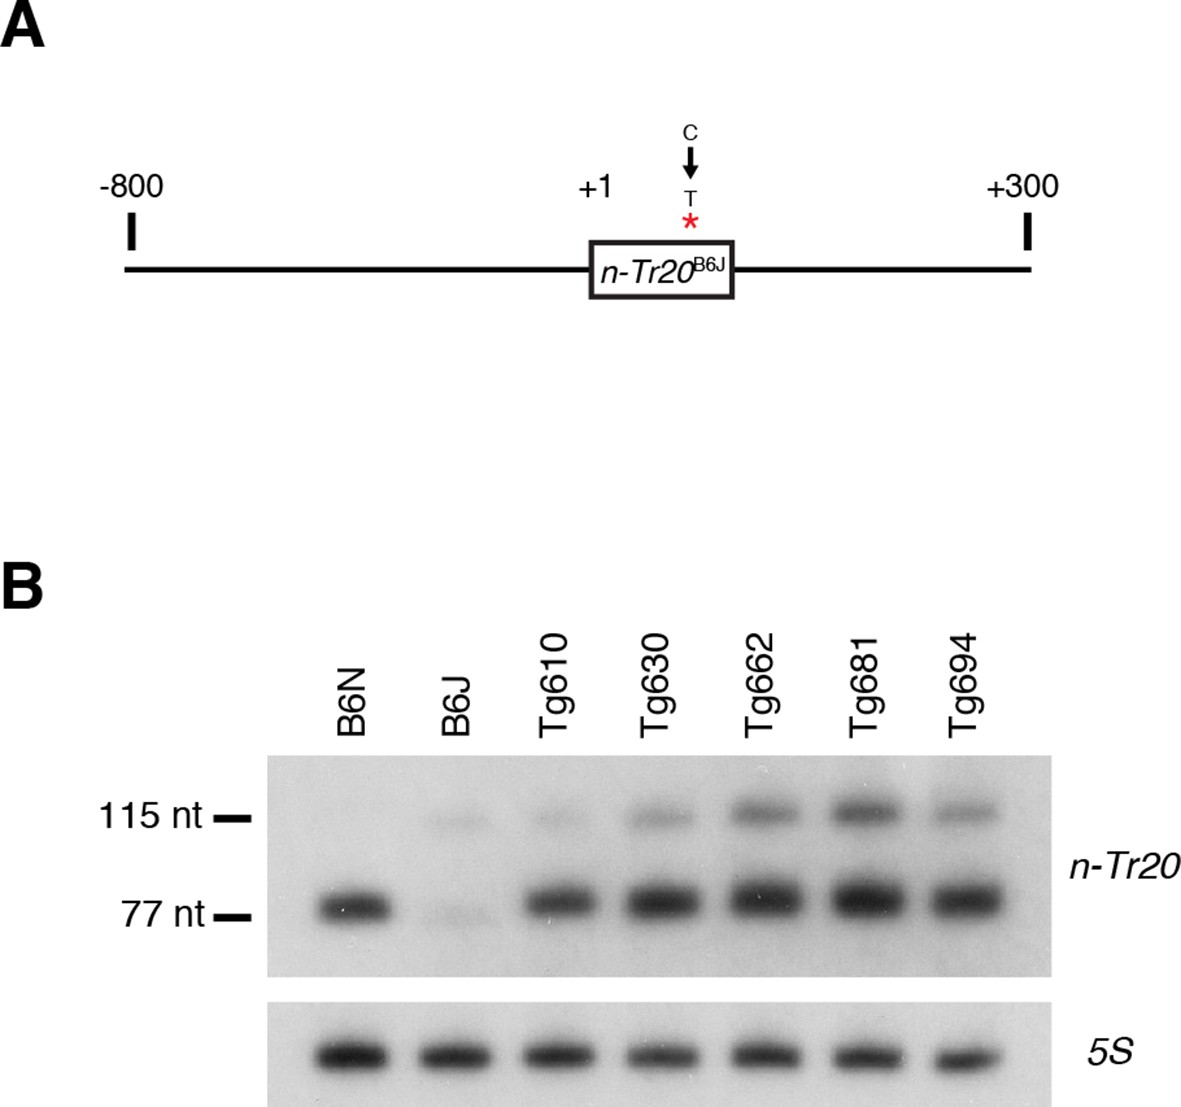
Generation of mice overexpressing mutant n-Tr20.
(A) Schematic showing 1.2-kb long genomic region around n-Tr20 containing the B6J SNP (indicated with an asterisk) that was used to produce transgenic mice. (B) Northern blot analysis using whole brain RNA comparing the expression pattern of n-Tr20 in B6N and B6J and the transgenic founder lines. Based on the amount of the 115-nt unprocessed form, line Tg681 has the highest expression of the mutant transgene and hence was chosen for the further experiments described in this paper.
Figure 4—figure supplement 2
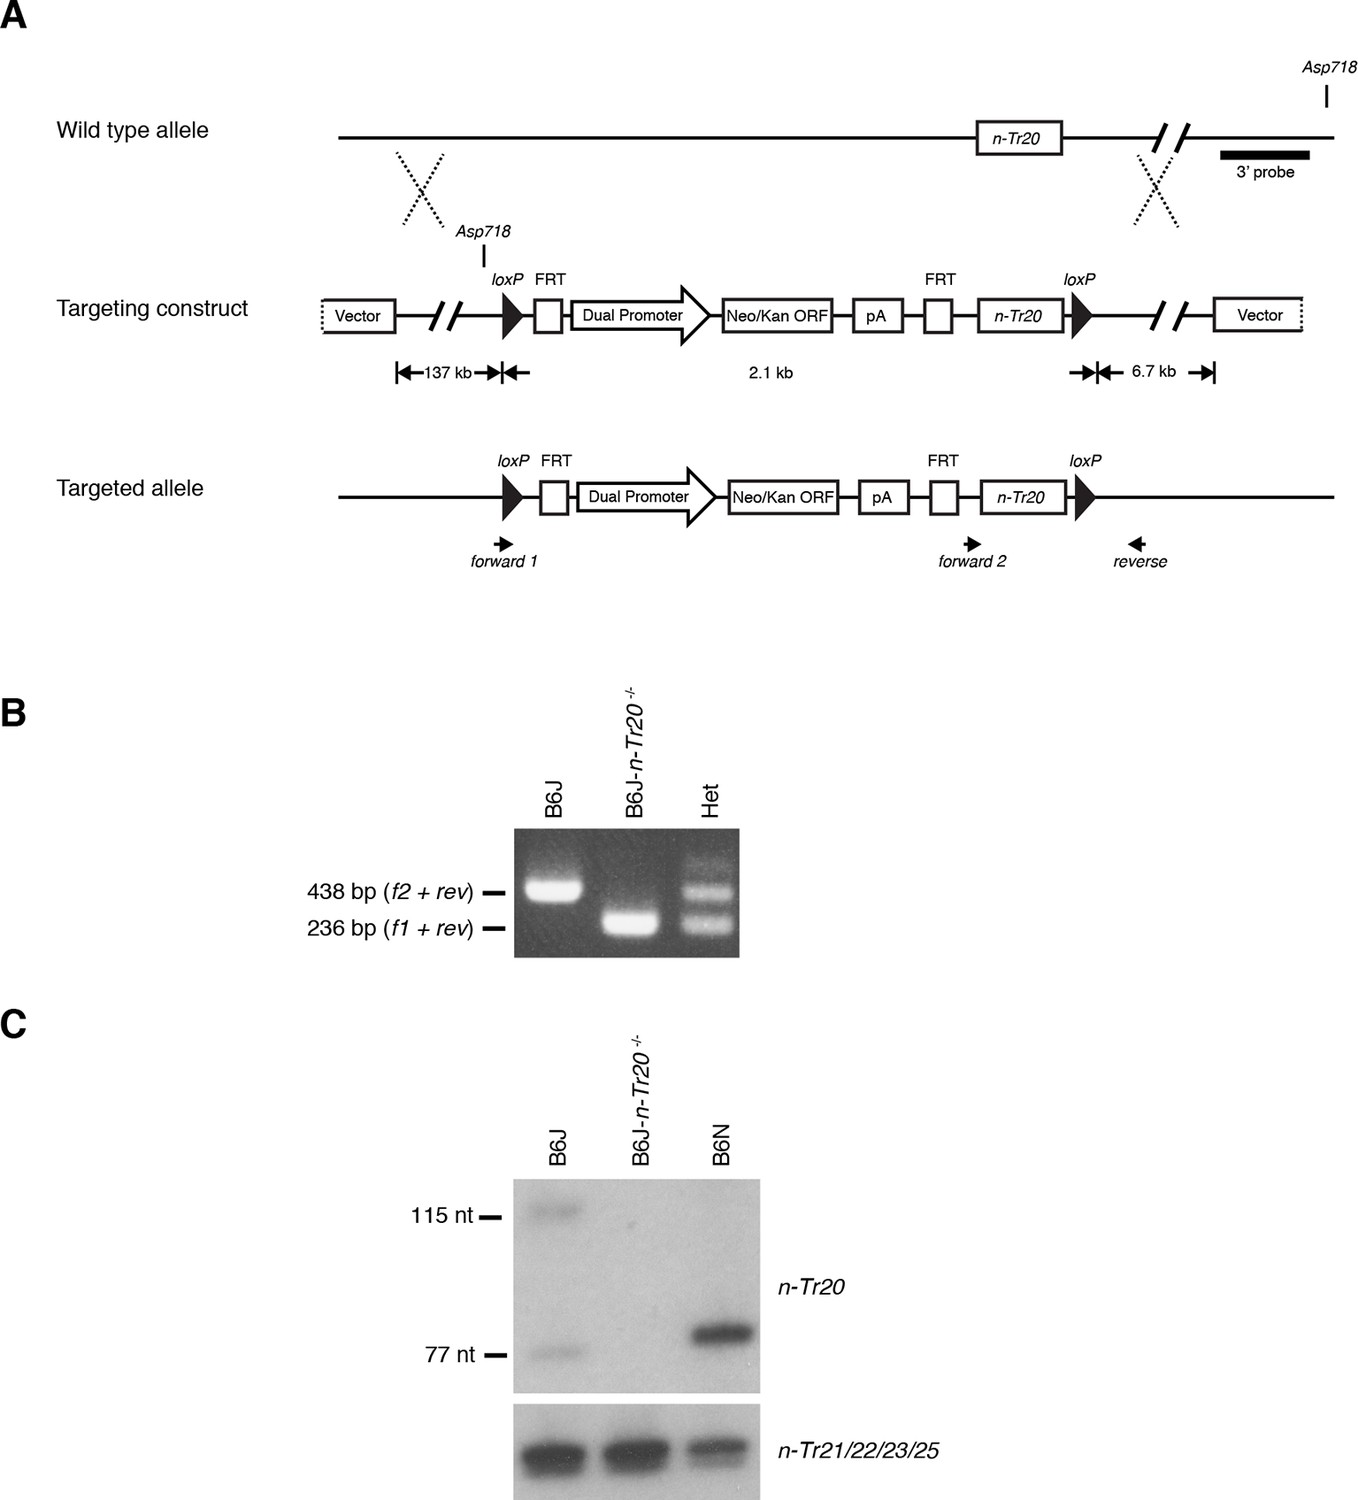
Generation of mice with the deleted n-Tr20 allele.
(A) LoxP sites were introduced flanking the n-Tr20 locus were introduced by homologous recombination as shown in the schematic. n-Tr20 was deleted in the germline by crossing B6J mice carrying the floxed allele to B6J-EIIa-Cre mice. (B) PCR analysis of genomic DNA using the indicated primers confirmed Cre-excision of n-Tr20. (C) Northern blot analysis showing complete loss of n-Tr20 expression in B6J-n-Tr20-/- brain. For comparison, levels of n-Tr20 are shown in the B6J and B6N brain.
Figure 5
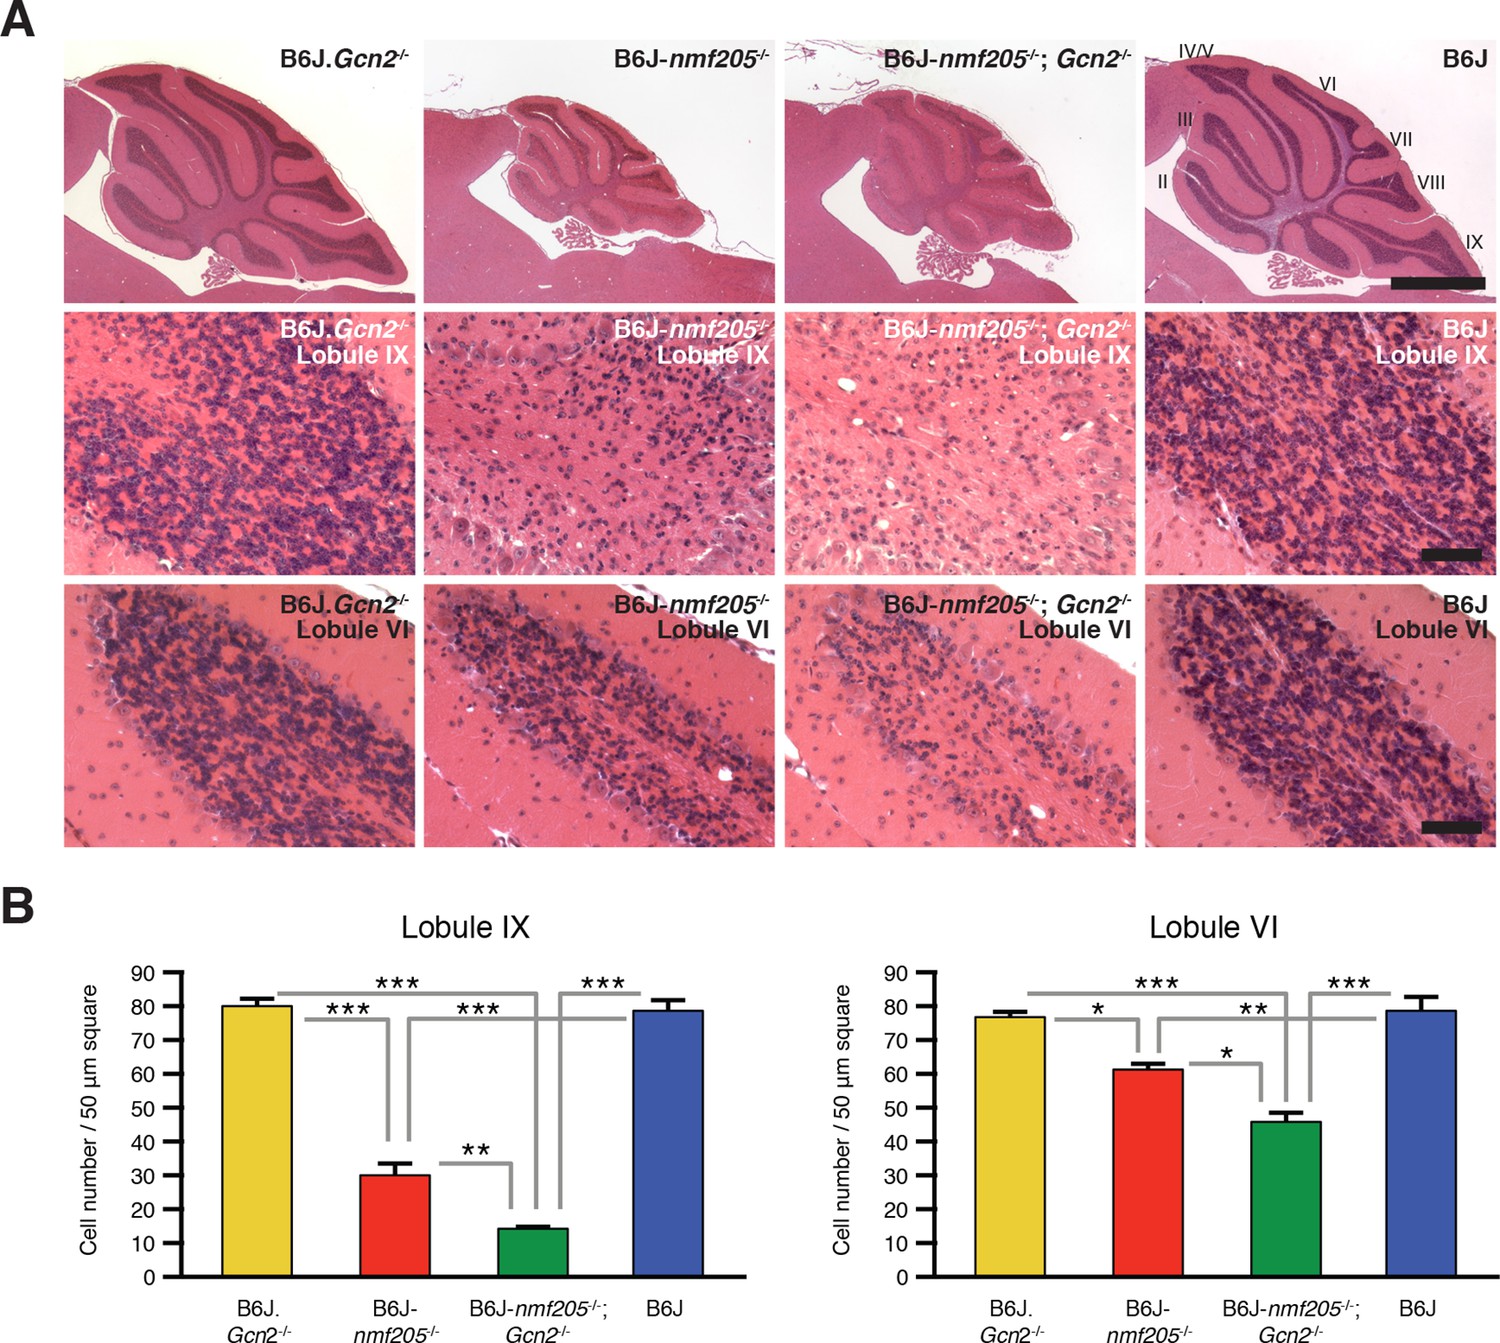
Loss of GCN2 accelerates B6J-Gtpbp2nmf205-/- cerebellar degeneration.
(A) Hematoxylin and eosin- stained sagittal sections of B6J.Gcn2-/-, B6J-Gtpbp2nmf205-/- (B6J-nmf205-/-), B6J-Gtpbp2nmf205-/-; Gcn2-/- and B6J cerebella. Higher-magnification images of cerebellar lobule IX and lobule VI are shown on lower panels. Scale bars, 1 mm (top row), and 50 μm (bottom two rows). (B) Numbers of granule cells (n=3 mice/genotype). Means ± SEM are shown. *p<0.05, **p<0.01, and ***p< 0.001 (one-way ANOVA).
Figure 6
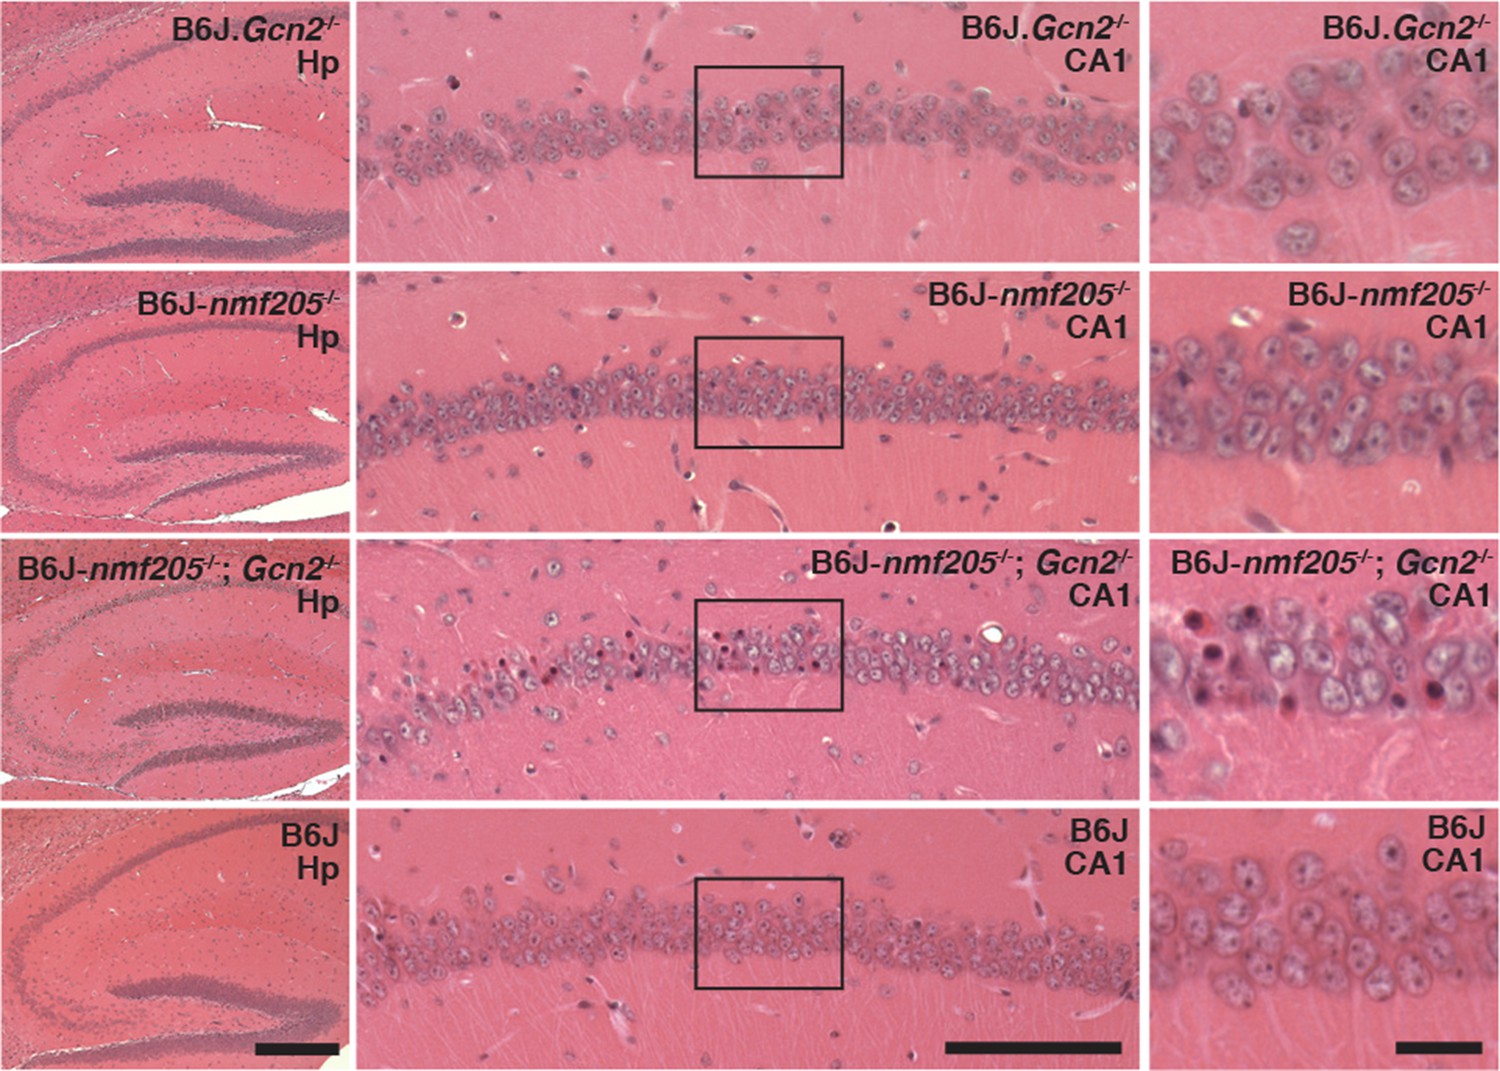
GCN2 protects against loss of B6J-Gtpbp2nmf205-/- CA1 hippocampal neurons.
(A) Hematoxylin and eosin stained sagittal sections of 6-week-old B6J.Gcn2-/-, B6J-Gtpbp2nmf205-/- (B6J-nmf205-/-), B6J- Gtpbp2nmf205-/-; Gcn2-/-, and B6J hippocampi. Higher magnification images of hippocampal CA1 are also shown. Scale bars, 250 μm (left panels), 100 μm (middle panels), and 20 μm (right panels).
Download links
A two-part list of links to download the article, or parts of the article, in various formats.
Downloads (link to download the article as PDF)
Open citations (links to open the citations from this article in various online reference manager services)
Cite this article (links to download the citations from this article in formats compatible with various reference manager tools)
Activation of GCN2 kinase by ribosome stalling links translation elongation with translation initiation
eLife 5:e14295.
https://doi.org/10.7554/eLife.14295


