A mitofusin-dependent docking ring complex triggers mitochondrial fusion in vitro
- Max Planck Institute of Biophysics, Germany
- Sorbonne Universités, France
Figures
Figure 1
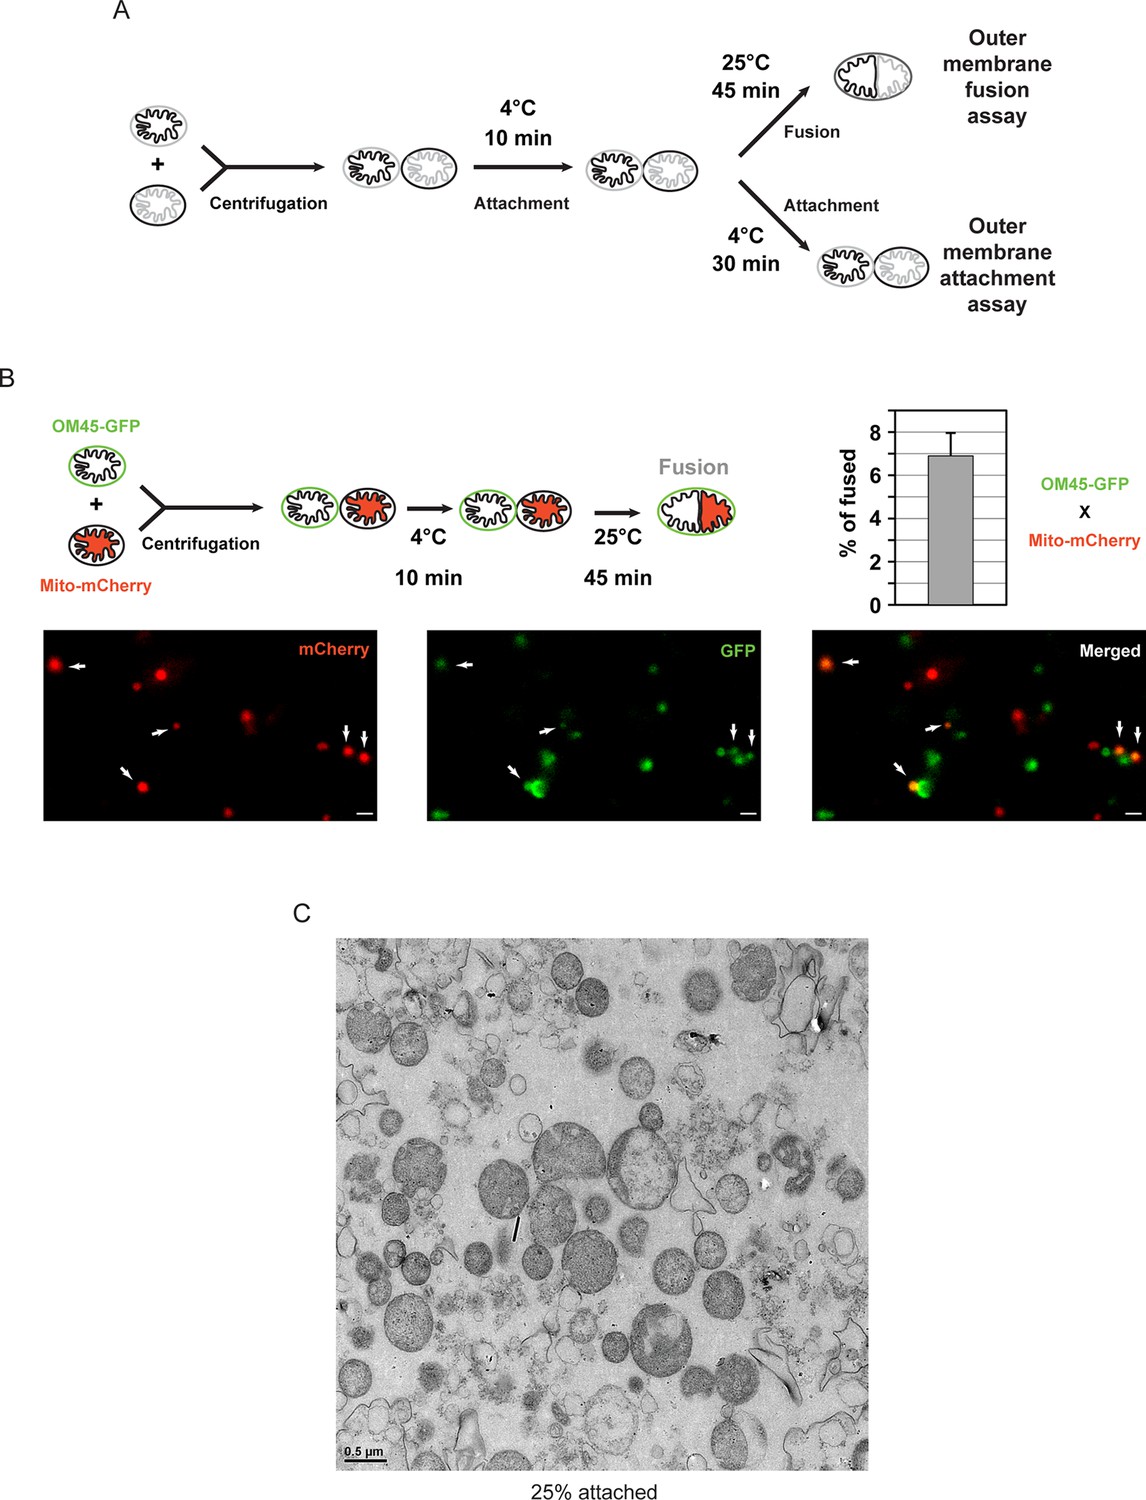
In vitro outer membrane fusion and attachment assays.
(A) Purified mitochondria are brought into contact by centrifugation. A 10 min incubation on ice promotes mitofusin-dependent attachment, which is essential for subsequent fusion of outer membranes at room temperature (top). Prolonged incubation on ice prevents fusion of outer membranes but stabilizes attached intermediates (bottom). Upon incubation at 25°C, fusion of inner membranes does not occur unless energy is regenerated. (B) Top: Fusion reactions were performed by mixing mitochondria isolated from cells expressing either the outer membrane protein OM45 tagged with GFP (OM45-GFP) or the mitochondrial matrix targeted mCherry (Mito-mCherry). Bottom: Fluorescence microscopy of a fusion reaction. Co-localization of GFP and mCherry indicate intermediates with fused outer membranes (white arrows), scale bars 1 μm. Top right: Fusion efficiency. Error bar represents the s.d. from three independent experiments. (C) Representative transmission electron micrograph of in vitro attachment reactions with mitochondria isolated from wild-type cells.
Figure 2 with 1 supplement
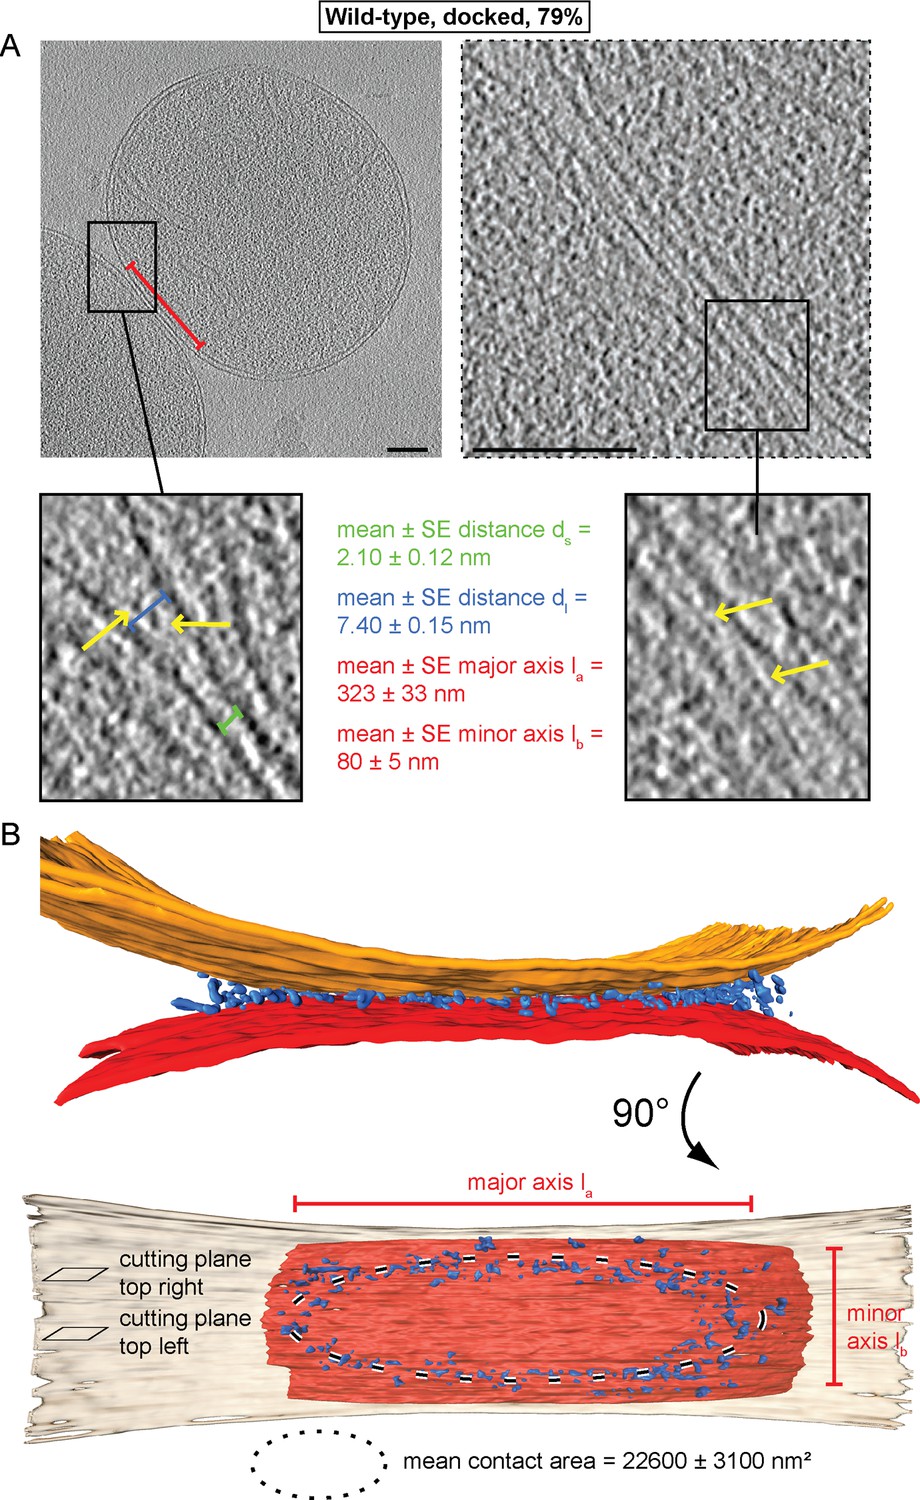
Cryo-ET of docked intermediates (79% of sampled wild-type mitochondria, see Table 1).
(A) Slices and zooms through tomographic volumes at different z-heights (section planes indicated in B) through the center (left) or edge (right) of a contact area defined by its major axis, la (red bracket), and the perpendicular minor axis lb (see B); scale bars 100 nm. Dense protein complexes (yellow arrows) are visible at a distance of 6–9 nm from the outer membrane (dl, blue bracket) but not in the center of the contact area (1–3 nm, green bracket, ds). Sections through the edge of a contact area (right) reveal interstitial densities between the outer membranes. (B) 3D rendering of outer membranes (red and orange) of two closely apposed mitochondria and protein densities around the contacts area (blue; the same color scheme is used in all figures).
Figure 2—figure supplement 1
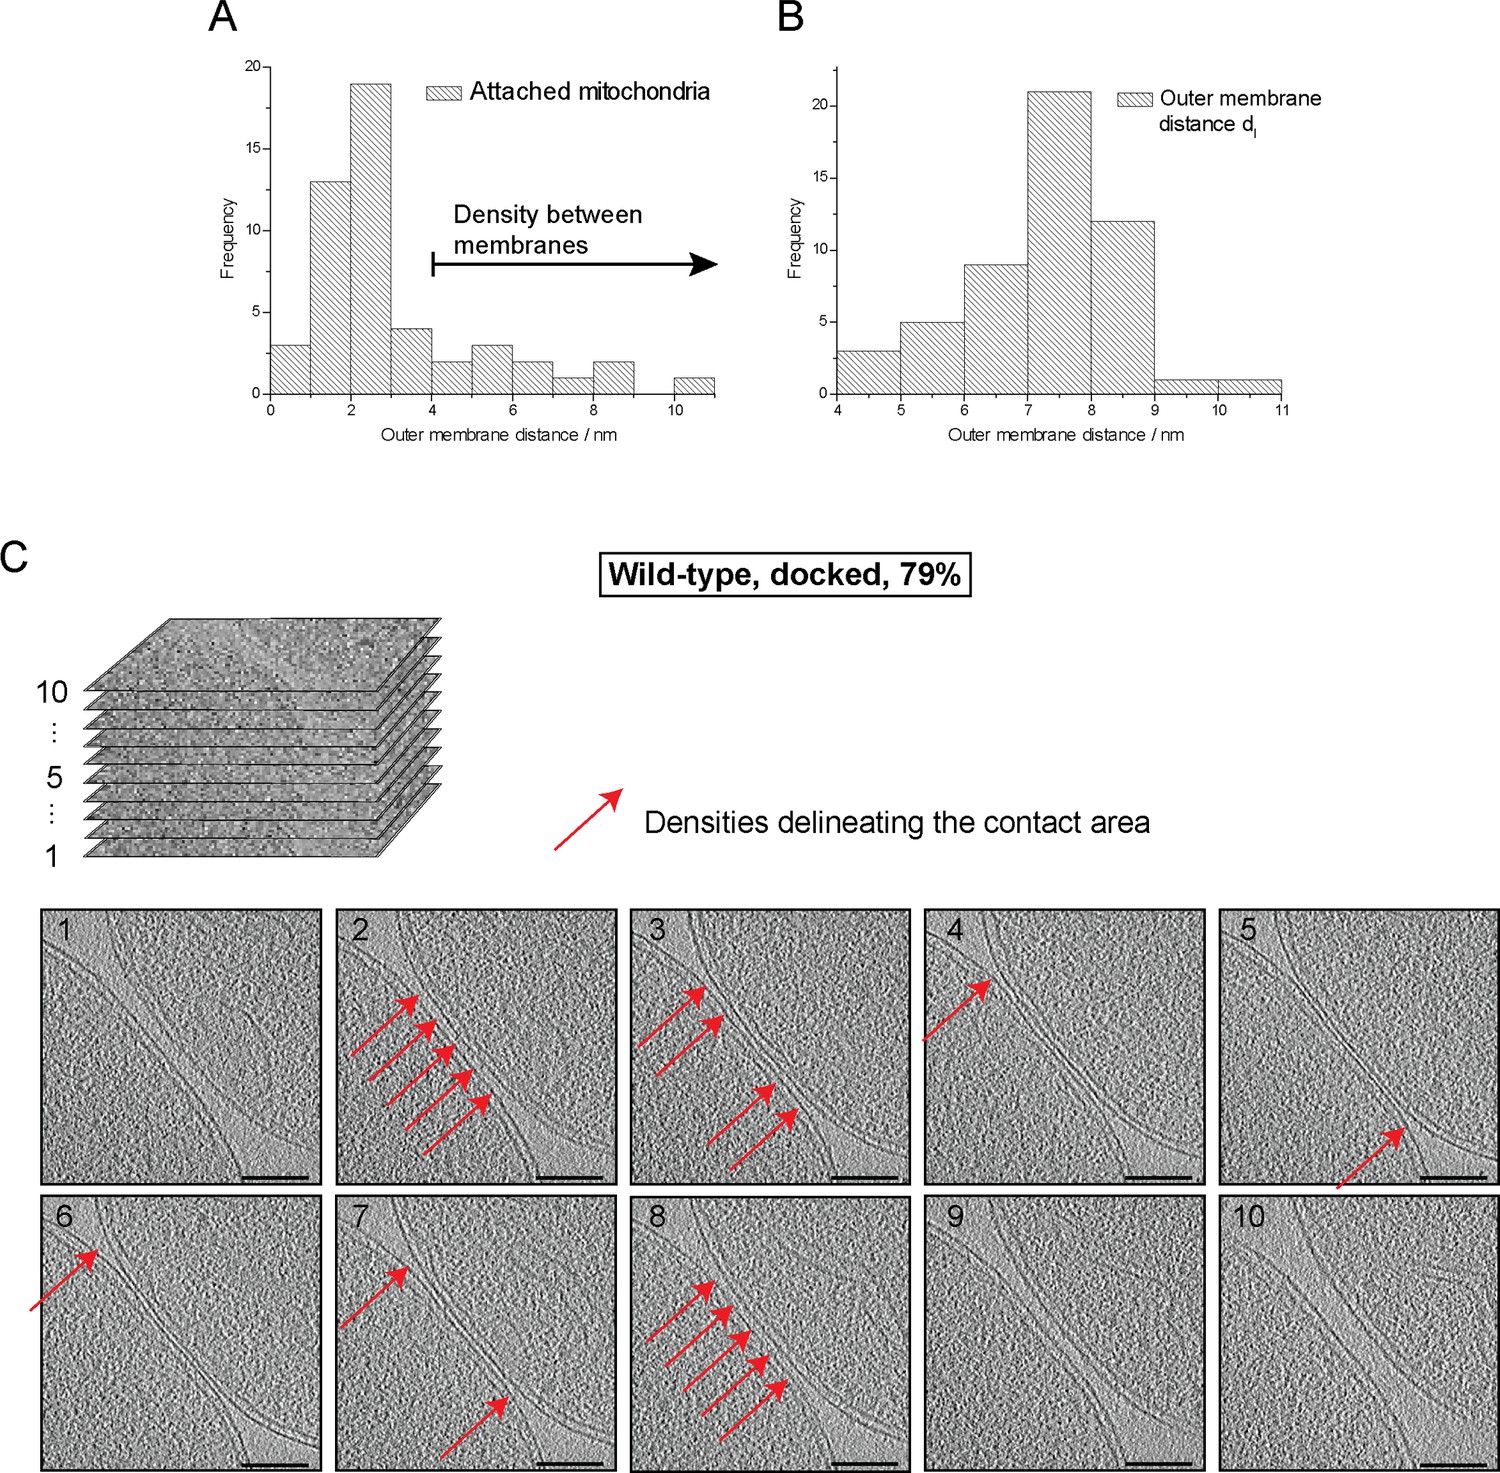
Cryo-ET of major mitochondrial population of wild-type attachment intermediates (Docked, 79%, see Table 1).
(A) Histogram of distances between outer membranes of attached mitochondria. Density between outer membranes were observed at distances > 3.5 nm. 79% of all contacts were closer than 3.5 nm. (B) Histogram of outer membrane distance dl at the periphery of contact areas. (C) Slices through tomographic volumes of the contact area; scale bars 100 nm. One out of 20 slices in the stack is shown. Red arrows, interstitial density between outer membranes. Note that this density is observed only around the edge of the contact area.
Figure 3 with 1 supplement

Cryo-ET analysis of tethered intermediates (21% of sampled wild-type mitochondria, see Table 1).
(A) 3D rendering of two closely apposed mitochondria shown in B, top row and Figure 3—figure supplement 1. (B) Slices and zooms (indicated by black and red dashed boxes) through tomographic volumes; scale bars 100 nm. Blue bracket: outer membrane distance; red arrows, interstitial density.
Figure 3—figure supplement 1
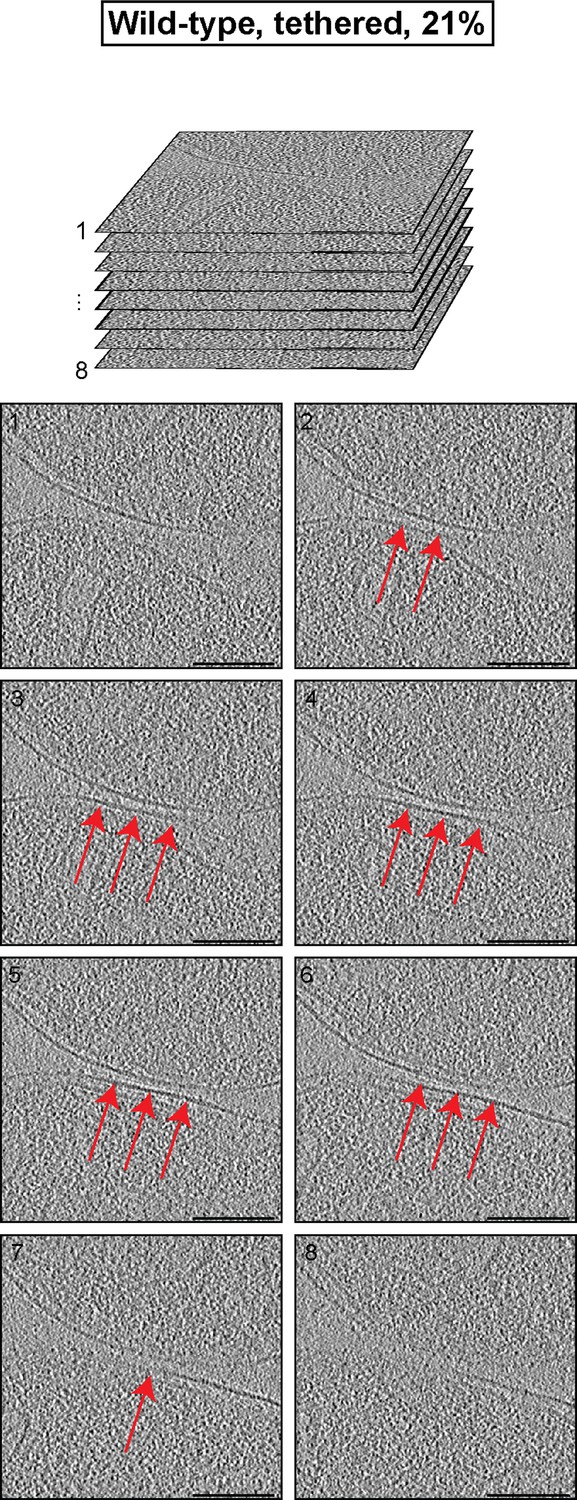
Cryo-ET analysis of the minor mitochondrial population of wild-type attachment intermediates (Tethered, 21%, see Table 1).
Stack of tomographic slices of mitochondria shown in Figure 3A with details of contact area. One out of 20 slices is shown; scale bars 100 nm; red arrows, interstitial density.
Figure 4 with 1 supplement
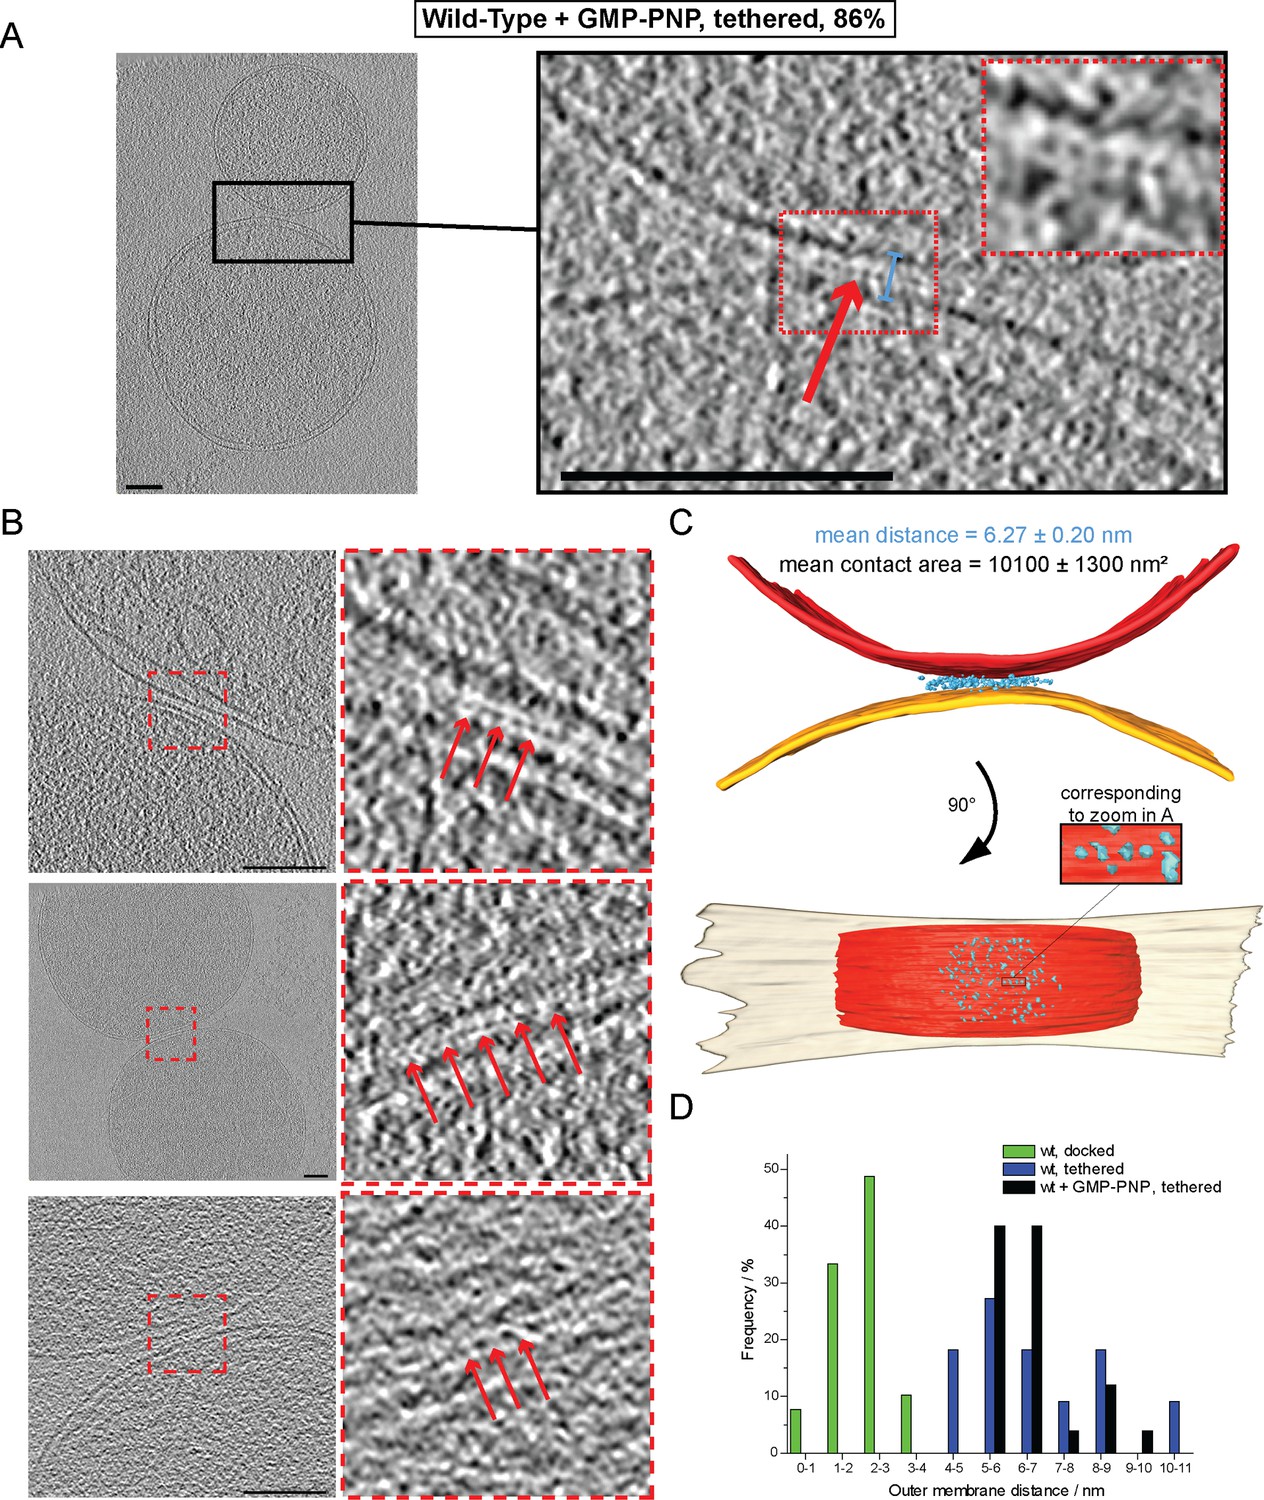
Cryo-ET of mitochondrial attachment intermediates upon GMP-PNP treatment (Tethered, 86%, see Table 1).
(A-B) Example slices and zooms (black and red dashed boxes) through tomographic volumes; scale bars 100 nm; blue bracket: distance between outer membranes; red arrows: regularly spaced interstitial protein densities. Note the repeat distance of 4.3 nm. (C) 3D rendering of two closely apposed mitochondria shown in A. The zoomed densities correspond to the regularly spaced interstitial protein densities zoomed in A. (D) Histogram of distances between outer membranes for all major populations of attached intermediates.
Figure 4—figure supplement 1
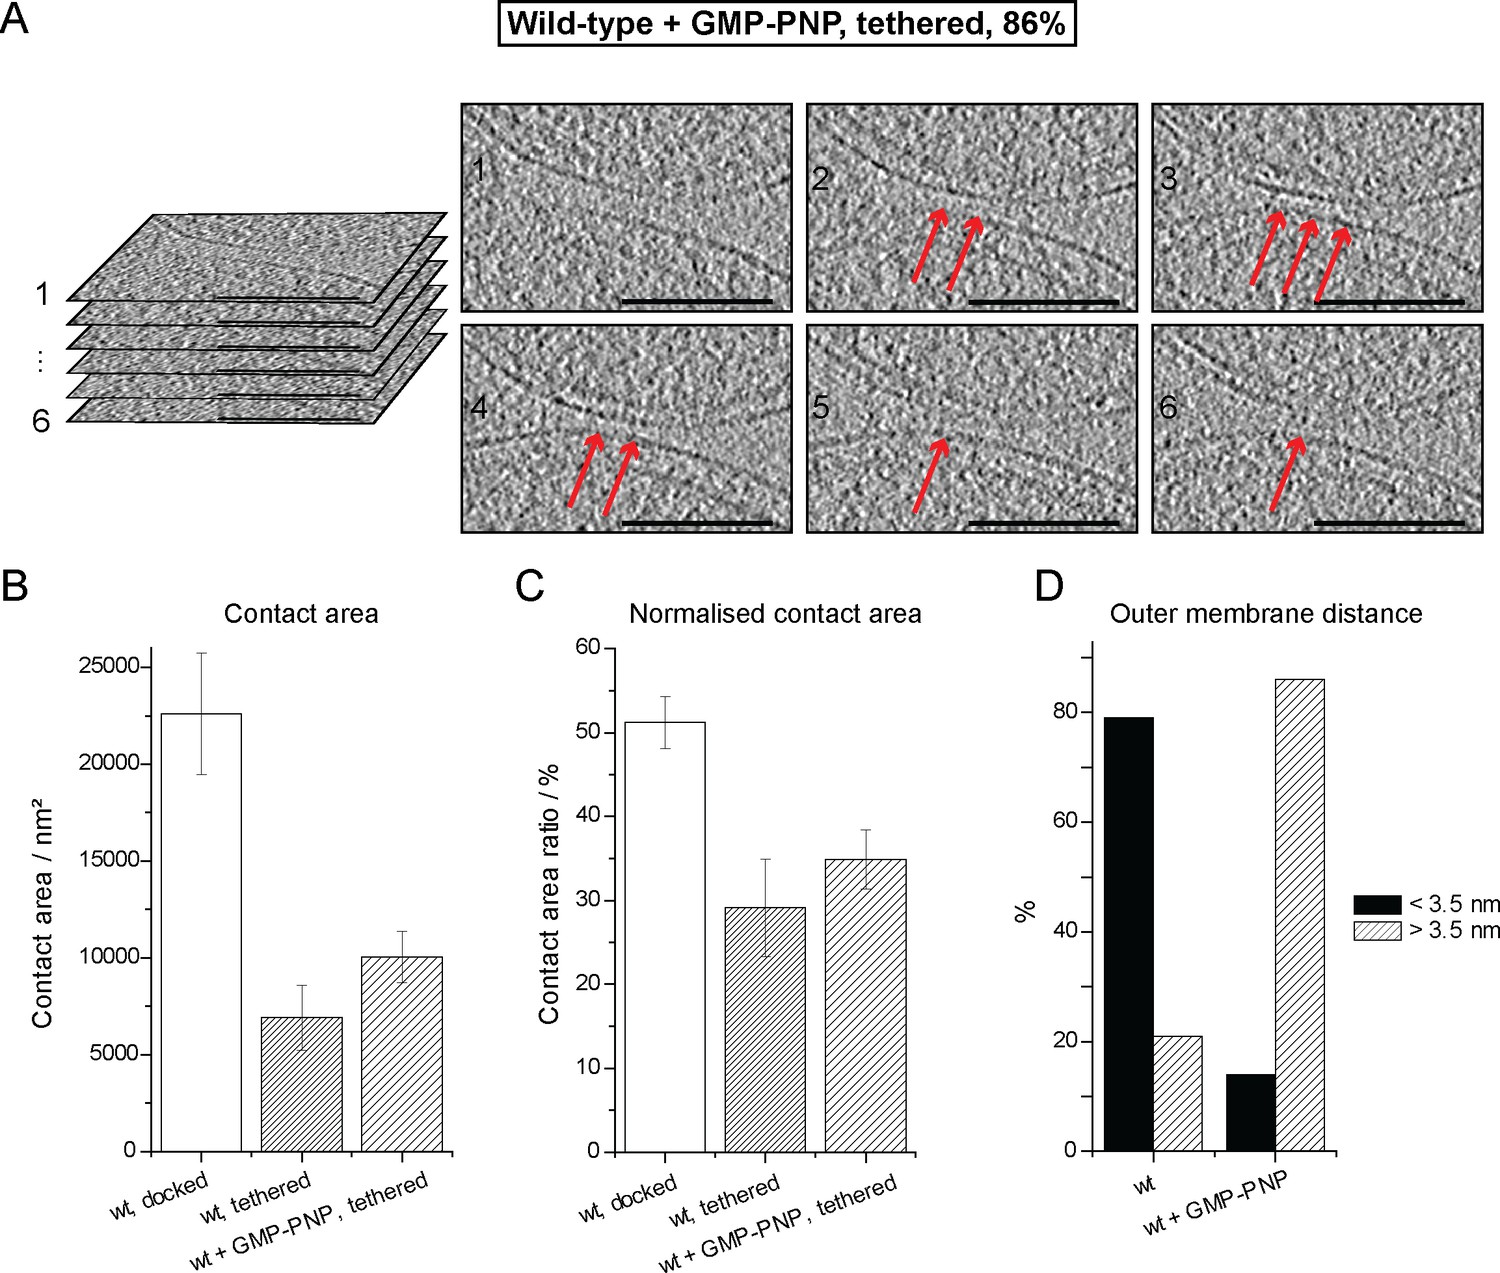
Cryo-ET of a tethered mitochondrial intermediate upon GMP-PNP treatment (Tethered, 86%, see Table 1).
(A) Consecutive slices through tomographic volume (compare Figure 4A); scale bars 100 nm. One out of 20 slices is shown. Red arrows, densities between outer membranes. (B–D) Statistics of populations of attached intermediates. (B) Contact area of mitochondria at conditions indicated. (C) Contact area ratio normalized to mitochondrial dimensions. The area is compared to the diameter of the smaller of the two appressed mitochondria. (D) Distance distribution between outer membranes in mitochondrial contacts. The major population of attached intermediates seen in wild-type conditions (docked) differs significantly from those observed upon GMP-PNP treatment. Error bars, standard error of the mean.
Figure 5 with 1 supplement
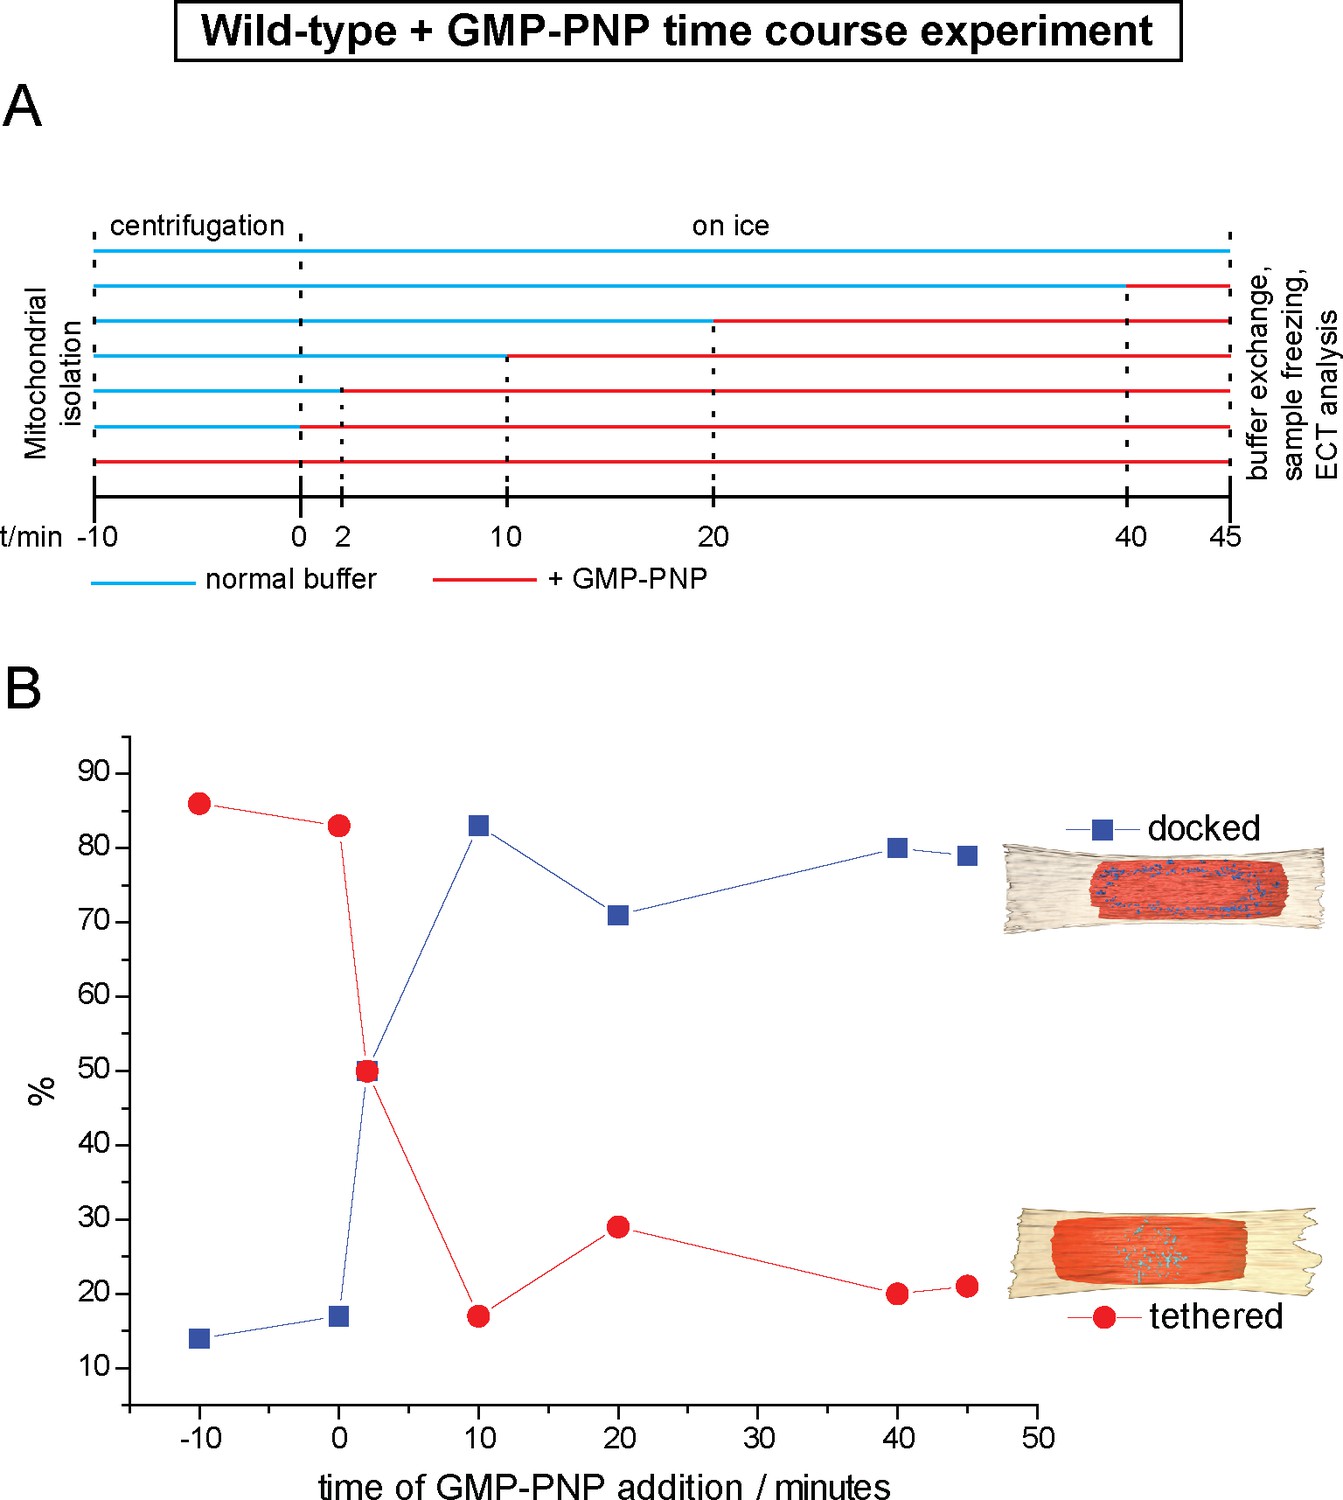
Cryo-ET time course experiment of attached mitochondria treated with GMP-PNP.
(A) GMP-PNP was added at the time points indicated (dashed black lines). (B) Proportion of docked and tethered intermediates observed before and after GMP-PNP addition. Time t = 0 indicates the start of the incubation period on ice.
Figure 5—figure supplement 1
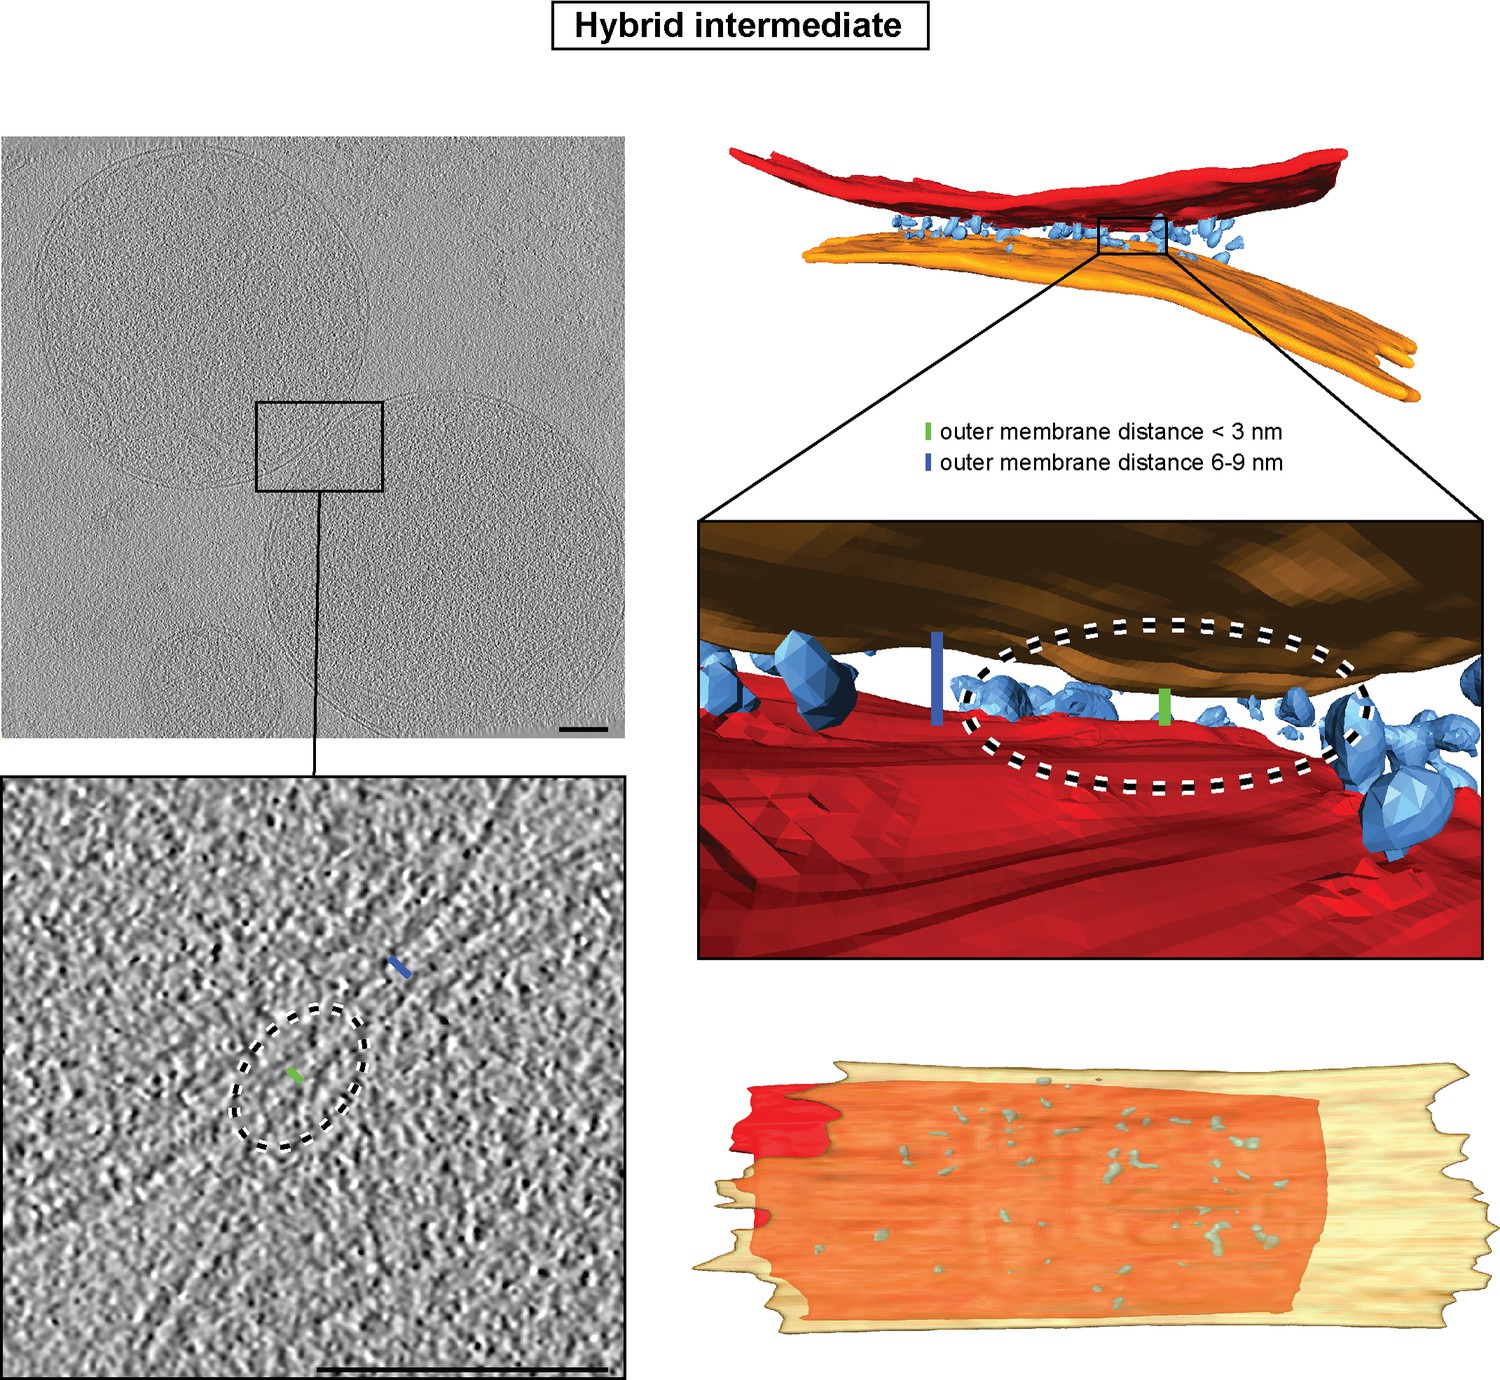
Hybrid intermediate captured upon GMP-PNP addition two minutes after centrifugation.
Left: Slices through tomographic volume of two attached mitochondria; scale bars 100 nm. The blue bar indicates the typical distance between outer membranes of GMP-PNP-treated mitochondria (about 6 nm). The green bar indicates a small area of closer contact. Right: 3D rendering of two mitochondria. Note the absence of protein densities between outer membranes in close contact.
Figure 6 with 2 supplements
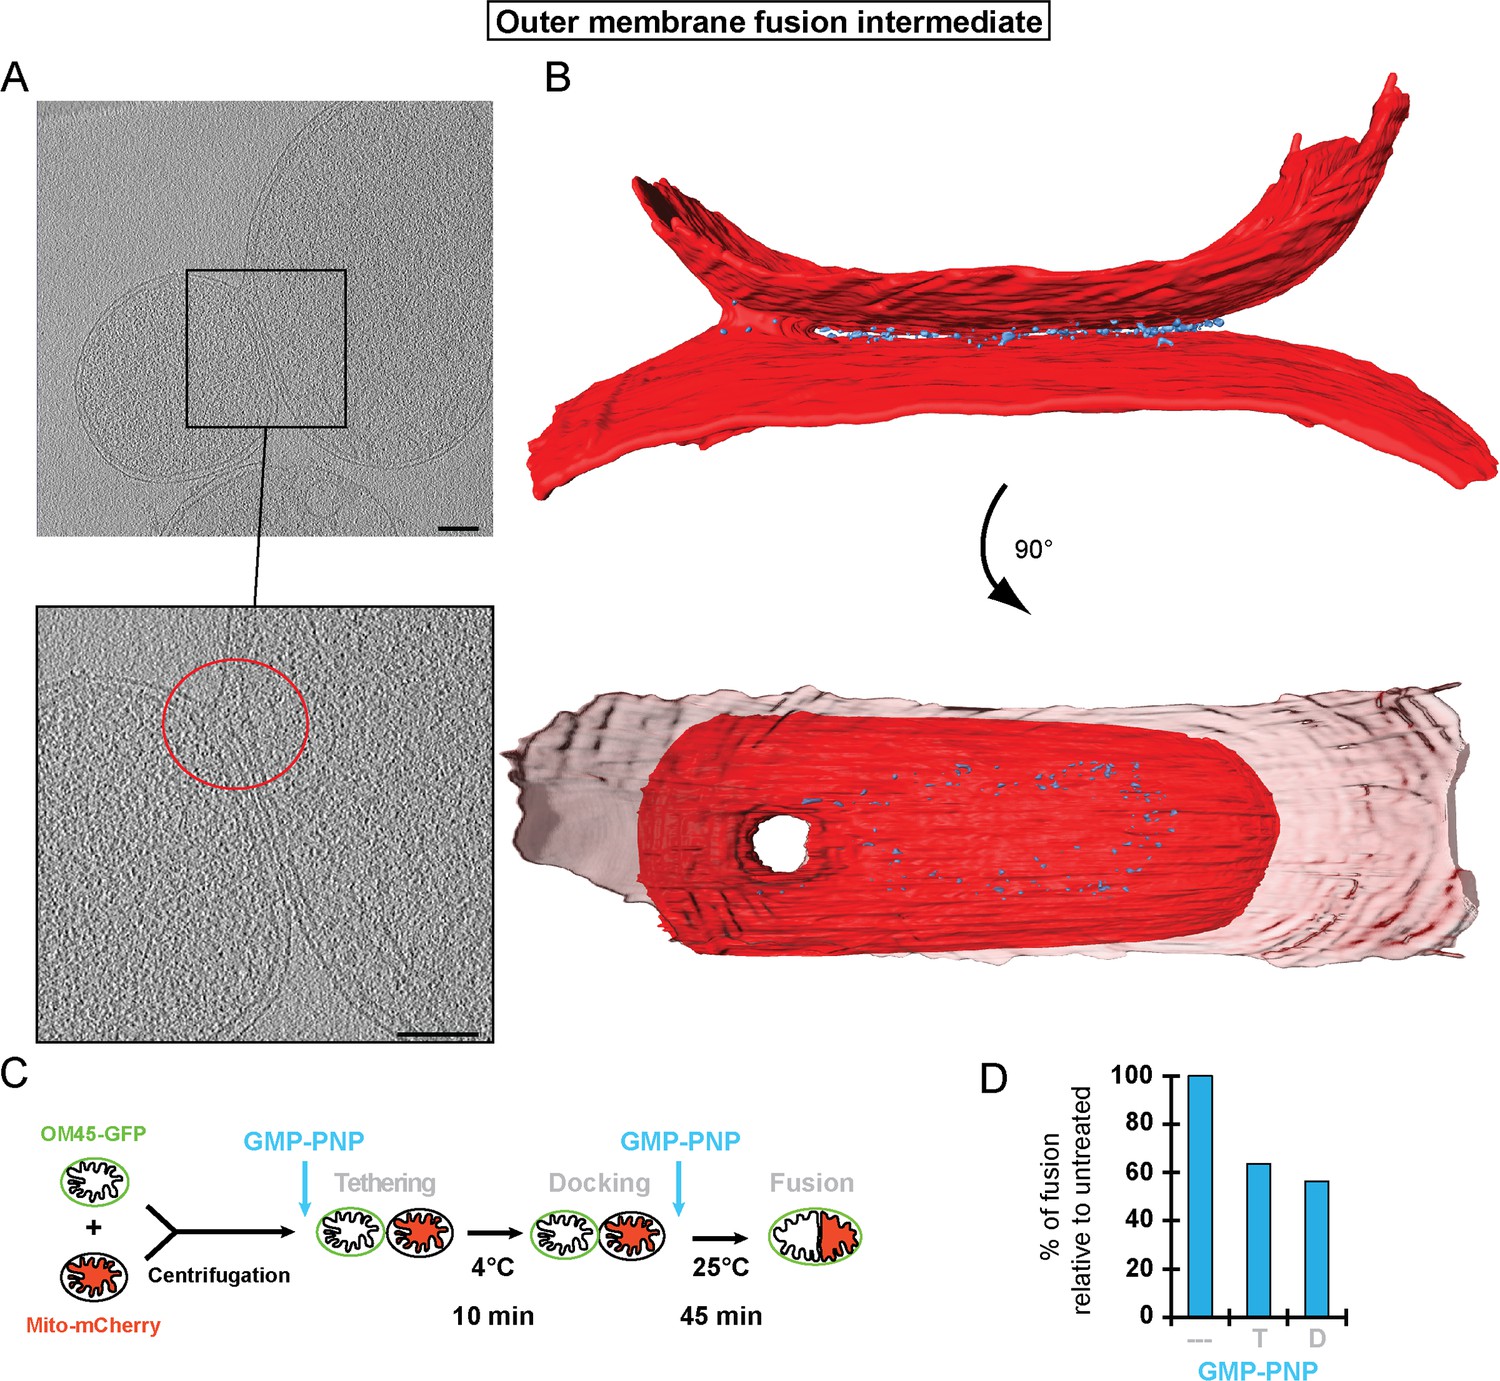
Stages of outer membrane fusion.
(A and B) Cryo-ET of docked mitochondria with partially fused outer membrane. (A) Slices through tomographic volume; scale bars 100 nm. The red circle highlights the region of outer membrane fusion. (B) 3D rendering. Two mitochondria are joined by one continuous outer membrane (red). The inter-membrane spaces are connected by a toroid pore of 40 nm diameter. (C and D) Fluorescence microscopy of in vitro outer membrane fusion. GMP-PNP was added at the beginning (tethering, T) or at the end (docking, D) of the 10 min incubation period.
Figure 6—figure supplement 1
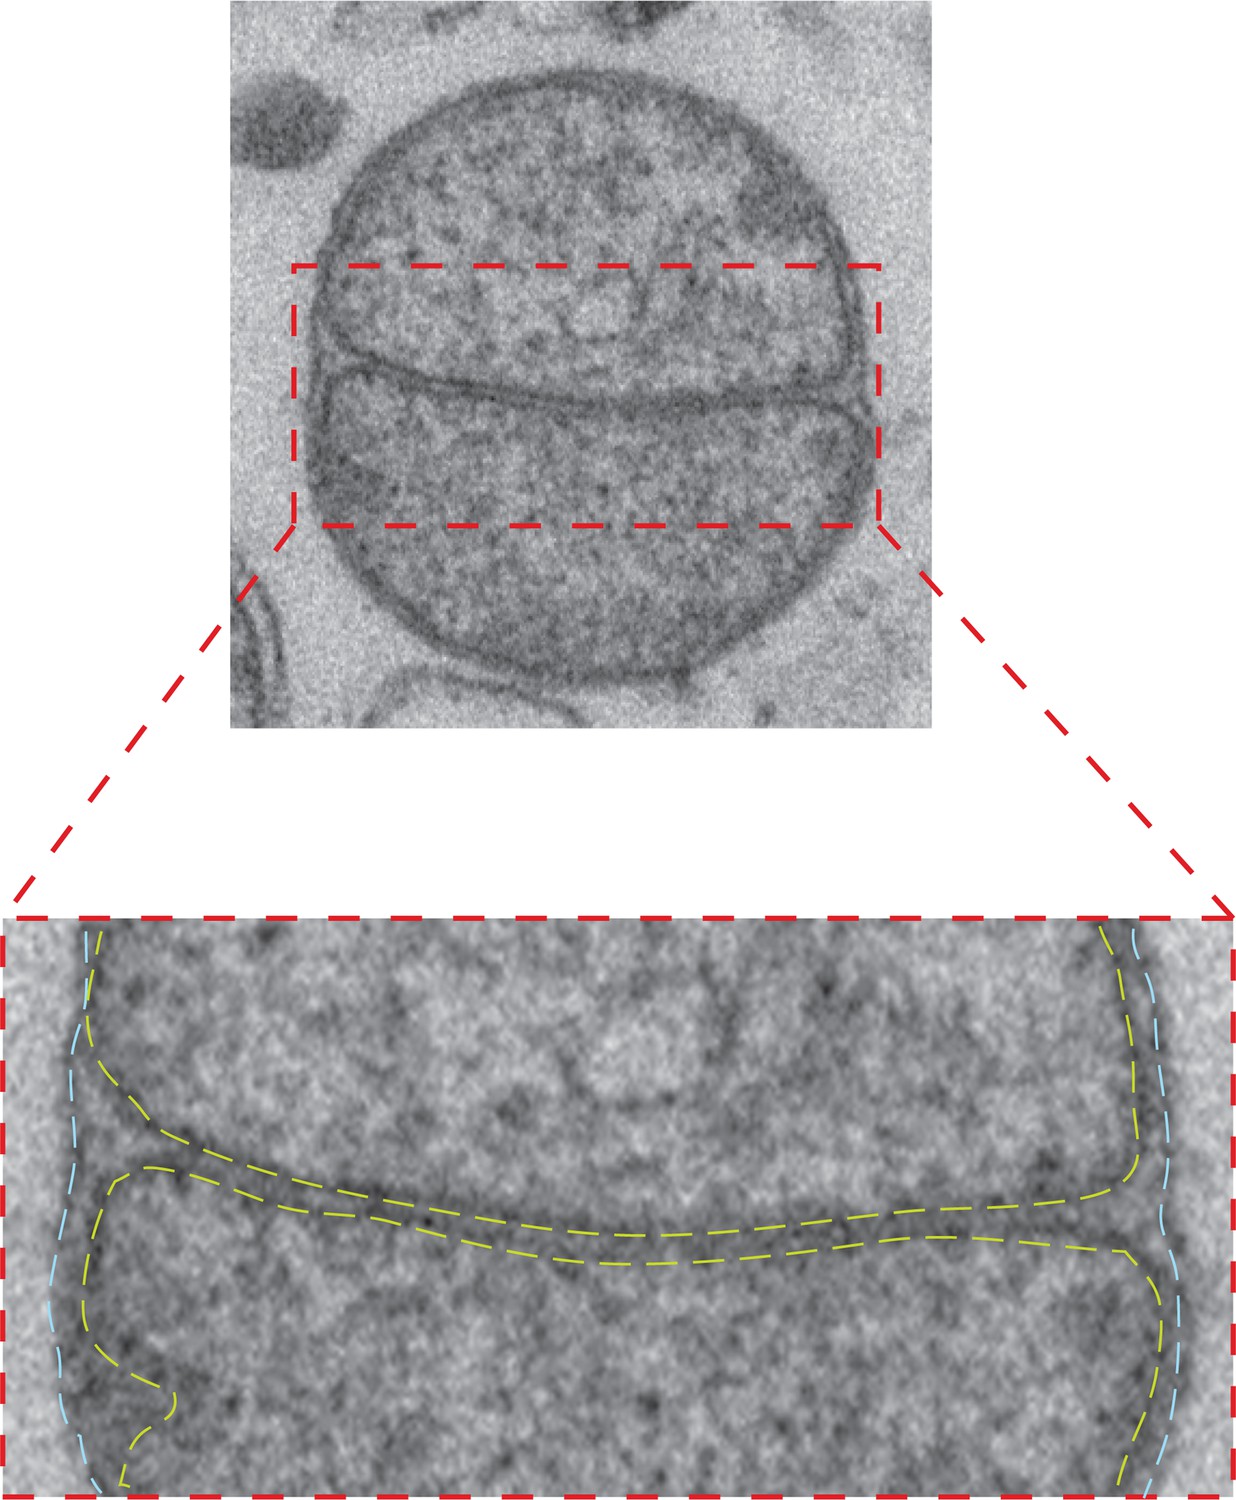
Intermediate with fully fused outer membrane.
Top: TEM micrograph of an intermediate with completely fused outer membrane, obtained by in vitro outer membrane fusion of mitochondria isolated from wild-type cells. Lower panel: Zoom of the contact region shows the apposition of inner membranes (yellow dashed lines) and continuous fused outer membrane (blue dashed lines).
Figure 6—figure supplement 2
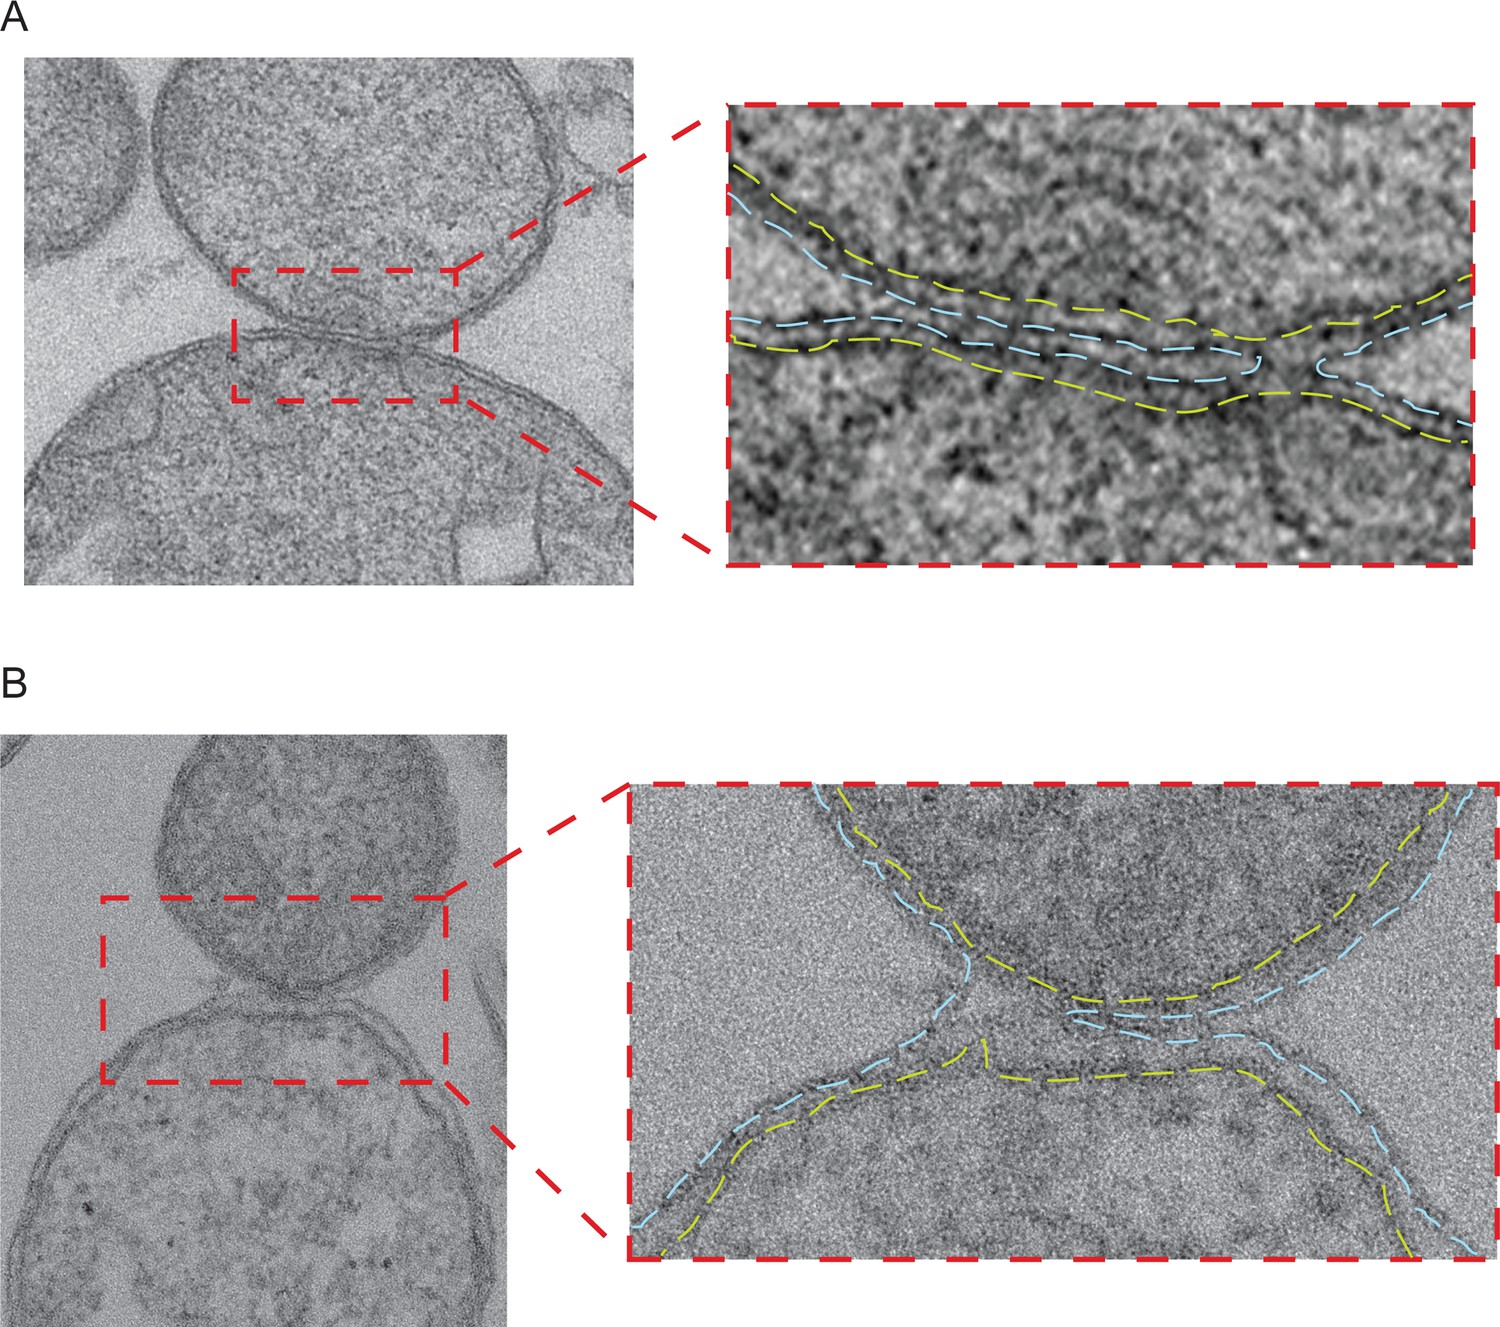
Intermediates with partially fused outer membranes.
(A and B) Left: Electron micrograph of two pairs of attached mitochondria with partially fused outer membranes in stained thin plastic sections of wild-type mitochondria obtained as for Figure 6—figure supplement 1. Right panels: Zoom of the contact region shows the continuous inner membranes (yellow dashed lines) and the cross section through the toroid pore opening at the right (A) or the left (B) edge of the contact region of outer membranes (blue dashed lines).
Figure 7 with 2 supplements
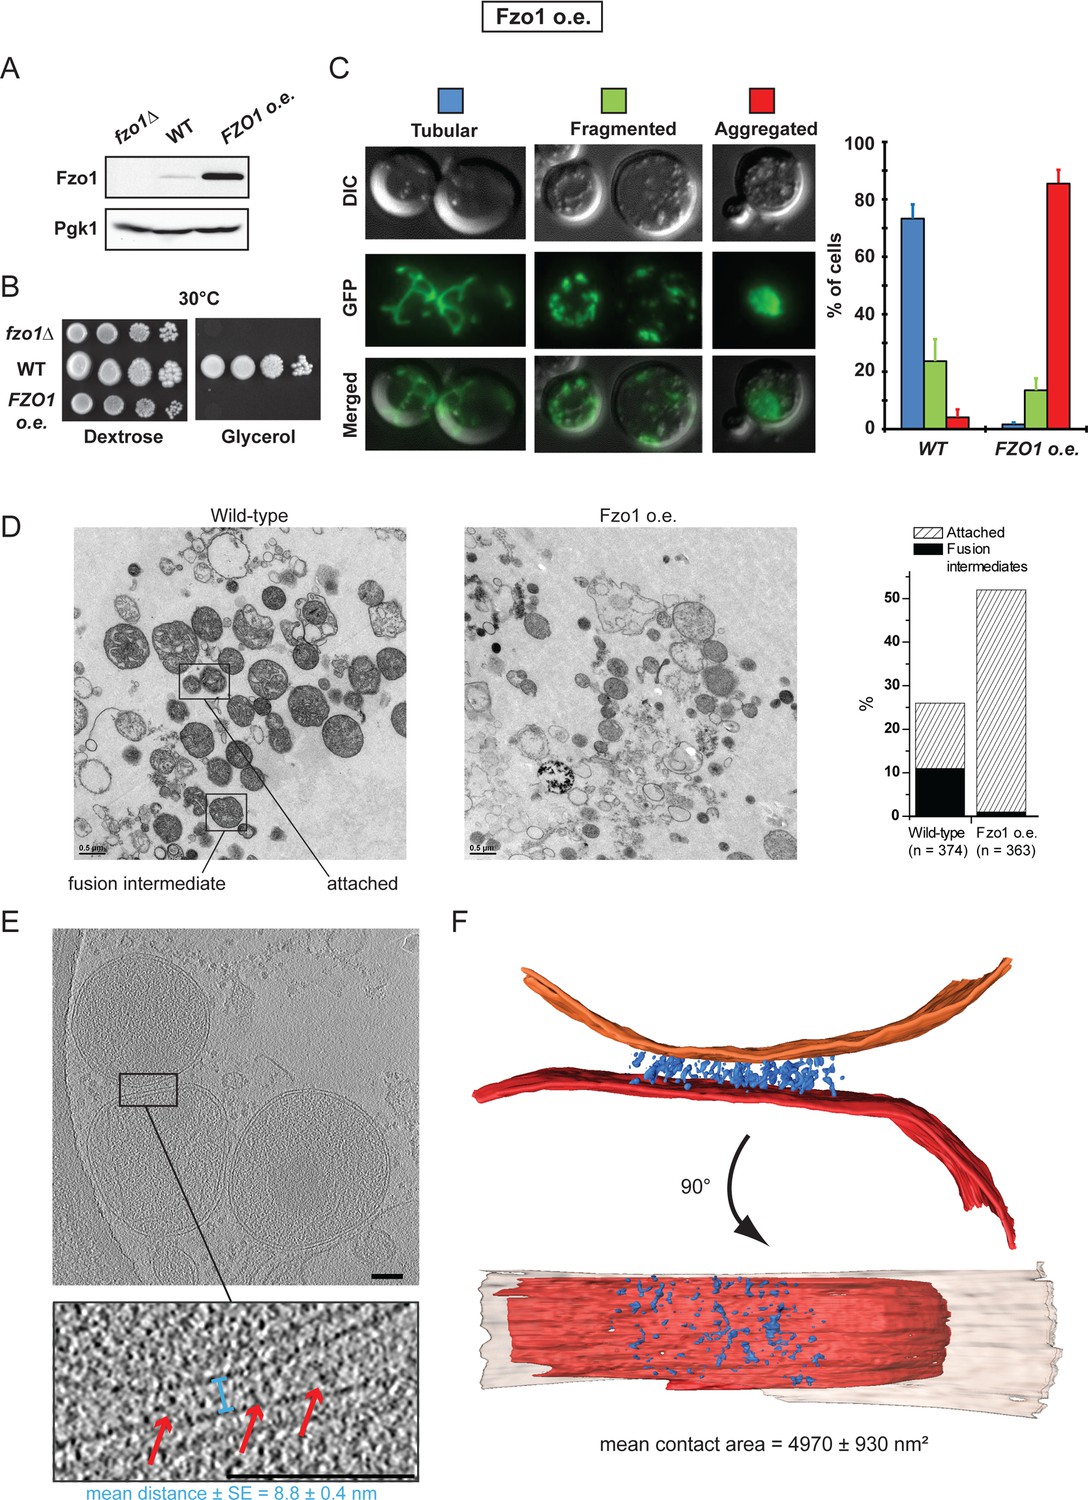
Overexpression of Fzo1.
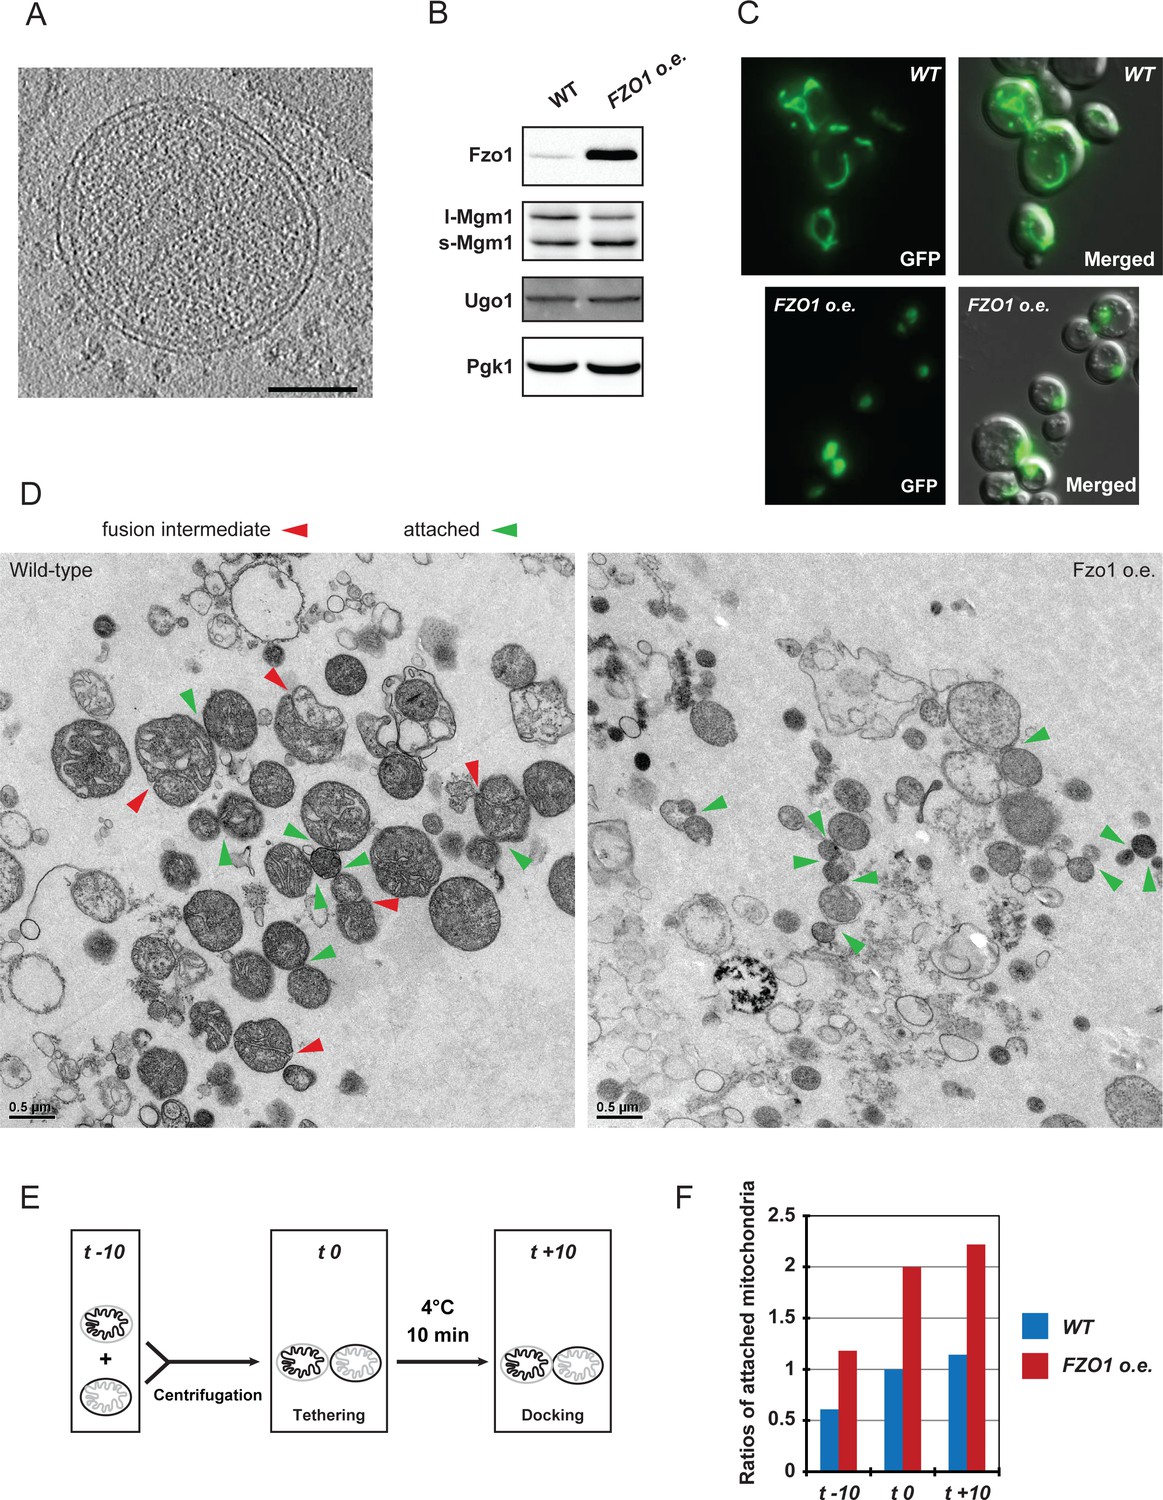
(A) Total protein extracts of fzo1Δ cells transformed with an empty vector (fzo1Δ), pRS314-FZO1 (WT) or pRS414-TEF-FZO1 (FZO1 o.e.) were analyzed by anti-Fzo1 and anti-Pgk1 immunoblotting. Fzo1 is overexpressed about 50 fold in FZO1 o.e. as compared to WT conditions. (B) Serial dilutions of cells from A grown in the presence of glucose or glycerol as the sole carbon source at 30°C. Lack or overexpression of Fzo1 both abolishes respiration and, therefore, growth on glycerol, consistent with inhibition of mitochondrial fusion. (C) Mitochondrial morphology in WT and FZO1 o.e. cells. Left: Representative morphologies. Right: Percentage of WT and FZO1 o.e. cells with indicated mitochondrial morphologies. Error bars represent the s.d. from three independent experiments. (D) Left: TEM analysis of in vitro outer membrane fusion reactions performed with mitochondria isolated from wild-type cells or cells overexpressing Fzo1. Note that mitochondria from Fzo1 o.e. cells are smaller than from wild-type cells. Right: Effect of Fzo1 overexpression on outer membrane fusion and attachment in vitro. (E) Slices through tomographic volume of mitochondrial attached intermediates upon Fzo1 overexpression (abortive, 74%, see Table 1); outer membrane distance (blue bracket) and densities between outer membranes (red arrows) are indicated. (F) 3D rendering of two closely apposed mitochondria shown in E.
Figure 7—figure supplement 1
Absence or accumulation of Fzo1.
(A) Tomographic slice of in vitro attachment reactions with mitochondria isolated from fzo1△ cells; scale bar 100 nm. (B) Levels of Ugo1 and Mgm1 in whole-cell extracts prepared from wildtype or Fzo1-overexpressing cells. Ugo1 levels did not vary, which is consistent with an imbalance with mitofusins upon Fzo1 overexpression. Note that the ratio between long and short forms of Mgm1 was slightly shifted toward the short form in cells overexpressing Fzo1. This may contribute to the changes in cristae morphology upon Fzo1 overexpression as seen in the electron micrographs shown in (D). (C) Mitochondrial morphology in representative WT and FZO1 o.e. cells. (D) Electron micrographs from Figure 7D at higher resolution. Fusion intermediates (fused outer membranes, separated inner membranes) and attached intermediates (attached outer membranes) are indicated by red and green arrowheads, respectively. (E-F) in vitro mitochondrial attachment upon Fzo1 overexpression. (E) Method summary: Mitochondria isolated from cells expressing either mito-GFP or mito-mCherry were mixed in equal amounts and processed for in vitro attachment reactions before analysis by fluorescence microscopy. Attached mitochondria (red-red; green-green; green-red) were counted in reactions stopped before centrifugation (t −10), after centrifugation (t 0) or after 10 min incubation on ice (t +10). (F) Ratios of attached mitochondria from wild-type (WT, blue) or Fzo1 overexpressing (FZO1 o.e., red) cells at t −10, t 0 and t +10. Ratios were normalized to the WT attachment at t 0. Mitochondria from Fzo1-overexpressing mitochondria were attached twice as frequently than mitochondria from wild-type cells at all time points, both after and before centrifugation (t −10). With Fzo1 overexpression, centrifugation stimulated in vitro attachment by a factor of two, compared to wild-type (t 0). In contrast, incubation on ice (t +10) had a weak effect on attachment in both wild-type and Fzo1 overexpressing conditions (compare t +10 with t 0), consistent with the requirement of this step for the transition from tethering to docking rather than for de novo attachment in vitro.
Figure 7—figure supplement 2
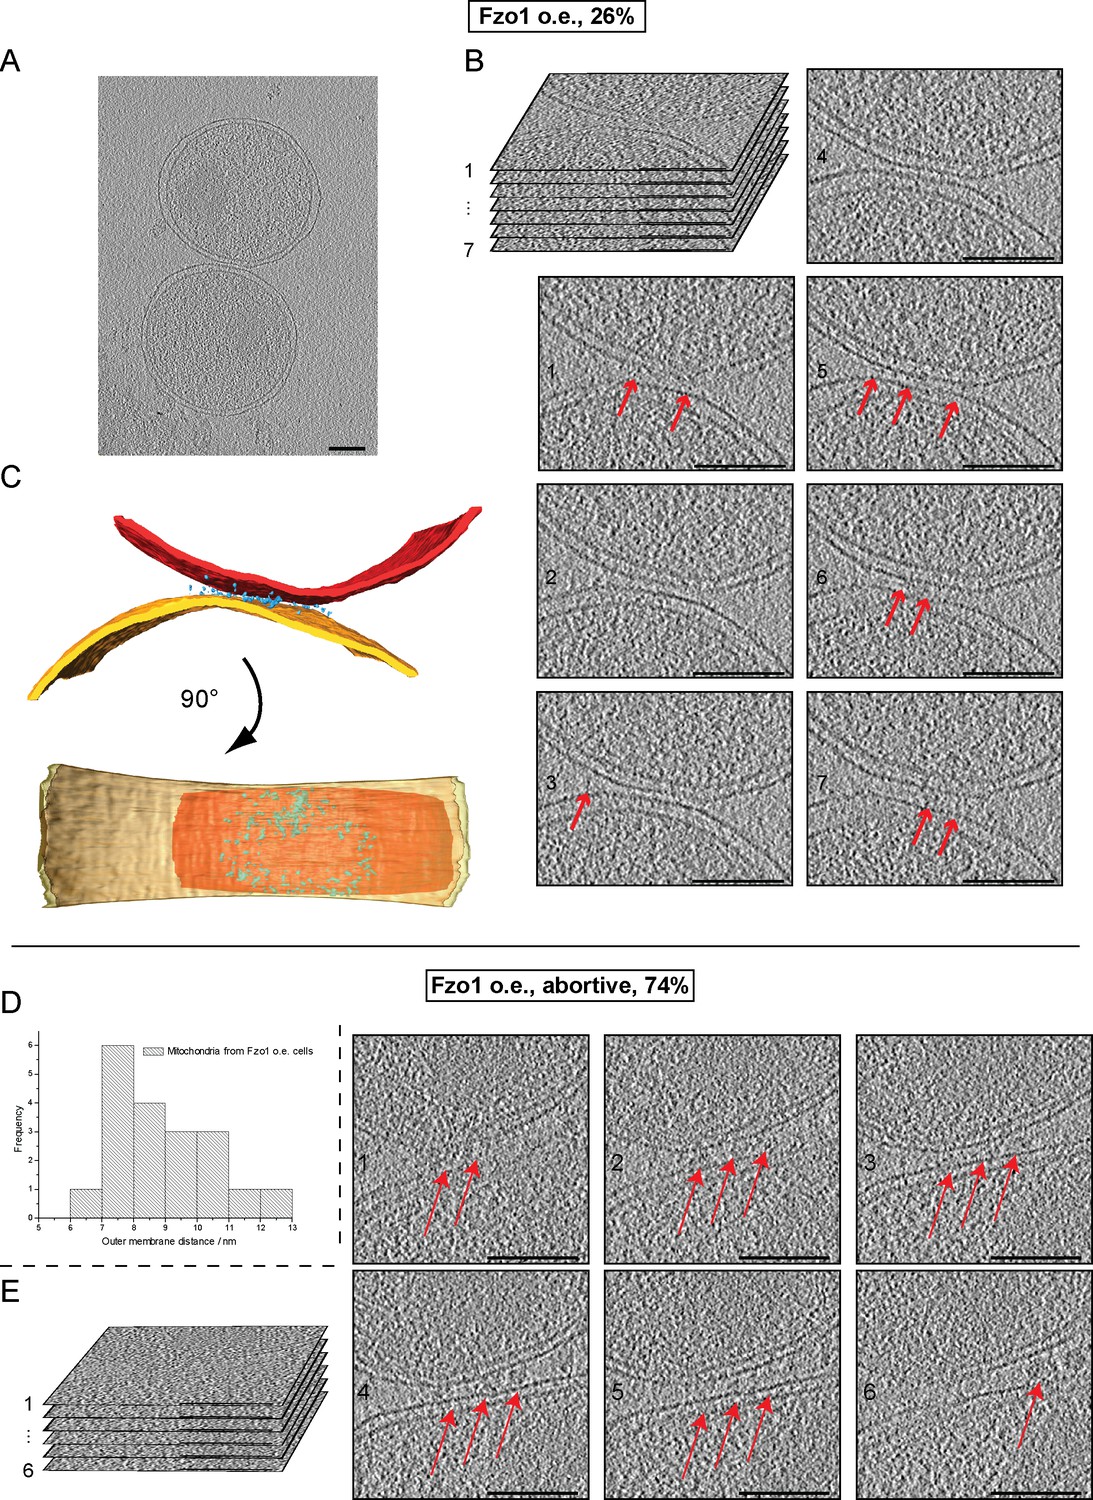
Cryo-ET of mitochondria from Fzo1-overexpressing cells.
(A–C) Minor population of attached intermediates (Other, 26%, see Table 1). (A) Slice through tomographic volume. (B) Stack representation of slices through tomographic volume with details of mitochondrial contacts. One out of 20 slices is shown. Red arrows, interstitial densities. All scale bars 100 nm. (C) 3D rendering of two closely apposed mitochondria. Rings of densities around the edge of contact areas are less extensive than in wild-type. (D–E) Cryo-ET of major population of attached intermediates (Abortive, 74%, see Table 1) (D) Histogram of closest outer membrane distances in attached mitochondria. (E) Slices through tomographic volume of the mitochondria shown in Figure 7F. One out of 20 slices is shown. Red arrows, interstitial density between outer membranes. All scale bars 100 nm.
Figure 8 with 1 supplement

Fzo1 enrichment at mitochondrial junctions.
(A) Cryo-ET of tethered mitochondria. Slices through tomographic volumes and zooms on contact regions (red and blue boxes); Outer membranes on zooms are delimited by red bars; scale bars 10 nm. (B) Scheme representing the central density (yellow circle) and extensions (blue lines) to outer membranes (red bars) for densities detected at the junction of tethered intermediates. (C–E) Q-Dot labelling of FZO1 and FZO1-AVI mitochondria. (C) Control with non-labelled Fzo1. Tomographic slice and zoom with Q-Dots on the outer membrane. (D) Q-Dots per contact area (left) or on mitochondrial surface excluding the contact area (right) for FZO1 (white) and FZO1-Avi (black). (E) Slices through tomographic volumes of Fzo1-Avi mitochondria labelled with Q-Dots (yellow arrows). Zooms are indicated by dashed red boxes. Scale bars 100 nm.
Figure 8—figure supplement 1
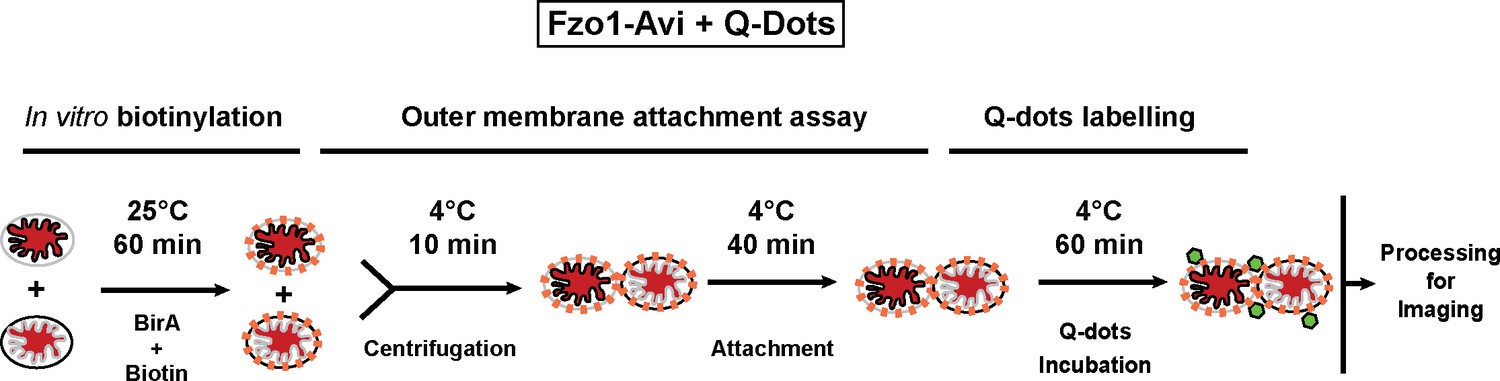
Biotinylation and Q-Dot labelling of Fzo1-Avi.
In vitro biotinylation (orange dots) and Q-Dot labelling (green hexagons) for outer membrane attachment assays with mitochondria containing mito-mCherry (red matrix).
Figure 9
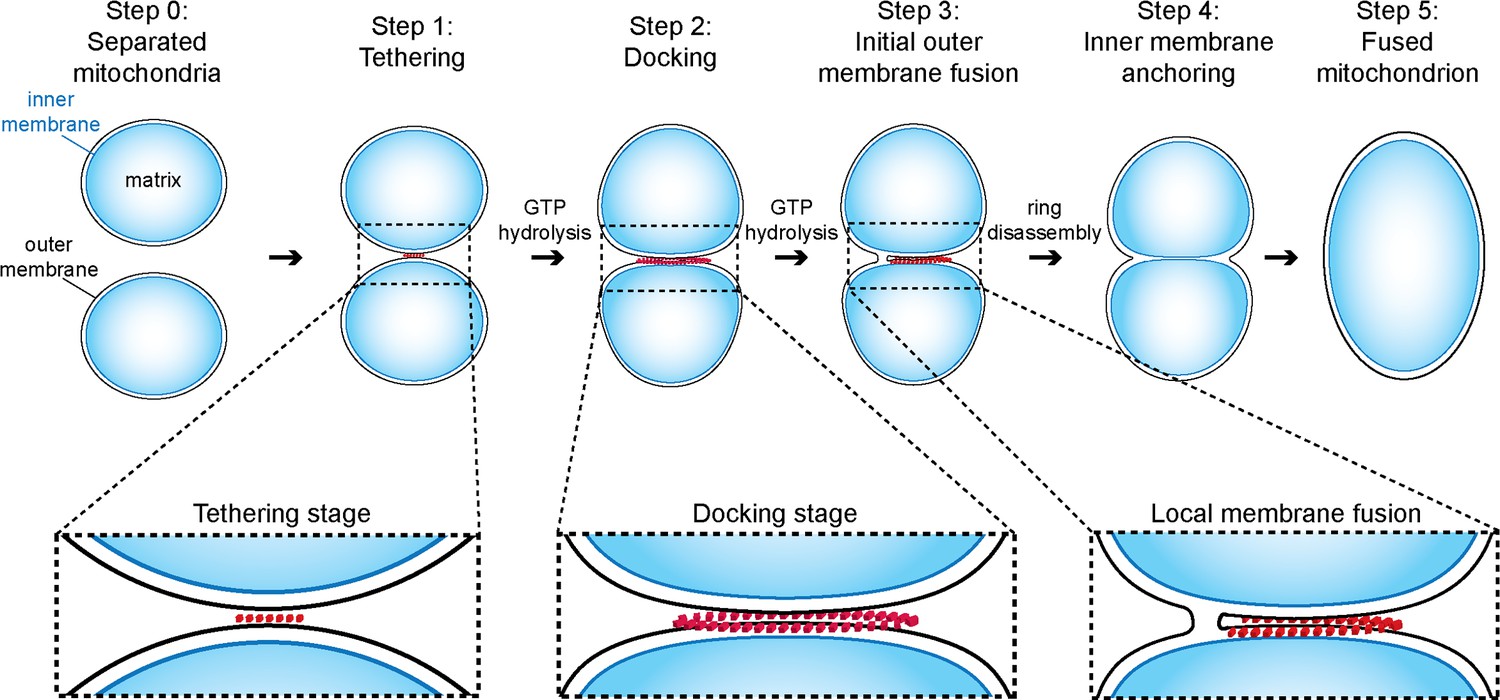
Model of outer membrane tethering, docking and fusion.
Mitochondria (blue) are tethered or docked by protein complexes (red).
Videos
Video 1
3D rendering of docked mitochondria as shown in Figure 2.
Outer membranes in red and orange, distinct density in blue.
Video 2
3D rendering of tethered mitochondria upon addition of GMP-PNP as shown in Figure 4.
Outer membranes in red and orange, distinct density in blue.
Video 3
3D Rendering of tethered intermediate upon addition of GMP-PNP after two minutes, as shown in Figure 5—figure supplement 1.
Outer membranes in red and orange, distinct density in blue.
Video 4
3D rendering of partially fused mitochondria as shown in Figure 6.
Outer membranes in red, distinct density in blue.
Tables
Table 1
Characteristics of mitochondrial attachment intermediates identified in this study. Abbreviations: o.e. overexpression, i.a. inter alia.
| Condition (n) | Contact type (n) | % | Densities organization | Distance ± SE / nm | Contact area ± SE / nm² |
|---|---|---|---|---|---|
| Wild-Type (52) | Docked (41) | 79 | Docking ring | 2.1 ± 0.1 | 22600 ± 3100 |
| Tethered (11) | 21 | Interstitial/Few | 6.7 ± 0.5 | 6900 ± 1700 | |
| Wild-Type + GMP-PNP (22) | Tethered (19) | 86 | Interstitial/Few | 6.3 ± 0.2 | 10100 ± 1300 |
| Other (3) | 14 | i.a. Docking ring | 2.6 ± 0.3 | 11600 ± 3900 | |
| Fzo1 O.E. (19) | Abortive (14) | 74 | Interstitial/Numerous | 8.8 ± 0.4 | 5000 ± 900 |
| Other (5) | 26 | Docking ring | 2.5 ± 0.4 | 4200 ± 1200 |
Additional files
-
Supplementary file 1
Table of strains and table of plasmids used in the study.
- https://doi.org/10.7554/eLife.14618.026
Download links
A two-part list of links to download the article, or parts of the article, in various formats.
Downloads (link to download the article as PDF)
Open citations (links to open the citations from this article in various online reference manager services)
Cite this article (links to download the citations from this article in formats compatible with various reference manager tools)
A mitofusin-dependent docking ring complex triggers mitochondrial fusion in vitro
eLife 5:e14618.
https://doi.org/10.7554/eLife.14618


