Small-molecule inhibitors identify the RAD52-ssDNA interaction as critical for recovery from replication stress and for survival of BRCA2 deficient cells
- University of Iowa, United States
- Istituto Superiore di Sanita, Italy
- Carver College of Medicine, University of Iowa, United States
Figures
Figure 1
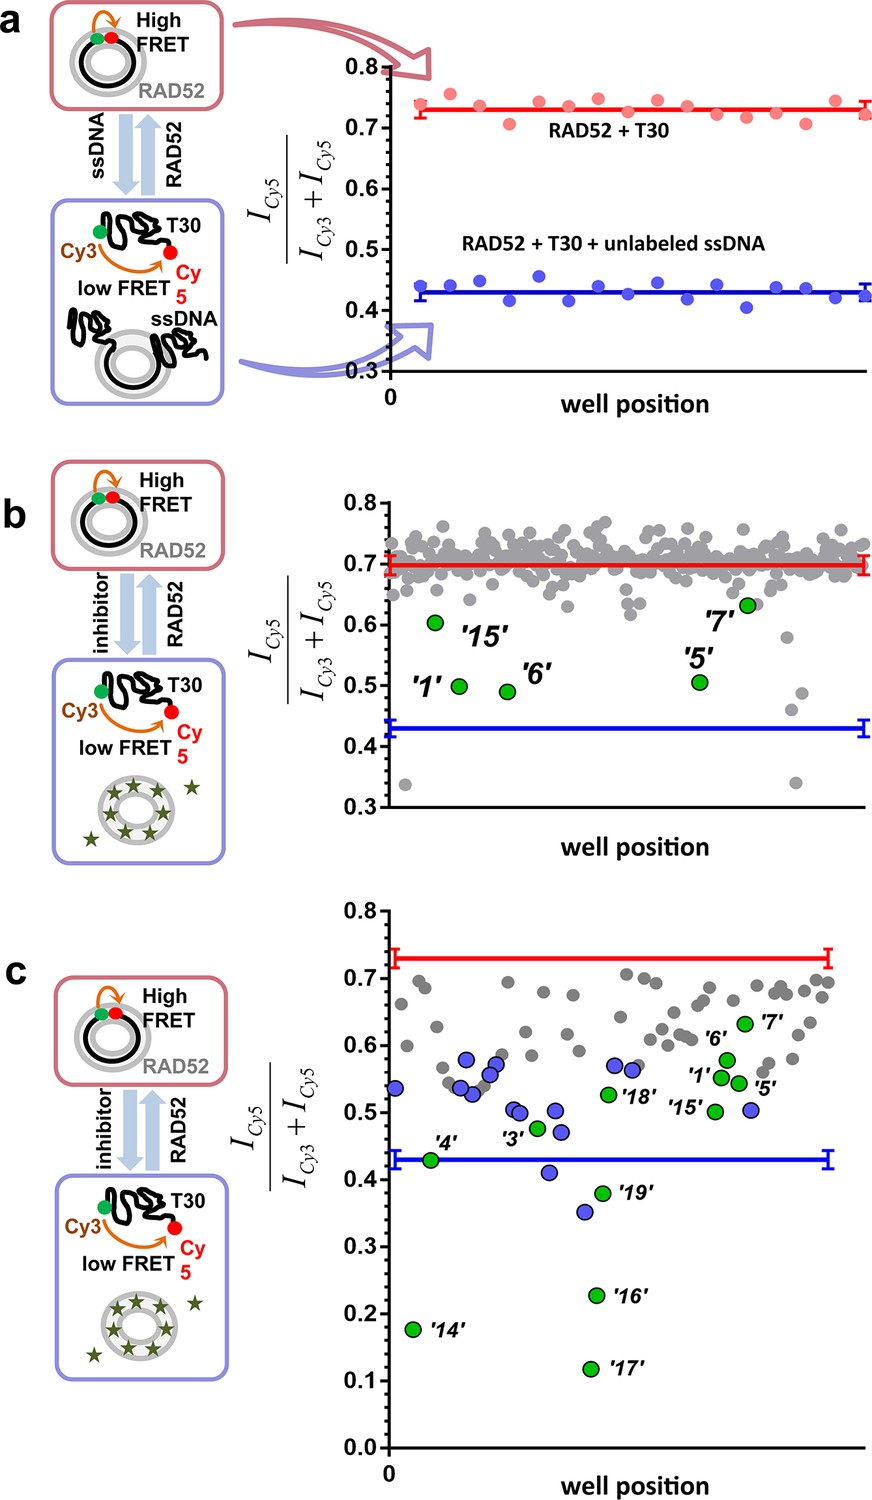
High throughput screening of the MicroSource SPECTRUM collection identifies 12 compounds that inhibit the RAD52-ssDNA interaction.
(a) Control lanes from a 384 well: 16 negative control wells contain stoichiometric RAD52- Cy3-dT30-Cy5 complexes (red filled circles), while 16 positive control wells contain a stoichiometric RAD52- Cy3-dT30-Cy5 complex challenged with unlabeled polydT100 (blue filled circles). Red and blue lines with error bars at the ends indicate the average and the standard deviation for the negative and positive controls, respectively. Z’ factor of 0.94 was calculated for these control lanes, indicating excellent reliability of the assay. (b) A representative 384 well plate from the HTS screen highlighting ‘1’, ‘5’, ‘6’, ‘7’, and ‘15’. Red and blue lines with error bars at the ends indicate the average and the standard deviation for the negative and positive controls, respectively. (c) Average of cherry-picked rescreening of compounds identified from screening all plates in the MicroSource SPECTRUM collection highlighting all 12 identified hits (green filled circles) along with a number of false positive compounds (blue filled circles) that either showed poor reproducibility in subsequent rescreening or a linear dependence of the signal on the compound concentration. Red and blue lines with error bars at the ends indicate the average and the standard deviation for the negative and positive controls, respectively.
Figure 2 with 4 supplements
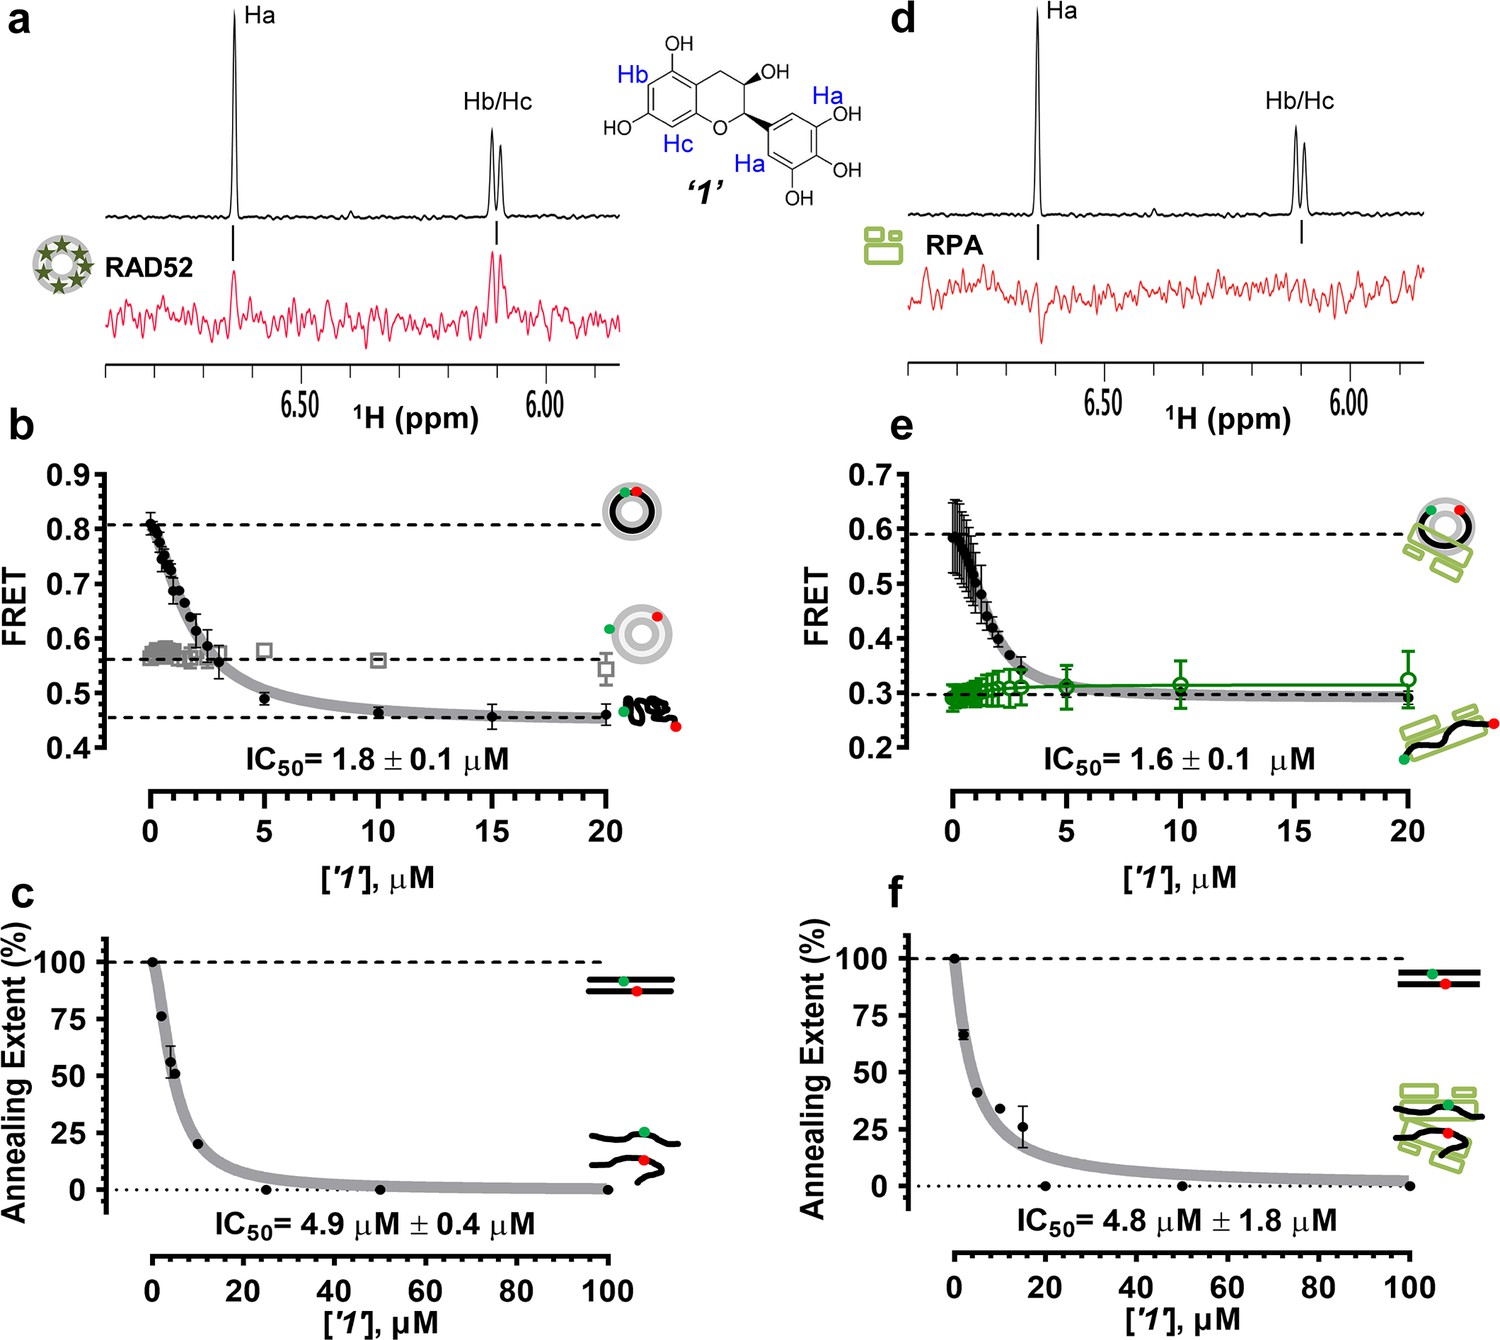
Biochemical characterization of ‘1’.
(a) Aromatic region of the 1D 1H NMR spectrum of compound ‘1’ alone (black) and the WaterLOGSY spectrum of 20 μM compound ‘1’ in the presence of 3.3 μM RAD52 (red). The nonexchangeable proton peaks are labeled using atom names as indicated on the structure of compound ‘1’. (b) IC50 values for inhibition of ssDNA binding and wrapping were determined using FRET-based assays that follow the change in geometry of a Cy3-dT30-Cy5 substrate (black circles). The computed IC50 value is shown below the curve. Titration of the RAD52-dsDNA with ‘1’ (grey boxes) shows no perturbation of the dsDNA binding. (c) IC50 values for inhibition of RAD52-mediated ssDNA annealing were determined by fitting the dependence of the extent of oligonucleotide-based annealing reaction carried in the presence of increasing concentration of ‘1’. (d) Aromatic region of the 1D 1H NMR spectrum of compound ‘1’ alone (black) and the WaterLOGSY spectrum of 20 μM compound ‘1’ in the presence of 3.3 μM RPA (red). (e) Titration of the RAD52-RPA- Cy3-dT30-Cy5 complex with ‘1’ (black circles). The computed IC50 value is shown below the curve. Green squares show titration of the RPA- Cy3-dT30-Cy5 complex with ‘1’. (f) IC50 values for inhibition of RAD52-mediated annealing of the RPA-coated ssDNA were determined by fitting the dependence of the extent of the annealing reaction carried out in the presence of increasing concentration of ‘1’.
Figure 2—figure supplement 1

Stoichiometric complexes of RAD52 with ssDNA, RPA-coated ssDNA and dsDNA yield characteristic FRET values.
(a) FRET measurements were performed by titrating RAD52 protein into a solution containing 1 nM Cy3-dT30-Cy5 ssDNA. The Cy3 fluorescence was excited directly and the emissions of Cy3 and Cy5 dyes were measured, and the respective FRET values calculated as described in the Materials and methods. The highest separation in the FRET signal of unbound ssDNA and the RAD52-ssDNA complex was achieved around 8 nM RAD52. At this concentration, one RAD52 heptameric ring binds and wraps the ssDNA oligonucleotide bringing the Cy3 and Cy5 dyes close to one another. The details and control experiments for these measurements can be found in (Grimme et al., 2010; Grimme and Spies, 2011). Each data point represents the average and standard deviation for at least three independent titrations. (b) The titrations were performed similarly to those shown in a, except 1 nM RPA was added to a solution containing 1 nM Cy3-dT30-Cy5 ssDNA prior to titration of RAD52. Under our experimental conditions, RPA forms stoichiometric complexes with the 30-mer DNA oligonucleotide with 1 RPA coating 1 molcule of ssDNA. The data points and error bars represent averages and standard deviation for three or more independent titrations. (c) The titrations were performed similarly to those shown in a, except 1 nM dsDNA (Cy3-Oligo28-Cy5 annealed to Oligo28-REV) was used as a substrate. Stoichiometric complexes are achieved at 10 nM RAD52. The data points and error bars represent averages and standard deviation for three or more independent titrations.
Figure 2—figure supplement 2
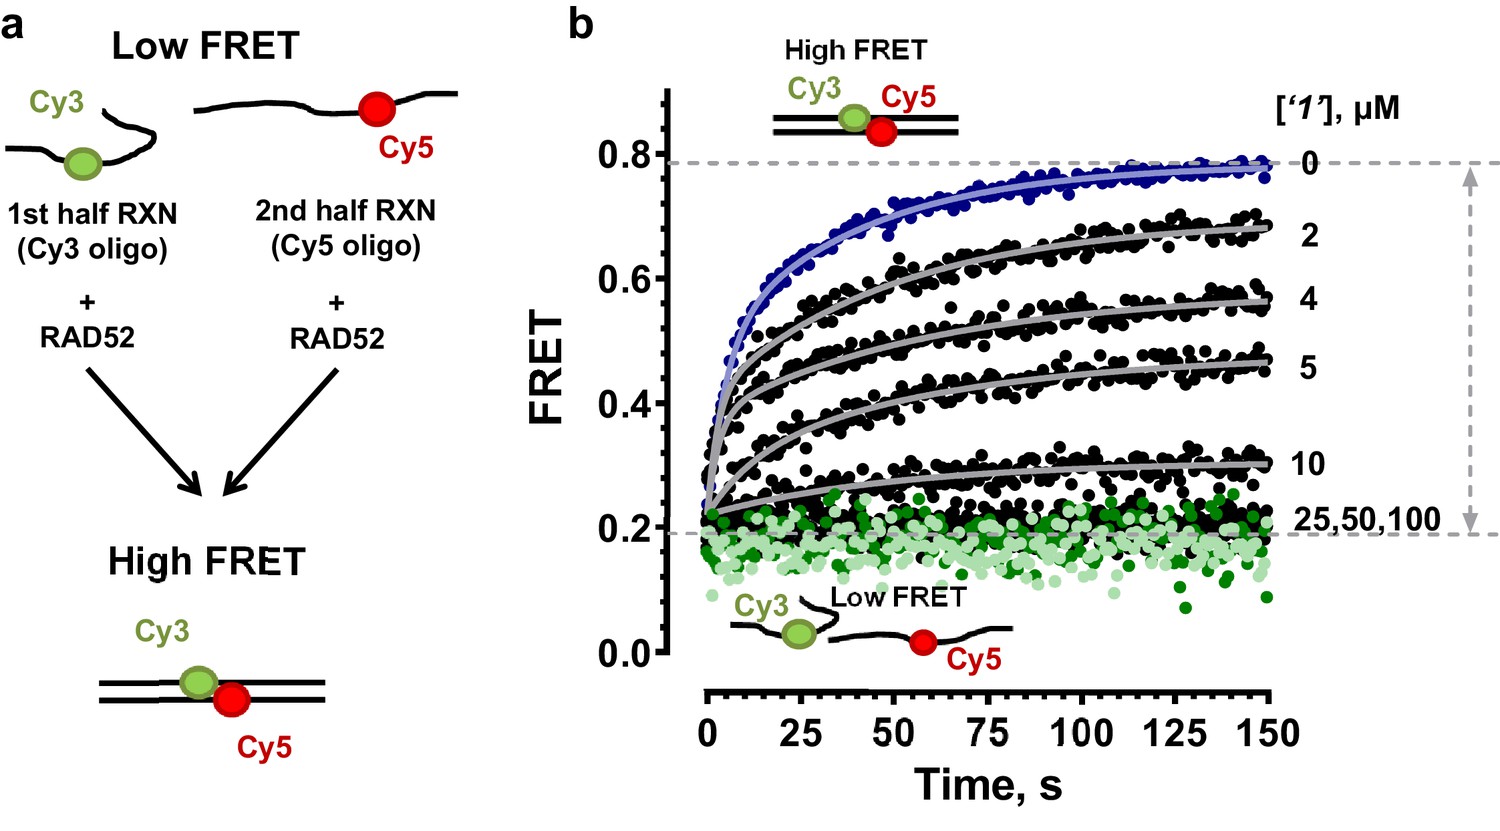
RAD52 FRET based ssDNA annealing assay in the presence of small molecules.
(a) Schematic of the FRET based annealing reaction. In two half-reactions, stoichiometric amounts of RAD52 were incubated with Target28Cy3 and Probe28Cy5 oligonucleotides, respectively. Upon mixing of the two half-reactions, RAD52 facilitated annealing of the two complementary oligonucleotides, which can be observed as an increase in FRET between Cy3 and Cy5 dyes. (b) Annealing reactions performed in the absence (blue) or presence of increasing concentrations of ‘1’. The average of three or more independent annealing reactions is shown for each curve. Grey continuous lines show fits to double exponentials. Light green circles correspond to the DNA only reaction; dark green circles represent the annealing reaction containing the DNA and 100 µM ‘1’.
Figure 2—figure supplement 3
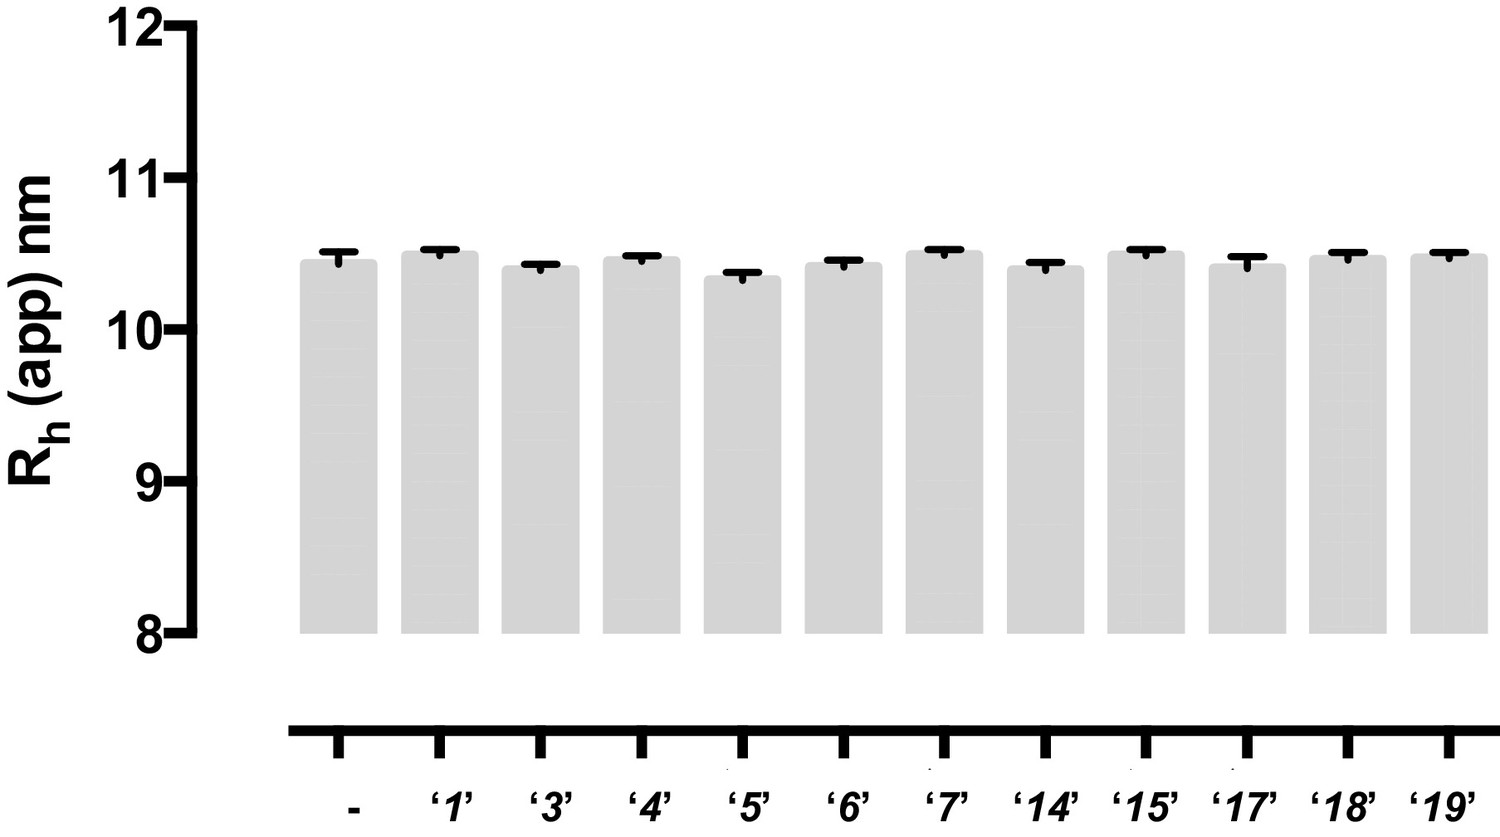
None of the tested compounds affect the oligomeric state of RAD52 protein.
A possible effect of the identified compounds on the oligomeric state of RAD52 protein was probed in the dynamic light scattering experiments, which measured the average hydrodynamic radius of RAD52 (15.8 μM) alone or in the presence of equimolar concentrations of each compound. Measurements were recorded at 25°C in buffer containing 50 mM Tris-HCl pH7.5, 200 mM KCl, 1 mM DTT, and 0.5 mM EDTA. A total of 10 measurements with 10 accumulations were collected, had monomodal distributions, and sum of squares (SOS) values of ≤ 0.65. Measurements were recorded with a DynaPro NanoStar (Wyatt Tech. Corp.) and the hydrodynamic radius were calculated by the DYNAMICS software.
Figure 2—figure supplement 4
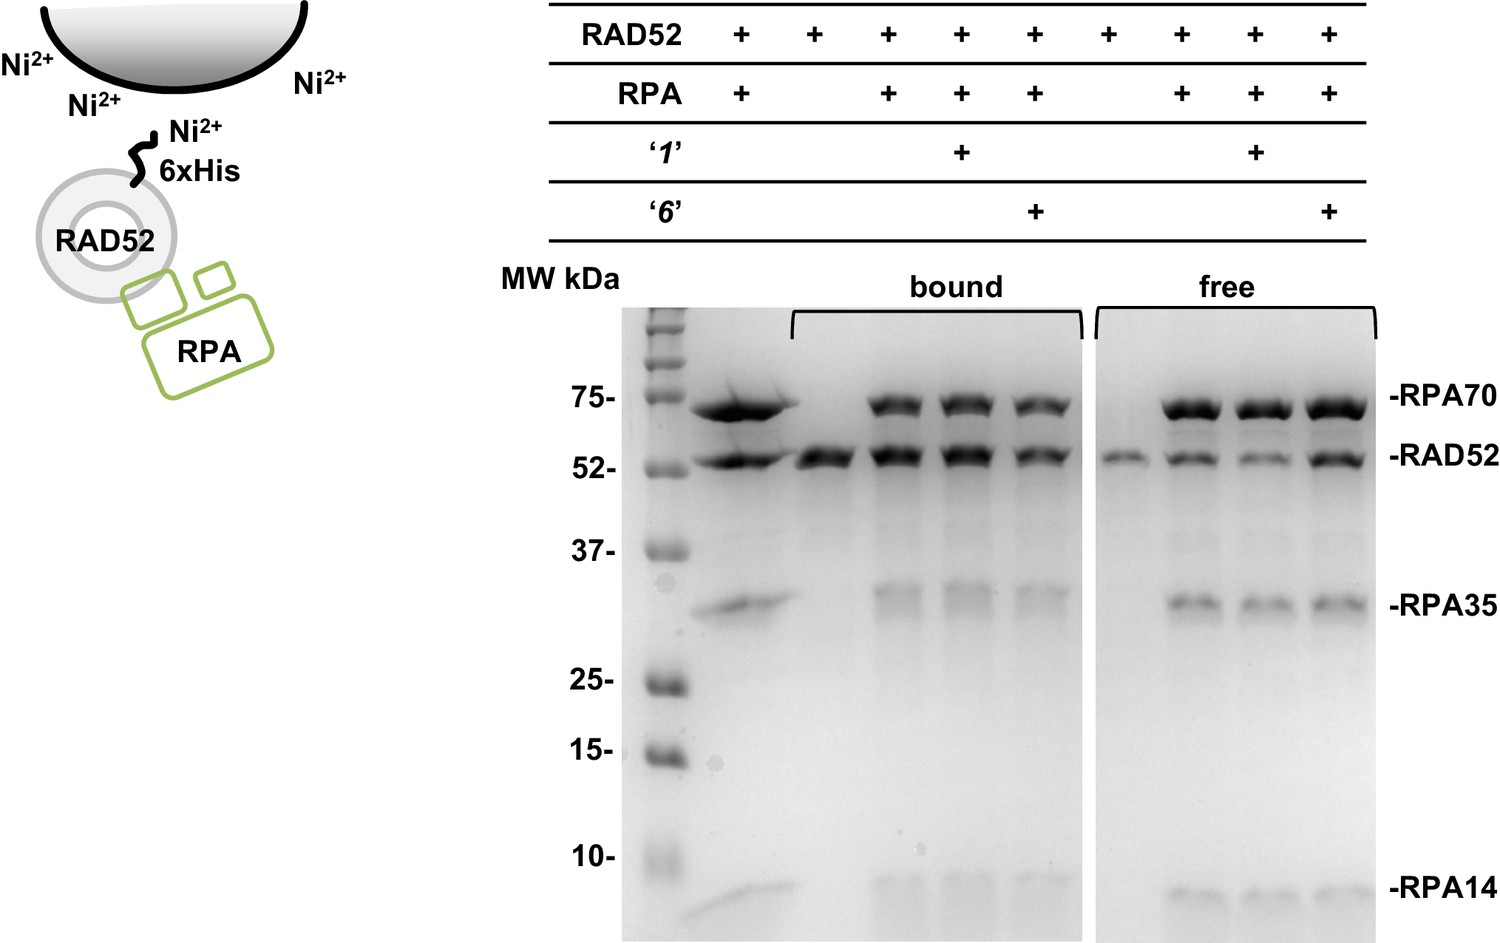
Compounds ‘1’ and ‘6’ have no effect on the interaction between RAD52 and RPA proteins.
Ni-NTA Agarose (15 uL buffer equilibrated bead slurry) was incubated with 3 μM RAD52, 3 μM RPA in the presence or absence of 3 μM ‘1’ or ‘6’, in the binding buffer (30 mM Tris-Acetate pH7.5, 1 mM βME, 150 mM KCl, 30 mM Imidazole, 5% glycerol, and 0.2% Nonidet P40 substitute). After 30 min incubation on a neutator at 4°C samples were spun down, and the aliquots of unbound ('free') proteins from each reaction were saved. Then the beads were washed and the bound proteins were eluted with 20 uL elution buffer (the same as the binding buffer, but with 400 mM Imidazole) and saved for gel electrophoresis. Free proteins and proteins co-eluted from the beads ('bound') were separated on the 12% SDS PAGE gel. Lane 1 is a loading control, which shows RAD52 and the three subunits of RPA (RPA70, RPA35, and RPA14). The proteins and the compounds present in each reaction are indicated in the table above the gel. The carton on the left of the gel schematically depicts the experiment: RAD52 protein binds to the Ni-NTA beads through the interaction with its 6xHis tag; RPA is untagged and can be retained on the beads only through a specific interaction with RAD52 (Grimme et al., 2010). The experiment was repeated three times (a representative gel is shown) and no change in the ratio of RAD52 and RPA co-eluted from the beads in the presence and absence of ‘1’ or ‘6’ was detected.
Figure 3
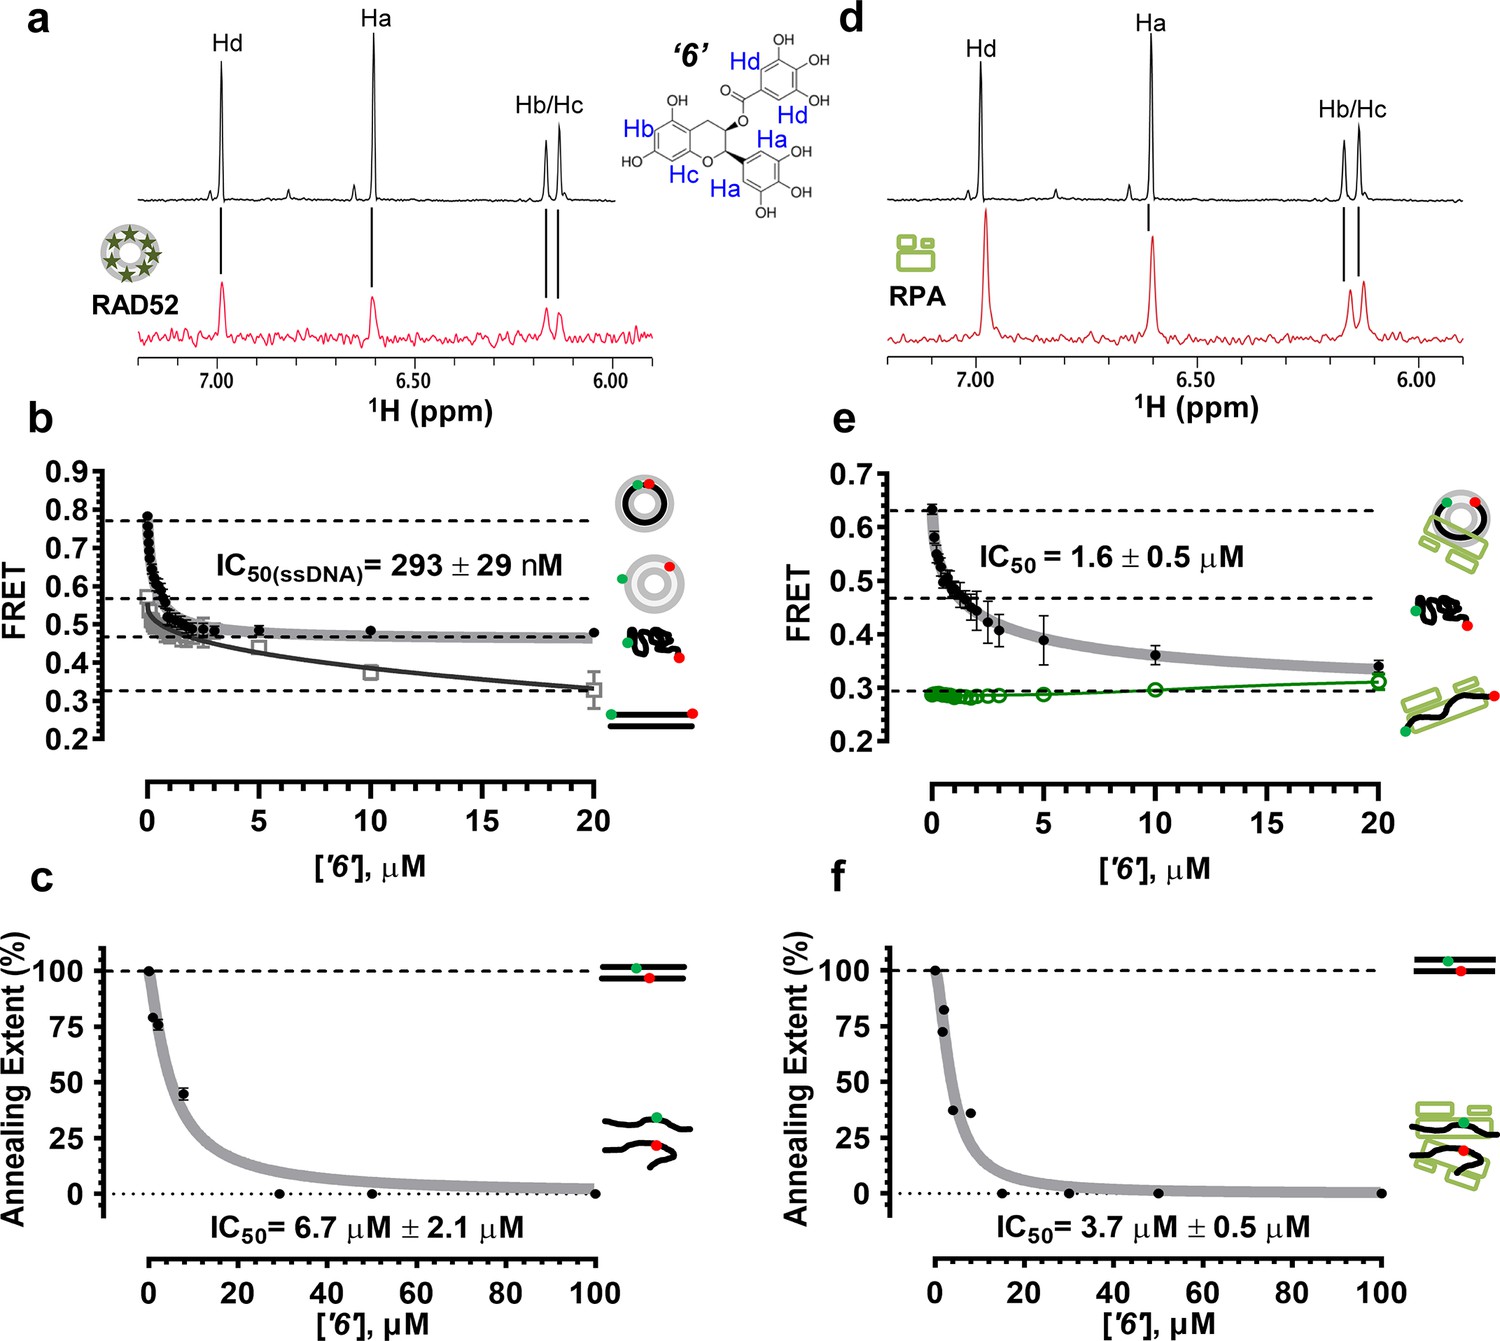
Biochemical characterization of ‘6’.
(a) Aromatic region of the 1D 1H NMR spectrum of compound ‘6’ alone (black) and the WaterLOGSY spectrum of 40 μM compound ‘6’ in the presence of 3.3 μM RAD52 (red). The nonexchangeable proton peaks are labeled using atom names as indicated on the structure of compound ‘6’. (b) IC50 values for inhibition of ssDNA binding and wrapping were determined using FRET-based assays that follow the change in geometry of a Cy3-dT30-Cy5 substrate (black circles). The computed IC50 value is shown above the curve. Titration of the RAD52-dsDNA with ‘6’ (grey boxes) shows that this inhibitor also perturbs the RAD52-dsDNA interaction. (c) IC50 values for inhibition of RAD52-mediated ssDNA annealing were determined by fitting the dependence of the extent of oligonucleotide-based annealing reaction carried in the presence of increasing concentration of ‘6’. (d) Aromatic region of the 1D 1H NMR spectrum of compound ‘6’ alone (black) and the WaterLOGSY spectrum of 40 μM compound ‘6’ in the presence of 3.3 μM RPA (red). (e) Titration of the RAD52-RPA- Cy3-dT30-Cy5 complex with ‘6’ (black circles). The computed IC50 value is shown below the curve. Green squares show titration of the RPA- Cy3-dT30-Cy5 complex with ‘6’. (f) IC50 values for inhibition of RAD52-mediated annealing of the RPA-coated ssDNA were determined by fitting the dependence of the extent of the annealing reaction carried out in the presence of increasing concentration of ‘6’.
Figure 4

Virtual screening places the RAD52 inhibitors within the ssDNA binding groove.
(a) Three individual monomers of the RAD52-NTD undecameric ring (PDB 1KNO) are colored yellow, green and blue respectively. ‘1’ and ‘6’ occupy similar sites at the interface of two subunits. Two grey lines in each panel indicate the approximate boundaries of the ssDNA-binding groove. (b). MOE ligand maps highlight water mediated interactions as well as interactions with amino acids. ‘1’ likely mediates interactions through R55, V128, E140, and E145, as well as through water contacts made with G59, M56, and K141. ‘6’ likely binds via hydrogen bonding via D149 and I166 as well as through water interactions with E140, K144, and R153.
Figure 5 with 1 supplement
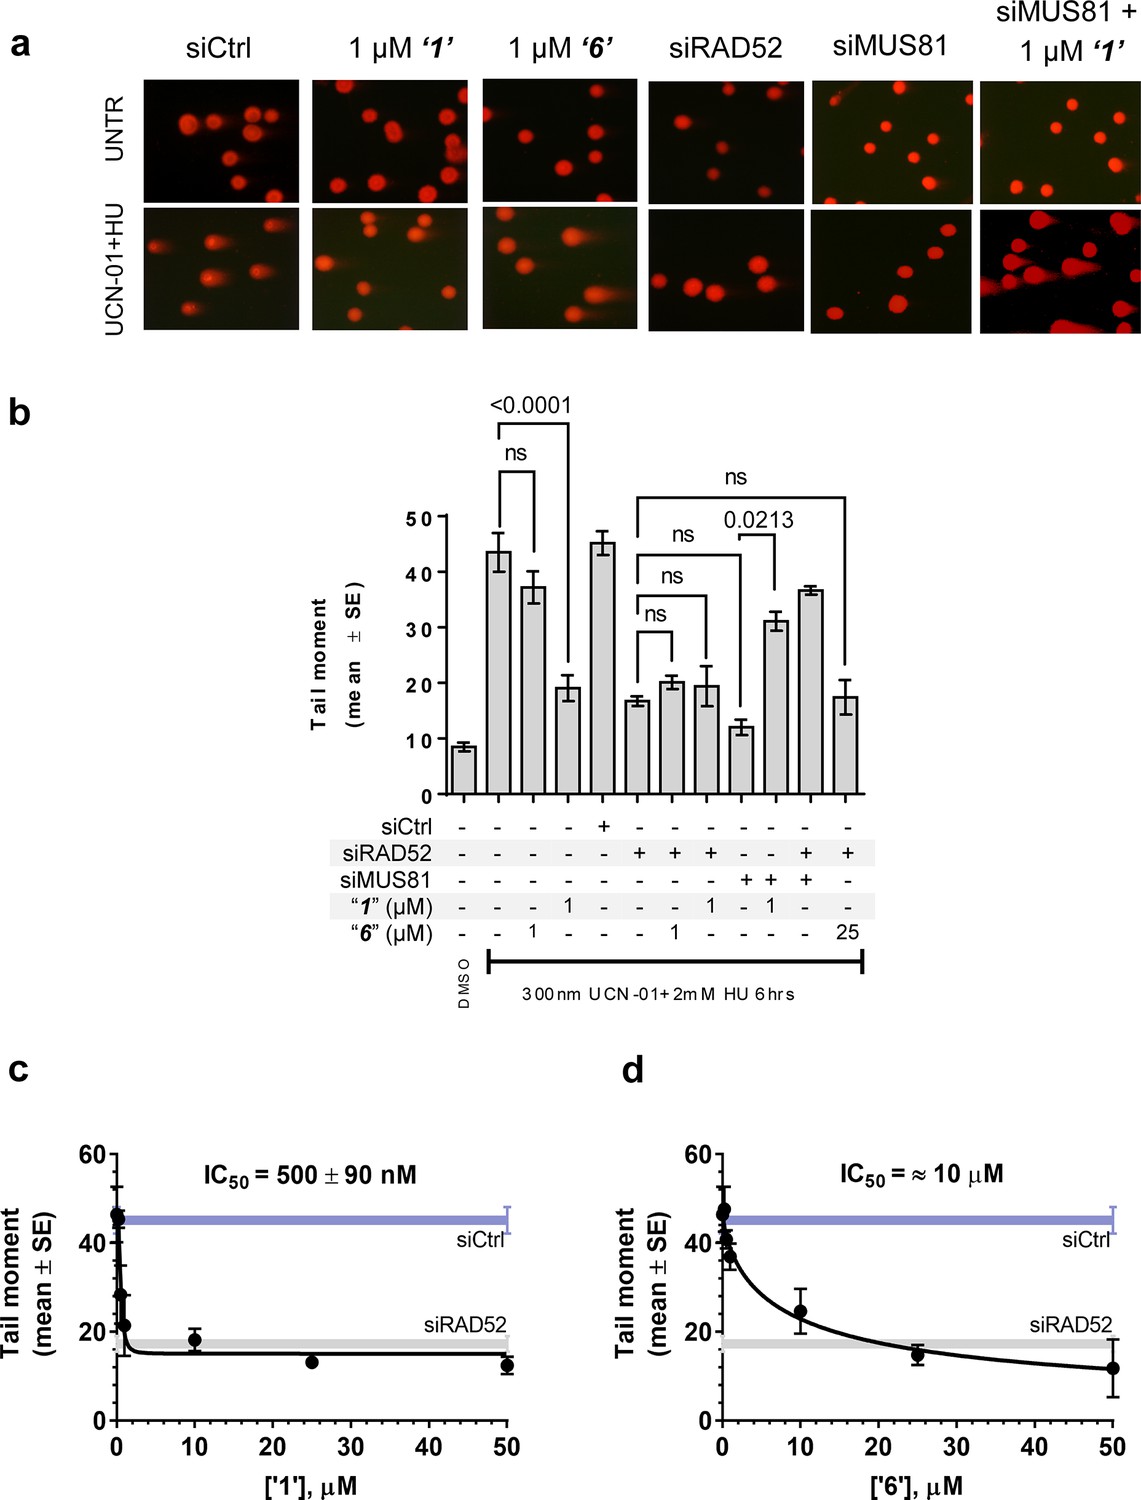
Inhibiting the RAD52-ssDNA interaction interferes with RAD52/MUS81-mediated DSB formation essential for replication fork recovery in check point deficient cells.
(a) Representative images showing fields of cells from the comet assay for untreated, as well as from UCN01 (300 nM) and HU (2 mM) treated cells in the presence and absence of ‘1’, ‘6’, and siRAD52. (b) ‘1’ and ‘6’ at 1 or 25 μM recapitulate RAD52 depletion. GM1604 cells, transfected or not with siRNAs against RAD52, were treated as indicated, in the presence or absence of the inhibitor. At the end of treatment, DSBs were analyzed by neutral comet assay. Data are presented as the mean ± SEM from two independent experiments; p values are shown in the graph when differences are statistically significant. (c–d) Inhibitors ‘1’ and ‘6’, respectively decrease the mean tail moment following HU treatment with IC50 values ranging from mid nanomolar to low micromolar. Cells were treated as in (b). Data are from three independent experiments.
Figure 5—figure supplement 1

Compound ‘1’ does not affect MUS81 activity.
(a) GM01604 wild-type fibroblasts were transfected with CTRL or MUS81 siRNA. Forty eight hours after transfection the fibroblasts were lysed and analysed by WB with the indicated antibodies. (b) Forty eight hours after transfection, GM01604 cells were exposed to 0.2 µM aphidicolin (APH) for 24h in the presence (grey bars) or absence (white bars) of increasing concentration of ‘1’ added in the last 3h before aphidicolin treatment. Results are presented as mean ± SEM from two independent replicates. (c) The presence of anaphase bridges, as shown in the representative images, was scored in DAPI-stained cells. The white bars indicate 10 µm.
Figure 6
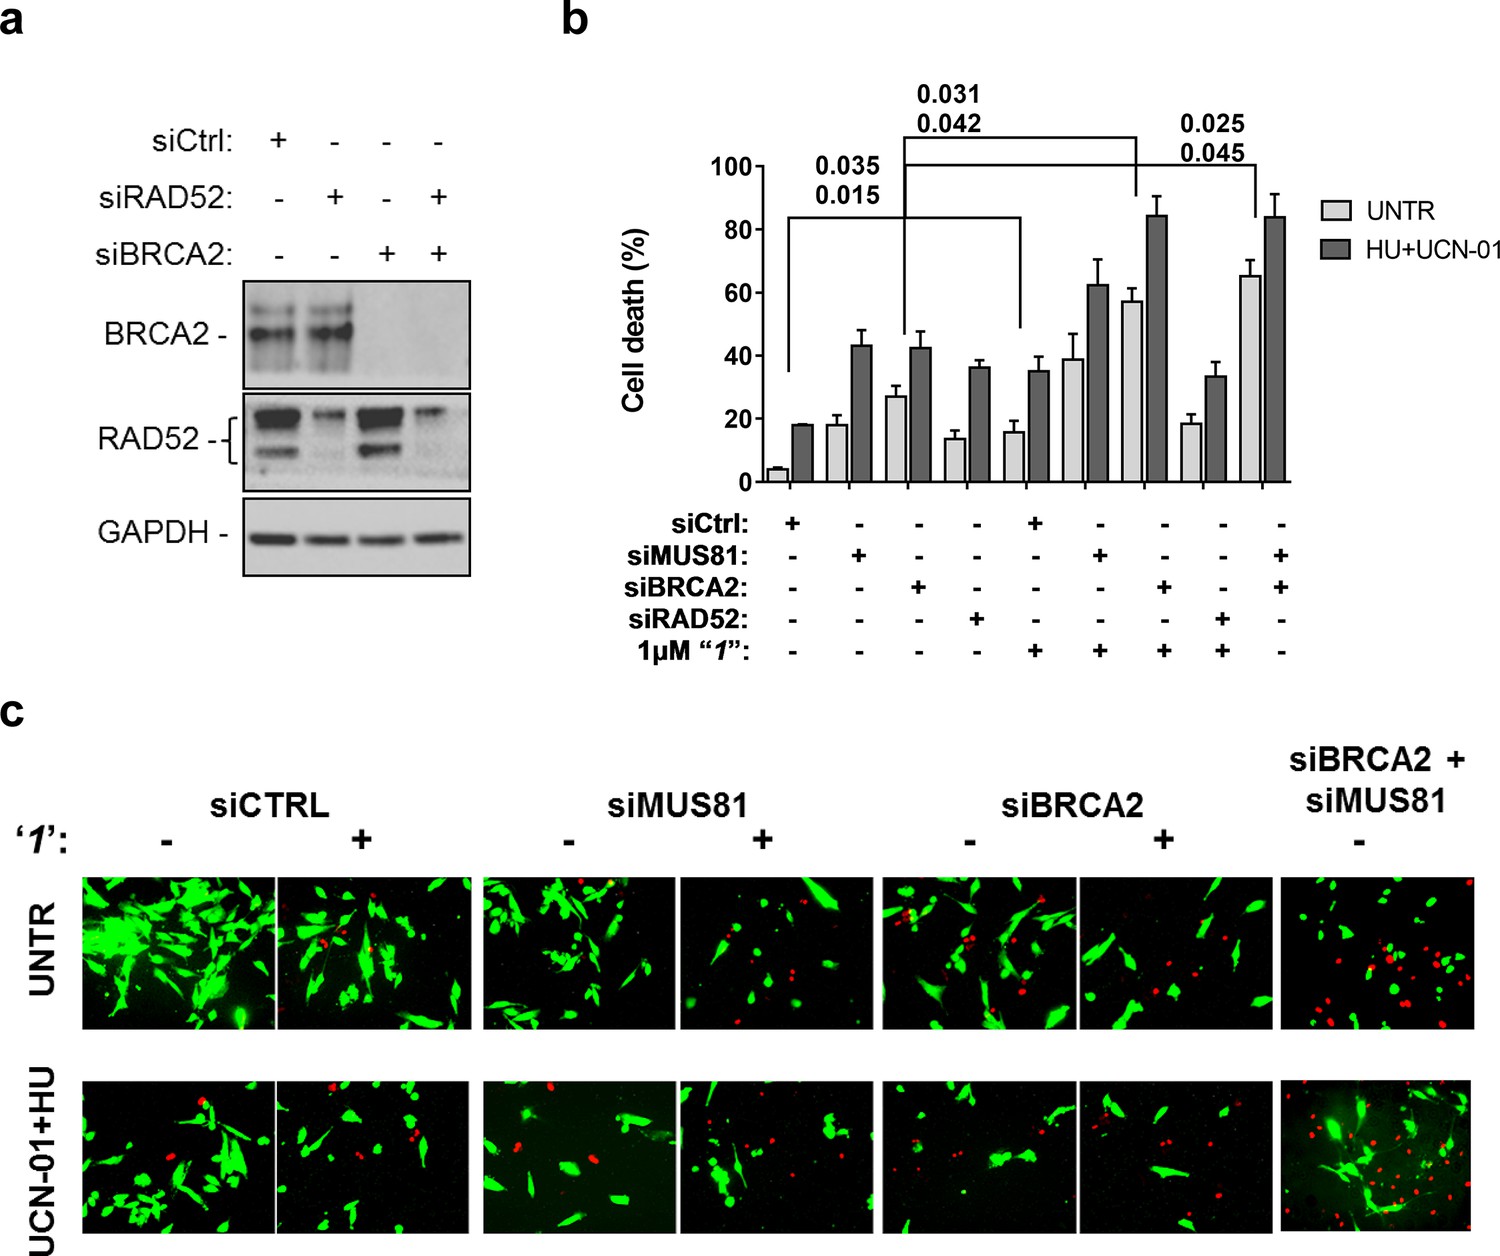
Inhibition of ssDNA binding by RAD52 is sufficient to stimulate cell death in the absence of the MUS81 nuclease or BRCA2 tumor suppressor.
(a) The WB shows the analysis of RNAi. (b) Evaluation of cell death after replication stress. Forty eight hours after transfection with the BRCA2 or MUS81 siRNAs, alone or in combination, the GM01604 cells were treated with compound ‘1’ or solvent (DMSO). Where indicated, the CHK1 inhibitor UCN-01 and HU was added and the cells were treated for 6h, followed by 18 hr of recovery in drug-free medium. Compound ‘1’ was present during the 6h of treatment. Cell viability was evaluated by LIVE/DEAD assay as described in 'Materials and methods'. Data are presented as percentage of dead cells and are mean values from three independent experiments. Error bars represent SEM. The numbers shown in the graph represent the p value; the first p value of each pair refers to untreated cells while the second to the treated cells (2 way ANOVA). (c) Representative images of live cells (green) and dead cells (red).
Figure 7
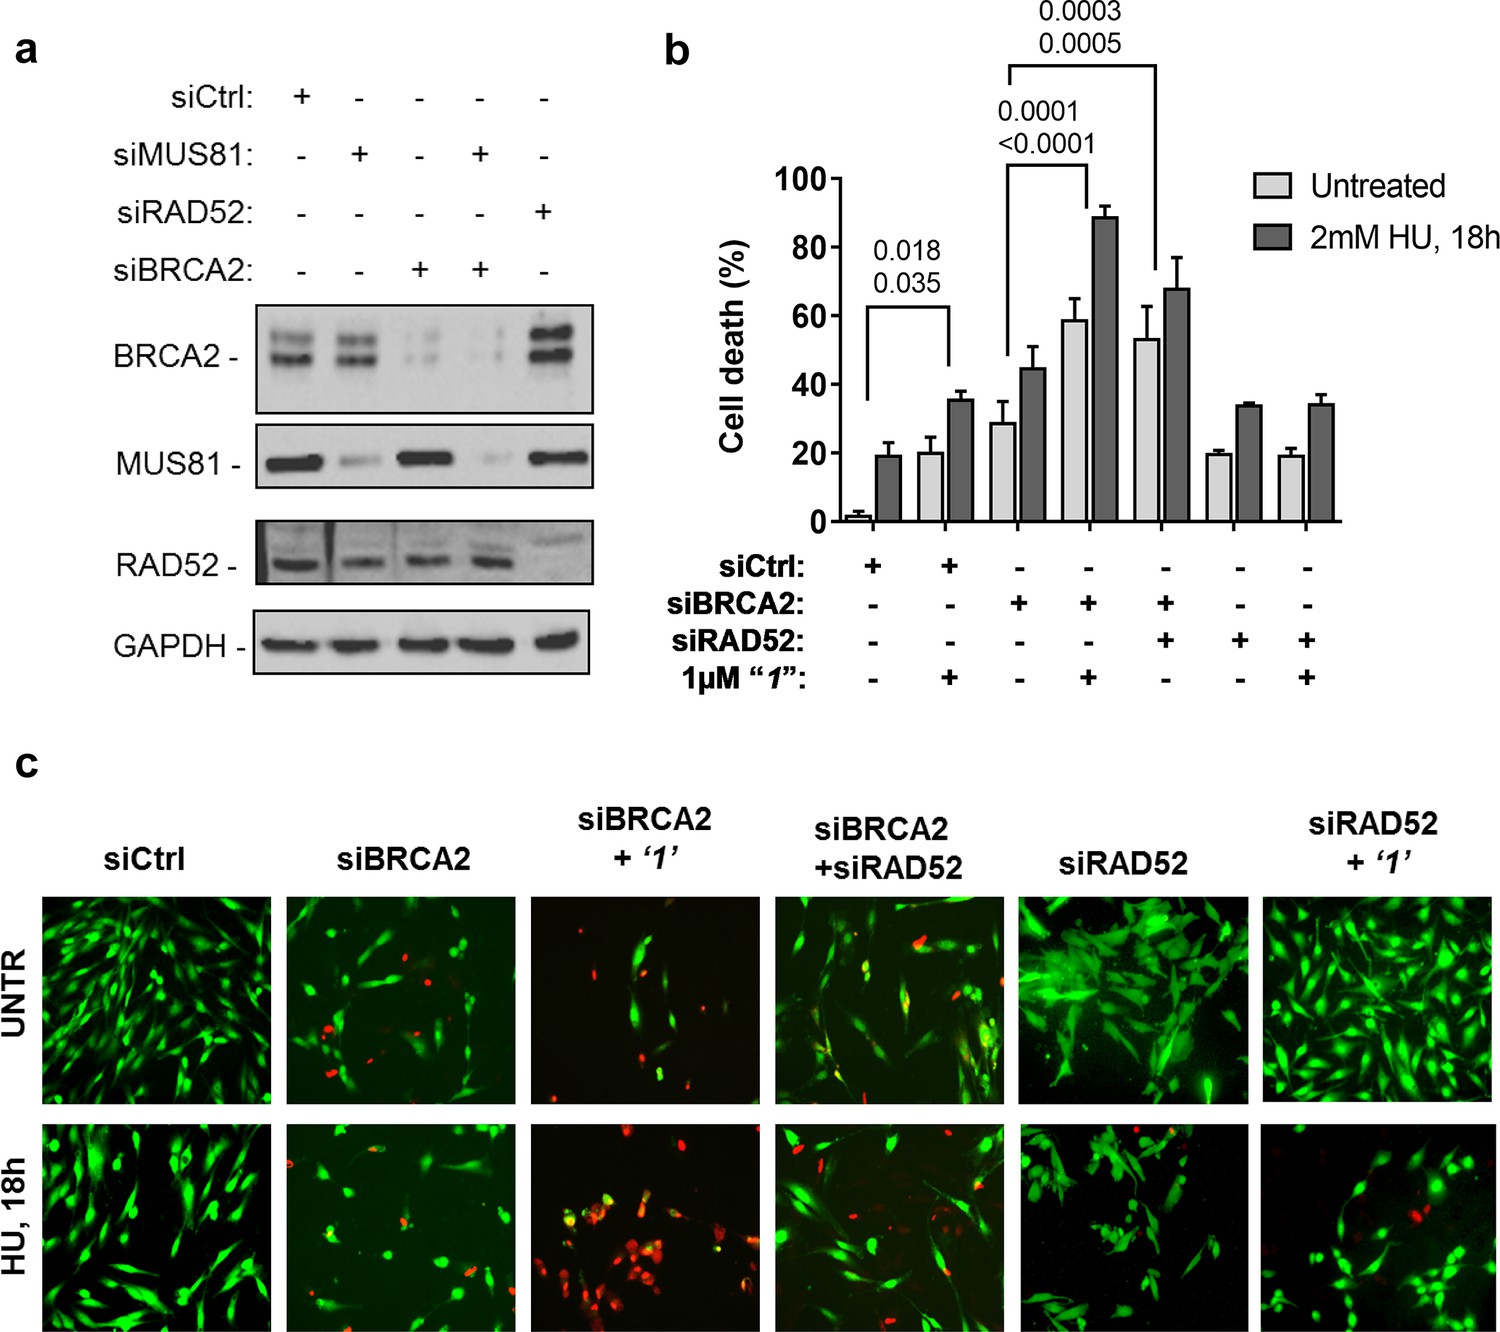
Inhibition of ssDNA binding to RAD52 is sufficient to stimulate cell death in the absence of the BRCA2 tumor suppressor.
(a) Western blot analysis of BRCA2, RAD52, and GAPDH (loading control) protein levels in GM01604 cells treated with Ctrl, BRCA2, and RAD52 siRNAs. (b) Evaluation of cell death after replication stress in cells treated with ‘1’. GM01604 cells were transfected with the RAD52 or BRCA2 siRNAs, alone or in combination, and 48h thereafter treated as indicated. The ‘1’ inhibitor or solvent (DMSO) was added to media 1h prior to replication stress. Cell viability was evaluated by LIVE/DEAD assay as described in the 'Materials and methods'. Data are presented as percentage of dead cells and are mean values from three independent experiments. Error bars represent standard error. The numbers shown in the graph represent the p value; the first p value of each pair refers to untreated cells while the second to the treated cells (2 way ANOVA). (c) Representative images: live cells are stained green, while dead cells are red.
Figure 8
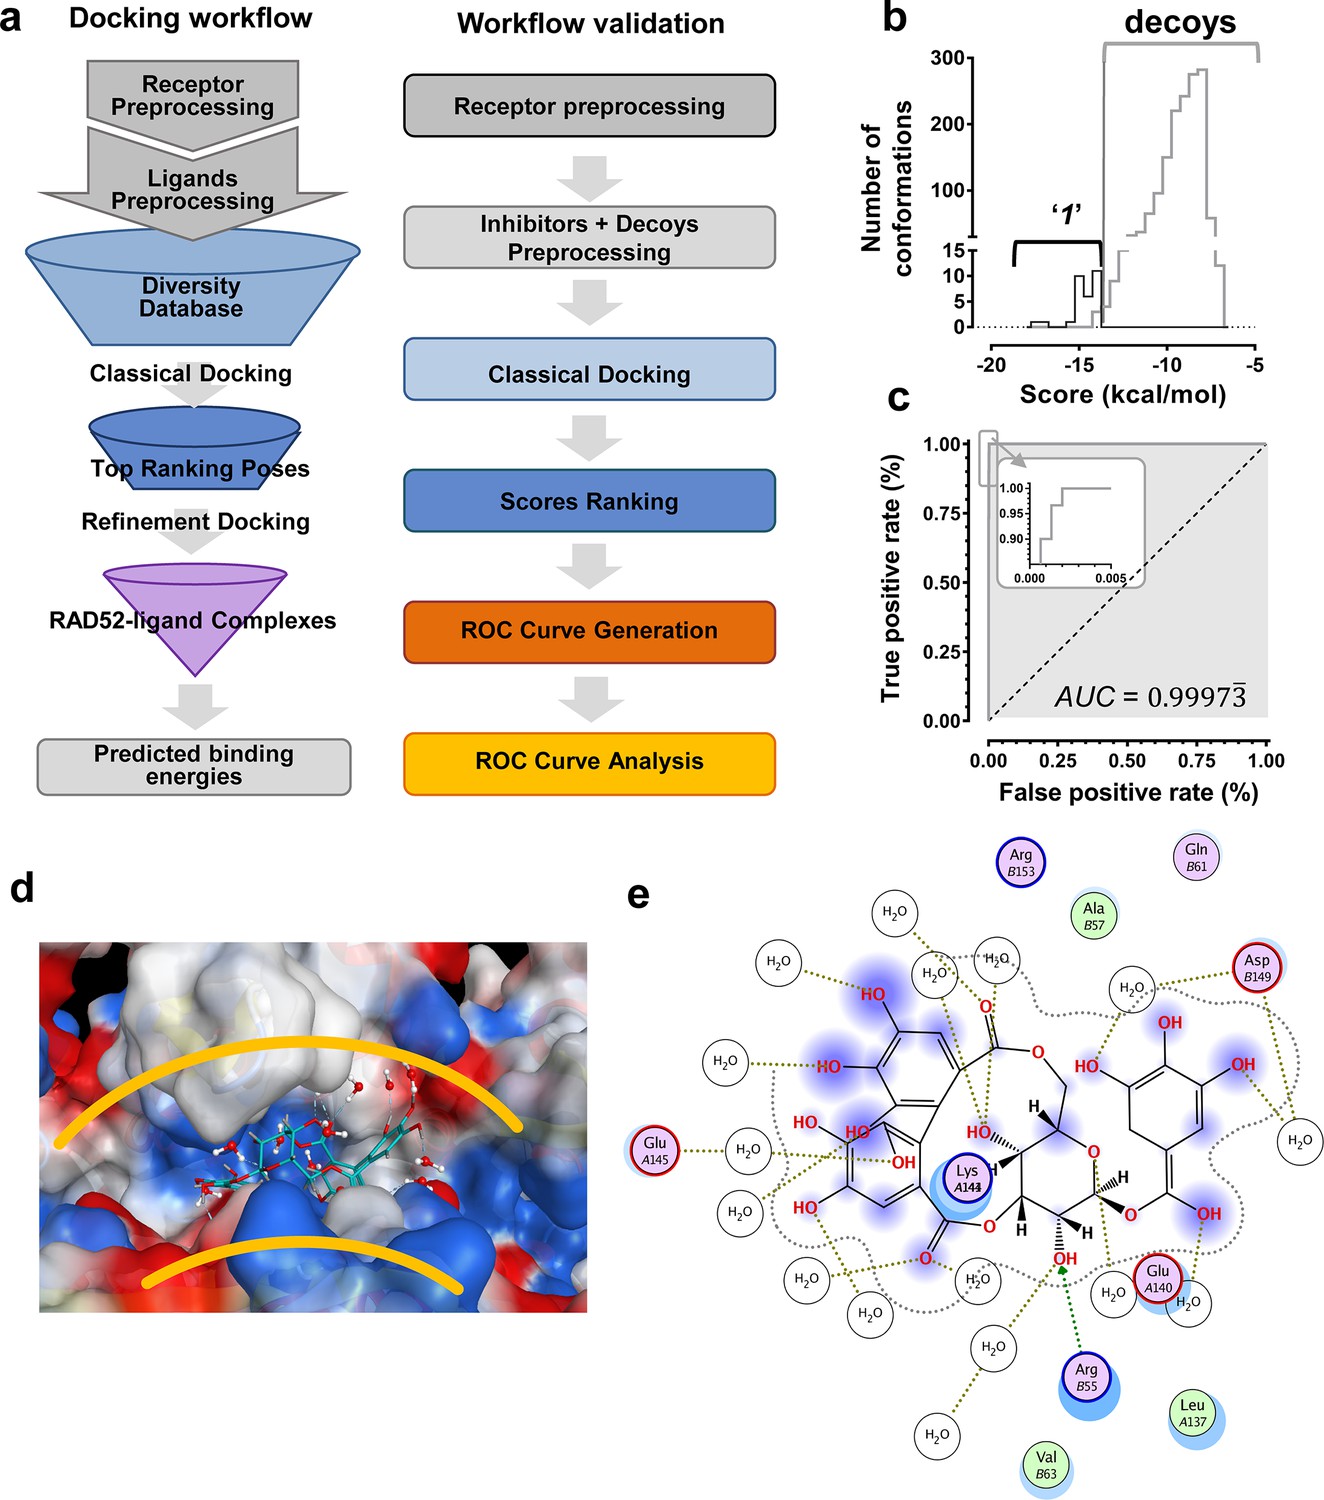
In silico screening campaign identifies novel small molecule that inhibits the RAD52-ssDNA interaction.
(a) Docking workflow involved RAD52-NTD undecameric ring (PDB 1KNO) pre-processing, AnalytiCon Discovery MEGx Natural Products Screening Library pre-processing, and classical docking using the Dock utility of MOE. Top ranking poses (those with the lowest energy scores from the London dG scoring function) were subjected to a refining docking step involving force field-based energy minimization. From these complexes, predicted binding free energies were calculated. Workflow validation involved RAD52-NTD pre-processing, pre-processing of ‘1’ and associated decoys (DUD-E), followed by classical docking and score ranking. ROC curves were then generated and analyzed. Scores of the conformations of inhibitor compounds and of conformations of their respective decoy compounds were compared. (b) Docking scores (kcal/mol) for the individual conformations of compound ‘1’ and decoy compounds were binned and plotted as histograms. The low docking scores, as indicated by the more negative predicted free energies of ‘1’ when compared to decoys, indicate more favorable poses, and highlight a distinct separation between true positives and true negatives. (c) Receiving-operating characteristic (ROC) curve shows that the classifier used, i.e. the scoring function, was close to optimal in distinguishing compound ‘1’ conformations from those of decoys confirmed by AUC analysis yielding a value of 0.9973. (d) Electrostatic surface potential of three monomers of the RAD52-NTD undecameric ring (PDB 1KNO) depicting NP-004255 within the ssDNA binding groove. (e). MOE ligand maps highlight water mediated interactions with E145 and D149 as well as via hydrogen bonding with amino acids R55.
Figure 9
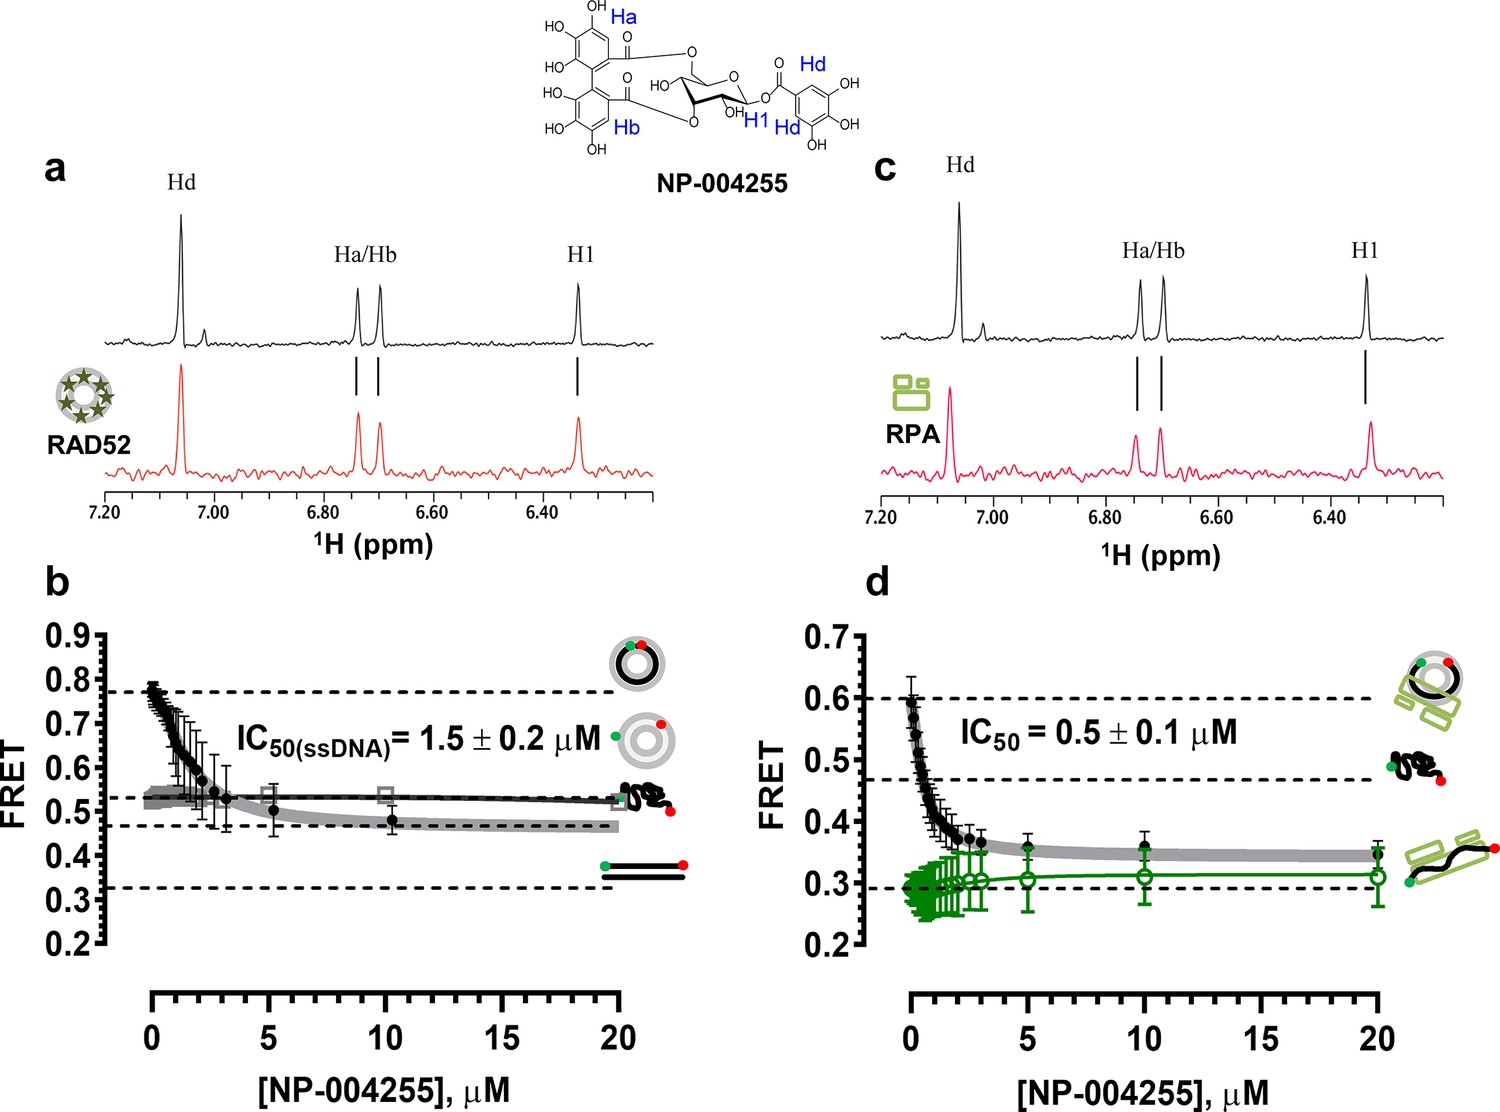
Biochemical characterization of NP-004255.
(a) Aromatic region of the 1D 1H NMR spectrum of compound NP-004255 alone (black) and the WaterLOGSY spectrum of 40 μM compound NP-004255 in the presence of 3.3 μM RAD52 (red). The nonexchangeable proton peaks are labeled using atom names as indicated on the structure of compound NP-004255. (b) IC50 values for inhibition of ssDNA binding and wrapping were determined using FRET-based assays that follow the change in geometry of a Cy3-dT30-Cy5 substrate (black circles). The computed IC50 value is shown above the curve. Titration of the RAD52-dsDNA with NP-004255 (grey boxes) shows that this inhibitor does not perturb the RAD52-dsDNA interaction. (c) Aromatic region of the 1D 1H NMR spectrum of compound NP-004255 alone (black) and the WaterLOGSY spectrum of 40 μM compound NP-004255 in the presence of 3.3 μM RPA (red). (d) Titration of the RAD52-RPA- Cy3-dT30-Cy5 complex with NP-004255 (black circles). The computed IC50 value is shown below the curve. Green squares show titration of the RPA- Cy3-dT30-Cy5 complex with NP-004255 indicating NP-004255 does not perturb the RPA-ssDNA interaction.
Author response image 1
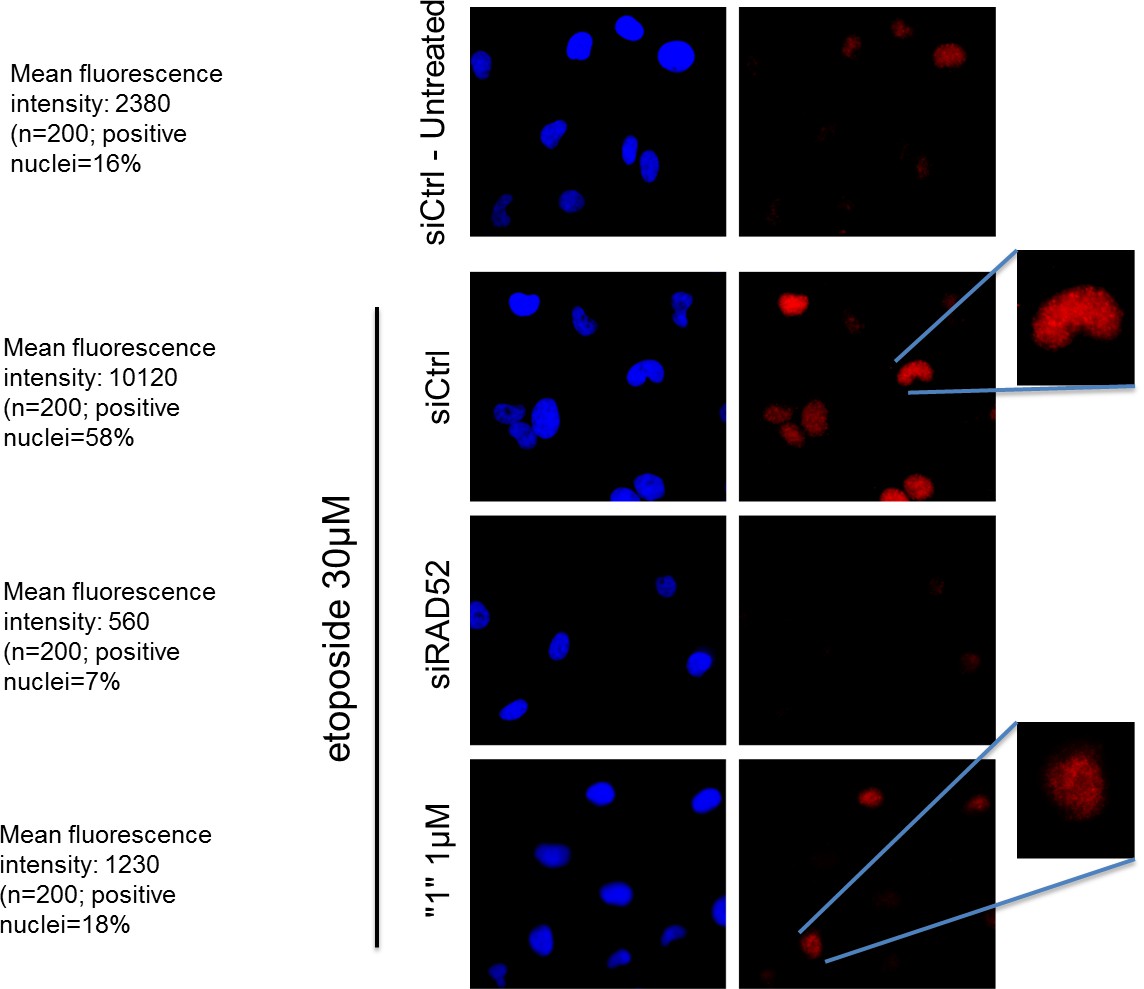
The RAD52 inhibitor interferes with the ability of RAD52 to localize in nuclear foci after DSBs.
https://doi.org/10.7554/eLife.14740.018Tables
Table 1
The twelve hits from the FRET-based HTS assay aimed at finding inhibitors of the RAD52-ssDNA interaction.
| # | Small molecule name; CAS # | Small molecule structure | IC50 (DNA binding); FRET value at saturation | IC50 (Annealing extent) | SAEM ΔG (kcal/mol) |
|---|---|---|---|---|---|
| ‘1’ | (−)−Epigallocatechin; 970-74-1 | 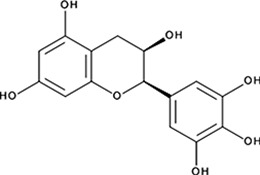 | ssDNA: 1.8 ± 0.1 µM; 0.45 ± 0.004 ssDNA-RPA: 1.6 ± 0.1 µM; | ssDNA: 4.9 ± 0.4 µM ssDNA-RPA 4.8 ± 1.8 µM; | −8.60 |
| ‘3’ | Methacycline Hydrochloride; 3963-95-9 | 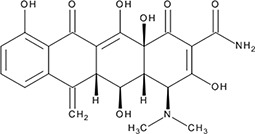 | 2.0 ± 0.17 µM; 0.47 ± 0.01 | 3.8 ± 0.2 µM | −4.61 |
| ‘4’ | Rolitetracycline; 751-97-3 | 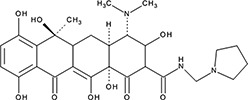 | 29 ± 8.2 µM; 0.56 ± 0.04 | NI | −10.5 |
| ‘5’ | (−)−Epicatechin gallate; 1257-08-5 | 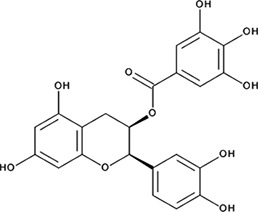 | 255 ± 16 nM; 0.41 ± 0.004 | 20 ± 0.7 µM | −9.87 |
| ‘6’ | Epigallocatechin-3-monogallate; 989-51-5 | 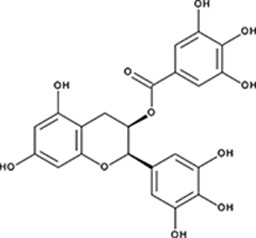 | ssDNA: 277 ± 22 nM; 0.46 ± 0.01 ssDNA-RPA: 1.6 ± 0.5 µM; | ssDNA: 6.7 ± 2.1 µM ssDNA-RPA: 3.7 ± 0.5 µM; | −10.69 |
| ‘7’ | (−)−Epicatechin; 490-46-0 | 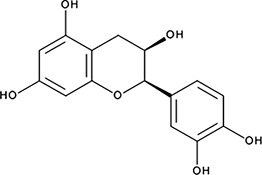 | 1.45 ± 0.11 µM; 0.51 ± 0.01 | NI | −9.03 |
| ‘14’ | Oxidopamine; 28094-15-7 1199-18-4 | 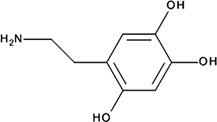 | 779 ± 51 nM; 0.50 ± 0.01 | NI | −5.71 |
| ‘15’ | Quinalizarin; 81-61-8 | 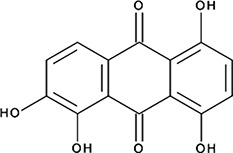 | 563 ± 40 nM; 0.51 ± 0.01 | 5.6 ± 0.6 µM | −9.17 |
| ‘16’ | Cisapride Monohydrate; 260779-88-2 81098-60-4 | 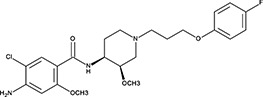 | 1.06 ± 0.05 µM; 0.50 ± 0.01 | NI | −8.39 |
| ‘17’ | Cedrelone; 1254-85-9 | 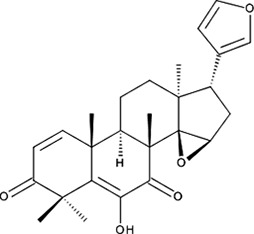 | >300 µM | NI | −10.0 |
| ‘18’ | Asiatic Acid; 464-92-6 18449-41-7 | 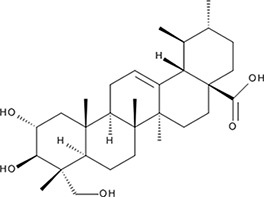 | >800 µM | >100 µM | −11.33 |
| ‘19’ | Gossypetin; 489-35-0 | 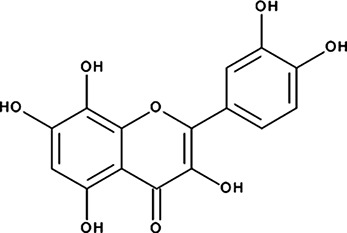 | 913 ± 58 nM; 0.49 ± 0.01 | 6.0 ± 2.3 µM | −9.30 |
Download links
A two-part list of links to download the article, or parts of the article, in various formats.
Downloads (link to download the article as PDF)
Open citations (links to open the citations from this article in various online reference manager services)
Cite this article (links to download the citations from this article in formats compatible with various reference manager tools)
Small-molecule inhibitors identify the RAD52-ssDNA interaction as critical for recovery from replication stress and for survival of BRCA2 deficient cells
eLife 5:e14740.
https://doi.org/10.7554/eLife.14740


