Autophagy linked FYVE (Alfy/WDFY3) is required for establishing neuronal connectivity in the mammalian brain
- Columbia University, United States
- University of Oslo, Norway
- Tokyo Metropolitan Institute of Medical Science, Japan
- Fukushima Medical University School of Medicine, Japan
Figures
Figure 1 with 2 supplements
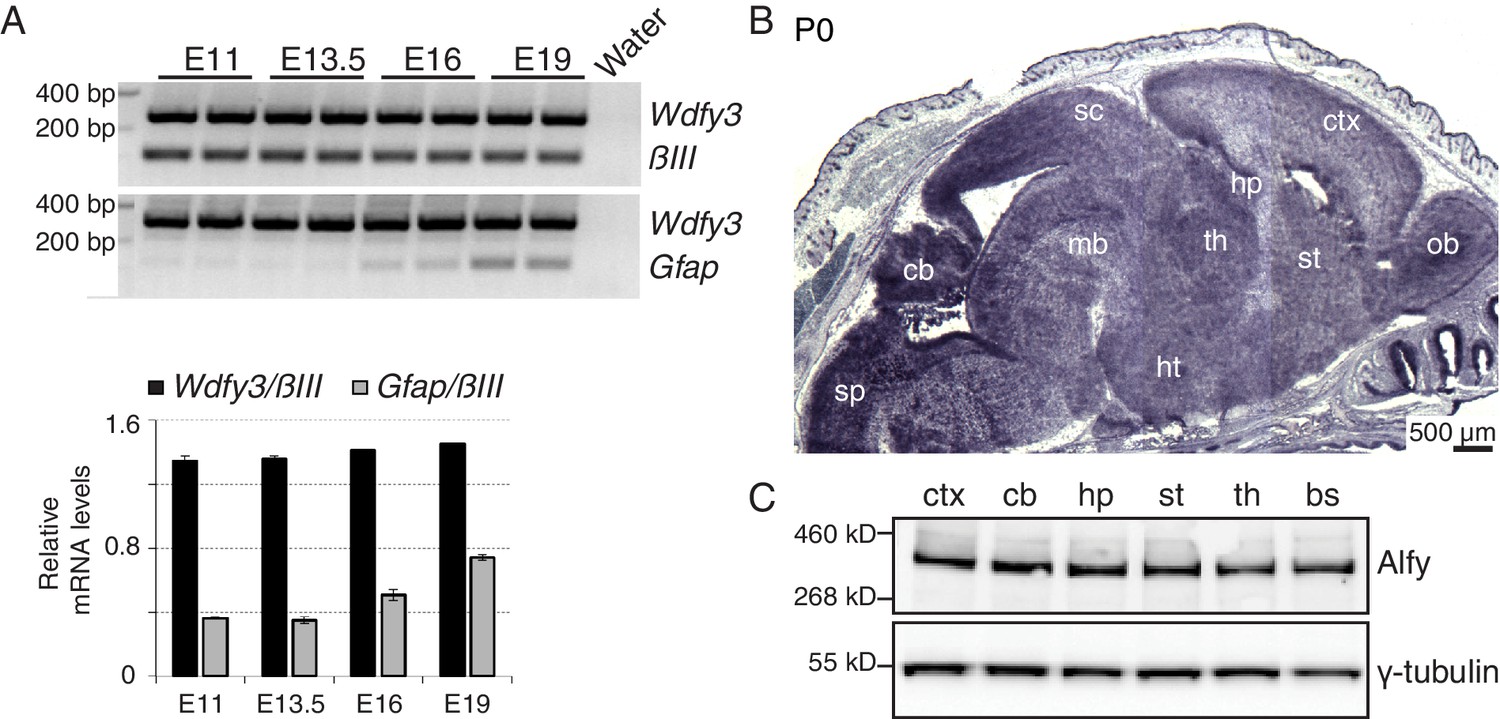
Alfy is highly expressed throughout the developing and adult mouse CNS.
(A) (Top) RT-PCR demonstrates Alfy/Wdfy3 can be detected as early as embryonic day 11 (E11) and remains abundant throughout gestation (E19). (A) Multiplex PCR for the 5’ region of the gene encoding Alfy, Wdfy3 with Class III β-tubulin (βIII, top) and Glial fibrillary acid protein (Gfap, bottom). (Btm) Quantification of transcript levels relative to βIII (black) and Gfap (gray), n = 4, bars represent mean ± SEM. (B) In situ hybridization of sections from P0 mice reveals strong expression of Wdfy3 throughout the brain. Low magnification images stitched together to reveal a complete sagittal brain section representative of Wdfy3 mRNA distribution in a wildtype mouse. An abundance of mRNA is observed throughout the newborn CNS (n = 4), whereas no mRNA staining above background is observed in Alfy KO mice (data not shown). The ISH reflects how Alfy is most highly expressed in brain (Figure 1—figure supplement 1) and this expression is both neuronal and glial (Figure 1—figure supplement 2). Abbreviations: cerebellum (cb), cerebral cortex (ctx), hippocampus (hp), hypothalamus (ht), midbrain (mb), olfactory bulb (ob), striatum (st), superior colliculus (sc) and thalamus (th). (C) Immunblotting reveals that Alfy expression is maintained throughout the adult brain. Lysates generated from different regions of the adult brain, including the brain stem (bs) were probed with an Alfy antibody raised against its N-terminus. γ-tubulin is shown as a loading control (n = 4).
Figure 1—figure supplement 1
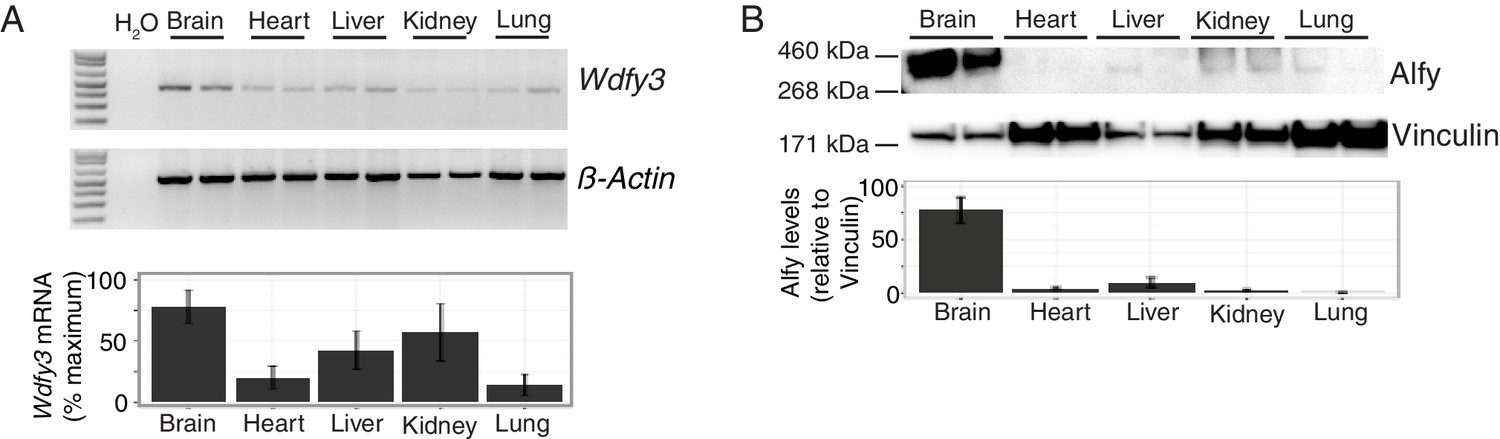
Alfy/Wdfy3 expression is highest in the brain.
(A) Semi-quantitative RT-PCR for Wdfy3 mRNA in different organs from adult mice. Relative levels of Wdfy3 mRNA (corrected for β-Actin) across the different organs is quantified below (n = 5). Bars represent mean ± SEM. Wdfy3 RNA is most highly expressed in brain, although the transcript can be detected in all tissues examined. (B) Immunoblotting for Alfy from tissue samples collected from adult mice. Relative protein levels were normalized using the cytoskeletal protein vinculin as shown below (n = 6). Bars represent mean ± SEM. In confirmation with previous results, Alfy protein is most abundant in brain.
Figure 1—figure supplement 2
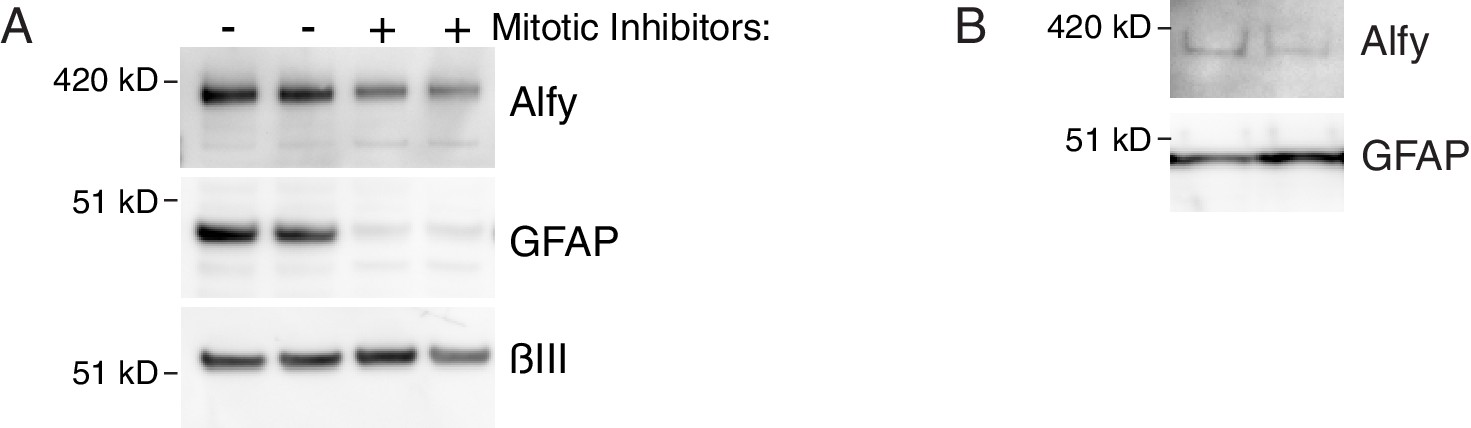
Alfy is expressed in neurons and astroglia.
(A) Primary cortical cultures were grown for seven days with or without mitotic inhibitors. Mitotic inhibitors were added to cultures after plating to prevent glial proliferation and generate cultures that are enriched for neurons. After seven days, lysates were prepared from the cultures and western blots containing 5 µg of total protein were probed with antibodies against Alfy, the glial marker GFAP, and the neuronal specific tubulin, BIII. As expected, mitotically inhibited cultures had a minimal GFAP expression but contained abundant BIII Tubulin. Alfy was detected in mitotically inhibited cultures, implying neurons endogenously express Alfy. The experiment was replicated twice, using two litters of mice (Control n = 3; KO n = 3). (B) Alfy was detected in lysates prepared from primary astroglia cultures that were passaged and allowed to differentiate for fourteen days. Western blots containing 3 µg of total protein were probed with antibodies against Alfy and GFAP. Results from two independent cultures are shown.
Figure 2 with 1 supplement
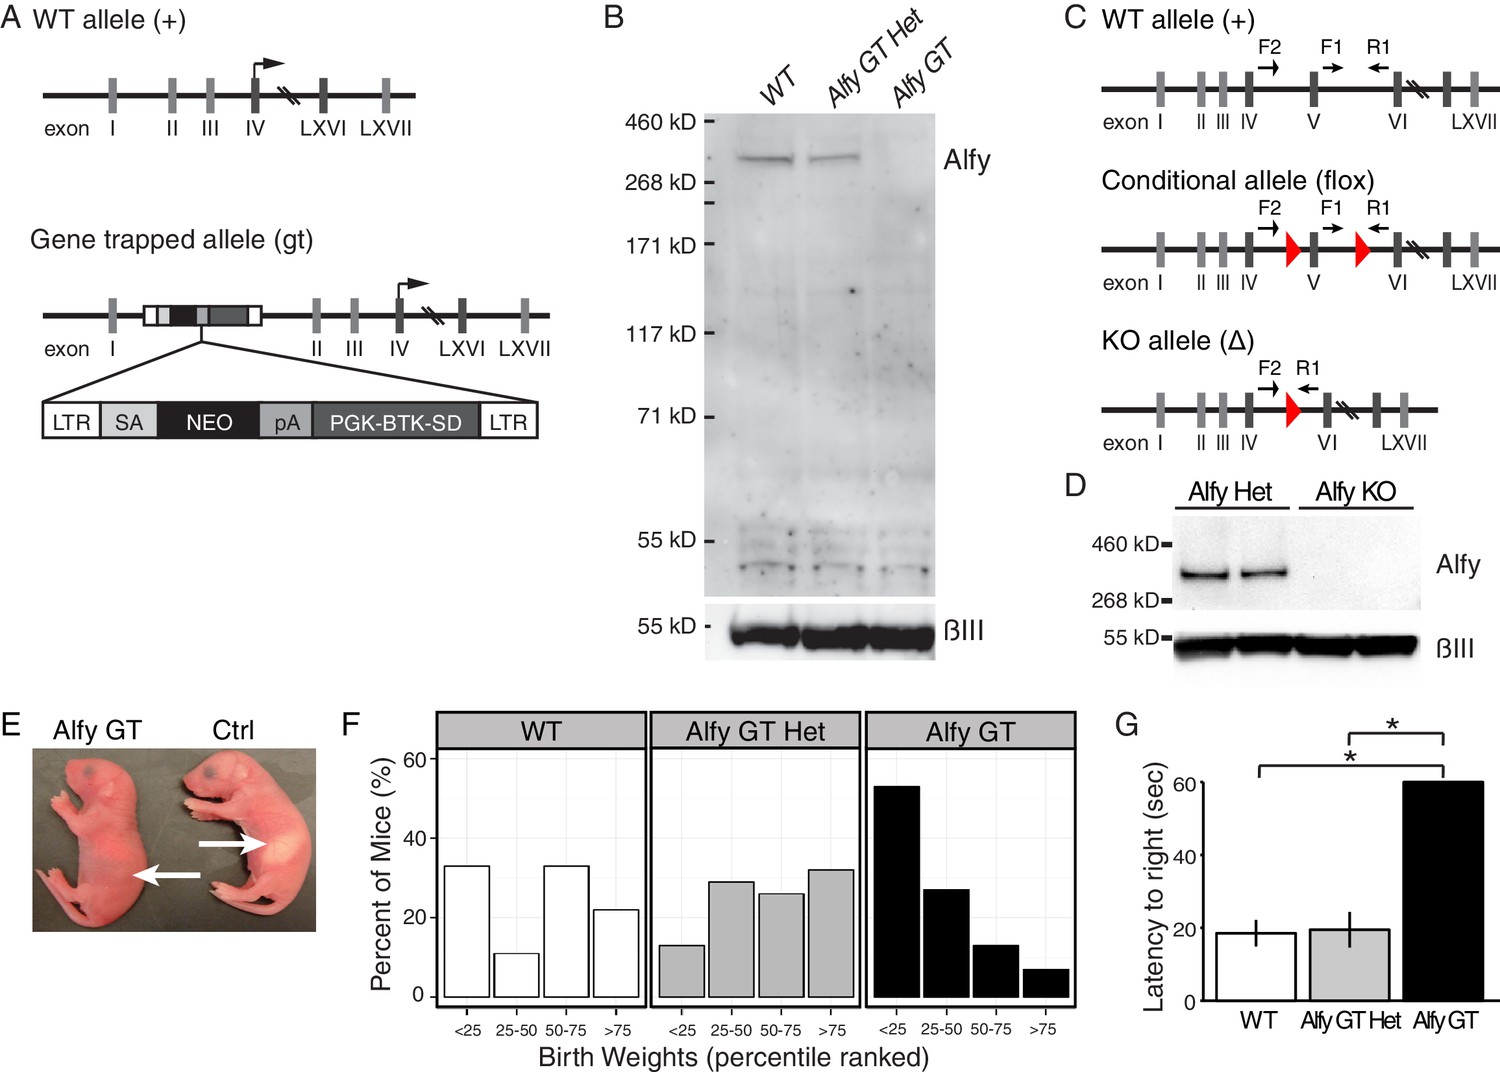
Two lines of knockout (KO) mice reveal Alfy is essential for postnatal survival.
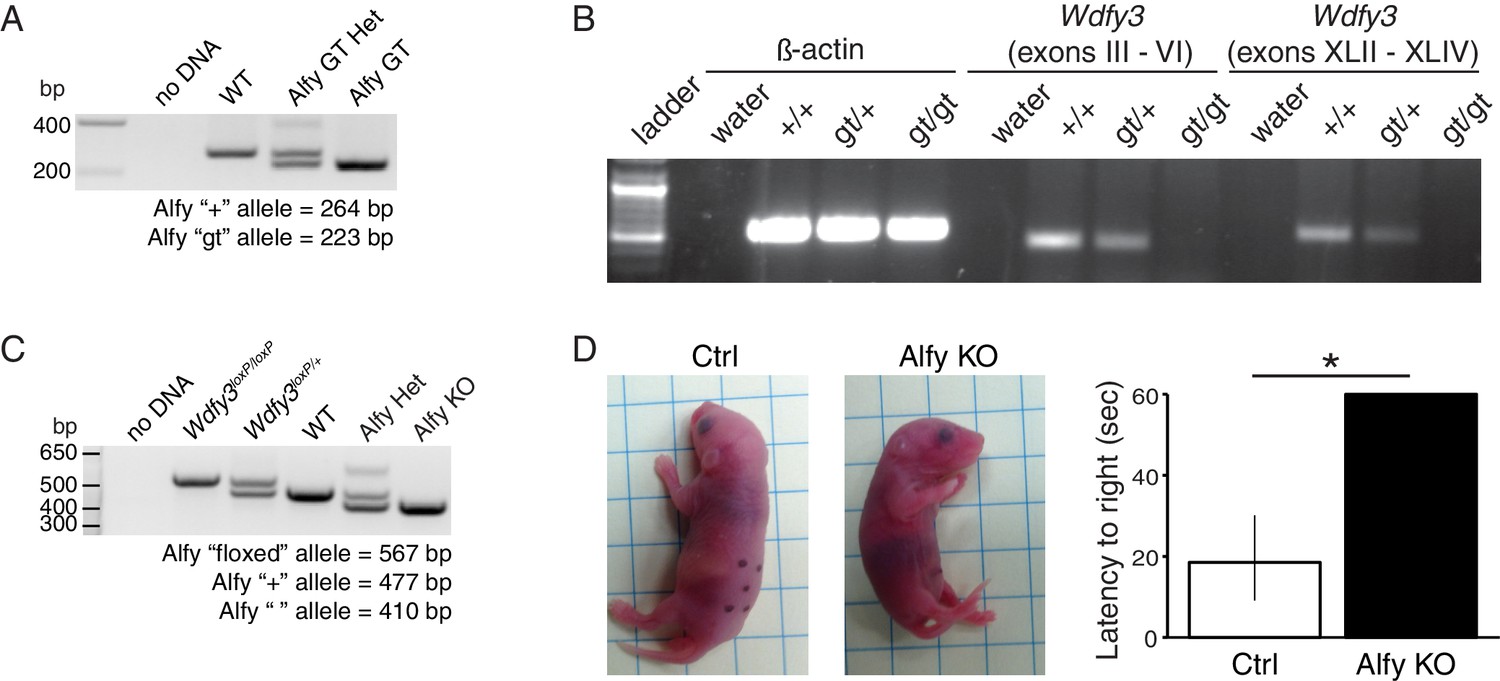
(A,B) Alfy GT mice. (A) The GT cassette introduces a splice acceptor site (SA) and causes the premature termination of transcription through the introduction of a poly-adenylation (pA) tail. The translation start site for Wdfy3 is located in exon IV. RT-PCR indicates that the gene trap insertion leads to a loss of Wdfy3 transcript (Figure 2—figure supplement 1A,B). (B) Western blot of brain lysates probed with an antibody against the COOH-terminus of Alfy and βIII (n = 5). Abbreviations: long terminal repeats (LTR), neomycin (NEO), Phosphoglycerate kinase-1 promoter and Bruton tyrosine kinase splice donor site (PGK-BTK-SD). (C,D) Alfy KO mice. (C) A conditional (flox) Wdfy3 allele is created by insertion of two loxP sites (red triangles) to flank exon 5, leading to its excision upon exposure to Cre and the creation of the smaller knockout (KO) ‘Δ’ allele. The two forward and one reverse primers (arrows) used for genotyping are noted (also see Figure 2—figure supplement 1C). (D) Immunoblotting detects Alfy in brain lysates from heterozygous (Alfy Het, n = 6) but not in Alfy KO mice (n = 7). (E–G) Characterization of newborn Alfy GT mice. (E) Newborn Alfy GT and littermatecontrol (Ctrl) mice. Arrows highlight that control pups have stomachs full of milk whereas their GT littermates do not. (F) Alfy GT pups are consistently smaller than control. After genotyping, the weights of the animals were percentile ranked and binned into four groups. Approximately 50% of Alfy GT mice (8/15) had birth weights in the lowest 25th percentile, whereas heterozygous and wildtype littermates made up 92% (12/13) of mice with birth weights in the 75th percentile or greater. Data were collected from 10 litters of mice, n = 55. Similar differences were observed between the Alfy KO pups and their heterozygous littermates (data not shown). (G) Alfy GT pups lack a righting reflex. The amount of time it took each pup to perform the task was averaged over three trials and recorded as the latency to right. Alfy GT failed to rotate from back to their bellies within 60 sec. A single factor ANOVA revealed genotype had a significant effect on pup behavior (n = 6 WT, 9 Alfy GT Het, 7 Alfy GT; F(2,17) = 20.90, p < 0.001). Fisher’s PLSD test indicated a significant difference between Alfy GT and WT (p < 0.001) or heterozygous (p < 0.001) littermates. Bars represent mean ± SEM. Similar differences were observed between Alfy KO pups and their heterozygous littermates (Figure 2—figure supplement 1D).
Figure 2—figure supplement 1
Creation and characterization of Alfy GT and Alfy KO mice.
(A,B) Creation of Alfy GT mice. (A) PCR based genotyping of wildtype (WT), Alfy GT heterozygotes (Alfy GT Het) and Alfy GT mice. (B) Semi-quantitative RT-PCR of Alfy GT mice. Both the 5’ and 3’ portions of the Wdfy3 mRNA transcript are undetectable in Alfy GT mice by RT-PCR. β-actin is shown as control. n = 2 WT, 3 Alfy GT Het, 3 Alfy GT) (C) PCR genotyping of Alfy KO mice. PCR based genotyping of the homozygous and heterozygous conditional Wdfy3 allele (Wdfy3loxP/+ and Wdfy3loxP/loxP, respectively) and WT, Alfy KO heterozygous (Alfy KO Het) and Alfy KO mice. (D) Mice are born with an inherent ability to right themselves from a supine to prone position. To determine if the loss of Alfy affected this behavior, marked and warmed pups were placed on their backs on a flat surface and given 60 s to rotate to a prone position. The amount of time it took each pup to perform the task was averaged over three trials and recorded as the latency to right. Alfy KO mice were not able to rotate from their backs to their bellies within 60 s, similar to Alfy GT mice (Figure 2). A single factor ANOVA revealed genotype had a significant effect on pup behavior (n = 4/genotype; F(1, 6) = 43.14, p < 0.001). Bars represent mean ± SEM.
Figure 3 with 2 supplements
Commissures fail to cross the midline appropriately in Alfy GT and KO brains.
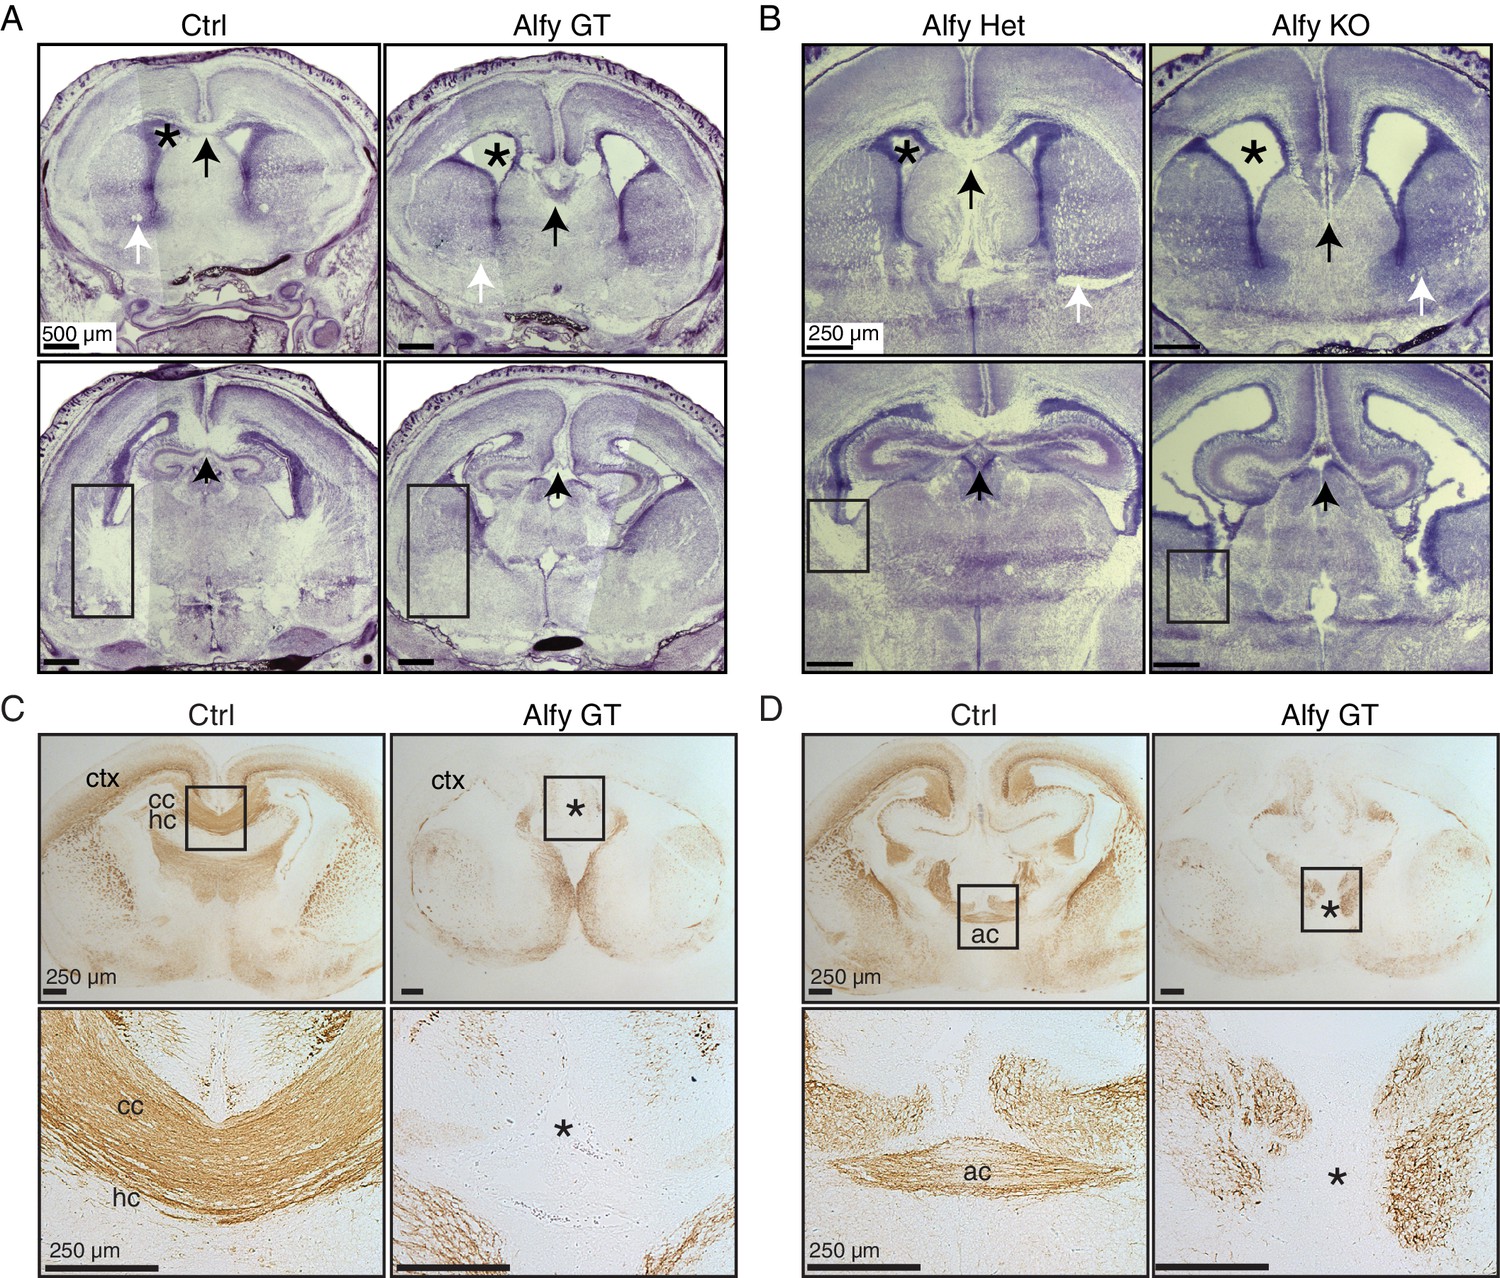
(A,B) Nissl stained forebrain from newborn (P0) control or Alfy mutant (Alfy GT or Alfy KO) mice. Coronal sections are shown. Alfy mutants have many abnormal features, including enlarged ventricles (*), and apparent white matter abnormalities, including absence of a corpus callosum (cc) at the midline (black arrow), undetectable anterior commissure (ac, white arrow), and dysmorphic internal capsule (rectangle). More caudal sections can be found in Figure 3—figure supplement 1A. n = 6 WT, 3 Alfy GT Het, 7 Alfy GT; n = 3 Alfy Het, 3 Alfy KO. (C,D) Immunostaining highlights axonal abnormalities in Alfy mutant mice. Coronal sections are shown. The three major forebrain commissures fail to cross the midline in Alfy mutant brains. (C) The cc, hippocampal commissure (hc) and (D) ac are absent in Alfy mutants. ‘*’ denotes midline and lack of axonal connectivity. Boxed regions are shown enlarged below. n = 5/genotype. The habenular and posterior commissures can be found in Figure 3—figure supplement 2.
Figure 3—figure supplement 1
Alfy mutant mice have aberrant and disorganized axon projections.
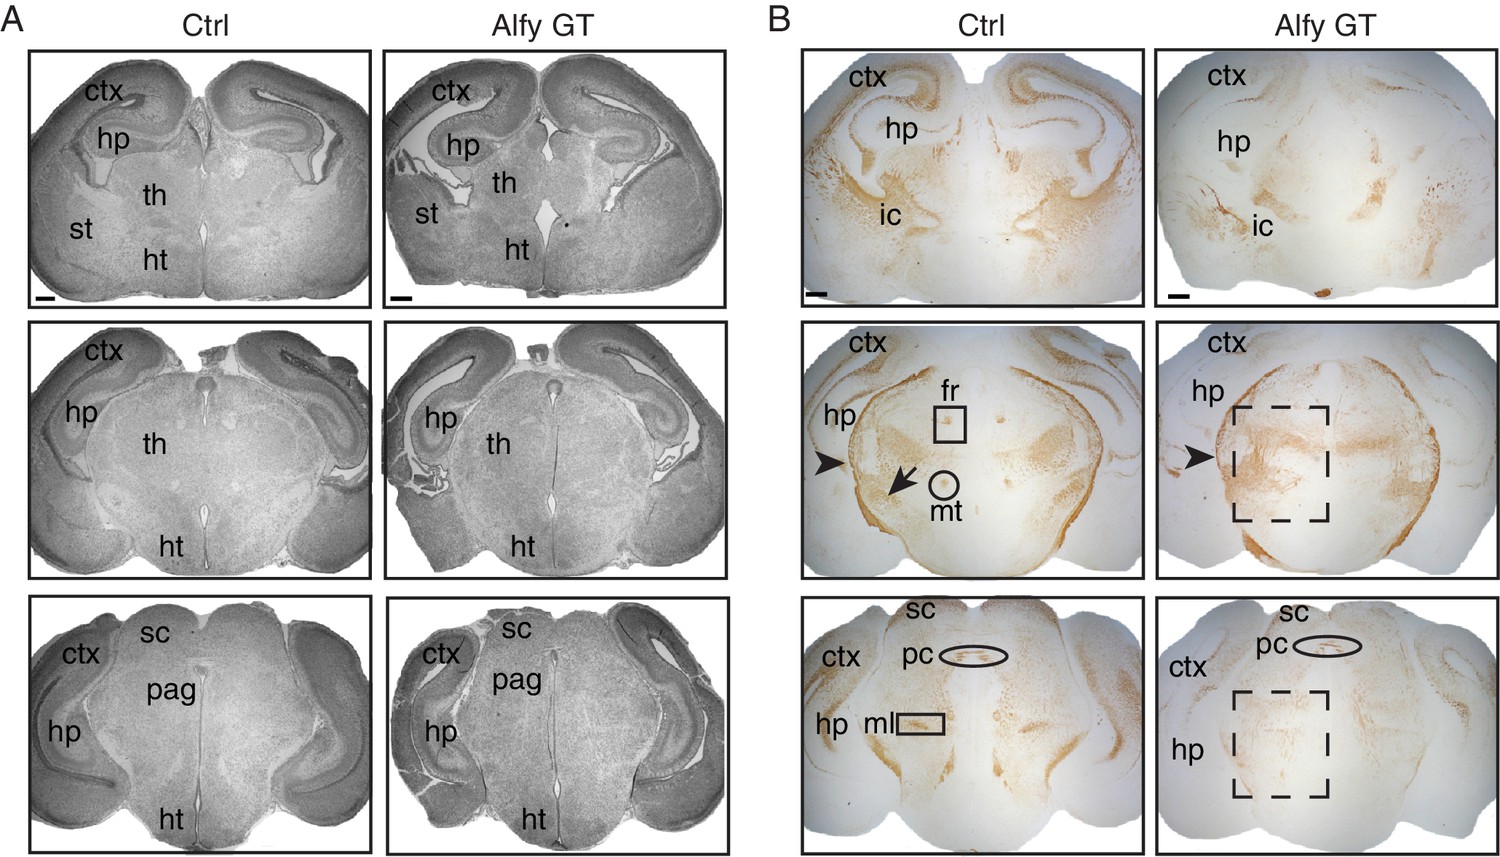
(A) H&E staining of neonatal brains reveal altered brain morphology in Alfy GT mice. Coronal sections are shown. In the absence of Alfy, the cerebral cortex (ctx), thalamus (th) and hippocampus (hp) are dysmorphic. Additional abnormalities in the Alfy null mice include a reduced size of the thalamus. Alfy heterozygotes are indistinguishable from WT littermates (data not shown). Wildtype mice are shown as control (Ctrl). n = 3/genotype. Scale bar = 250 μm. (B) NF staining reveals aberrant and disorganized axonal projections of Alfy mutant brains. Coronal sections are shown. Alfy GT mice show reduced staining in the ctx and abnormal NF staining in the internal capsule (ic) and tracts within the hp. The fasciculus retroflexus (fr, square box), mammalothalamic tract (mt, circle) and cerebral peduncle (arrow) are evident in the Ctrl but present as aberrant, disorganized axonal tracts in Alfy GT (dashed box). The external capsule (arrowhead) is present in Ctrl and Alfy null brains. n = 5/genotype. Additional abbreviations: hypothalamus (ht), periaqueductal gray (pag), striatum (st), and superior colliculus (sc).
Figure 3—figure supplement 2
Aberrant and disorganized projections of the habenular and posterior commisural axons.
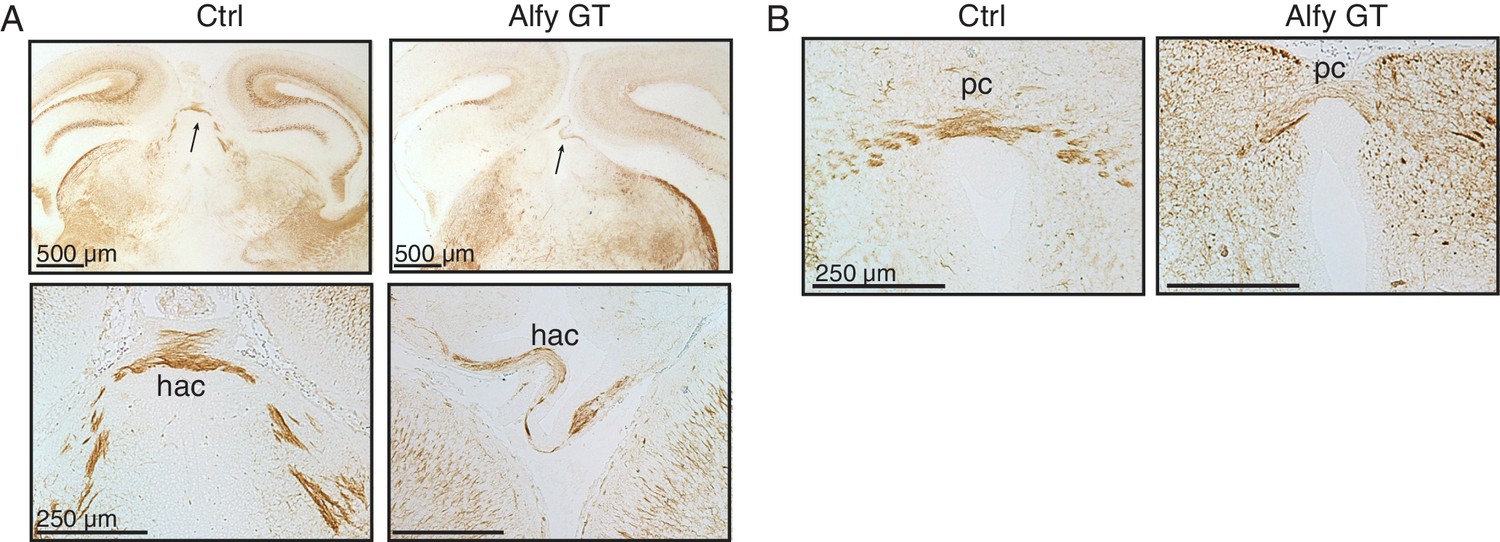
(A) Low-power magnification of Ctrl and Alfy GT coronal sections are presented in the top panels. The arrow points to the habenular commissure (hac), which is presented at higher magnification below. (B) The posterior commissure (pc). Both appeared morphologically abnormal in Alfy GT mice, although both crossed the midline. n = 3/genotype. Scale bar as indicated.
Figure 4 with 2 supplements
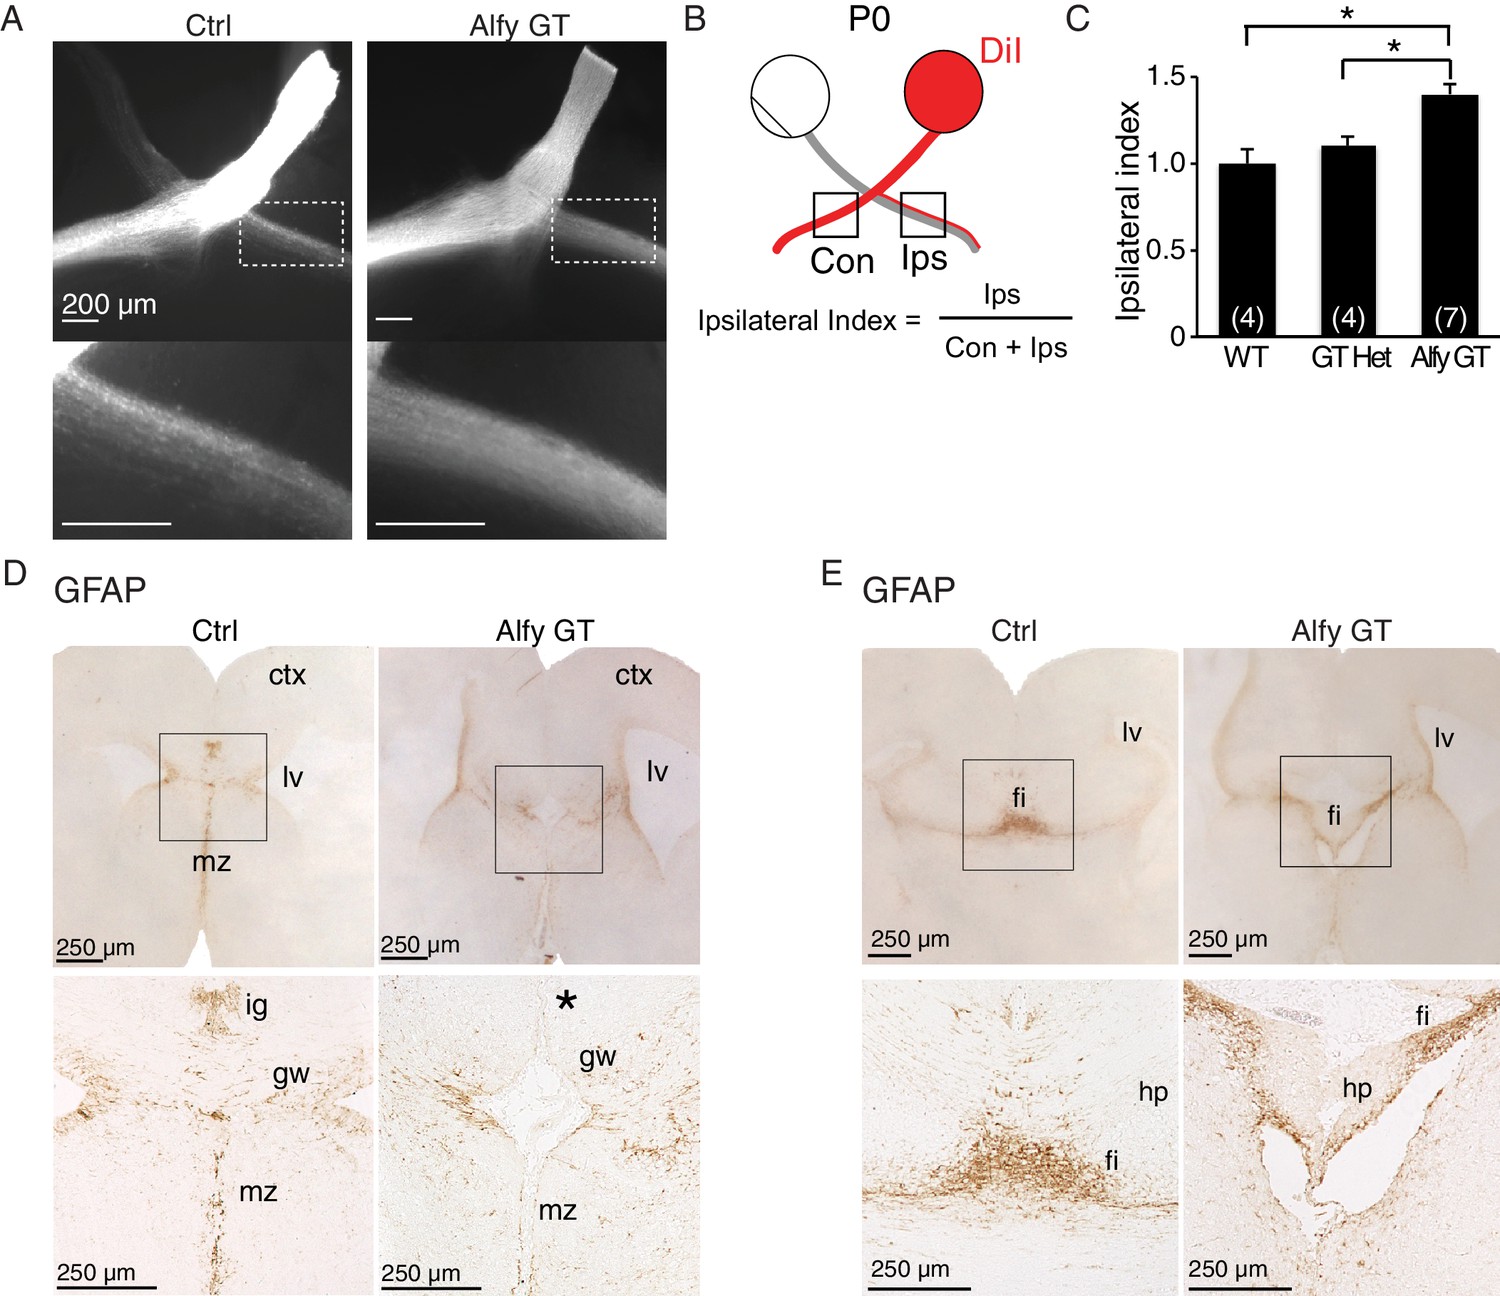
Midline crossing defects extend to the optic chiasm in Alfy GT and KO brains, possibly due to disrupted localization of guidepost glial cells.
(A–C) Retinal decussation defects are observed in Alfy mutant mice. (A) Whole mounts of P0 optic chiasm are unilaterally labeled with DiI at the optic disc. The ipsilateral projection denoted in the white dashed box, which is shown enlarged below. WT and GT heterozygous littermates were indistinguishable. A heterozygous mouse is shown as a control (Ctrl). (B) Schematic representation of how the ipsilateral index is calculated. Pixel intensities of contralateral and ipsilateral optic tracts are measured within 500 x 500 µm2. (C) The ipsilateral index of Alfy mutant mice is greater than both WT and heterozygous (GT Het) littermate controls, indicating the abnormally enlarged ipsilateral projection. Bars represent mean ± SEM, and statistical analysis was determined using one-way ANOVA followed by the Tukey’s post hoc test. Respective n-values per genotype are noted in the bars. *p < 0.05. (D,E) Immunostaining for GFAP in P0 forebrain reveals mislocalization of guidepost glial cells. Coronal sections are shown. (D) The glial wedge (gw), the indusium griseum (ig) and midline zipper (mz) glia populations of glial cells were in the expected locations in WT littermate brains (Ctrl). In Alfy GT brains, the ig was not detectable (expected location denoted by '*'), and the gw and mz cells were disorganized. n = 3/genotype. (E) Glial populations within the fimbria (fi) and dentate gyrus (dg) of the hippocampus were apparent in both genotypes. Boxed areas are shown at higher magnification below. n = 3/genotype. The examination of other potential intrinsic alterations that may contribute to forebrain axonal connectivity can be found in Figure 4—figure supplements 1 and 2.
Figure 4—figure supplement 1
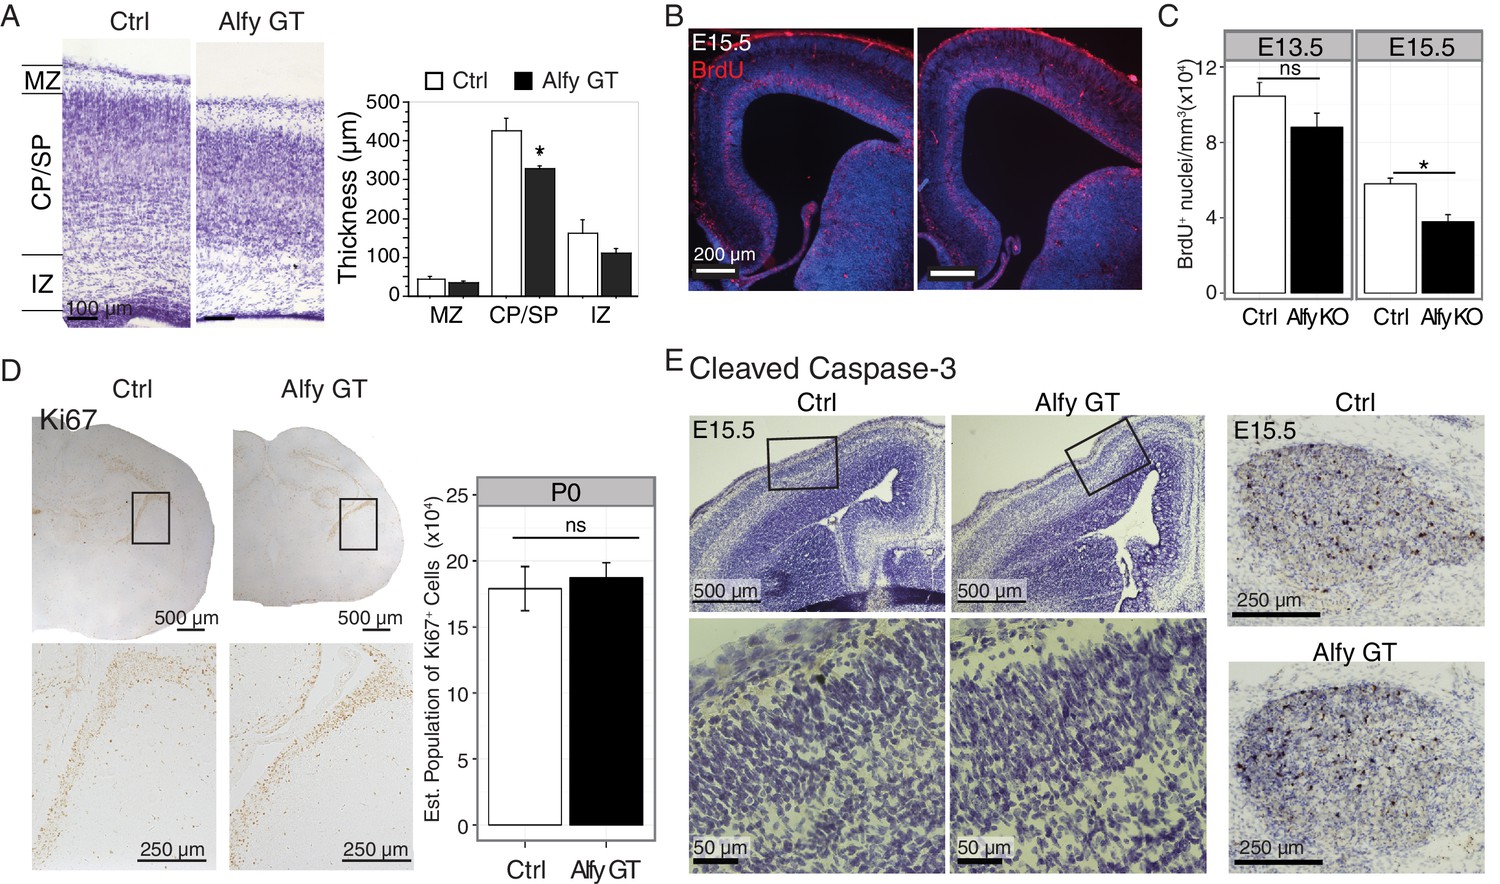
The loss of Alfy leads to modest changes in proliferation but not cell death in the neocortex.
(A) Loss of Alfy leads to a moderate but significant decrease in cortical plate thickness. Measurements of P0 cortex reveal that the cortical plate/subplate (CP/SP) of Alfy GT brains (n = 3) are modestly but significantly thinner than control (Ctrl, n = 3) brains, (t(4) = 5.30, p < 0.01). The marginal zone (MZ) and intermediate zone (IZ) do not reach significance, (t(4) = 1.67, p = 0.17 and t(4) = 2.38, p = 0.076, respectively). Bars denote mean ± St. Dev; *, p < 0.01. (B,C) Loss of Alfy leads to a subtle defect in cell proliferation at E15.5 but not at E13.5. A single injection of BrdU was administered to time-pregnant dams at E13.5 or E15.5 and embryos were collected 1 hr post-injection. (B) A clear band of BrdU-positive cells (red) was detected in the subventricular zone and deep cortical layer in all three littermate genotypes (WT: n = 2, heterozygous: n = 3, and Alfy GT n = 3; two litters). Hoechst 33342 nuclear DNA stain is in blue. (C) Colorimetric BrdU was used to quantify the number of proliferative cells in the developing cortical plate. At E13.5, Quantification revealed no significant difference in the number of BrdU positive (BrdU+) cells between Alfy KO and heterozygous littermate control (Ctrl) t(8) = 1.59, p = 0.15 (Ctrl: n = 5, Alfy KO: n = 5; two litters). At E15.5, there was a modest, but significant reduction in the absence of Alfy, t(8) = 3.12, p < 0.01 (Ctrl: n = 4, Alfy KO: n = 6; two litters). Bars denote mean ± SEM. ns, not significant; *, p<0.01. (D) Proliferation, indicated by Ki67-positivity indicates the normal proliferation in newborn Alfy GT mice. Boxed regions highlight the sub-ventricular zone (VZ) and are shown at higher magnification in images below. Stereology was performed to quantify the number of Ki67 positive cells in the sub-VZ (Gundersen Coeffecient of Error = 0.15, Ctrl (wildtype littermate, n = 3) = 187,221 cells, S.D. = 19,634 compared to Alfy GT (n = 3) = 179,074 cells, S.D. = 28,917, t(4) = 0.40, p = 0.71.) (E) Immunohistochemistry (brown) against cleaved caspase-3 reveals no significant difference in cell death at embryonic age E15.5 in the absence of Alfy. The enlarged images of the inset for the images are provided immediately below. No cell loss was detected in cortex at this age. As a positive control, the naturally occurring cell death observed in the trigeminal ganglia at this age is included (leftmost panels). No difference was observed across genotype (n = 2 WT, 2 Alfy GT Het; 3 Alfy GT). Tissue sections are counterstained with Nissl, which is shown in purple.
Figure 4—figure supplement 2
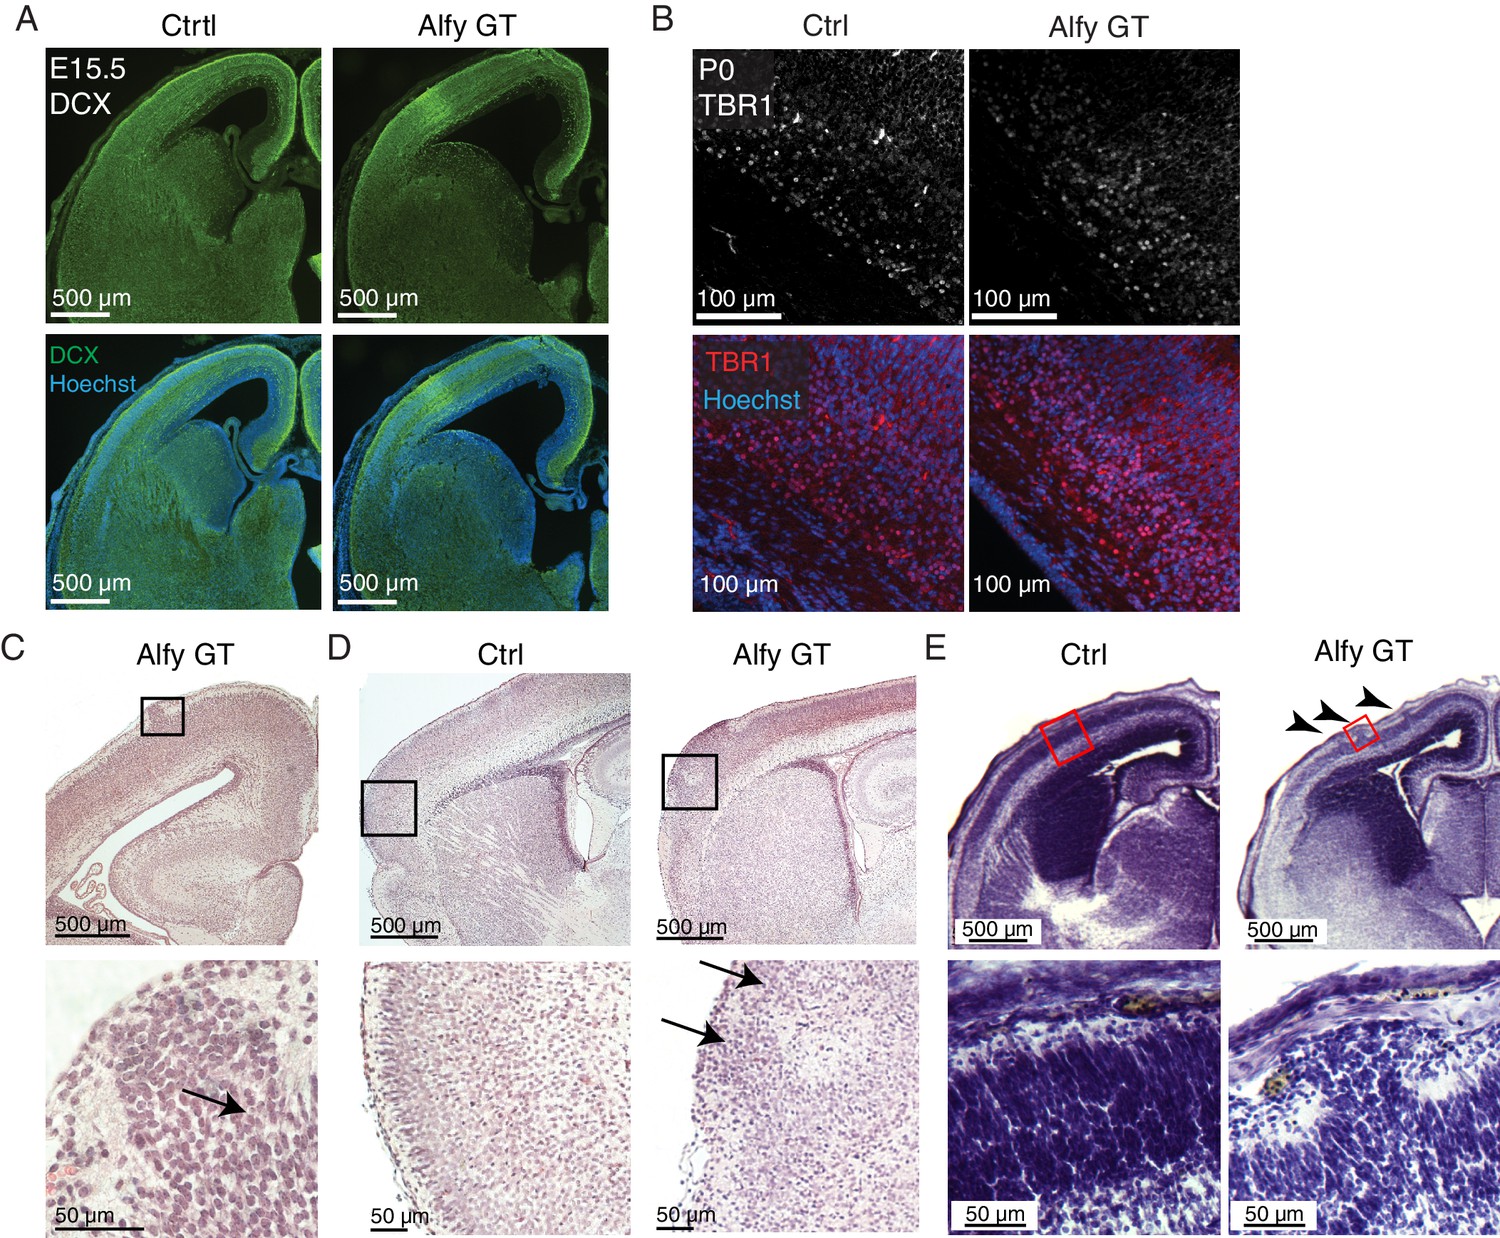
Focal cortical dysplasias are observed in Alfy GT brains.
(A) No gross difference in Doublecortin (DCX, green) staining can be observed in E15.5 Alfy GT brains (n = 3) compared with littermate controls (Ctrl, n = 3). (B) Specification of deep layer, Tbr1-positive cortical projection neurons are observed in Alfy GT mice when compared to littermate controls (Ctrl). Three mice per genotype were stained Tbr1 (Top, red) and counterstained with Hoeschst 33342 (bottom, blue), and all mice demonstrated this pattern. (C–E) Focal cortical dysplasia (FCD) in Alfy null brains. H&E staining reveals the presence of FCD in coronal (C) and sagittal (D) sections of Alfy GT brains. Boxed areas are shown at higher magnification below. FCDs are labeled with arrows. (E) FCDs can be detected by Nissl staining as early as E15 in Alfy GT mice (6/6) but not in control embryos (0/6). Arrowheads point to multiple FCDs located within the same hemisphere of an Alfy GT embryo.
Figure 5 with 1 supplement
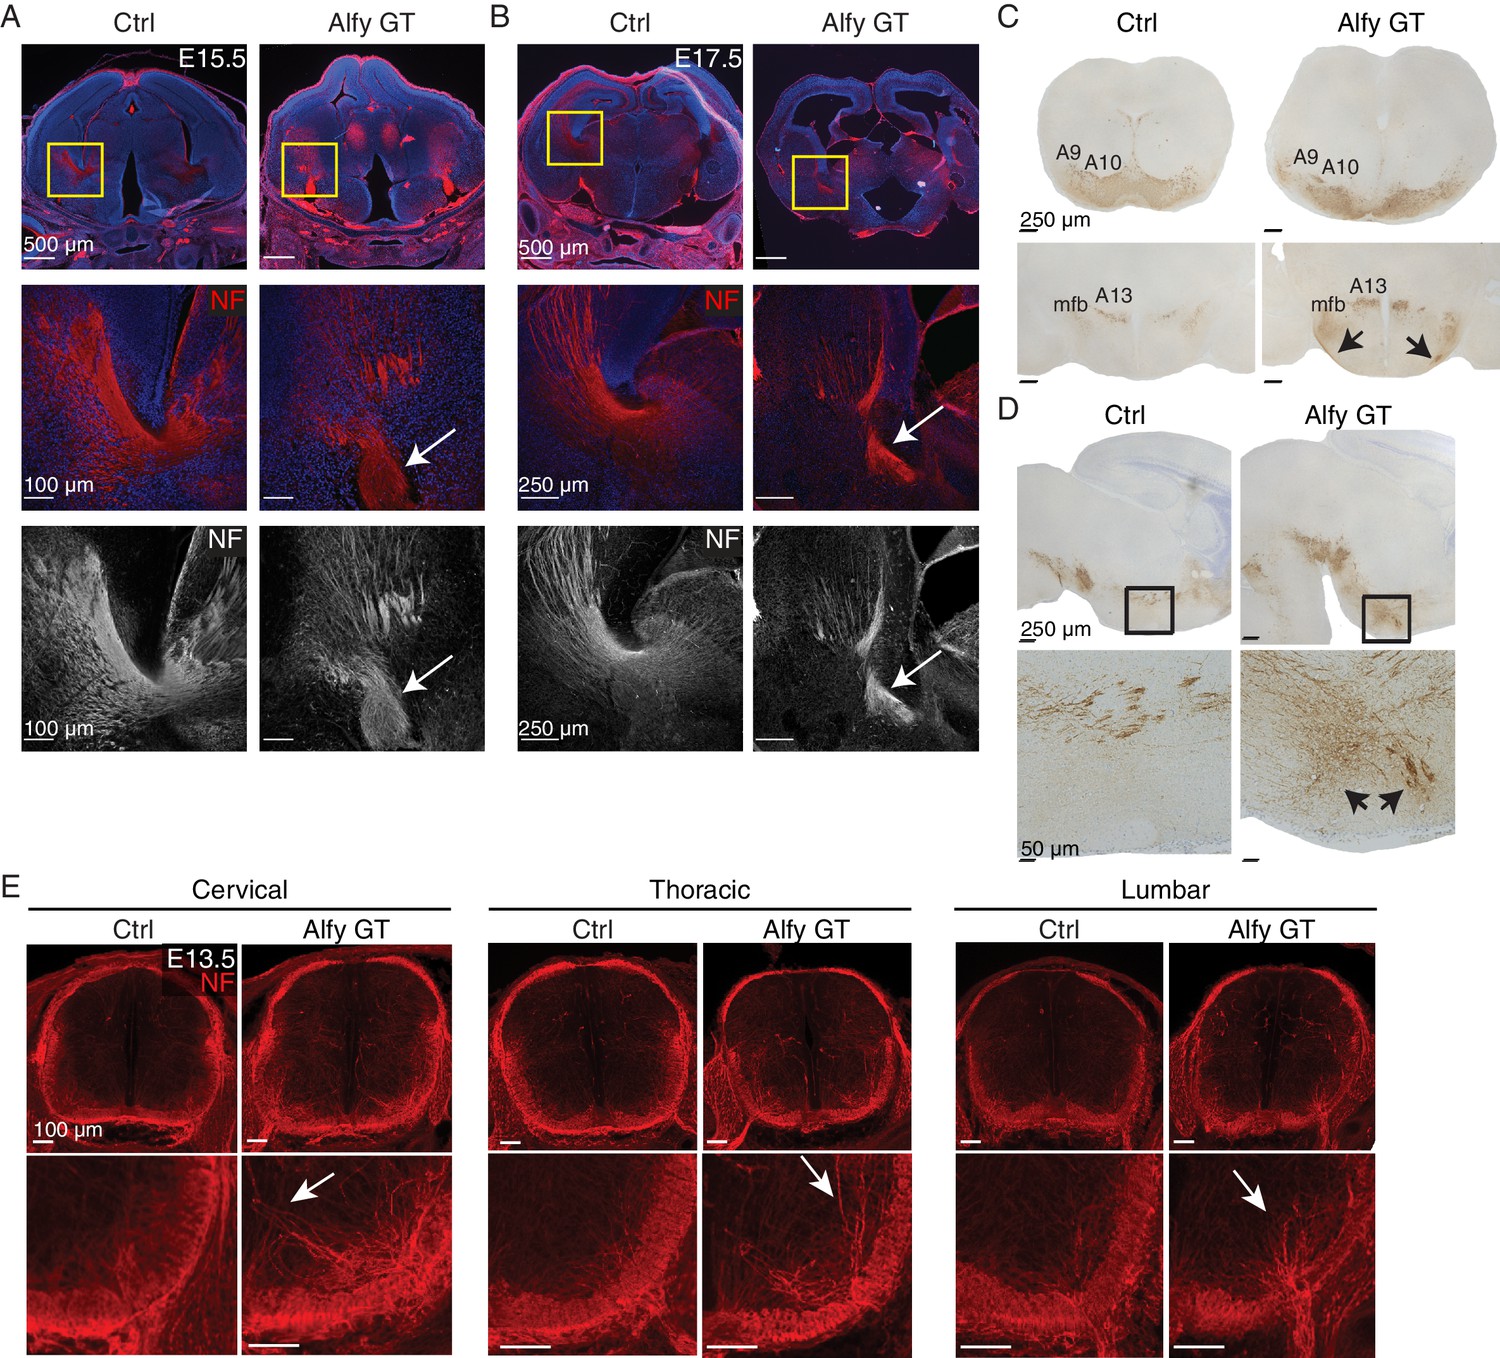
Axonal tracts develop abnormally in the Alfy mutant brain and spinal cord.
(A,B) Coronal sections of diencephalon at (A) E15.5 (n = 3/genotype) and (B) E17.5 (n = 3/genotype) stained for neurofilament (NF, red) and counter-stained with the nuclear stain Hoechst 33342 (blue). The developing internal capsule is highlighted with a yellow box (top) and higher magnification, confocal images of NF staining are shown with (middle) and without (bottom) Hoechst 33342. In control brains (Ctrl), axons that comprise the internal capsule form a fan-shaped projection of bundled axons within the ganglionic eminence. The abnormal, ventrally displaced, knot-like bundles of axons found in Alfy GT are marked with white arrows. Neural cell adhesion molecular L1 (NCAML1) staining reveals similar defects (Figure 5—figure supplement 1). (C,D) TH staining reveals abnormal projections in DAergic cell populations. (C) Coronal sections. A9 and A10 DAergic populations are present in Alfy GT brains appear immature (top). The hypothalamic A13 DAergic cell population and medium forebrain bundle (mfb) are present in the diencephalon in Alfy GT brains; however aberrant projections into the hypothalamus and abnormal midline-crossing events are observed (arrows, bottom). n = 3/genotype. (D) Sagittal sections counterstained with Nissl. In Alfy GT brains, the mfb has ectopic ventral projections into the hypothalamus (arrows, bottom). Boxed regions are shown at higher magnification below. n = 3/genotype. (E) NF staining of E13.5 cervical spinal cord. Coronal sections are shown. Higher magnification images of the dorsal spinal cord are shown below. The abnormal NF patterning observed in Alfy GT embryos is highlighted with white arrows. n = 3/genotype.
Figure 5—figure supplement 1
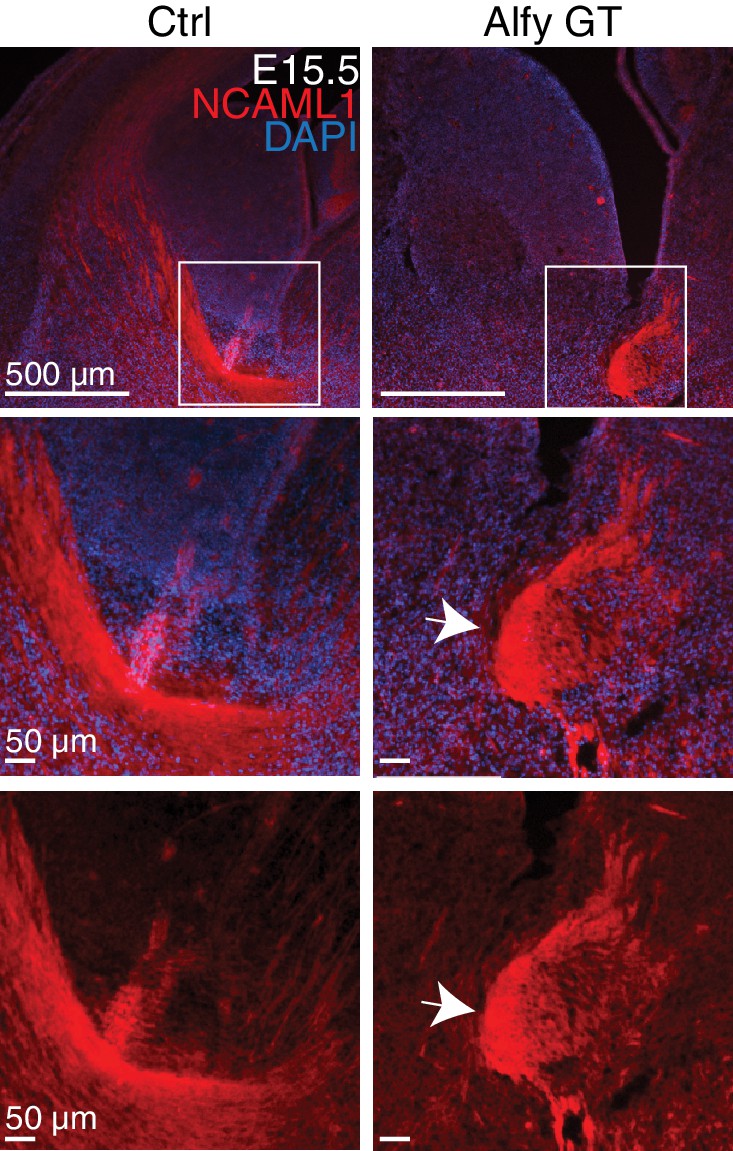
NCAML1 staining confirms axonal defects of the internal capsule in the developing Alfy GT brain.
Immunofluorescence against NCAML1 (red) in E15.5 brains counterstained with Hoechst 33342 (blue)(top). Boxed areas are shown at higher magnification with and without the counterstain (bottom). Arrow indicates abnormal bundle-like structures formed by the projections in the Alfy GT brain. n = 4 littermate controls, 4 Alfy GT.
Figure 6 with 2 supplements
Alfy localizes to axons and enriches to membrane fractions.
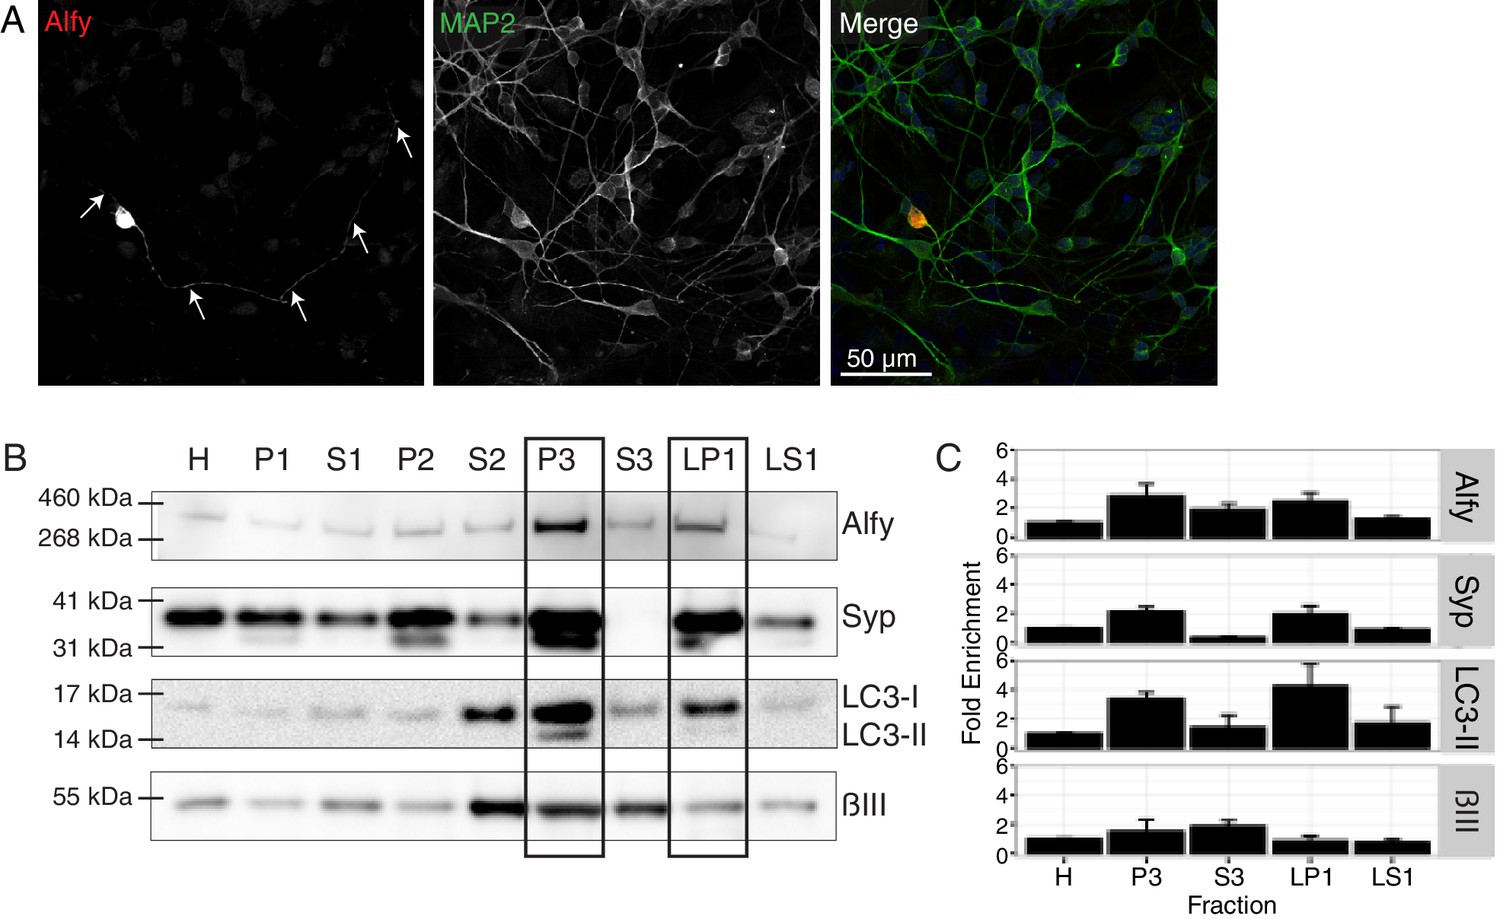
(A) Immunofluorescence images showing MAP2-positive neurons expressing Alfy. Merged color image demonstrates co-localization of mCherry-Alfy within a MAP2-positive neuron. Alfy is found within the soma and co-localizes with MAP2 positive projections. Transfections were replicated three times across three independent cultures. Colocalization to βIII Tubulin projections is shown in Figure 6—figure supplement 1. (B,C) Fractionation of adult cortical lysates reveals that Alfy enriches into membrane fractions. (B) Equal amounts of protein per fraction were analyzed by immunoblotting. Alfy was present in membrane fractions that also enriched with LC3-II and synaptophysin (P3, LP1; boxes. (C) The fold enrichment measured relative to the total homogenate fraction (H). Bars represent mean enrichment (n = 3) ± SEM. A schematic depiction of the fractionation can be found in Figure 6—figure supplement 2.
Figure 6—figure supplement 1
Alfy is expressed in the soma and axons of neurons.
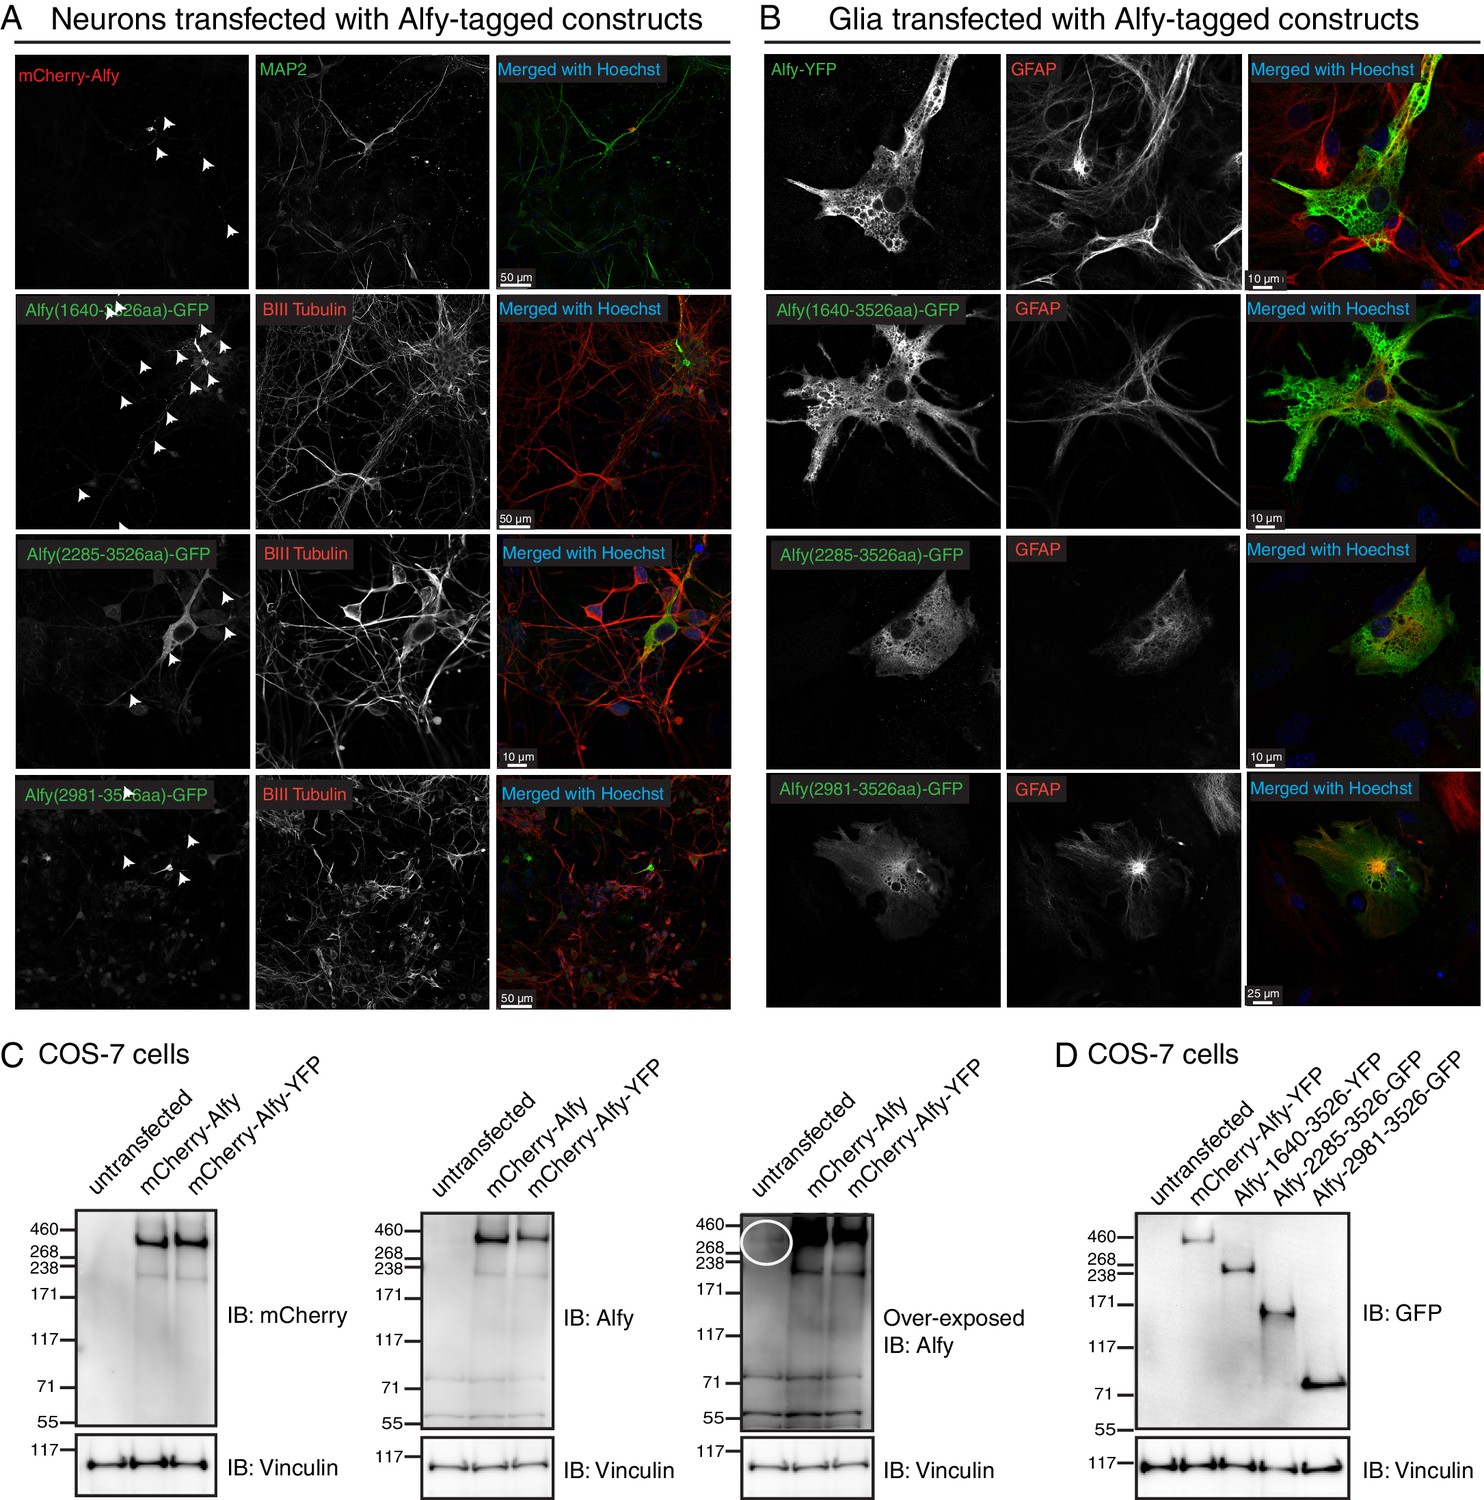
(A,B) Alfy control mixed primary cortical cultures were transfected with plasmids containing full-length or truncated tagged-Alfy cDNA. (A) Representative confocal images are shown of Alfy-tagged constructs detected with antibodies directed against the fluorophore tag and co-stained MAP2 or BIII tubulin. Full-length and C-terminal fragments of Alfy are detected throughout MAP2- and BIII tubulin-positive projections (arrows). (B) Representative confocal images are shown of Alfy-tagged constructs detected with antibodies directed against the fluorophore tag (left) and co-stained with GFAP. Alfy are expressed throughout astroglia, although large vesicles and the nucleus are devoid of staining. Studies were replicated across three independent cultures. (C,D) To determine the sub-cellular distribution of Alfy, Alfy KO or Ctrl (A,B) mixed primary cortical cultures were transfected with plasmids containing full-length tagged-Alfy. To confirm transfection, COS-7 cells were transfected in parallel and immunoblotted. Vinculin is shown as a loading control. (C) Full-length Alfy-tagged proteins migrate at the expected size and are detected with anti-mCherry and anti-Alfy antibodies. Over-exposed images are necessary to show endogenous Alfy, since it is at a much lower abundance in non-neuronal cells (circle). (D) Full length and truncated constructs of Alfy. Studies were replicated across three cultures.
Figure 6—figure supplement 2
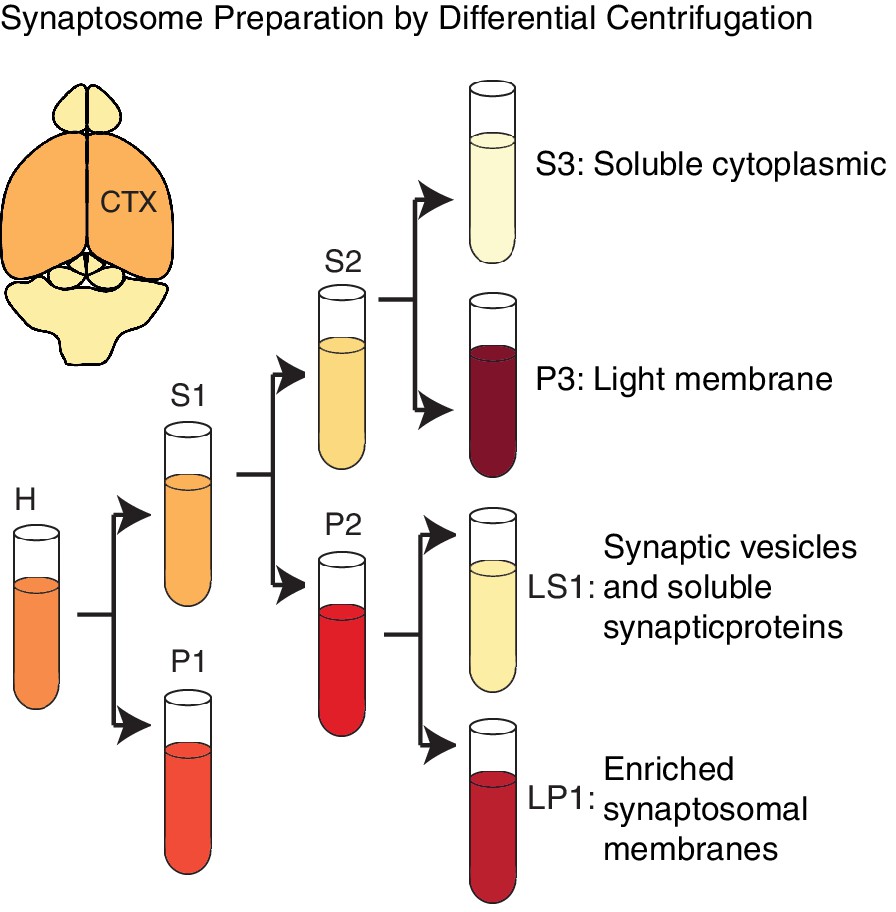
Alfy enriches in membrane fractions from brain.
A schematic depiction of the modified synaptosome preparation used for Figure 6A, based on a previously published protocol (Hallett et al., 2008). Abbreviations: H, homogenate; P1, nuclei and large debris; S1, soluble cytoplasmic; P2, crude synaptosomal membranes; S2, soluble cytoplasmic; P3, light membrane; S3, soluble cytoplasmic; LP1, enriched synaptosomal membranes; LS1, synaptic vesicles and synaptic proteins.
Figure 7 with 2 supplements
Alfy is required for the ability of axons to respond to Netrin-1.
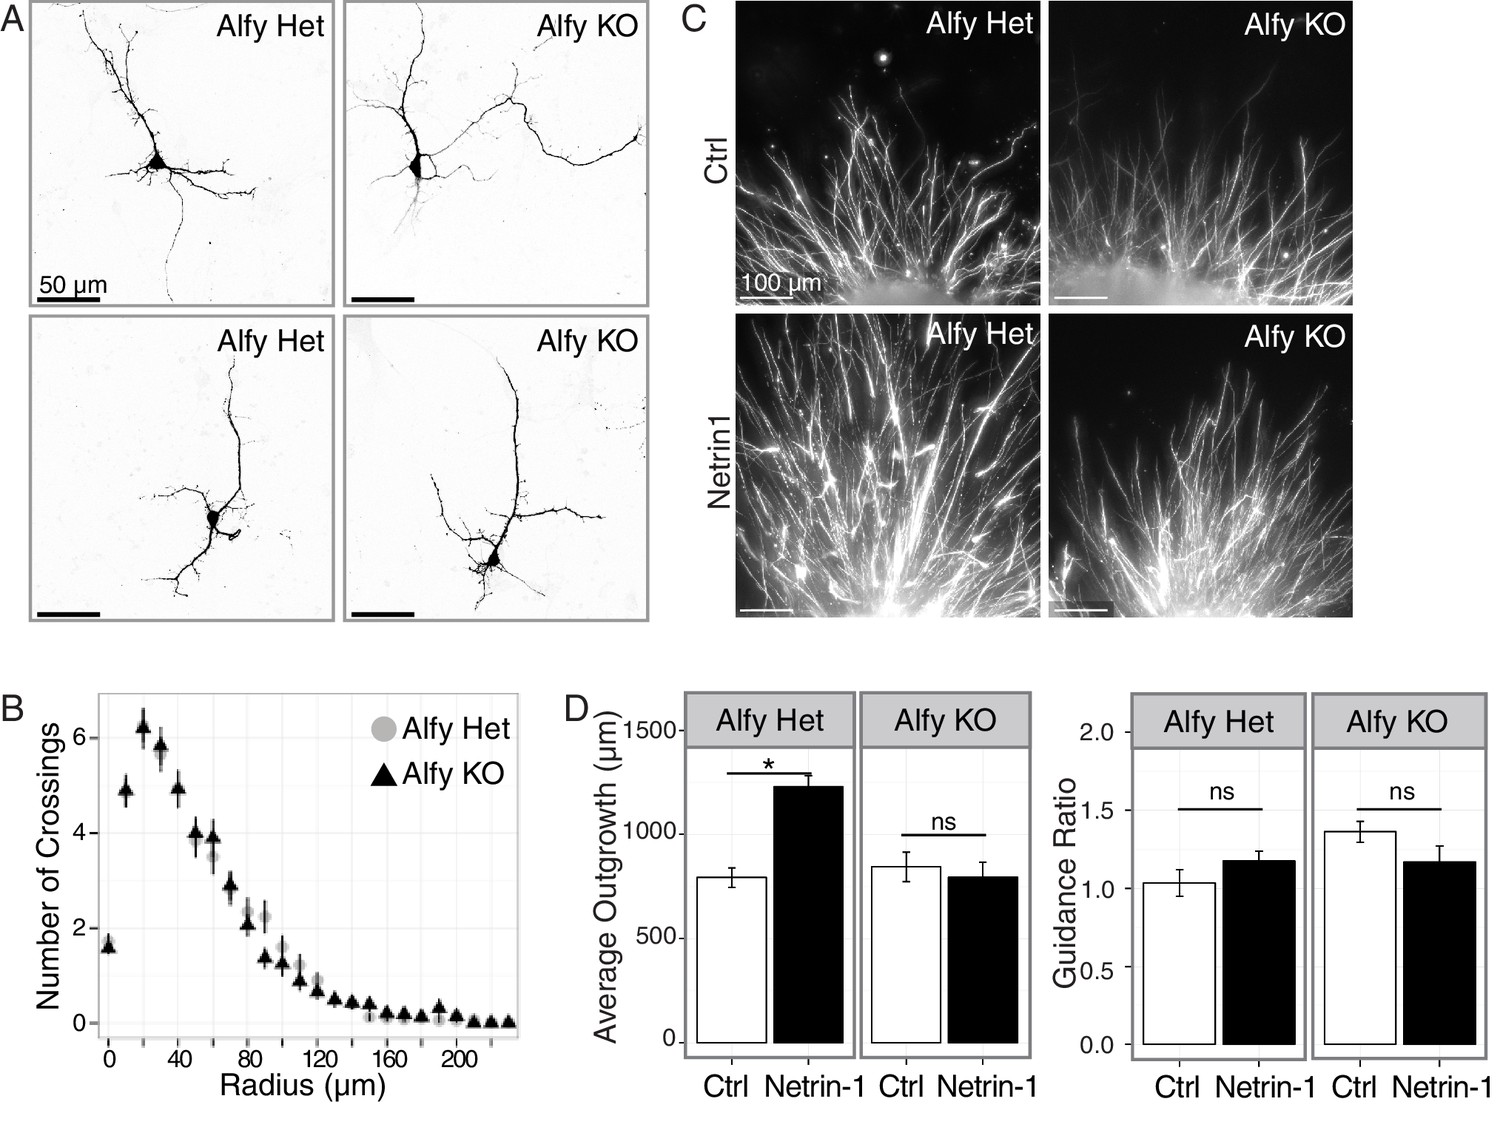
(A,B) Primary cortical neurons are morphologically similar across genotype. (A) Individual, GFP-transfected neurons were imaged by confocal microscopy and traced in ImageJ. Representative maximum projection images of two heterozygous (Het, n=5 brains) and two Alfy KO neurons (n = 5 brains) are shown. Neuronal cytoskeletal markers are expressed comparably across genotype (Figure 7—figure supplement 1A,B). (B) Scholl analysis of neurons at DIV7 as represented in A. One-way ANOVA revealed no effect of genotype on the number of crossings (n = 50 neurons/genotype; F(1,97) = 0.66, p = 0.41). Analysis of branching (Figure 7—figure supplement 1C) similarly showed no effect of genotype. (C,D) Alfy KO cortical explants have attenuated responsiveness to Netrin-1. (C) Representative images of Alfy Het or Alfy KO cortical explants in the presence of control (Ctrl) or Netrin-1 as described (Figure 7—figure supplement 2) and stained with βIII Tubulin. (D) Quantification of the average length of outgrowth after 72 hr in culture on data collected from 54 explants (Alfy Het treated with Ctrl: n = 15; Alfy Het treated with Netrin-1: n = 12; Alfy KO treated with Ctrl = 12, Alfy KO treated with Netrin-1: n = 15), from two litters of mice. A two-way ANOVA revealed a significant effect of genotype (F(1,50) = 7.69, p < 0.01) and the presence of Netrin-1 (F(1,50) = 7.71, p < 0.01) on outgrowth, as well as a significant interaction between genotype and Netrin-1 exposure (F(1,50) = 12.29, p < 0.001). Fisher PLSD post hoc analysis revealed that exposure to Netrin-1 resulted in a significant increase in outgrowth in Alfy Hets (p < 0.001), but not in Alfy KO (p = 0.56). Under control conditions, there is no difference in the amount of outgrowth between the genotypes (p = 0.56). Netrin-1 attractive guidance was also assessed by determining the Guidance Ratio, which is achieved by measuring the amount of outgrowth from the side of the explant closest to the cue-expressing cell block (proximal) over the amount of growth on the side of the explant furthest from the cell block (distal). Under the conditions of our assay, directional growth in response to Netrin-1 was not observed in the control explants (t(25) = 1.98, p = 0.059) or KO explants (t(22) = 1.77, p = 0.091), suggesting that under the conditions of our assay HEK293T cells secrete Netrin-1 above the threshold for selectively promoting attractive guidance. Similar results were achieved after 48 hr in culture. Bars represent mean ± SEM. *, p < 0.001; ns, not significant.
Figure 7—figure supplement 1
Primary cortical neurons are similar across genotype.
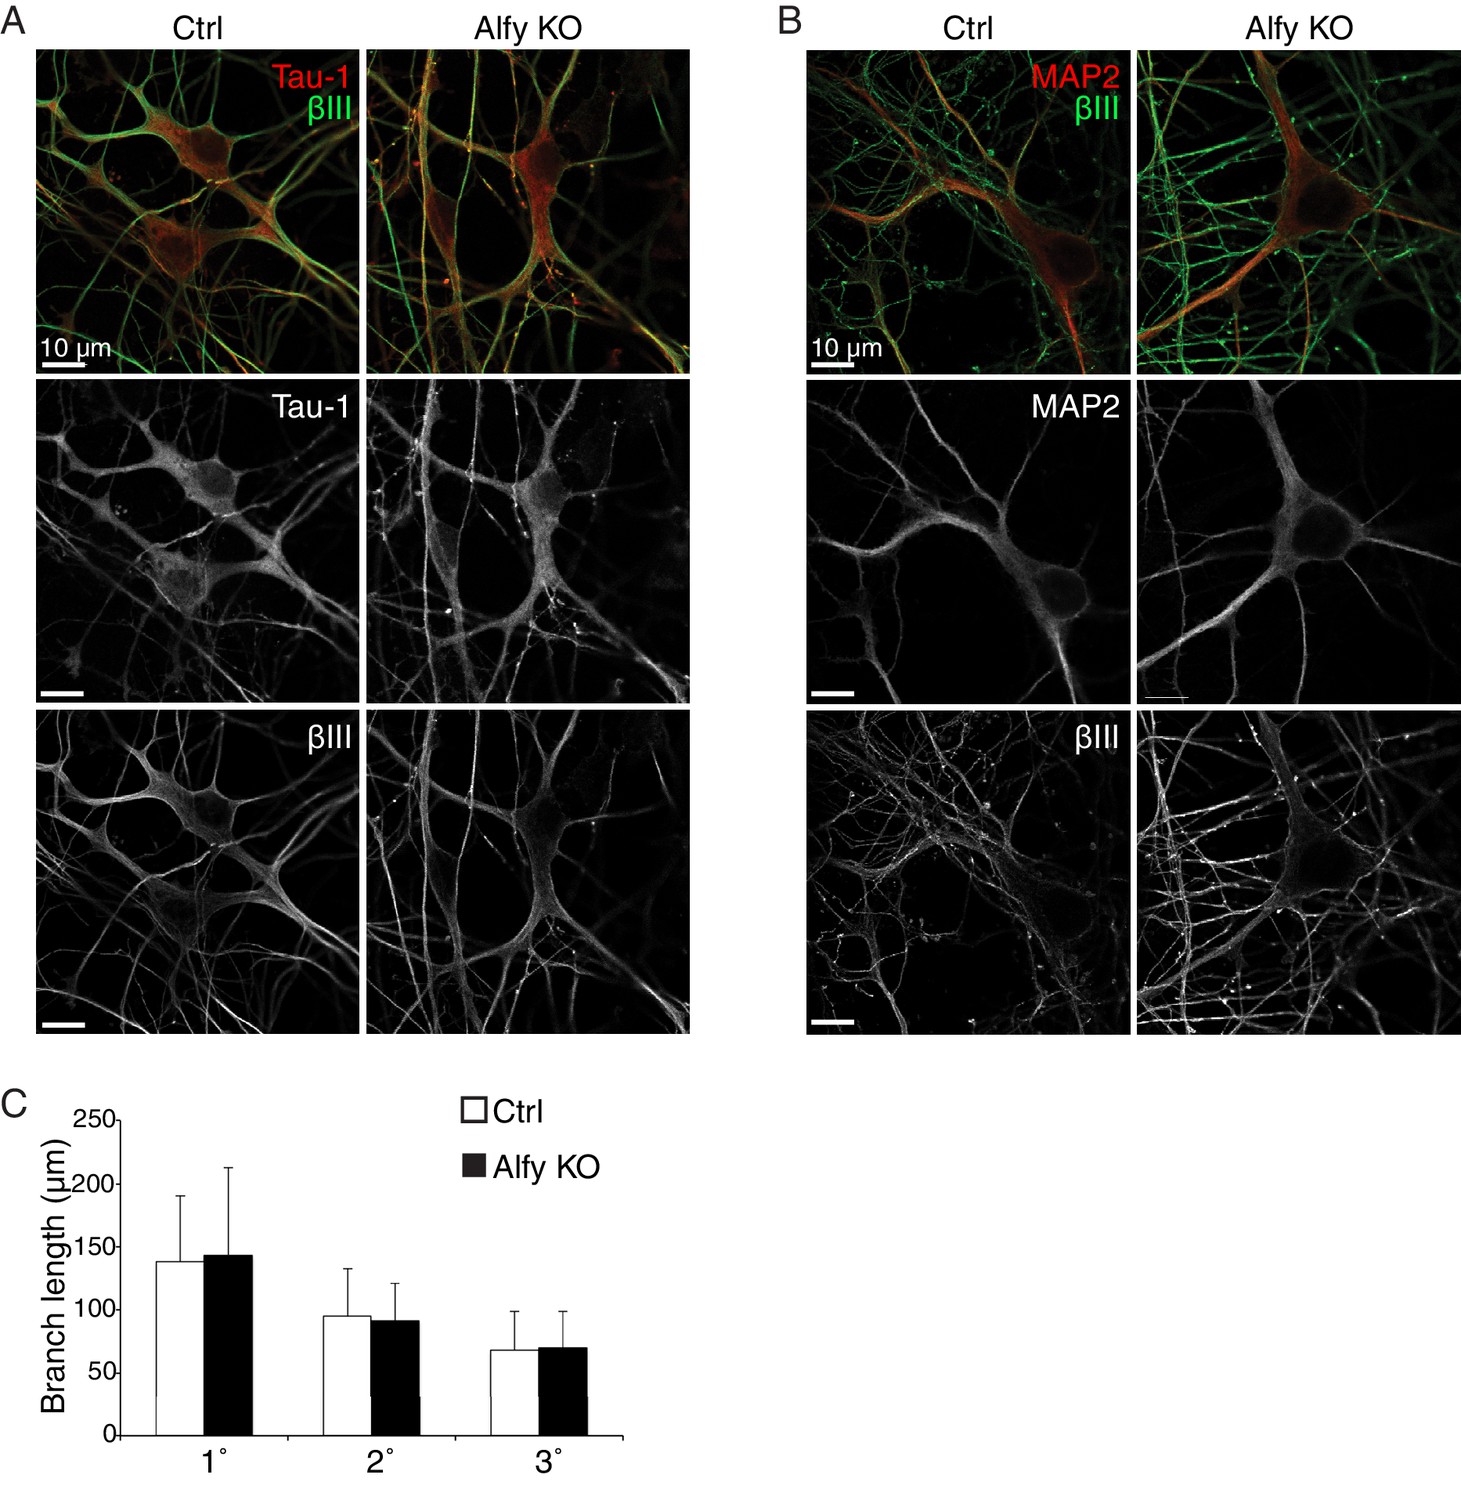
(A,B) The loss of Alfy does not affect the growth and differentiation of dissociated neurons in culture. Day in vitro 7 (DIV7) neurons from Ctrl and Alfy KO mice express cytoskeletal markers (A) Tau-1 (red) or (B) MAP2 (red) and βIII Tubulin (βIII, green) positive processes. Merged images are shown in the top panel, whereas individual channels for each fluorophore are shown in grayscale images below. Representative images shown from three independent cultures generated from Alfy Het or Alfy KO brains. (C) The loss of Alfy had no effect on neurite outgrowth in dissociated cortical neurons. A one-way ANOVA reveals no significant difference across genotype (F(1,97) = 0.19, p = 0.66). Data represented as mean ± St. Dev. Cortical cultures were prepared from five independent cultures with 10 neurons/culture/genotype imaged, resulting in 50 Alfy Het and 50 Alfy KO neurons analyzed.
Figure 7—figure supplement 2
Responsiveness to guidance cues is attenuated in Alfy KO axons.
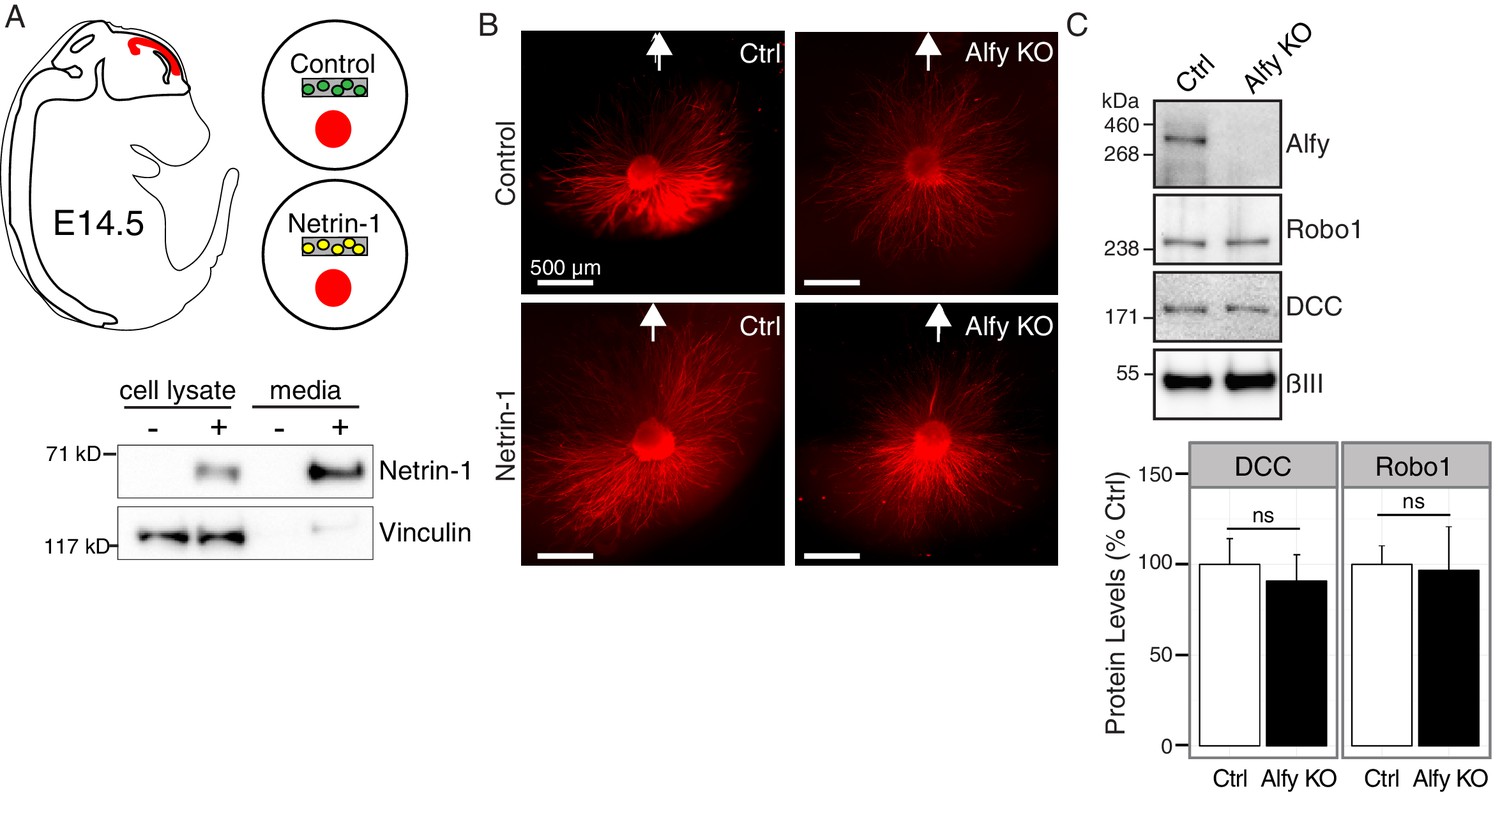
(A,B) Cortical explant culture to examine axon outgrowth in response to Netrin-1 as described in Figure 7C,D. (A) Diagram of an E14.5 embryo with developing cerebral cortex highlighted in red. Cortical explants were co-cultured with agarose-embedded HEK293T cells that were mock transfected (Control) or transfected with Netrin-1-Myc (Netrin-1). Transiently transfected HEK293T cells robustly secrete Netrin-1-MYC into the culture media as revealed by immunoblotting for the MYC tag. Probing for the cytoskeletal protein Vinculin demonstrates that the culture media fraction is predominately cell-free. (B) Low-power images, stitched together to show the entire amount of outgrowth after 72 hrs in culture, from cortical explants stained with βIII Tubulin (red) in the presence of control or Netrin-1 expressing HEK293T cells (location of HEK293T cells denoted by white arrow). (C) The loss of Alfy does not affect guidance cue receptor levels in the telencephalon. Lysates prepared from E14.5 telencephalon were probed on a Western blot with antibodies directed against Alfy, Robo1, DCC. The amount of DCC and Robo1 in Alfy KO telencephalon was equivalent to the abundance of the receptors detected in Alfy control samples (DCC: t(5) = 0.45, p = 0.67; Robo1: t(4) = 0.13, p = 0.90).-
Figure 8 with 1 supplement

Alfy is an adaptor protein for selective macroautophagy (A–D) Non-selective macroautophagy proceeds normally in the absence of Alfy.
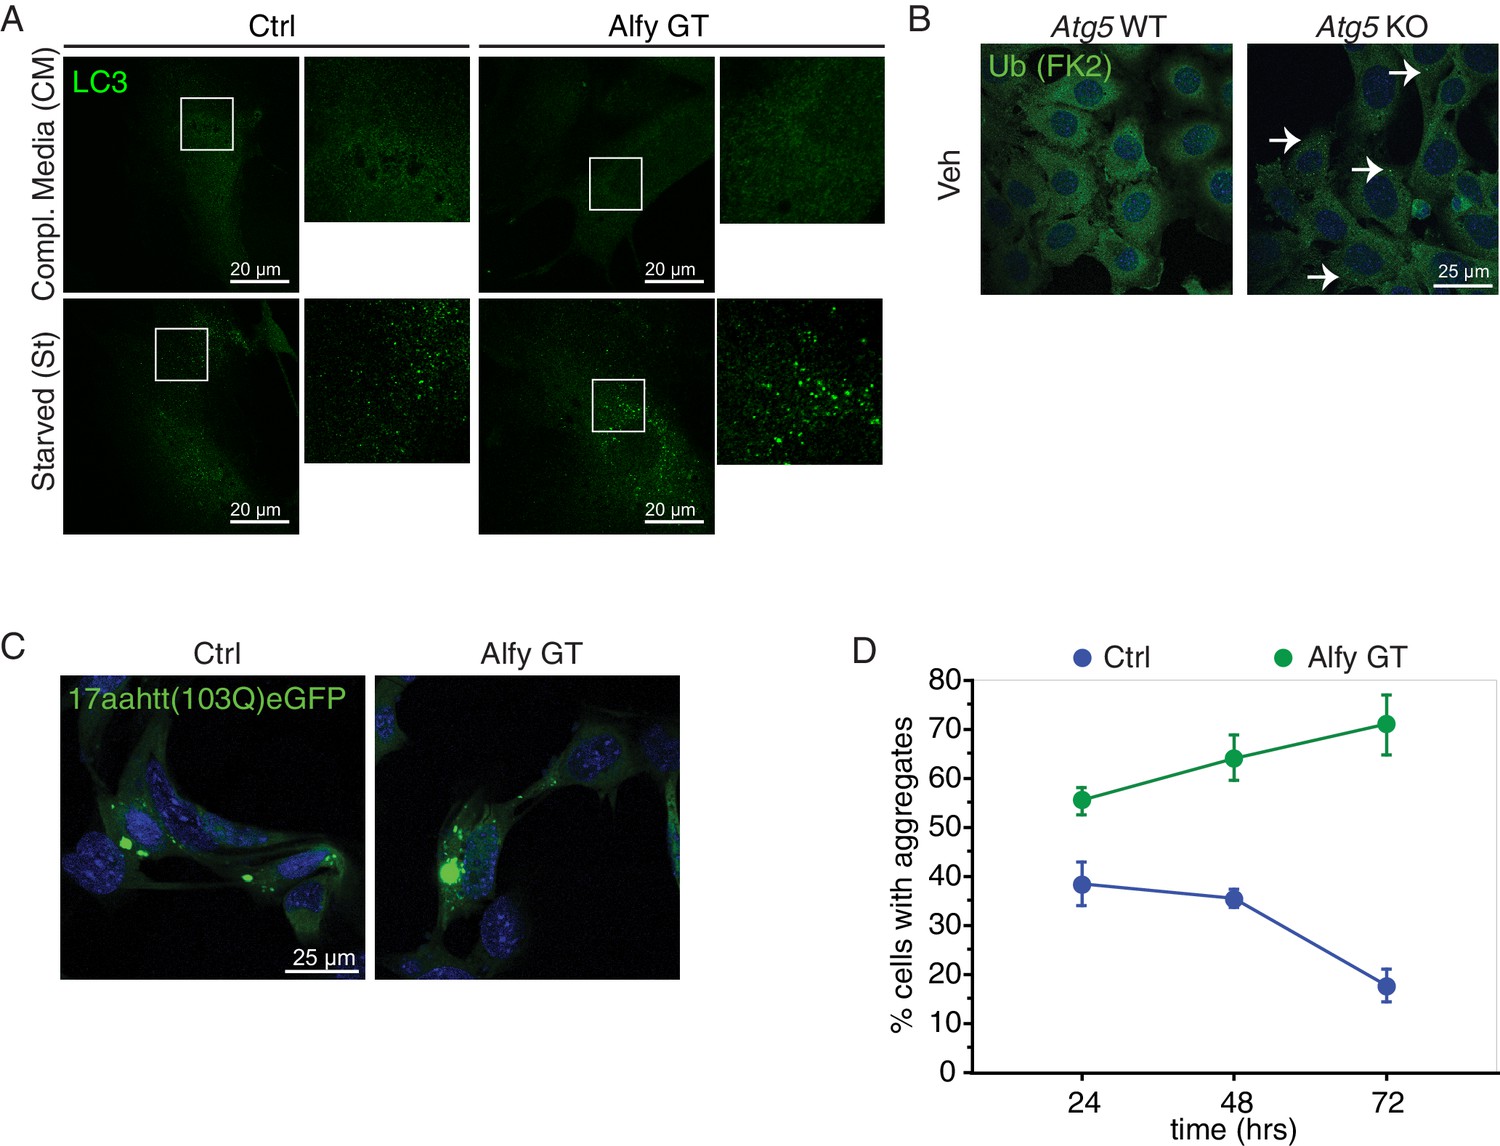
(A) Liver lysates from perinatal Alfy GT pups reveal greater LC3 conversion to LC3-II, reflecting the starvation response due to their inability to feed properly (Figure 2E). Lysates from normally fed WT and heterozygous littermates mice predominantly contain LC3-I. The bottom graphs quantify LC3 conversion as the ratio of LC3-II/LC3-I. Bars represent mean ± St. Dev. ANOVA reveals a significant effect of genotype on LC3 conversion (n = 7 WT, 6 Alfy GT Het, 6 Alfy GT; F(2,16) = 11.07; p < 0.001). Fisher PLSD post hoc analyses indicate that LC3 conversion of Alfy GT mice differed significantly from mice with at least one copy of Alfy. (B) In the brain, there is no abnormal accumulation of LC3-II in the Alfy GT mice, suggesting that autophagosome maturation proceeds normally. A single-factor ANOVA reveals no significant difference between the three genotypes (n = 5/genotype; F(2,12) = 5.52; p = 0.90). (C) Macroautophagic protein degradation in response to starvation is normal in the absence of Alfy. Long lived protein degradation assay. (LC3 puncta formation is shown in Figure 8—figure supplement 1A). A two-factor ANOVA revealed a significant main effect for treatment (n = 4/genotype; F(2,27) = 24.93, p < 0.001), but no significant effect of genotype on percent (%) Proteolysis (n = 4/genotype; F(2,27) = 1.82, p = 0.18). Fisher PLSD post hoc analysis revealed % Proteolysis was significantly increased in all genotypes during starvation compared with complete media (p < 0.001) and the addition of 5 mM 3MA significantly attenuated the starvation-induced proteolysis (p < 0.001). (D) In the absence of Alfy, LC3 conversion is normal in primary neurons in response to trophic factor withdrawal (n = 4/genotype). To accumulate LC3-II, cells were starved in the presence of 20 µM leupeptin. (E) The loss of Alfy impedes the selective macroautophagic turnover of its cargo, ALIS. Although ubiquitinated structures are readily found when all forms of macroautophagy is impeded (Figure 8—figure supplement 1B), the turnover of only specific cargoes is affected by the loss of Alfy. Primary Alfy GT versus Alfy heterozygous (HET) MEFs after 72 hr of Veh or 5 μM AraC. Ubiquitin-positive ALIS bodies form in response to mitotic inhibition, as revealed by FK2 immunofluorescence (green). In the absence of Alfy, these structures accumulate more rapidly (white arrows). n = 3. Similar Alfy dependence can be observed with the aggregation prone expanded polyQ proteins (Figure 8—figure supplement 1C,D). For all graphs, bars represent mean ± SEM. ns, not significant; *, p < 0.05.
Figure 8—figure supplement 1
Alfy is an adaptor for selective macroautophagy.
(A) In the presence of complete media, LC3 immunoreactivity (green) produces a diffuse staining pattern throughout the cytoplasm. When MEF cultures are starved by incubation in HBSS, LC3 reactivity becomes localized to distinct puncta regardless of genotype, suggesting the formation of LC3-positive autophagosomes (n = 4). (B) The inhibition of macroautophagy leads to ALIS body accumulation in the absence of stress. Immortalized Atg5 KO MEFs (Kuma et al., 2004) demonstrate the accumulation of ubiquitin positive aggregates (white arrows) under basal conditions as revealed by FK2 antibody (green) (n = 3). (C,D) The selective macroautophagy cargo, expanded polyglutamine inclusion, accumulates more rapidly in the absence of Alfy. Transient transfection of 17aahtt103Q-eGFP in Ctrl and Alfy GT MEFs. Aggregation over time is quantified in (D). The percentage of transfected cells with aggregates is higher in the Alfy GT MEFs compared with Ctrl. Repeated measures ANOVA revealed a significant difference of genotype in the% transfected cells with aggregate genotype (n = 3/genotype; F(1,8) = 154.643, p = 0.002), and a significant interaction between time and genotype (n = 3/genotype; F(2,8) = 55.332, p < 0.0001). Post hoc analyses (Fisher PLSD) revealed that in Ctrl MEFs, ‘% transfected cells with agg’ do not change between 24 and 48 hr (p = 0.4144), but decrease after 72 hr (p = 0.005). In contrast, in Alfy GT MEFs, ‘% transfected cells with agg’ continuously increase over time (comparison between 24 and 48 hr, p = 0.0047; comparison between 48 and 72 hr, p = 0.0105). Scale bar = 25 μm. Data represent mean ± St. Dev.
Videos
Video 1
Mice lacking Alfy have an abnormal righting reflex.
https://doi.org/10.7554/eLife.14810.008Download links
A two-part list of links to download the article, or parts of the article, in various formats.
Downloads (link to download the article as PDF)
Open citations (links to open the citations from this article in various online reference manager services)
Cite this article (links to download the citations from this article in formats compatible with various reference manager tools)
Autophagy linked FYVE (Alfy/WDFY3) is required for establishing neuronal connectivity in the mammalian brain
eLife 5:e14810.
https://doi.org/10.7554/eLife.14810


