Golgi self-correction generates bioequivalent glycans to preserve cellular homeostasis
- University of California, United States
- Imperial College London, United Kingdom
Figures
Figure 1 with 1 supplement
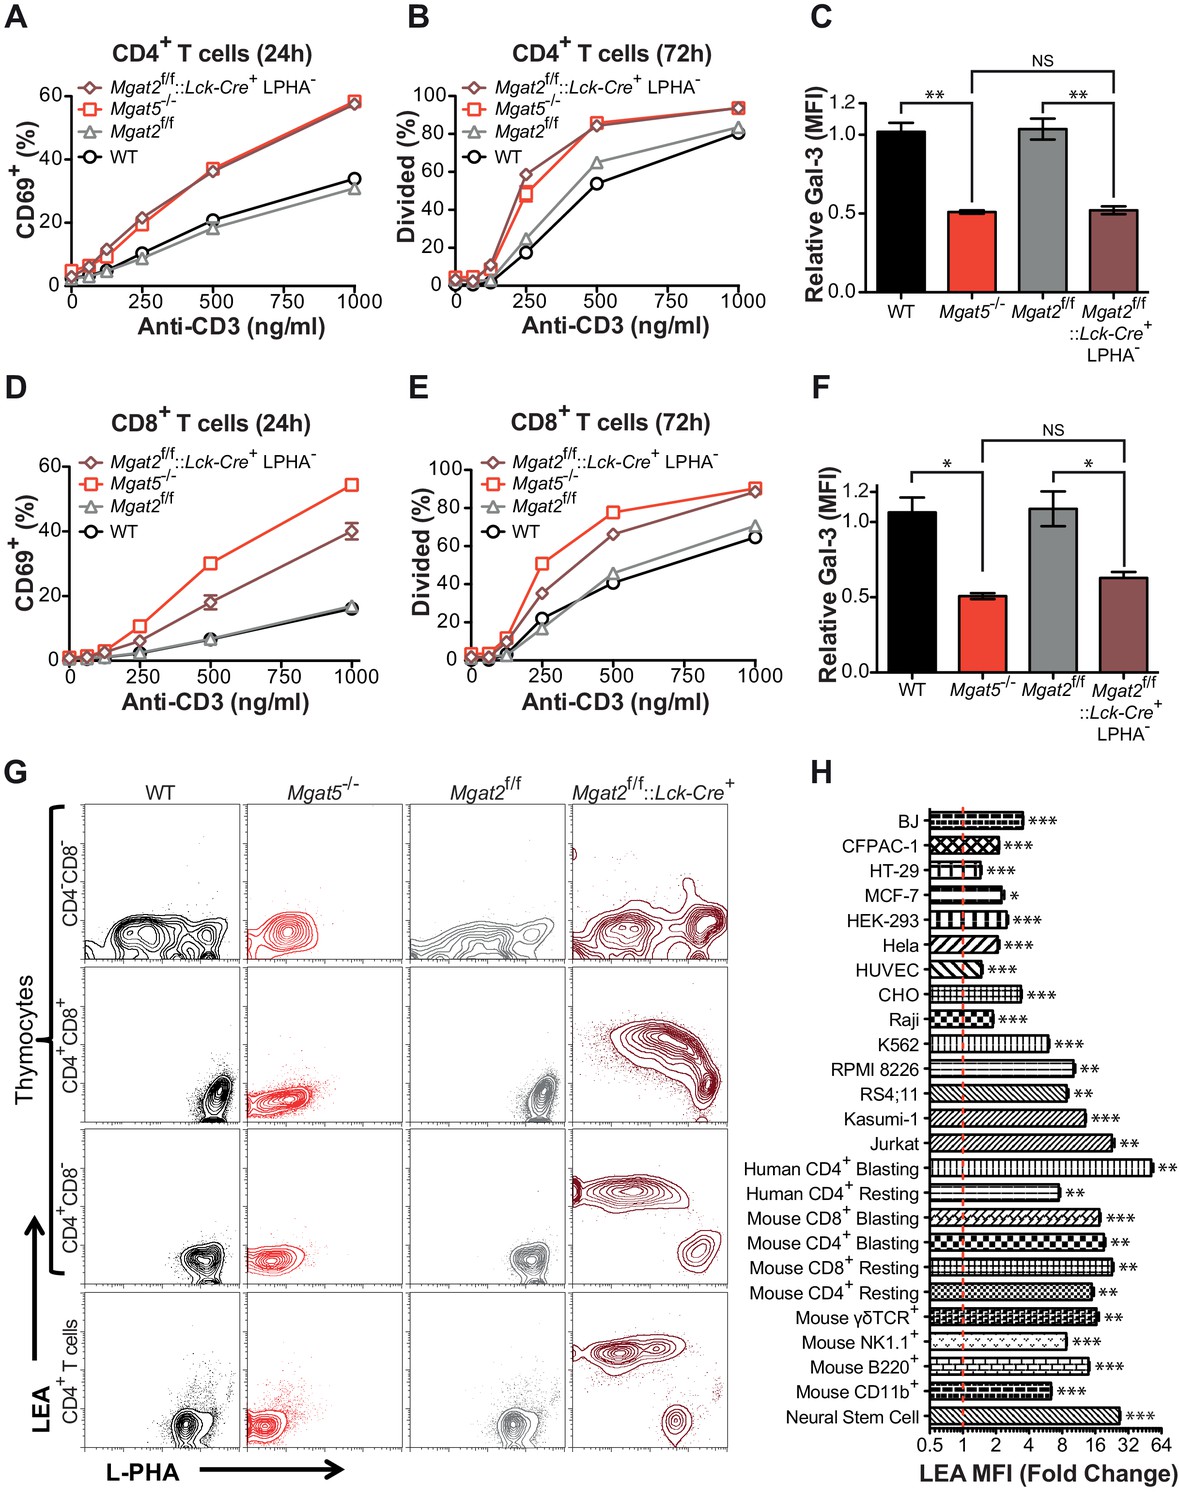
Compensation limits hyperactivity of Mgat2 deficient T cells.
(A, B, D and E) T cells were activated with plate bound anti-CD3 for 24 (A and D) or 72 (B and E) hours. CD4+ (A and B) or CD8+ (D and E) cells were analyzed for CD69 expression (A and D) or 5, 6-carboxyfluorescein diacetate succinimidyl ester (CFSE) dilution (B and E) by flow cytometry, gating on L-PHA- cells where indicated. (C and F) T cells were analyzed for galectin-3 binding by flow cytometry, gating on CD4+ (C) or CD8+ (F) cells and L-PHA- cells where indicated. Normalized geometric mean fluorescence intensity (MFI) is shown. Each mutant was normalized to its control. (G) Thymocytes and splenic T cells were analyzed for L-PHA and LEA binding by flow cytometry. (H) Cells were treated in culture with or without 500 nM SW for 72 hr followed by analysis of LEA binding by flow cytometry. Fold increase in LEA MFI of the SW treated sample compared to the untreated sample is presented. The red line marks one fold or no change. NS, not significant; *p<0.05; **p<0.01; ***p<0.001 (unpaired two-tailed t-test with Welch’s (C, F and H) and Bonferroni correction (C and F)). Data show one experiment representative of at least three independent experiments. Error bars indicate mean ± s.e.m.
Figure 1—figure supplement 1
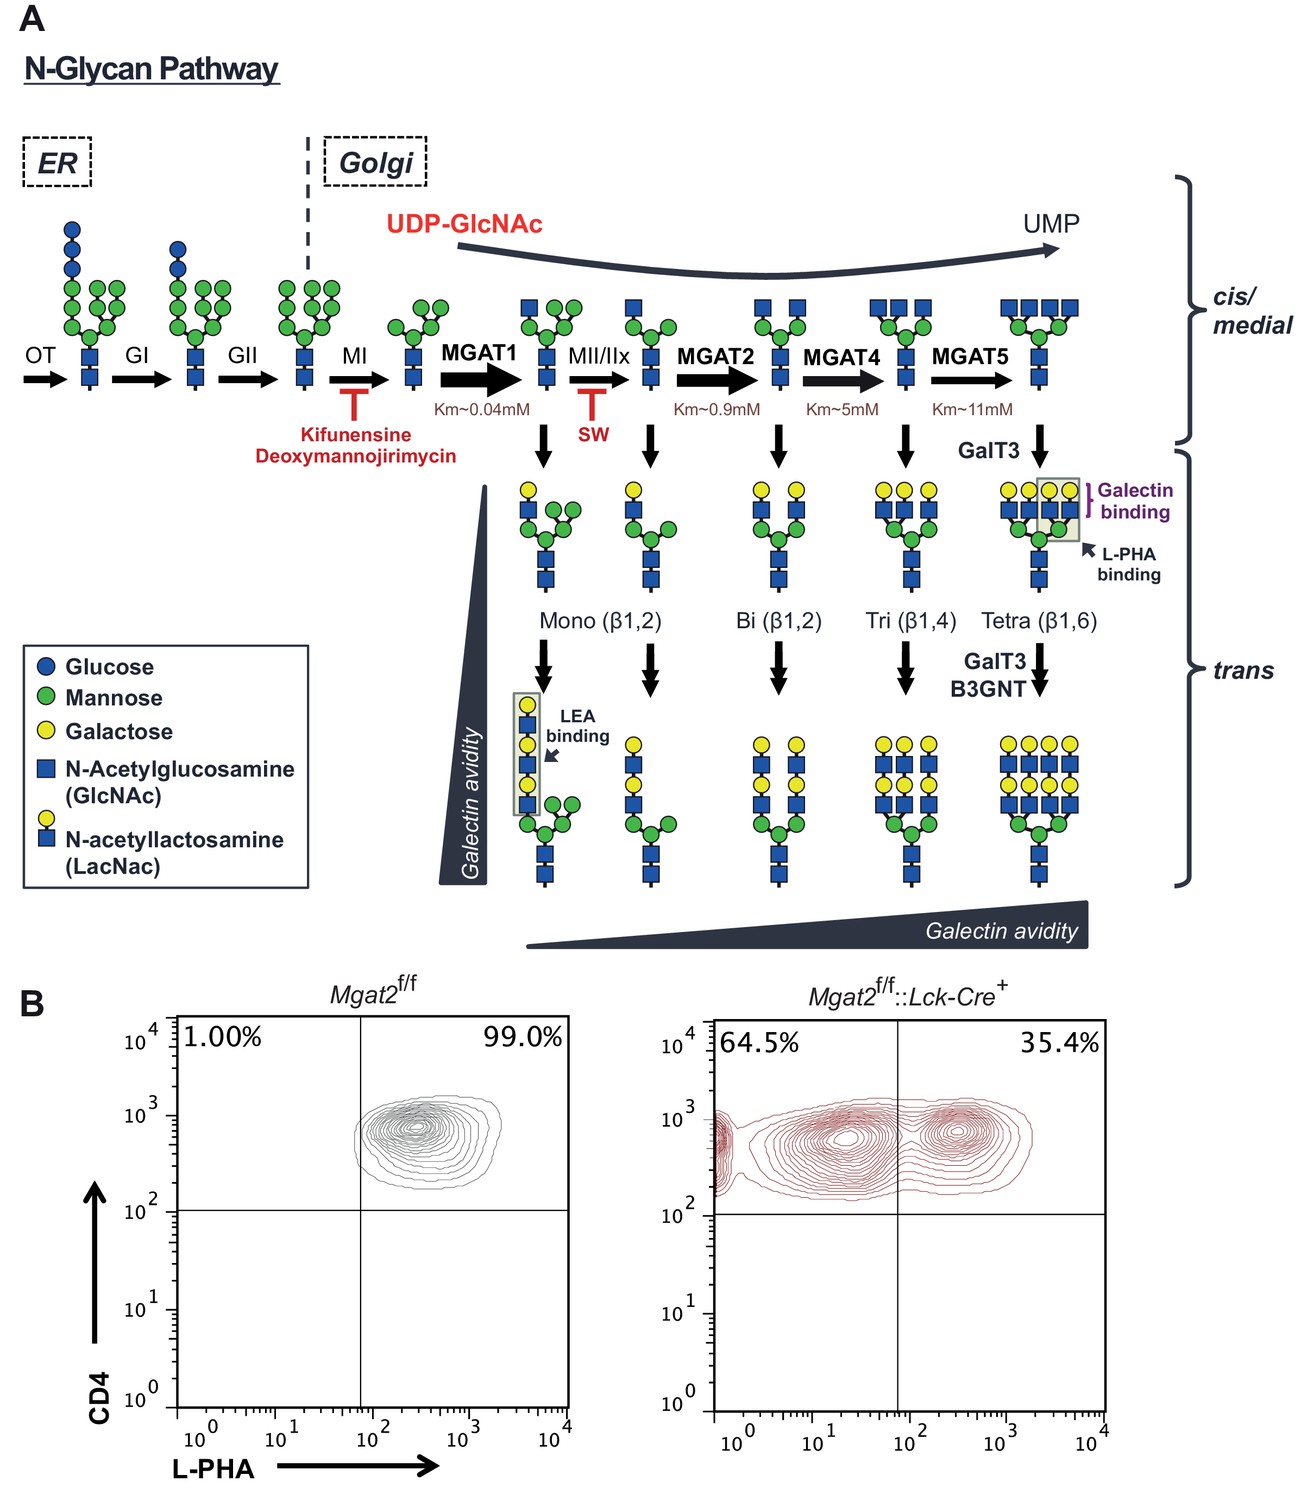
The hexosamine and N-glycan biosynthetic pathways in mammals.
(A) Utilizing the hexosamine pathway product, UDP-GlcNAc, the Golgi enzymes MGAT1, 2, 4a/b, and 5 are responsible for generating mono-, bi-, tri-, and tetra-antennary branched N-glycans, respectively. GlcNAc branches are further modified to create N-acetyllactosamine units, which serve as binding sites for galectins and L-PHA. The alternating actions of galactosyl transferase and B3GNT enzymes produce additional LacNAc units by extending existing branches. MGAT1, 2, 4 and 5 = N-acetylglucosaminyltransferases I, II IV and V; MII/MIIx = mannosidase II/IIx, MI = mannosidase I, SW = swainsonine. Additional structural diversity via addition of sialic acid, fucose, N-acetylgalactosamine and/or sulfate is not shown. (B) T cells isolated from mice of the indicated genotypes were analyzed for L-PHA binding by flow cytometry, gating on CD4+ cells.
Figure 2 with 3 supplements

Branching deficiency induces poly-LacNAc on N-glycans.
(A) Thymocytes were analyzed for L-PHA and LEA binding by flow cytometry, gating on CD4+CD8+ double positive cells. (B and C) CHO and Lec1 cells were grown in the presence or absence of 500 nM SW for 3 days followed by analysis for L-PHA (B) or LEA (C) binding by flow cytometry. (D) Resting primary human T cells were treated as indicated for 3 days and analyzed for L-PHA (upper) or LEA (lower) binding by flow cytometry, gating on live, non-blasting CD4+ cells. (E-–G) MALDI-TOF analysis of Sialidase A (E) or Endo-β-galactosidase treated N-glycans from Jurkat T cells treated without (F) or with SW (E and G). Hybrid glycans with extended antennae were observed in (E) at m/z 2897, 3102, 3347, 3551 and 4000, which are highlighted with red arrows. The % intensities of the peaks in (F, G) are shown in the brackets after m/z values. The signals at m/z 518, 722 and 1084 are derived from linear poly-LacNAc antennae and are used to represent the length of antennae. The calculation is shown above the spectrum. In addition, a minority of non-sialylated poly-LacNAc antennae were found to be internally fucosylated yielding GlcNAcβ1,3Galβ1,4(Fucα1,3)GlcNAcβ1,3Gal (m/z 1142) and Galβ1,4GlcNAcβ1,3Galβ1,4(Fucα1,3)GlcNAcβ1,3Gal (m/z 1346) upon digestion. MS/MS analysis of the peaks at m/z 1142 and 1346 also revealed the presence of isobaric pauci-mannose glycans, their relative abundances are indicated on the figure (see Figure 2—figure supplement 3). Ions are in the form of M+Na+. Peaks are annotated with putative structures according to the molecular weight, the glycan biosynthetic pathway and for (E), the MALDI-TOF analysis of the N-glycans before Sialidase A treatment (shown in Figure 2—figure supplement 2). NS, not significant; **p<0.01; ***p<0.001 (unpaired two-tailed t-test with Welch’s (B–D) and Bonferroni correction (D)). Data show one experiment representative of at least three independent experiments (A–D), except mass spectrometry (E–G), which was performed once. Error bars indicate mean ± s.e.m.
Figure 2—figure supplement 1
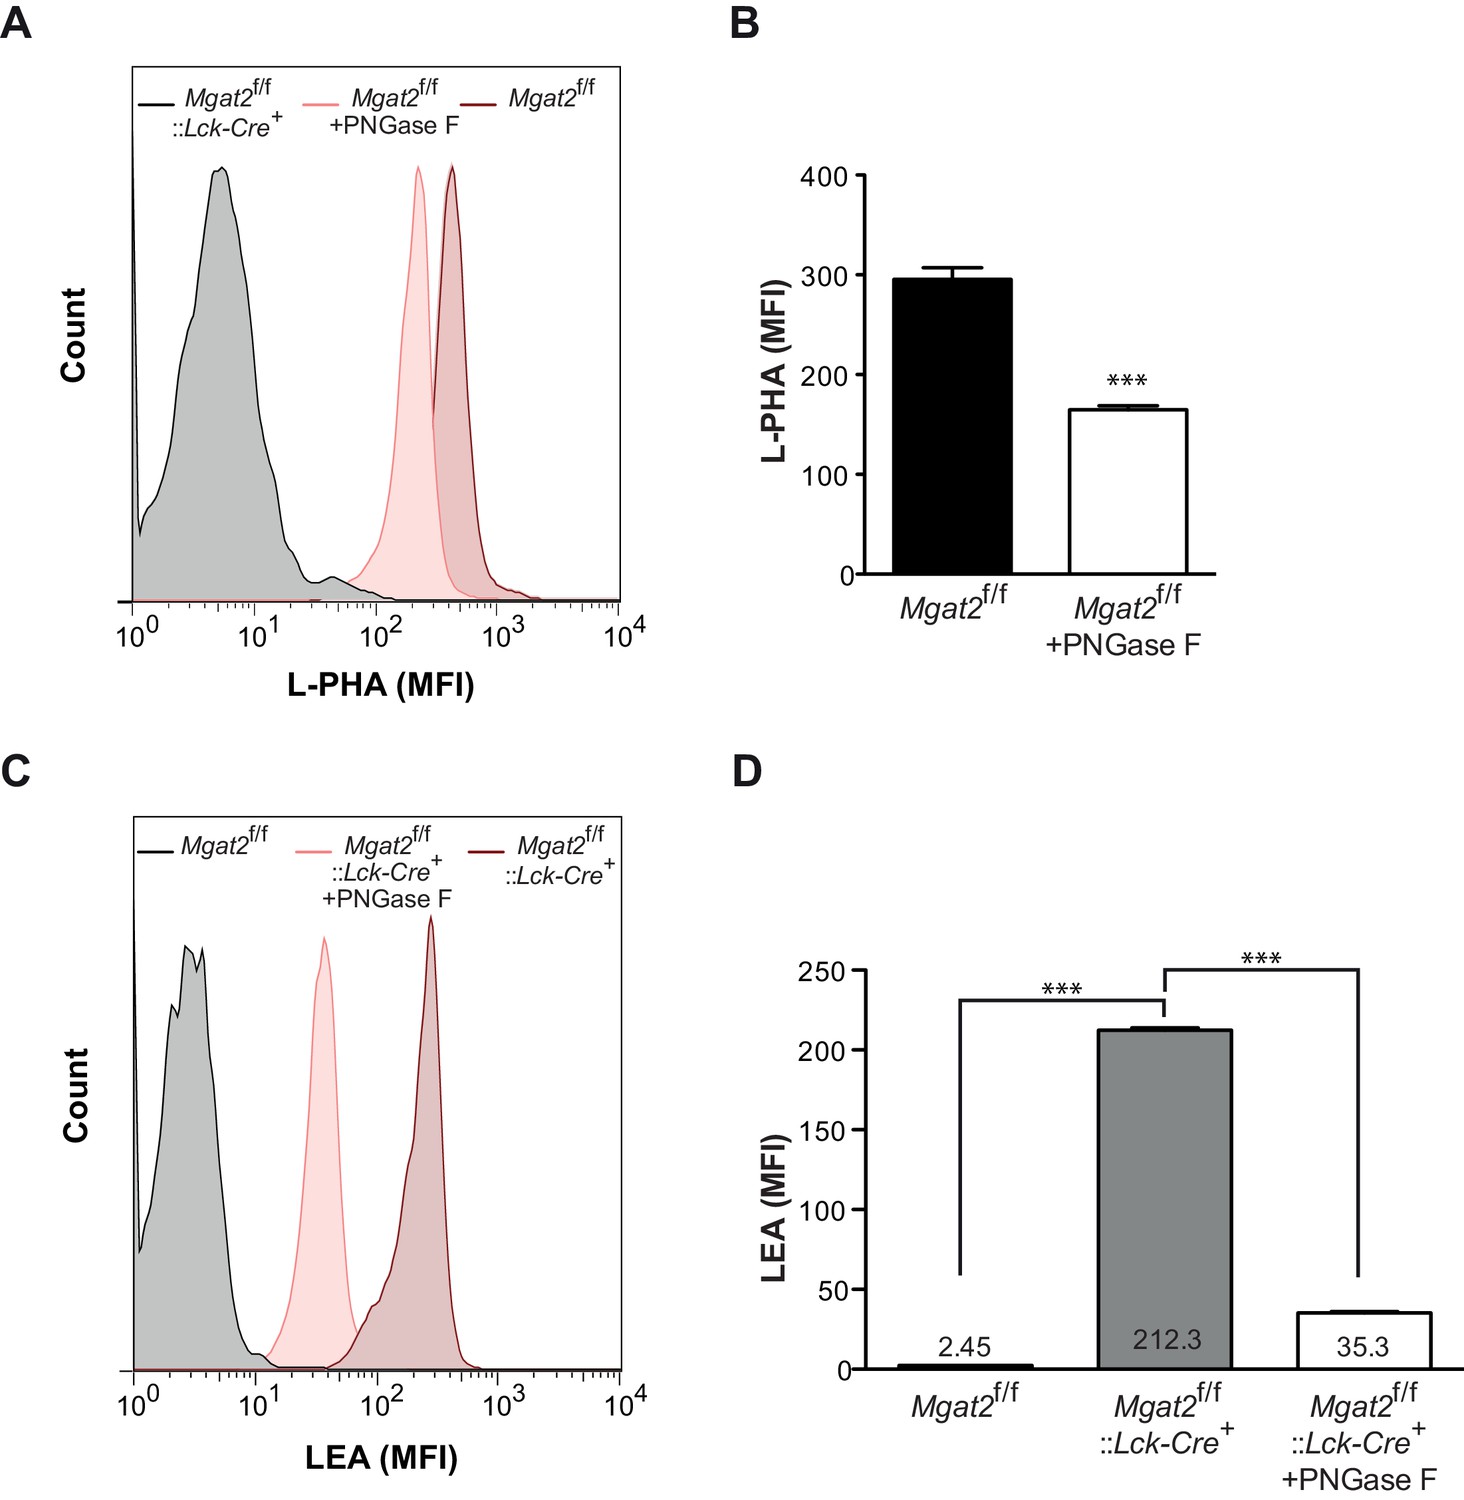
Induction of poly-LacNAc structures occurs preferentially on N-glycans.
(A–D) T cells isolated from mice of the indicated genotypes were treated for 4 hr with or without 2500 units of PNGase F and analyzed for L-PHA (A and B) or LEA (C and D) binding by flow cytometry, gating on CD4+ cells. ***p<0.001 (unpaired two-tailed t-test with Welch’s (B and D) and Bonferroni correction (D)). Data show one experiment representative of at least three independent experiments. Error bars indicate mean ± s.e.m.
Figure 2—figure supplement 2
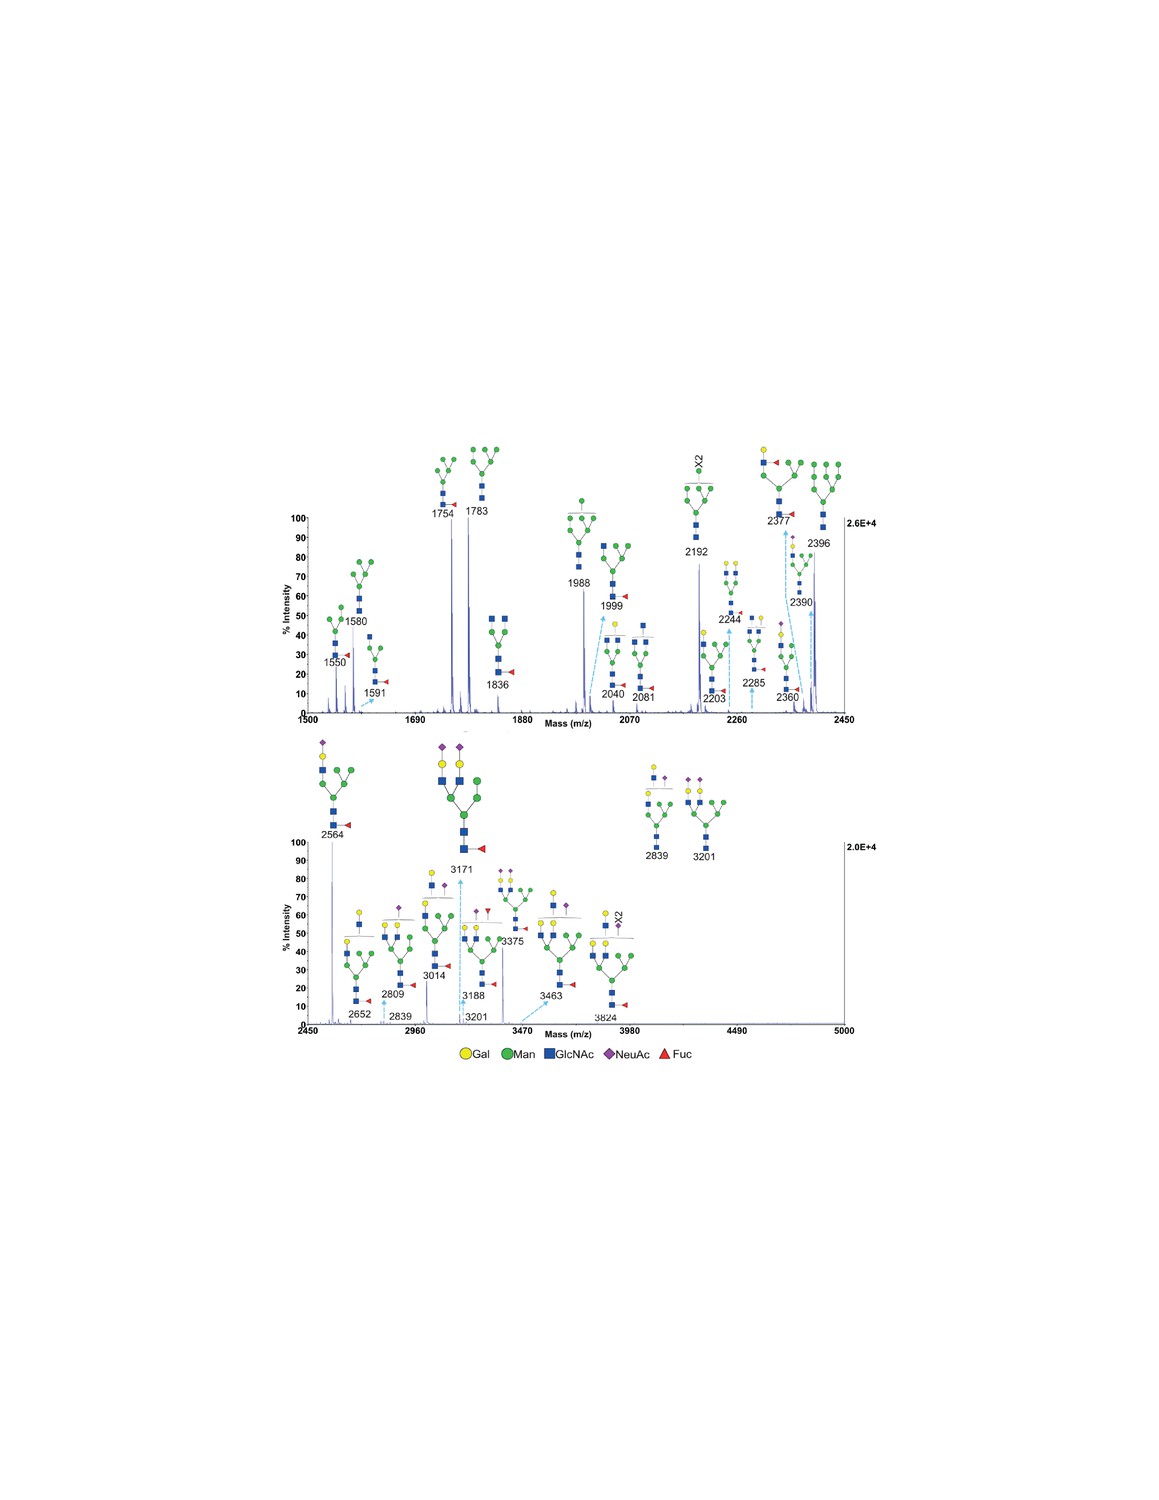
MALDI-TOF analysis of N-glycans from SW treated Jurkat T cells MALDI-TOF analysis of N-glycans from SW treated Jurkat T cells.
Hybrid glycans with sialylation were observed. Mass ranges from 1500 to 2450 (upper panel) and 2450 to 5000 (lower panel) are shown. Ions are in the form of M+Na+. Peaks are annotated with putative structures according to the molecular weight and the N-glycan biosynthetic pathway.
Figure 2—figure supplement 3
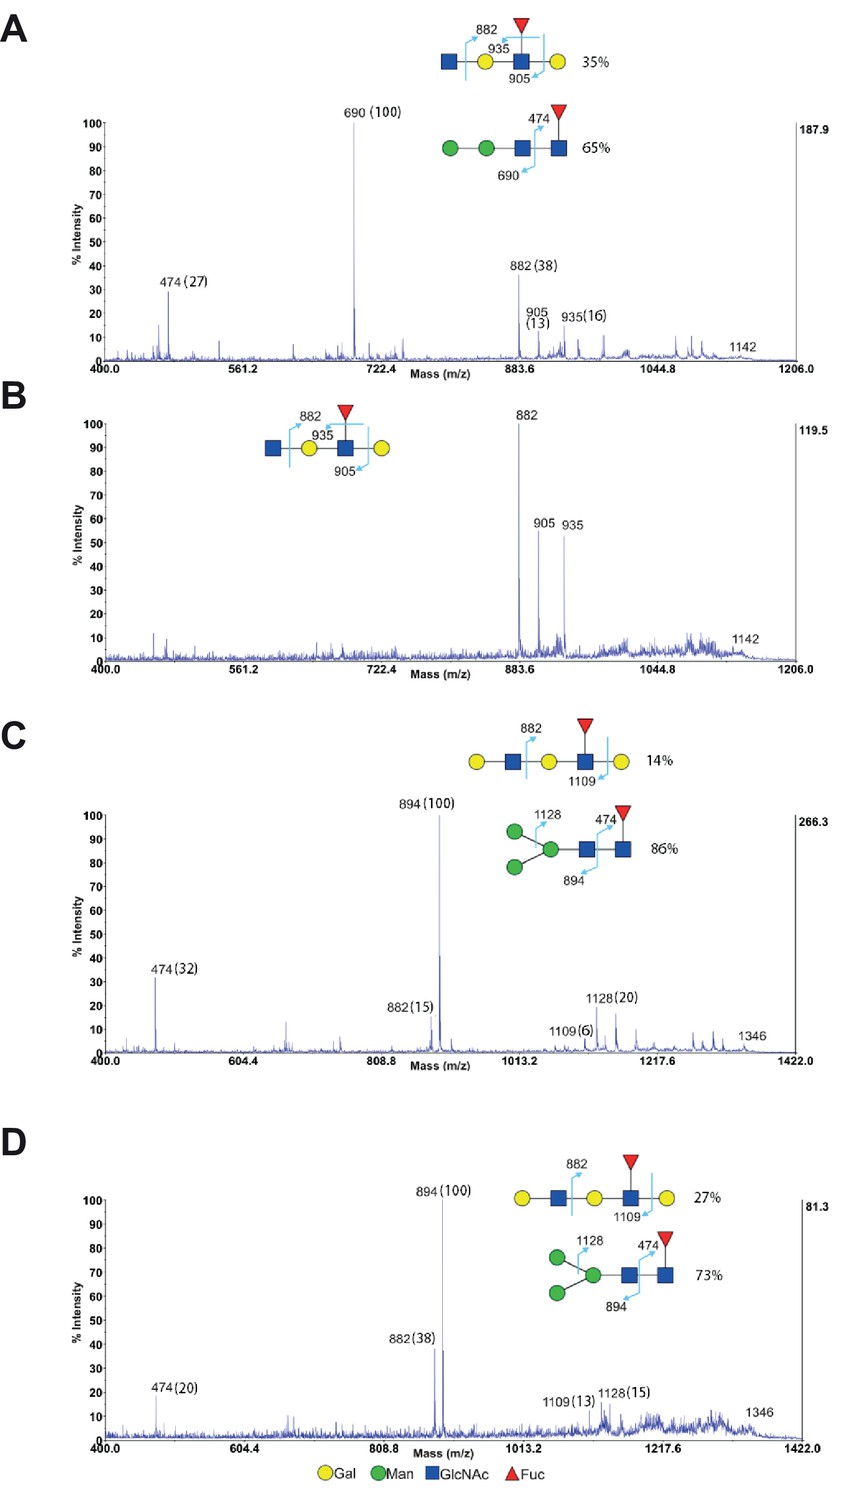
MS/MS analysis of endo-β-galactosidase digested glycans from Jurkat T cells.
(A–D) MS/MS analysis of endo-β-galactosidase digested glycans at m/z 1142 (A and B) and m/z 1346 (C and D) from non-treated Jurkat cells (A and C) and SW treated cells (B and D). The peak at m/z 1142 did not have mannose containing glycans for SW treated cells (B), while all the other peaks are a mixture of mannose containing glycans with exclusive fragments at m/z 474, 690 (A) and m/z 474, 894, 1128 (C and D) and minor fucosylated internal LacNAc units with exclusive fragments at m/z 882, 905, 935 (A) and m/z 882, 1109 (C and D). The percent intensities, displayed in brackets, of these exclusive fragments are used to calculate the percentages of the isobaric glycans.
Figure 3 with 1 supplement

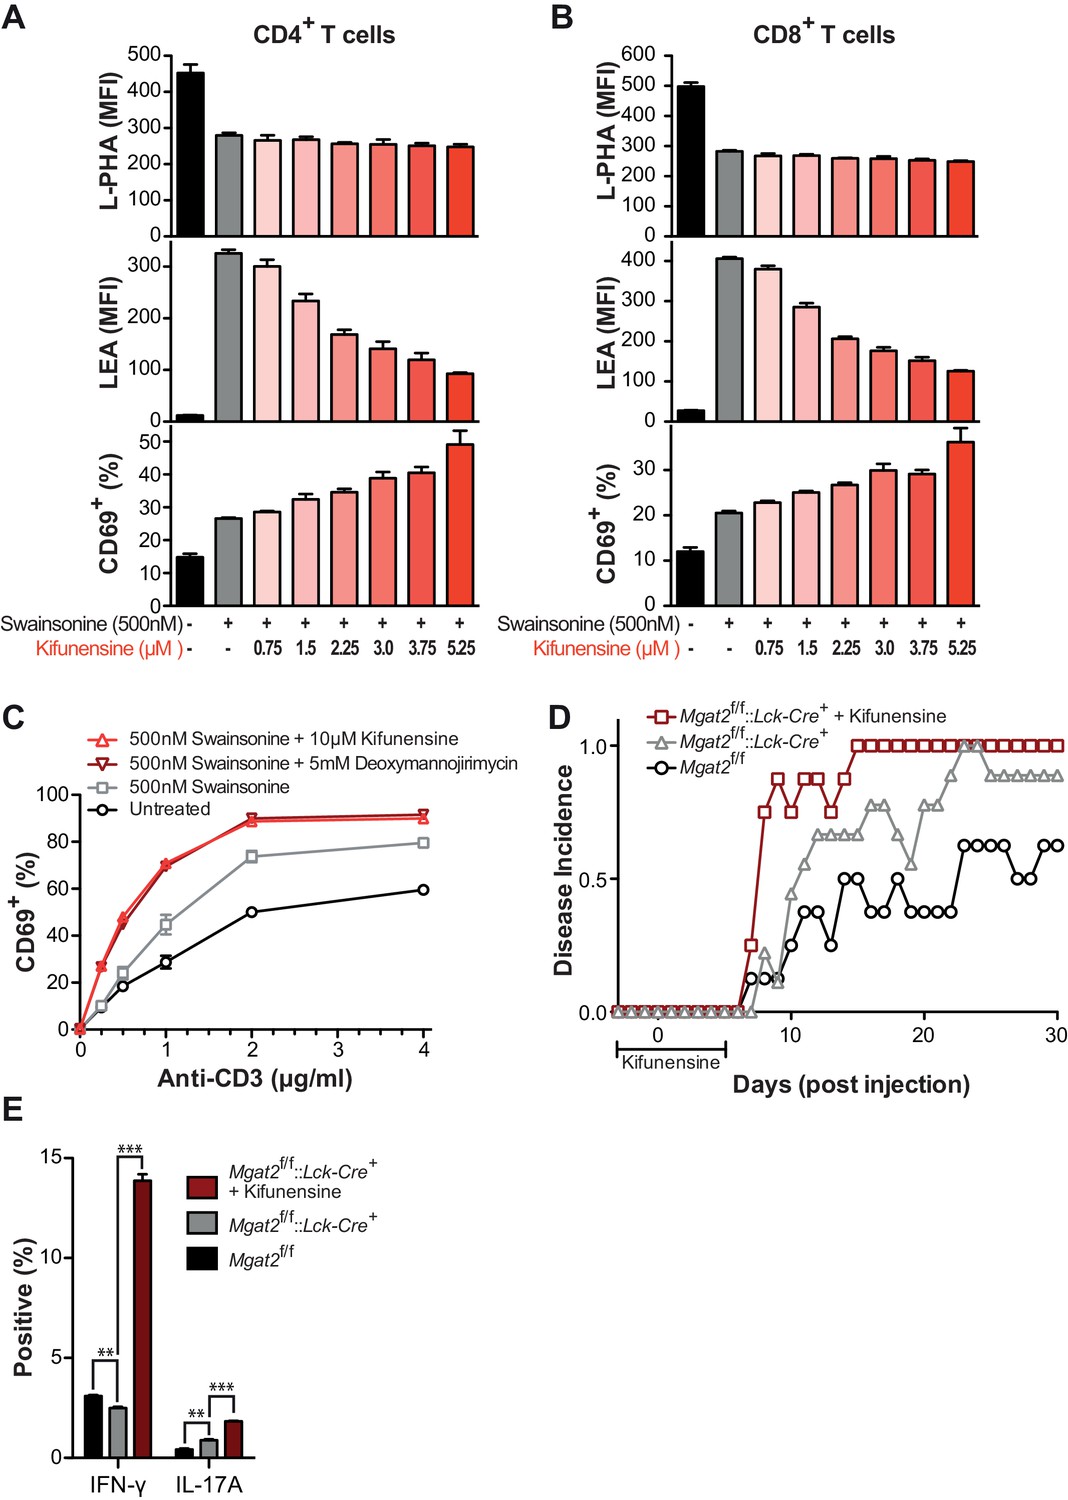
Poly-LacNAc compensation opposes T cell activation and autoimmunity.
(A) Jurkat T cells were treated as indicated for 72 hr in culture and analyzed for galectin-3 binding by flow cytometry. (B and C) Human T cells were pre-treated as indicated for 72 hr in culture without stimulation, then activated with plate bound anti-CD3 for 24 (B) or 72 (C) hours and analyzed for CD69 expression (B) or CFSE dilution (C) by flow cytometry, gating on CD4+ cells. (D) Mouse T cells were analyzed for galectin-3 binding by flow cytometry, gating on CD4+ cells. Where indicated, mice were pre-treated for 3 days with 0.2 mg/ml kifunensine in the drinking water. (E) Mouse T cells were activated for 24 hr with plate bound anti-CD3 and analyzed for CD69 expression by flow cytometry, gating on CD4+ cells. Where indicated, mice were pre-treated for 3 days with 0.2 mg/ml kifunensine in the drinking water followed by 10 μM kifunensine during culture. (F) EAE was induced in age matched female C57BL/6 mice treated with or without kifunensine in the drinking water at 0.2 mg/ml from day -3 to 5, with day 0 indicating the time of immunization (n = 9 per group). (G) On day 30, splenocytes were isolated from representative mice of each EAE group and analyzed for cytokine expression by flow cytometry. NS, not significant; *p<0.05; **p<0.01; ***p<0.001 (unpaired two-tailed t-test with Welch’s (C, D and G) and Bonferroni correction (C, D and G)). Data shown are one experiment representative of at least three independent experiments (A–E), except EAE (F and G), which was performed once. Error bars indicate mean ± s.e.m.
Figure 3—figure supplement 1
Poly-LacNAc compensation opposes T cell activation and autoimmunity.
(A and B) Human T cells were treated as indicated for 72 hr in culture without stimulation to establish baseline differences in glycan expression. Cells were analyzed for L-PHA (top) and LEA (middle) binding by flow cytometry, gating on CD4+ cells (A) or CD8+ cells (B). Cells treated in parallel were then activated with plate bound anti-CD3 for 24 hr and analyzed for CD69 expression (bottom) by flow cytometry, gating on CD4+ cells (A) or CD8+ cells (B). (C) Human T cells were treated as indicated for 72 hr in culture without stimulation to establish baseline differences in glycan expression. Cells were then activated with plate bound anti-CD3 for 24 hr and analyzed for CD69 expression by flow cytometry, gating on CD8+ cells. (D) Disease incidence of EAE in each group. Mice were scored as positive for EAE only after two consecutive days of clinical score ≥1. See also Figure 3F (E) At EAE day 30, splenocytes were isolated from representative mice of each group and activated in vitro for 5 days with 20 μg/ml MOG 35–55 peptide, followed by analysis of cytokine expression by flow cytometry to assay recall responses. **p<0.01; ***p<0.001 (unpaired two-tailed t-test with Welch’s (E) and Bonferroni correction (E)). Data show one experiment representative of at least three independent experiments (A–C), except EAE (D–E), which was performed once. Error bars indicate mean ± s.e.m.
Figure 4 with 1 supplement

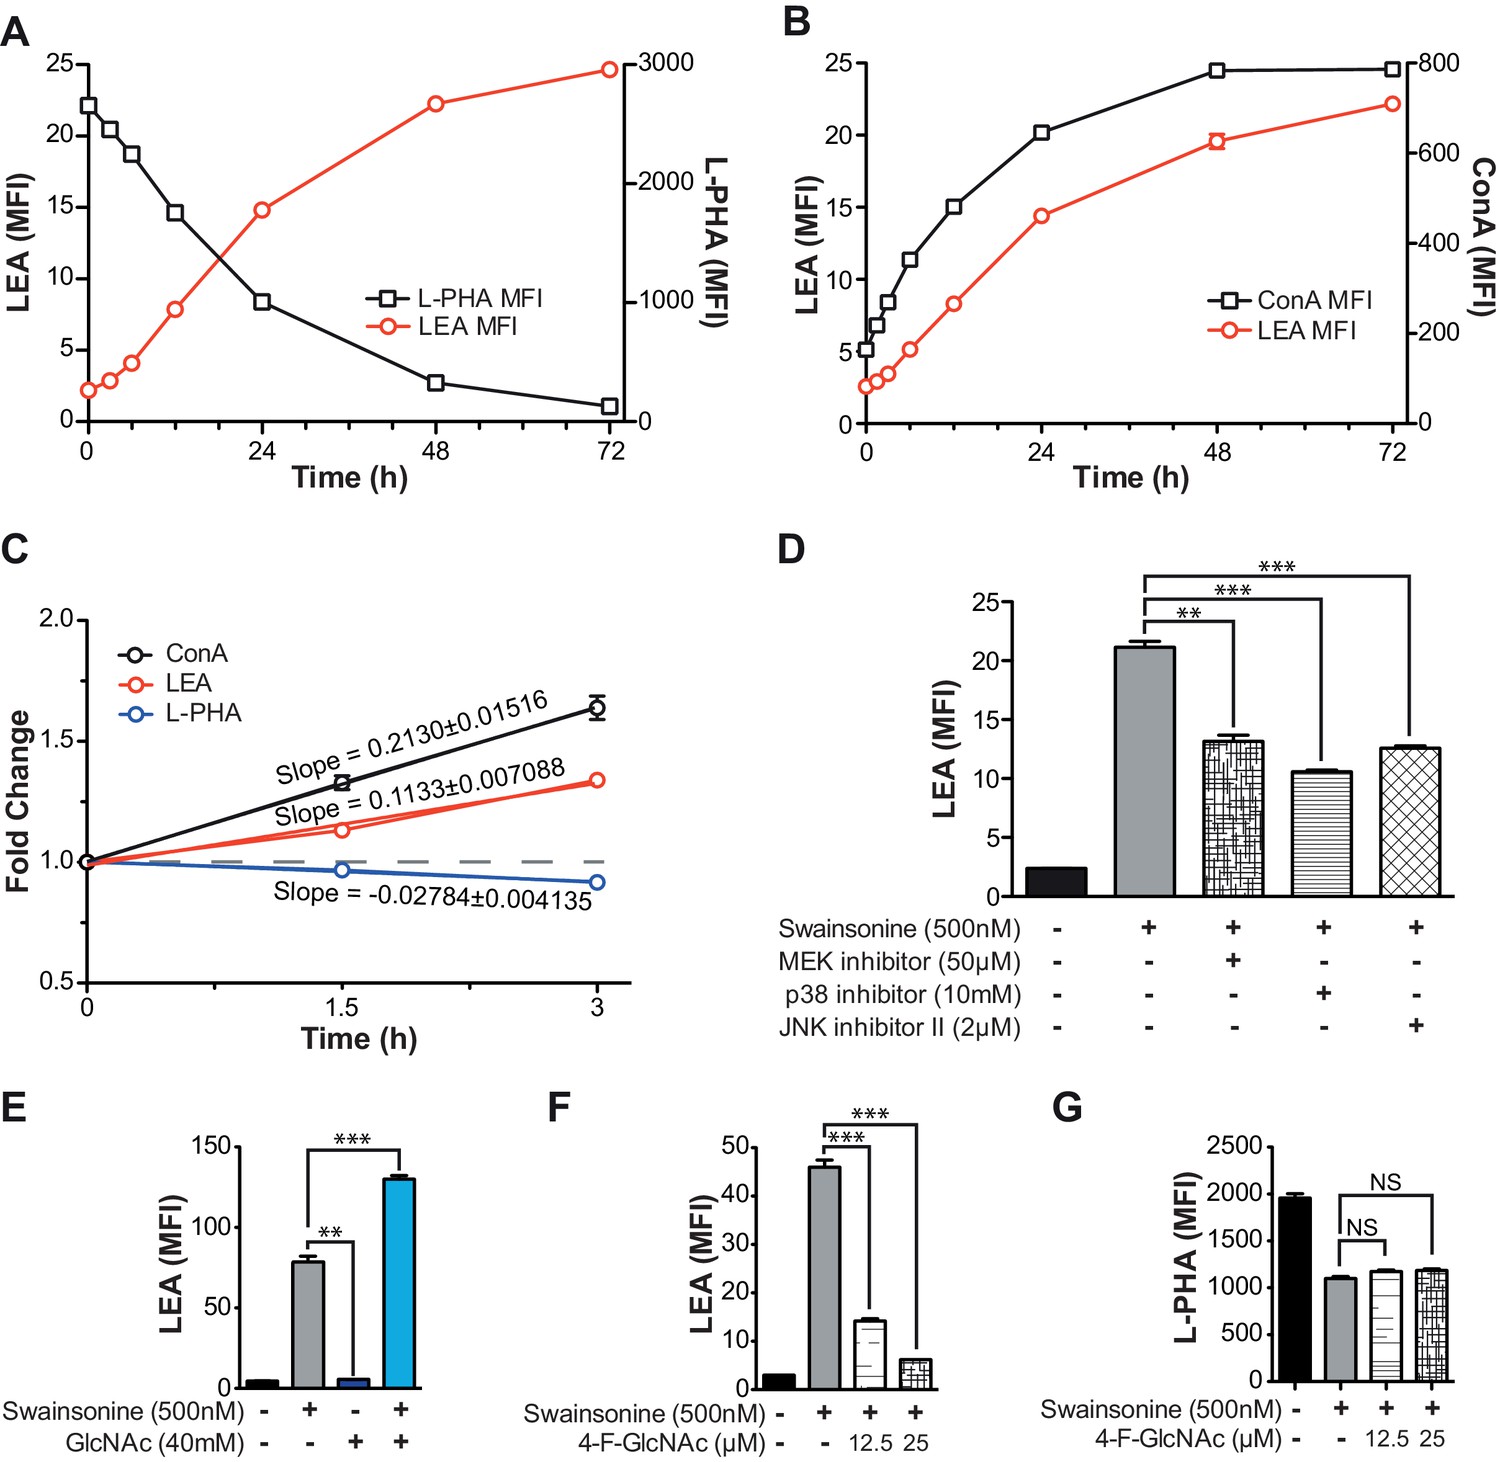
Increased TCR signaling and UDP-GlcNAc levels are neither necessary nor sufficient for poly-LacNAc induction.
(A) WT, TCRβ-/- and Lck-/- Jurkat cells were treated with SW for the indicated times and analyzed for lectin binding by flow cytometry. (B) Jurkat cells were treated as indicated for 24 hr and analyzed for LEA binding by flow cytometry. (C) Lysates of Jurkat T cells treated with SW as indicated were immune-blotted with anti-B3GNT2 and actin. (D) B3GNT enzyme activity was measured in lysates of Jurkat T cells treated with and without SW for 72 hr. (E–G) Total cellular UDP-GlcNAc levels were measured in mouse T cells (E), or Jurkat T cells treated as indicated (F, G) via mass spectrometry (E and G) or a spectrophotometric method (F). Jurkat cells were treated for the indicated times (F) or for 24 hr (G). NS, not significant; *p<0.05; **p<0.01; ***p<0.001 (unpaired two-tailed t-test with Welch’s (B, D, E and G) and Bonferroni correction (B and G)). Data show one experiment representative of at least three independent experiments. Error bars indicate mean ± s.e.m.
Figure 4—figure supplement 1
TCR signaling and cellular UDP-GlcNAc levels modulate the degree of poly-LacNAc induced by branching Deficiency.
(A–C) Jurkat T cells were treated with SW for the indicated times and analyzed for lectin binding by flow cytometry. (D and E) Jurkat T cells were treated as indicated for 72 hr and analyzed for LEA binding by flow cytometry. (F and G) Resting primary human T cells were treated as indicated and analyzed for LEA (F) or L-PHA (G) binding by flow cytometry. NS, not significant; *p<0.05; **p<0.01; ***p<0.001 (unpaired two-tailed t-test with Welch’s (D–G) and Bonferroni correction (D–G)). Data show one experiment representative of at least three independent experiments. Error bars indicate mean ± s.e.m.
Figure 5 with 1 supplement
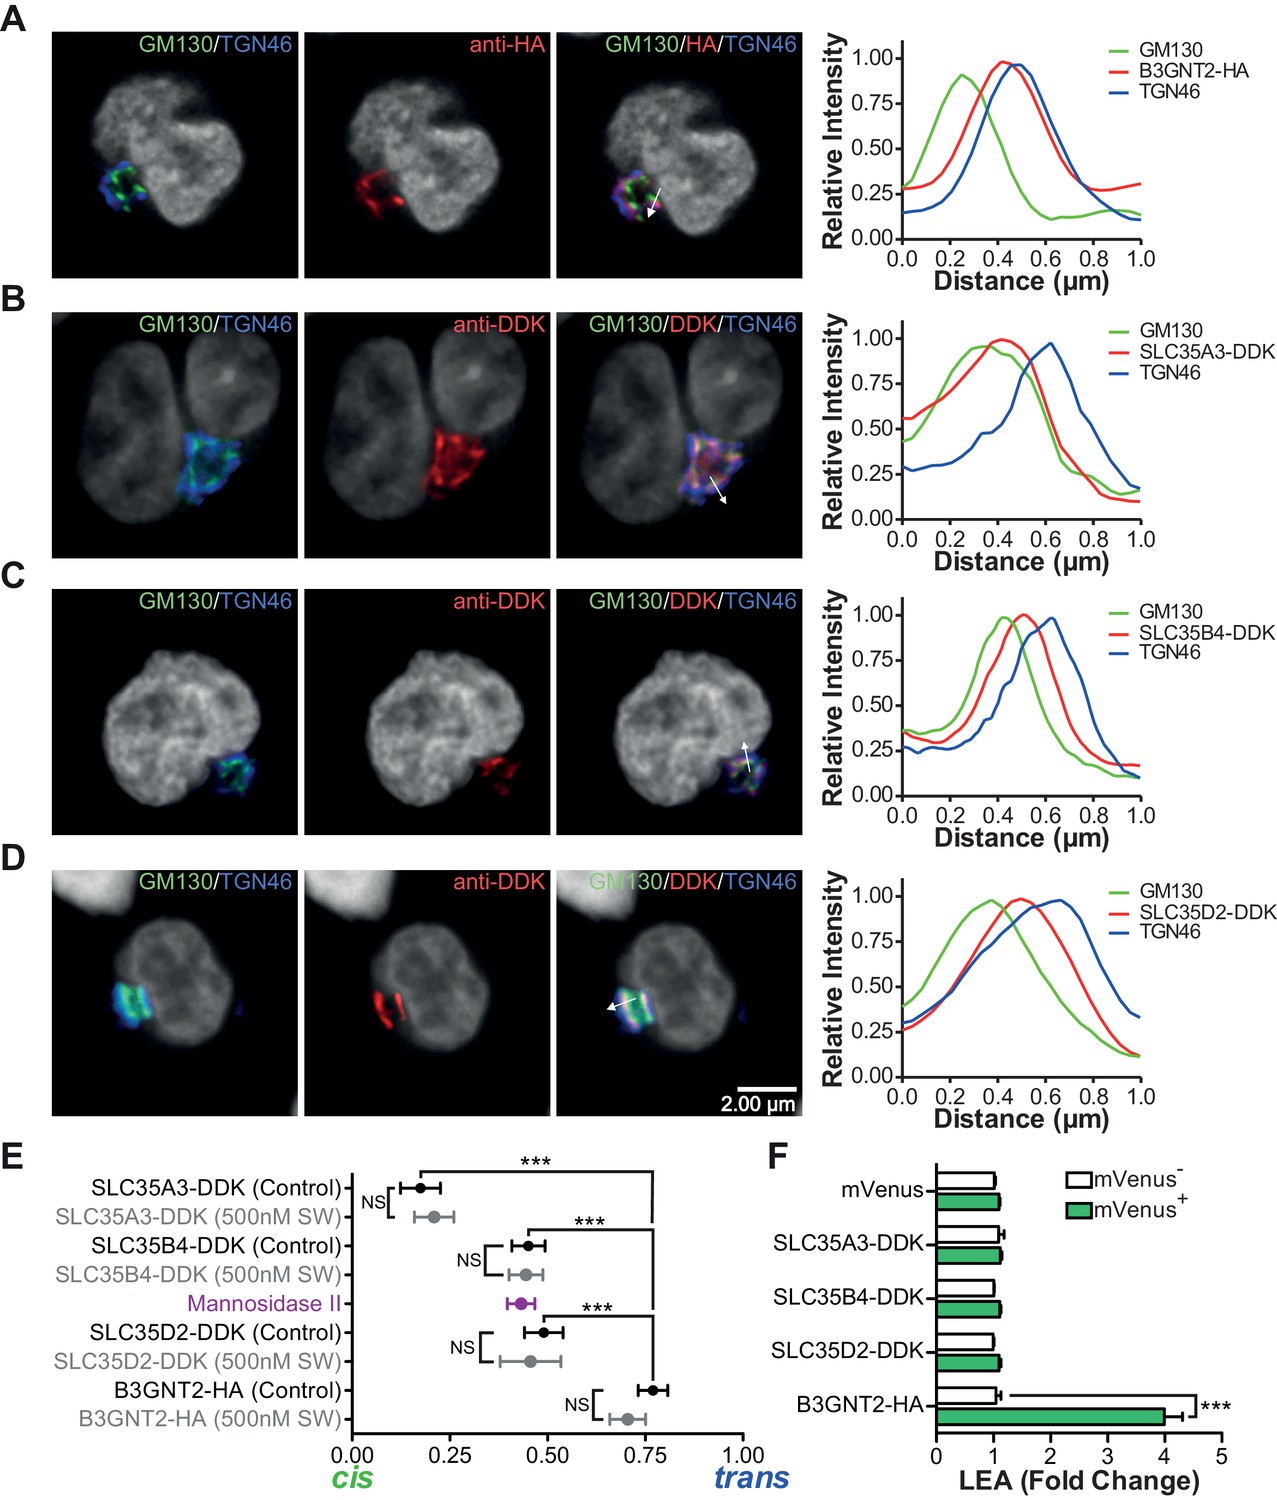
The UDP-GlcNAc transporters are localized to an earlier Golgi compartment than B3GNT2.
(A–D) Jurkat T cells were transfected with plasmids containing B3GNT2-HA (A), SLC35A3-DDK (B), SLC35B4-DDK (C), or SLC35D2-DDK (D), cultured for 24 hr and then stained for GM130 (green), TGN46 (blue) and either anti-HA (A) or anti-DDK (B–D) in red. Shown are representative confocal slices from transfected cells. The white arrows demonstrate areas deemed suitable for line scan analysis and the histograms (far right) demonstrate signal intensities along the line scans. DAPI staining is shown in grey scale. (E) Average localizations of the indicated Golgi proteins in Jurkat T cells treated with and without swainsonine (see Figure 5—figure supplement 1) relative to GM130 (cis) and TGN46 (trans) markers. Error bars show standard deviation. (F) Jurkat cells were transfected with mVenus alone or in combination with the four constructs of interest. After 48 hr, cells were analyzed for LEA binding by flow cytometry gating on mVenus- and mVenus+ cells as indicated. NS, not significant; *p<0.05; **p<0.01; ***p<0.001 (unpaired two-tailed t-test with Welch’s (E and F) and Bonferroni correction (E)). Data show images and histograms from representative cells (A–D), or pooled analysis from 30–40 cells per condition (E). Error bars indicate mean ± S.D. (E) or mean ± s.e.m (F).
Figure 5—figure supplement 1
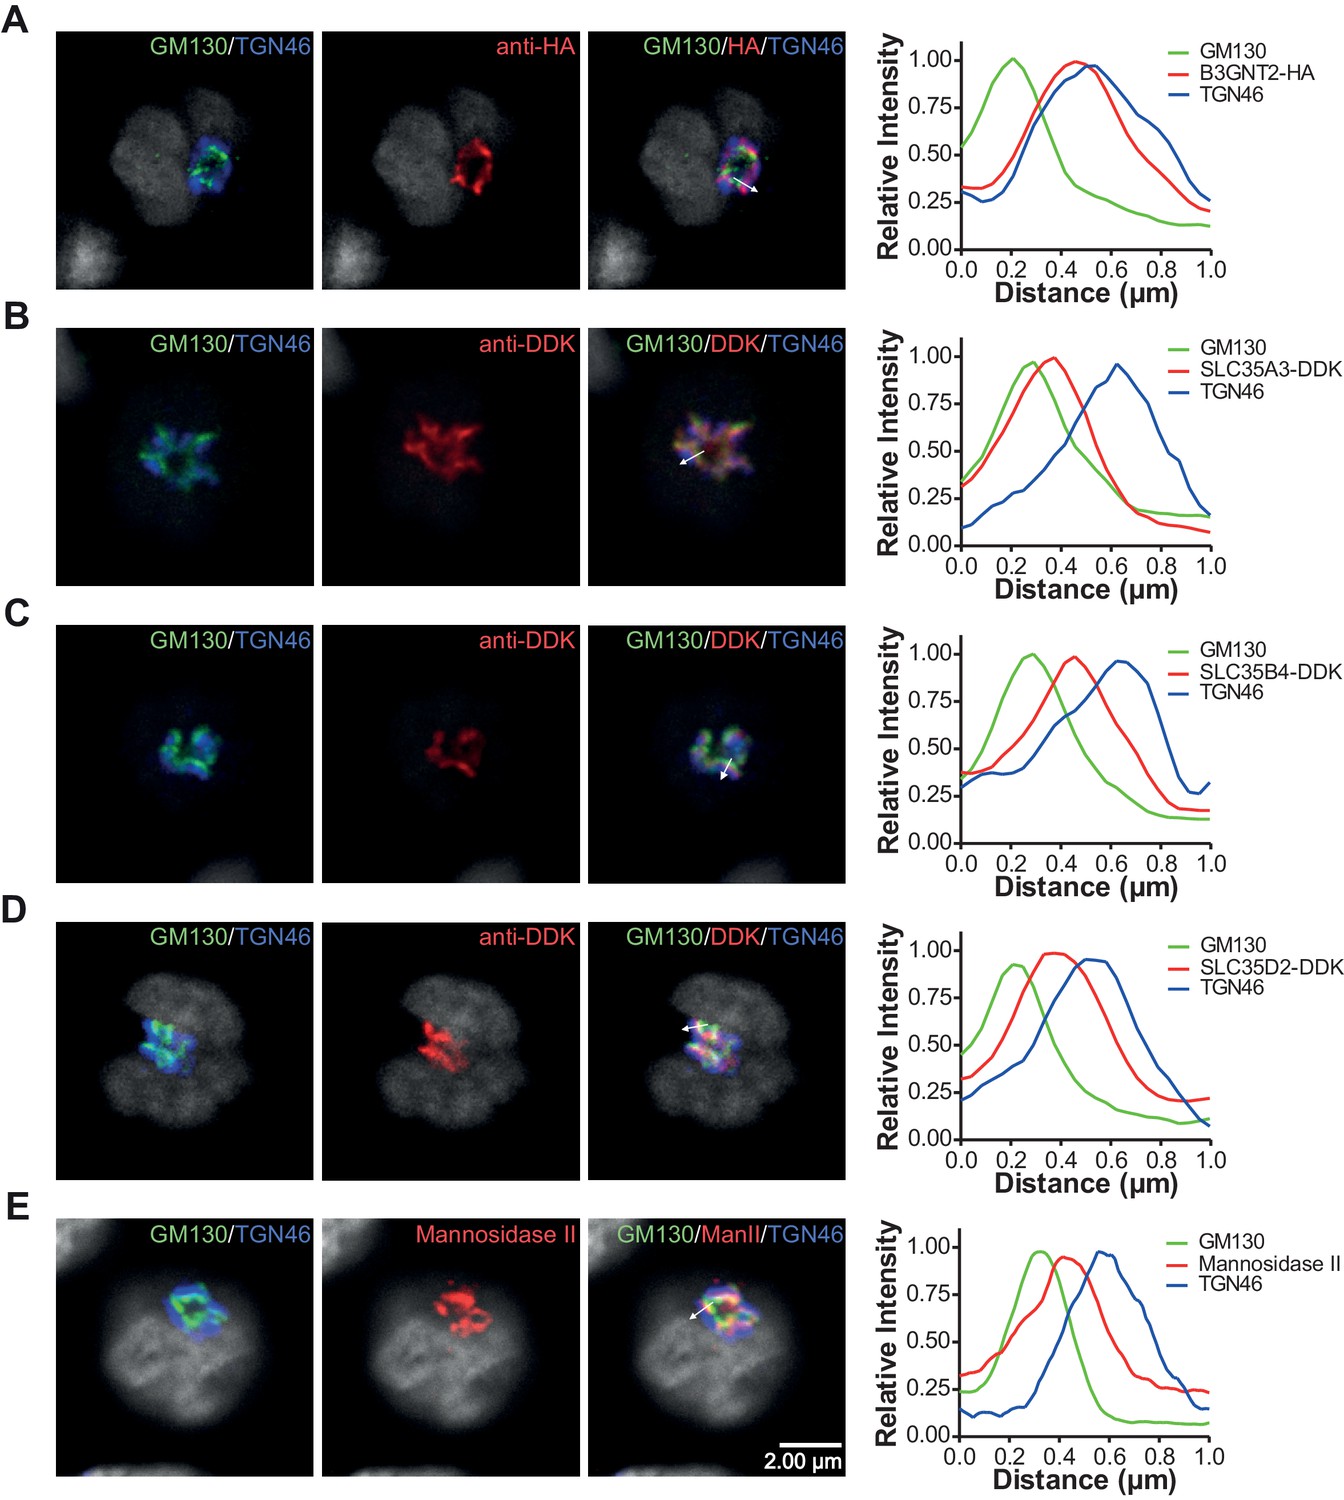
Branching deficiency does not cause relocalization of the UDP-GlcNAc transporters or B3GNT2.
(A–E) Jurkat cells were transfected with plasmids containing B3GNT2-HA (A), SLC35A3-DDK (B), SLC35B4-DDK (C), or SLC35D2-DDK (D) and cultured for 24 hr with (A–D) or without swainsonine (E). Cells were then fixed and stained for GM130 (green), TGN46 (blue) and either anti-HA (A), anti-DDK (B–D), or anti-Mannosidase II (E) in red. Shown are representative confocal slices from analyzed cells. The white arrows demonstrate areas deemed suitable for line scan analysis and the histograms (far right) demonstrate signal intensities along the line scans. DAPI staining is shown in grey scale.
Figure 6 with 1 supplement

Intra-Golgi UDP-GlcNAc shifts to later Golgi compartments when use in the medial Golgi is inhibited.
(A) LC-MS/MS quantitation of UDP-GlcNAc in post-nuclear supernatants (PNS), vesicular, and cytosolic fractions of kifunensine treated and untreated Jurkat T cells. (B) PNS (input) from kifunensine treated and untreated Jurkat T cells was used for Golgi enrichment via anti-TGN46 immuno-isolation followed by blotting for the Golgi compartment markers GM130 (cis), GS27 (medial/trans), and Syntaxin6 (trans). (C) LC-MS/MS quantitation of UDP-GlcNAc in anti-TGN46 bound and unbound fractions from kifunensine treated and untreated Jurkat T cell PNS. (D) PNS of Jurkat T cells treated for 0, 15, and 30 min with the Golgi disruptor Brefeldin A were used for anti-TGN46 immuno-isolation followed by blotting for B3GNT2 and the GM130 (cis), GS28 (cis/medial), and TGN46 (trans) Golgi markers. (E) Quantitation of D, (F) LC-MS/MS quantitation of UDP-GlcNAc in anti-TGN46 immuno-isolates from Jurkat cells treated with Brefeldin A for 15 min. (G) LEA flow cytometric analysis of Jurkat T cells pre-treated with nocodazole where indicated for 45 min, followed by swainsonine where indicated for 5 hr. (H) Jurkat T cells that were treated with nocodazole +/- pyrrophenone as indicated for 45 min were treated with or without swainsonine for 5 hr and then analyzed for LEA and ConA binding by flow cytometry. Shown is the ratio of LEA MFI to ConA MFI for each condition. NS, not significant; *p<0.05; **p<0.01; ***p<0.001; (unpaired one-tailed (A, C, F and G) or two-tailed (H) t-test with Welch’s correction and Bonferroni correction (H)). Data show one experiment representative of at least three independent experiments except F which shows combined data from two independent experiments. Error bars indicate mean ± s.e.m.
Figure 6—figure supplement 1
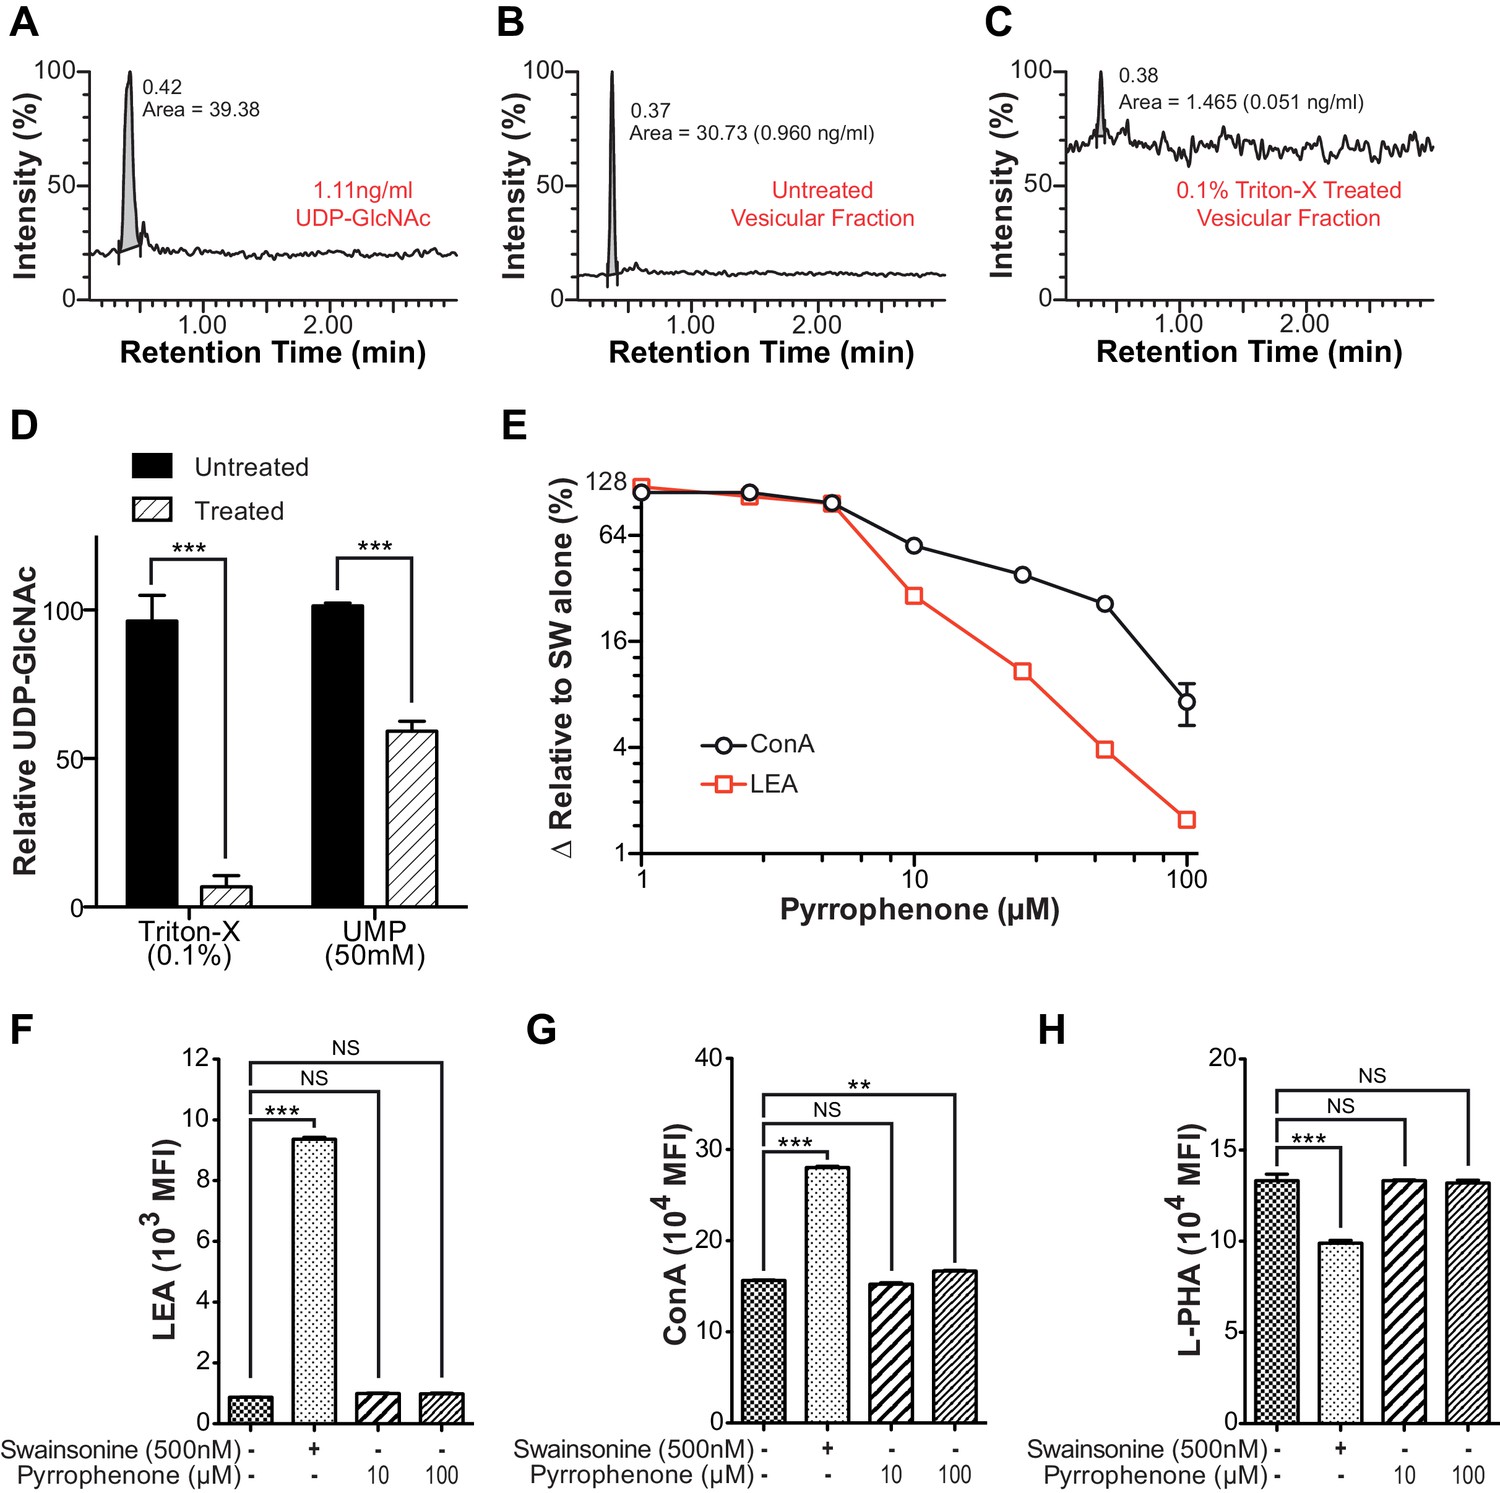
Intra-Golgi UDP-GlcNAc shifts to later Golgi compartments when use in the medial Golgi is inhibited.
(A–C) LC-MS/MS intensity plots of 1.11 ng/ml UDP-GlcNAc standard (A), and untreated (B) and 0.1% triton-X treated (C) Jurkat T cell vesicular fraction. (D) LC-MS/MS quantitation of UDP-GlcNAc levels in untreated versus 0.1% triton-X or 50 mM UMP treated Jurkat T cell vesicular fractions. (E) Jurkat T cells were treated with the indicated concentrations of pyrrophenone for 45 min, followed by the addition of 500 nM swainsonine for an additional 5 hr, at which time cells were analyzed for LEA and ConA binding by flow cytometry. The y-axis indicates percent reversal of the swainsonine-induced change, where 0 corresponds to lectin binding in untreated cells and 100 to swainsonine treatment alone. (F–H) Jurkat T cells were treated with the indicated concentrations of pyrrophenone for 45 min, followed by the addition of 500 nM swainsonine where indicated for an additional 5 hr, after which cells were analyzed for LEA, ConA, and L-PHA binding by flow cytometry. NS, not significant; **p<0.01; ***p<0.001; (unpaired two-tailed t-test with Welch’s (D and F–H) and Bonferroni correction (F–H). Data show one experiment representative of at least three independent experiments. Error bars indicate mean ± s.e.m.
Figure 7

Model of an inherent Golgi self-correcting mechanism to maintain LacNAc homeostasis.
The majority of UDP-GlcNAc entering the Golgi is supplied to its early compartments by the UDP-GlcNAc/UMP antiporters, which are preferentially localized to the cis/medial Golgi. Under branching proficient conditions (A), UDP-GlcNAc is used by the branching enzymes MGAT1, 2, 4, and 5, with little unused UDP-GlcNAc supplying the poly-LacNAc synthesizing B3GNT enzymes. The resulting array of N-glycans produced thus contains more LacNAc branches than linear LacNAc polymers (A). When the branching pathway is disrupted (B), or presumably the Golgi is otherwise stressed, leading to reduced UDP-GlcNAc usage in the medial Golgi, UDP-GlcNAc is driven forward (at least partially through intercisternal tubules) and promotes production of bioequivalent poly-LacNAc containing glycans by the trans Golgi-resident B3GNT family of enzymes. Under this scenario, loss of LacNAc branches is balanced by increased production of linear LacNAc polymers, a self-correcting ability that serves to maintain cell surface LacNAc density and thus the galectin-glycoprotein lattice (A). In the context of T cells, this homeostatic mechanism acts to curtail catastrophic T cell hyperactivity and promotes self-tolerance.
Tables
Table 1
List of N-glycan branching, poly-LacNAc production, and hexosamine pathway genes.
| Gene symbol | Gene description | p Value | Fold change |
|---|---|---|---|
| Man1a | mannosidase 1, alpha | 0.3602 | 1.0628 |
| Man1a2 | mannosidase, alpha, class 1A, member 2 | 0.4885 | -1.0551 |
| Man1b1 | mannosidase, alpha, class 1B, member 1 | 0.4397 | -1.0627 |
| Man1c1 | mannosidase, alpha, class 1C, member 1 | 0.4053 | 1.0748 |
| Man2a1 | mannosidase 2, alpha 1 | 0.8150 | -1.0168 |
| Man2a2 | mannosidase 2, alpha 2 | 0.3647 | -1.0787 |
| Man2b1 | mannosidase 2, alpha B1 | 0.0800 | -1.1350 |
| Man2b2 | mannosidase 2, alpha B2 | 0.6465 | 1.0331 |
| Man2c1 | mannosidase, alpha, class 2C, member 1 | 0.9826 | 1.0016 |
| Mgat1 | mannoside acetylglucosaminyltransferase 1 | 0.1005 | -1.1846 |
| Mgat2 | mannoside acetylglucosaminyltransferase 2 | 0.0000 | -27.8780 |
| Mgat3 | mannoside acetylglucosaminyltransferase 3 | 0.1757 | 1.1377 |
| Mgat4a | mannoside acetylglucosaminyltransferase 4, isoenzyme A | 0.1486 | -1.2068 |
| Mgat4b | mannoside acetylglucosaminyltransferase 4, isoenzyme B | 0.2248 | 1.1345 |
| Mgat4c | mannosyl (alpha-1,3-)-glycoprotein beta-1,4-N-acetylglucosaminyltransferase, isozyme C (putative) | 0.5695 | 1.0539 |
| Mgat5 | mannoside acetylglucosaminyltransferase 5 | 0.4045 | 1.0666 |
| Mgat5b | mannoside acetylglucosaminyltransferase 5, isoenzyme B | 0.1450 | 1.1347 |
| B3gnt1 | UDP-GlcNAc:betaGal beta-1,3-N-acetylglucosaminyltransferase 1 | 0.5597 | -1.0587 |
| B3gnt2 | UDP-GlcNAc:betaGal beta-1,3-N-acetylglucosaminyltransferase 2 | 0.1503 | 1.1219 |
| B3gnt3 | UDP-GlcNAc:betaGal beta-1,3-N-acetylglucosaminyltransferase 3 | 0.4031 | 1.1072 |
| B3gnt4 | UDP-GlcNAc:betaGal beta-1,3-N-acetylglucosaminyltransferase 4 | 0.2923 | 1.1100 |
| B3gnt5 | UDP-GlcNAc:betaGal beta-1,3-N-acetylglucosaminyltransferase 5 | 0.1758 | 1.1742 |
| B3gnt6 | UDP-GlcNAc:betaGal beta-1,3-N-acetylglucosaminyltransferase 6 (core 3 synthase) | 0.5565 | 1.0511 |
| B3gnt7 | UDP-GlcNAc:betaGal beta-1,3-N-acetylglucosaminyltransferase 7 | 0.8028 | 1.0237 |
| B3gnt8 | UDP-GlcNAc:betaGal beta-1,3-N-acetylglucosaminyltransferase 8 | 0.6157 | 1.0443 |
| B3gnt9-ps | UDP-GlcNAc:betaGal beta-1,3-N-acetylglucosaminyltransferase 9, pseudogene | 0.2841 | 1.0856 |
| B3gntl1 | UDP-GlcNAc:betaGal beta-1,3-N-acetylglucosaminyltransferase-like 1 | 0.7979 | -1.0241 |
| B4galt1 | UDP-Gal:betaGlcNAc beta 1,4- galactosyltransferase, polypeptide 1 | 0.8003 | 1.0166 |
| B4galt2 | UDP-Gal:betaGlcNAc beta 1,4- galactosyltransferase, polypeptide 2 | 0.1023 | 1.1487 |
| B4galt3 | UDP-Gal:betaGlcNAc beta 1,4-galactosyltransferase, polypeptide 3 | 0.6938 | -1.0304 |
| B4galt4 | UDP-Gal:betaGlcNAc beta 1,4-galactosyltransferase, polypeptide 4 | 0.1378 | 1.1624 |
| B4galt5 | UDP-Gal:betaGlcNAc beta 1,4-galactosyltransferase, polypeptide 5 | 0.8380 | 1.0131 |
| B4galt6 | UDP-Gal:betaGlcNAc beta 1,4-galactosyltransferase, polypeptide 6 | 0.0645 | -1.2196 |
| B4galt7 | xylosylprotein beta1,4-galactosyltransferase, polypeptide 7 (galactosyltransferase I) | 0.4116 | -1.0764 |
| Gck | glucokinase | 0.0548 | 1.1856 |
| Hk1 | hexokinase 1 | 0.8593 | 1.0129 |
| Hk2 | hexokinase 2 | 0.4688 | 1.0771 |
| Hk3 | hexokinase 3 | 0.0236 | -1.2237 |
| Adpgk | ADP-dependent glucokinase | 0.4033 | -1.0787 |
| Gpi1 | glucose phosphate isomerase 1 | 0.7826 | -1.0173 |
| Gfpt1 | glutamine fructose-6-phosphate transaminase 1 | 0.2410 | -1.0941 |
| Gfpt2 | glutamine fructose-6-phosphate transaminase 2 | 0.0289 | 1.2116 |
| Gnpda1 | glucosamine-6-phosphate deaminase 1 | 0.6667 | -1.0364 |
| Gnpda2 | glucosamine-6-phosphate deaminase 2 | 0.9474 | 1.0054 |
| Gnpnat1 | glucosamine-phosphate N-acetyltransferase 1 | 0.3646 | -1.0839 |
| Nat9 | N-acetyltransferase 9 (GCN5-related, putative) | 0.2253 | 1.0995 |
| Pgm1 | phosphoglucomutase 1 | 0.7697 | -1.0243 |
| Pgm2 | phosphoglucomutase 2 | 0.7135 | -1.0360 |
| Pgm2l1 | phosphoglucomutase 2-like 1 | 0.8036 | -1.0167 |
| Pgm3 | phosphoglucomutase 3 | 0.6032 | -1.0529 |
| Pgm5 | phosphoglucomutase 5 | 0.2374 | 1.1326 |
| Uap1 | UDP-N-acetylglucosamine pyrophosphorylase 1 | 0.6555 | 1.0402 |
| Uap1l1 | UDP-N-acteylglucosamine pyrophosphorylase 1-like 1 | 0.2637 | -1.1092 |
| Nagk | N-acetylglucosamine kinase | 0.2907 | -1.1126 |
| Gale | galactose-4-epimerase, UDP | 0.5196 | 1.0579 |
| Gne | glucosamine (UDP-N-acetyl)-2-epimerase/N-acetylmannosamine kinase | 0.2860 | -1.0808 |
-
Gene symbol, gene description, p value and fold change of Mgat2 deficient CD4+ T cells relative to control are shown. The microarray confirms loss of Mgat2 expression, highlighted in bold.
Table 2
List of the top 50 differentially expressed genes.
| Gene symbol | Gene description | p Value | Fold change |
|---|---|---|---|
| Rpl36al | ribosomal protein L36A-like | 4.44E-16 | -15.6258 |
| Mgat2 | mannoside acetylglucosaminyltransferase 2 | 9.43E-14 | -27.8780 |
| Fn1 | fibronectin 1 | 5.83E-12 | -7.5845 |
| Cpm | carboxypeptidase M | 3.54E-10 | 3.1233 |
| Zbtb16 | zinc finger and BTB domain containing 16 | 5.45E-10 | -3.3239 |
| Mmp9 | matrix metallopeptidase 9 | 1.58E-09 | -3.9658 |
| Serpinb10-ps | serine (or cysteine) peptidase inhibitor, clade B (ovalbumin), member 10, pseudogene | 4.39E-09 | -5.0634 |
| Zfp69 | zinc finger protein 69 | 4.63E-09 | -2.1283 |
| Cd93 | CD93 antigen | 1.04E-08 | -2.3236 |
| Atp8a2 | ATPase, aminophospholipid transporter-like, class I, type 8A, member 2 | 2.64E-08 | -2.2711 |
| Gpr141 | G protein-coupled receptor 141 | 3.83E-08 | -3.4035 |
| Penk | preproenkephalin | 5.28E-08 | 3.8411 |
| Clec7a | C-type lectin domain family 7, member a | 8.21E-08 | -2.4336 |
| Lyz1 | lysozyme 1 | 1.06E-07 | -3.4287 |
| Mpeg1 | macrophage expressed gene 1 | 1.18E-07 | -4.3408 |
| Klra2 | killer cell lectin-like receptor, subfamily A, member 2 | 1.33E-07 | -4.4037 |
| Kit | kit oncogene | 2.44E-07 | -2.3150 |
| Plbd1 | phospholipase B domain containing 1 | 2.47E-07 | -2.9529 |
| Lyz2 | lysozyme 2 | 2.83E-07 | -3.6156 |
| Pld4 | phospholipase D family, member 4 | 3.00E-07 | -4.1375 |
| Ace | angiotensin I converting enzyme (peptidyl-dipeptidase A) 1 | 3.36E-07 | -3.3758 |
| Sirpa | signal-regulatory protein alpha | 3.40E-07 | -3.9975 |
| Clec12a | C-type lectin domain family 12, member a | 3.54E-07 | -4.4547 |
| Tlr13 | toll-like receptor 13 | 4.15E-07 | -6.5477 |
| Tnfrsf21 | tumor necrosis factor receptor superfamily, member 21 | 4.86E-07 | -3.4333 |
| Tgfbi | transforming growth factor, beta induced | 5.57E-07 | -3.6315 |
| Adrbk2 | adrenergic receptor kinase, beta 2 | 5.98E-07 | -2.0416 |
| Il12rb2 | interleukin 12 receptor, beta 2 | 7.32E-07 | -2.6927 |
| Csf1r | colony stimulating factor 1 receptor | 7.57E-07 | -5.9870 |
| Xcl1 | chemokine (C motif) ligand 1 | 9.55E-07 | -2.0969 |
| Mlh1 | mutL homolog 1 (E. coli) | 9.66E-07 | -2.0854 |
| Sulf2 | sulfatase 2 | 1.01E-06 | -2.9791 |
| Igsf6 | immunoglobulin superfamily, member 6 | 1.04E-06 | -3.0615 |
| Gpr56 | G protein-coupled receptor 56 | 1.10E-06 | -2.2352 |
| Fcna | ficolin A | 1.23E-06 | -4.7706 |
| Clec4a1 | C-type lectin domain family 4, member a1 | 1.29E-06 | -5.5202 |
| Gm11428 | predicted gene 11428 | 1.33E-06 | -2.5636 |
| Kcnj16 | potassium inwardly-rectifying channel, subfamily J, member 16 | 1.35E-06 | -2.5828 |
| Coro2a | coronin, actin binding protein 2A | 1.80E-06 | 1.5820 |
| Clec4a3 | C-type lectin domain family 4, member a13 | 1.88E-06 | -4.7329 |
| Muc13 | mucin 13, epithelial transmembrane | 1.91E-06 | -2.0524 |
| Abcd2 | ATP-binding cassette, sub-family D (ALD), member 2 | 2.49E-06 | -2.2046 |
| Cd68 | CD68 antigen | 2.56E-06 | -2.6229 |
| Cd34 | CD34 antigen | 2.65E-06 | -1.9429 |
| Cxcr6 | Sigmachemokine (C-X-C motif) receptor 6 | 2.68E-06 | -3.3244 |
| Mpo | myeloperoxidase | 2.80E-06 | -15.0742 |
| Car1 | carbonic anhydrase 1 | 2.95E-06 | -10.5252 |
| Pira11 | paired-Ig-like receptor A11 | 3.03E-06 | -3.3245 |
| Emr1 | EGF-like module containing, mucin-like, hormone receptor-like sequence 1 | 3.18E-06 | -6.1010 |
| Pira1 | paired-Ig-like receptor A1 | 3.23E-06 | -3.6538 |
-
Gene symbol, gene description, p value and fold change of Mgat2 deficient CD4+ T cells relative to control are shown. Data are ordered by p value.
Download links
A two-part list of links to download the article, or parts of the article, in various formats.
Downloads (link to download the article as PDF)
Open citations (links to open the citations from this article in various online reference manager services)
Cite this article (links to download the citations from this article in formats compatible with various reference manager tools)
Golgi self-correction generates bioequivalent glycans to preserve cellular homeostasis
eLife 5:e14814.
https://doi.org/10.7554/eLife.14814


