Circadian RNA expression elicited by 3’-UTR IRAlu-paraspeckle associated elements
- Aix Marseille Université, CNRS, CRN2M-UMR7286, France
Figures
Figure 1
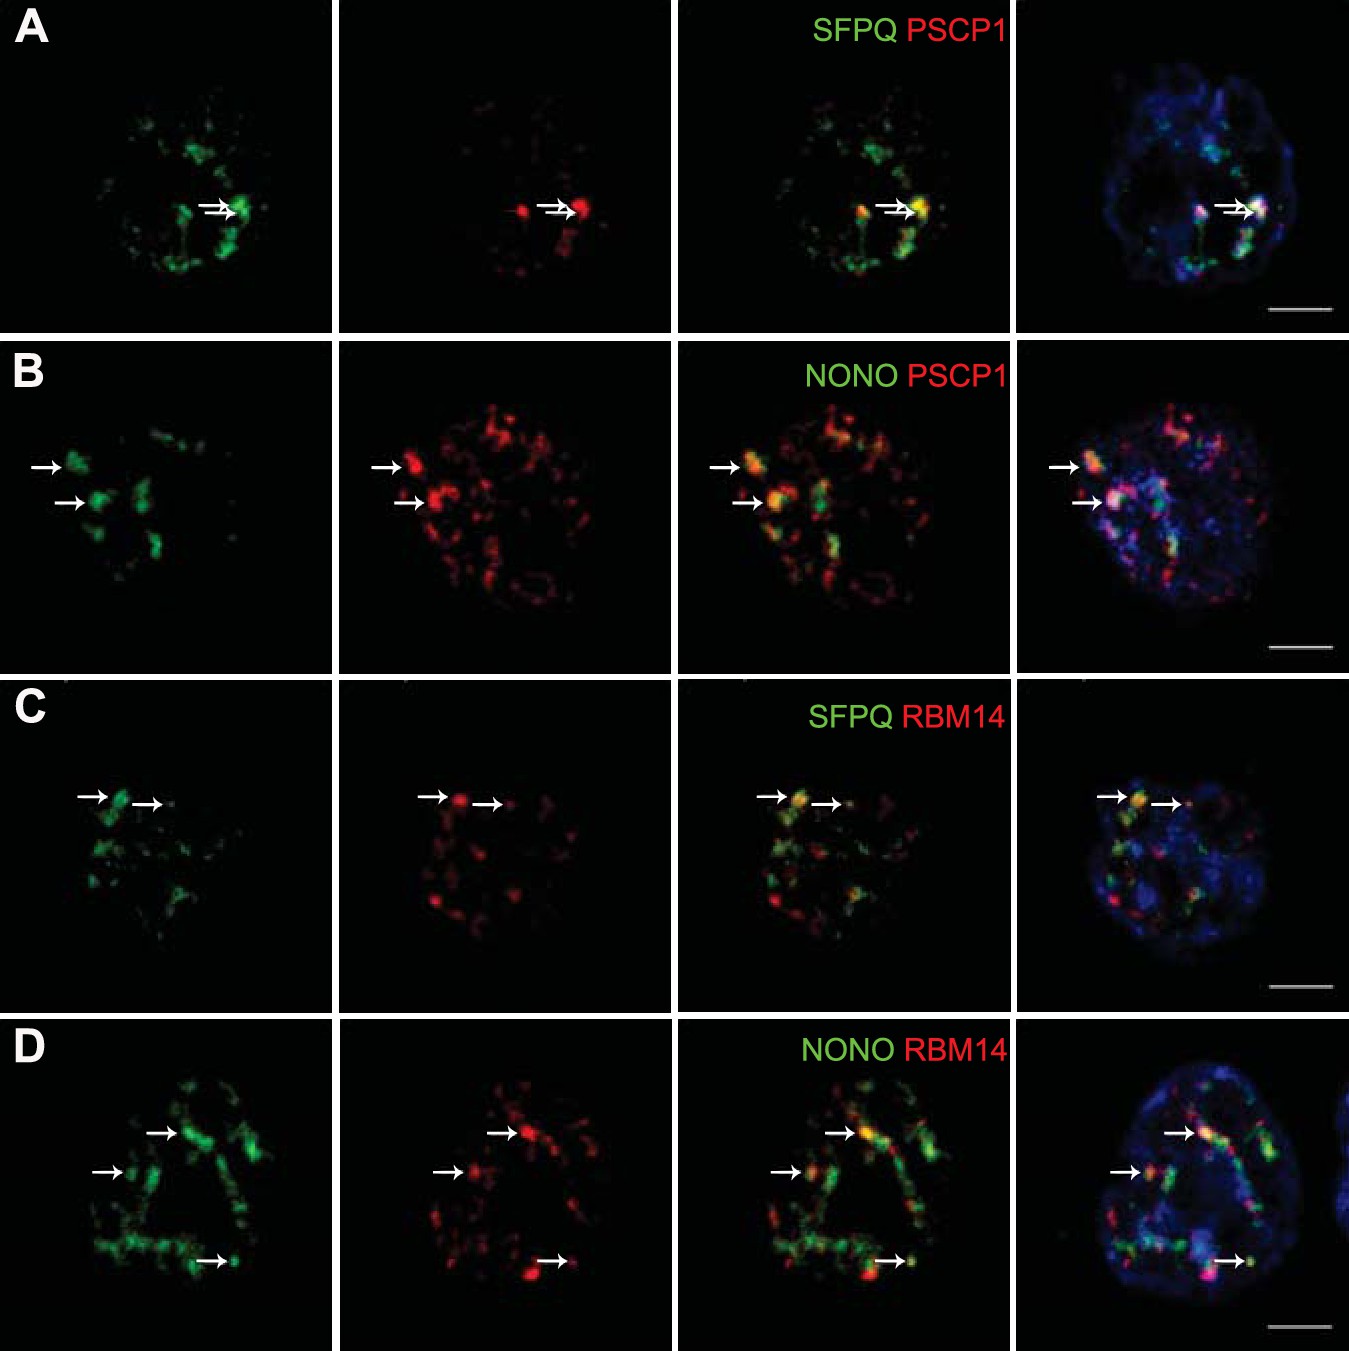
Localization by confocal microscopy of paraspeckle proteins in GH4C1 pituitary cells.
Cells are grown on coverslips and labeled for immunofluorescence with antibody to SFPQ (green A, C), NONO (green B, D) PSPC1 (red A, B) or RBM14 (red C, D). SFPQ or NONO staining is merged with PSPC1 (A, B 3th column) or RBM14 (C, D 3th column). Nuclear staining by Hoechst for the same samples is added in 4th column. Arrows indicate punctate clusters in which two paraspeckle proteins overlap. Scale bars: 5 µm.
Figure 2

Neat1 RNA in paraspeckle nuclear bodies: association with paraspeckle proteins and visualization by FISH.
(A) Association of paraspeckle proteins with Neat1 RNA RNA Immuno-Precipitation (RIP) experiments (n=4 for each antibody) using antibodies directed against NONO, SFPQ, RBM14 or PSPC1 show the enrichment in Neat1 RNA obtained as compared to an irrelevant non-specific antibody (see Figure 2—source data 1 for primer sequences). **p<0.01 vs non-specific antibody. B. Visualization of Neat1 RNA by Fluorescence in situ Hybridization and confocal laser scanning microscope Left Panel: RNA-FISH shows the distribution of Neat1 RNA in a few distinct foci (arrows). The round aspect of the foci under confocal laser scanning microscope is shown in the insert in which assigned foci is enlarged. Scale bars: 1 µm Right Panel: The extent of the nucleus is shown with Hoechst staining. Foci containing Neat1 RNA localize within the nucleus sometimes in the close vicinity of nucleus boundaries. Scale bars: 5 µm. (C) Visualization of Neat1 RNA by Fluorescence in situ Hybridization and super resolution Left Panel: Conventional fluorescence microscopy of Neat1 RNA-FISH. The nucleus is outlined with hand-drawn dashed lines to indicate the nuclear periphery. Scale bars: 5 µm. Right Upper Panel: Enlargement of the foci assigned in left panel allows to show the poor resolution of paraspeckle under conventional fluorescence microscopy (in red). In white is the superimposed high-resolution image obtained after STORM analysis. Note that the size of paraspeckle after STORM analysis is strongly reduced. Scale bars: 0.5 µm. Right Bottom Panel: Enlargement of the STORM analysis shown in the upper panel with measurements of width (Wstorm=0.14 µm) and height (hstorm=0.17 µm). Note the elliptical shape of the foci analyzed. Scale bars: 0.1 µm.
-
Figure 2—source data 1
Sequences of qPCR primers and oligonucleotides.
- https://doi.org/10.7554/eLife.14837.005
Figure 3 with 1 supplement

Rhythmic expression and association of paraspeckle components.
(A) Rhythmic expression of two paraspeckle proteins in pituitary GH4C1 cells The expression of PSPC1 and RBM14 is determined by Western Blot analysis over a 30 hr time period. Each data point (mean ± SD of three independent samples) represents the ratio of the depicted proteins to ATF2 and is expressed relative to the value obtained at ZT 30. Experimental values can be adequately fitted (R2>0.55) with a non-linear cosinor equation in which the period value is set to 24 hr (see also Figure 3—source data 1). (B) Rhythmic expression of the long noncoding Neat1 RNA. The expression of the lncRNA Neat1 is determined by RT-qPCR over a 40 hr time period. Primers used to allow the detection of both Neat1-1 and Neat1-2. Experimental values (n=4) expressed as a percent of the initial value obtained at ZT 0 can be adequately fitted (R2>0.55) with a non-linear cosinor equation in which the period value is set to 24 hr (see also Figure 3—source data 1). (C) Rhythmic association of paraspeckle proteins with Neat1 RNA RNA Immuno-Precipitation (RIP) experiments (n=4 for each antibody) are performed over a 30h time period. At each time point, the levels of Neat1 RNA determined after immuno-precipitation by the antibodies directed against NONO, SFPQ, RBM14 and PSPC1 were normalized relative to Neat1 RNA input levels and expressed as a percent of the value obtained at T0. Experimental values can be adequately fitted (R2>0.55) with a non-linear cosinor equation in which the period value is set to 24 hr (see also Figure 3—source data 2). (D–E) Rhythmic fluctuations of paraspeckle number Cells were arrested at four different times after the medium change and processed for FISH of Neat1 RNA. At each time point, 20 to 35 images from four wells of 100 000 cells obtained in two different experiments were acquired under a confocal microscope with a 40X objective. At each time point, the total number of paraspeckles per well and the mean number of paraspeckles per cell were calculated. **p<0.001 ****p<0.0001.
-
Figure 3—source data 1
Cosinor analysis of the rhythmic expression pattern of paraspeckle components in GH4C1 cells.
- https://doi.org/10.7554/eLife.14837.007
-
Figure 3—source data 2
Cosinor analysis of the rhythmic binding of the four paraspeckle-associated proteins on Neat1 RNA in GH4C1 cells.
- https://doi.org/10.7554/eLife.14837.008
Figure 3—figure supplement 1
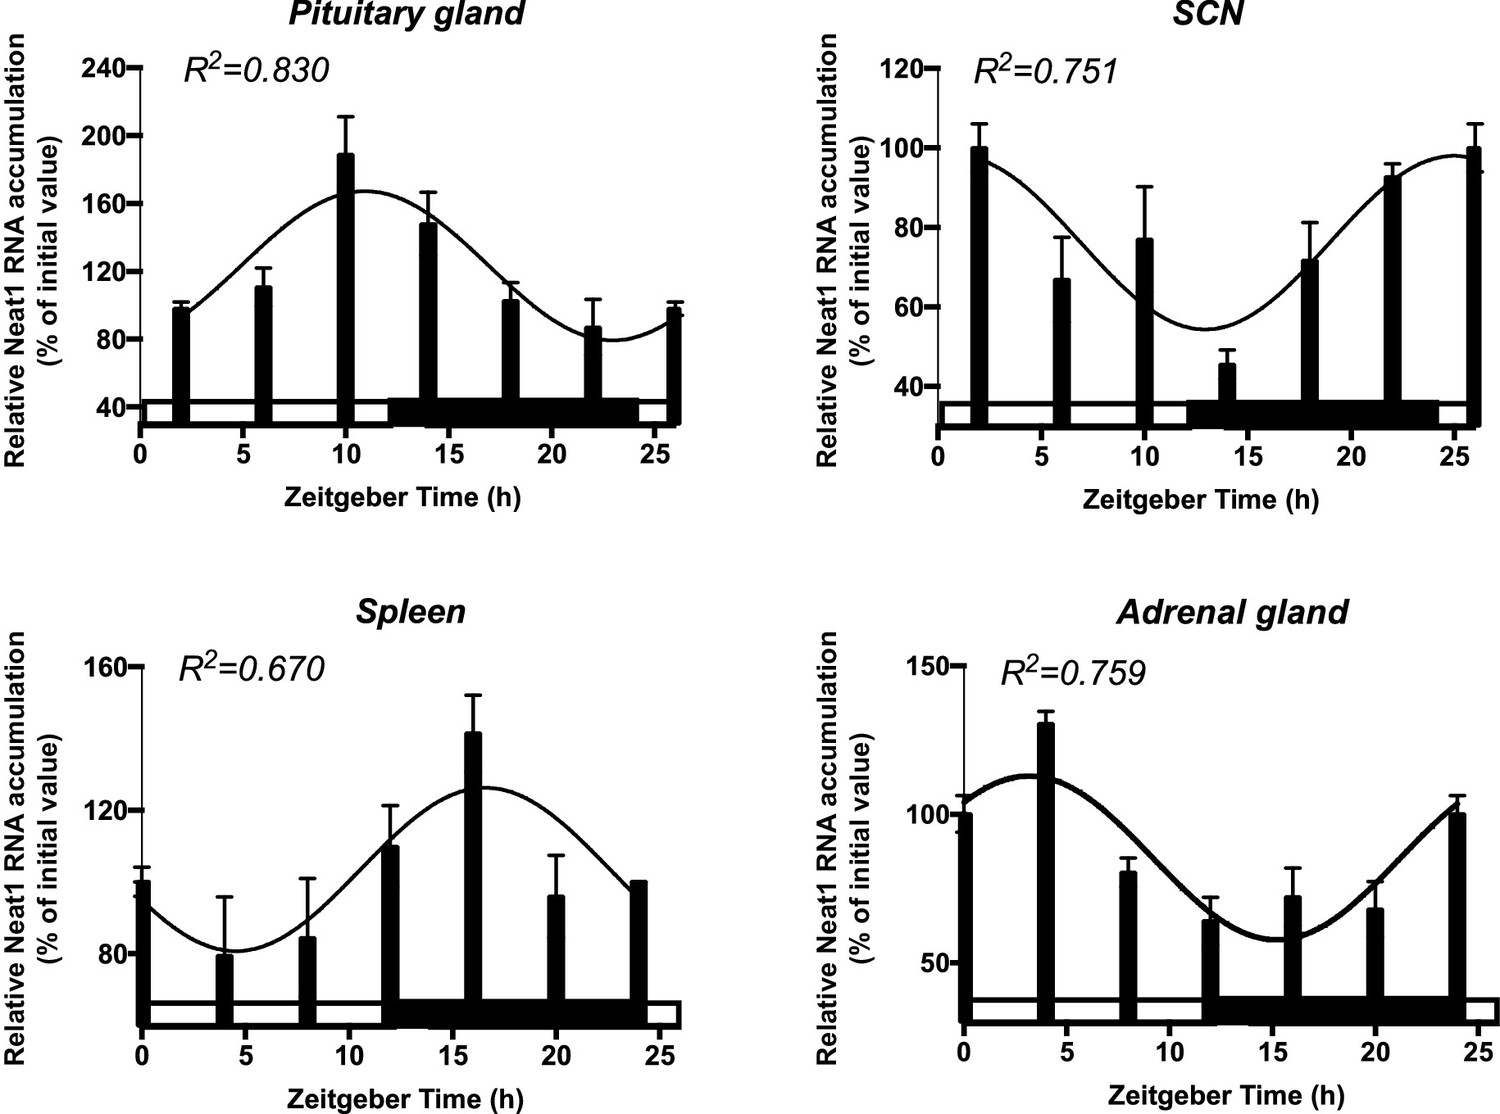
Rhythmic expression of the long noncoding Neat1 RNA in diverse circadian oscillators.
Daily pattern of expression of the long noncoding Neat1 RNA in different tissue of mice maintained in a 12h/12h light-dark cycle and sacrificed at different Zeitgeber Time (ZT). ZT0 corresponds to time of light on. Total RNA was prepared and used for cDNA synthesis followed by RT-qPCR (see Figure 2—source data 1 for the list of primers). Primers used to allow the detection of both Neat1-1 and Neat1-2. Neat1 RNA accumulation was normalized relative to 36B4 mRNA levels. White and black bars designate the light and dark phase, respectively. Experimental values expressed as a percent of the initial value obtained at ZT 0 can be adequately fitted (R2>0.55) with a non-linear sine wave equation in which the period value is set to 24 hr.
Figure 4 with 2 supplements
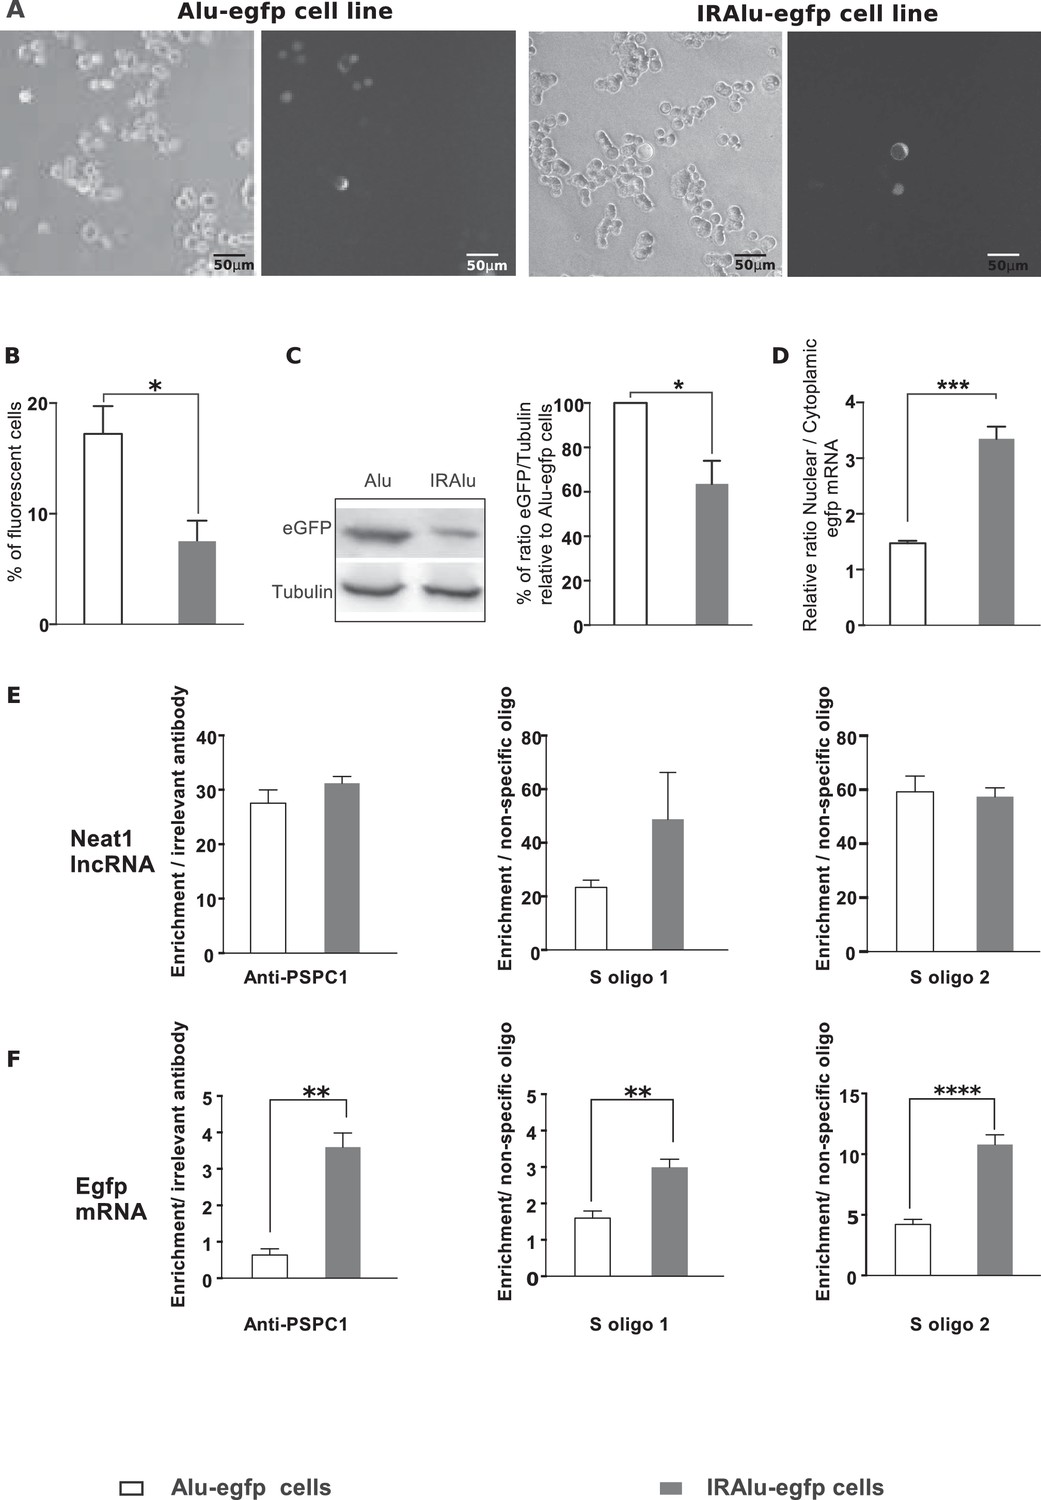
Influence of IRAlu elements inserted in 3'-UTR egfp mRNA.
(A–C) Decrease in EGFP expression by insertion of IRAlus in the 3’ -UTR of egfp mRNA. IRAlus and Alu were PCR-amplified from the 3’-UTR of Nicn1 and then inserted separately into the 3’-UTR of egfp mRNA. GH4C1 cell lines, Alu-egfp and IRAlu-egfp cell lines were established by transfection of the indicated plasmids. (A) Representative example of fluorescence and corresponding bright field pictures taken 48 hr after platting of each cell line. Scale bars equal 50 µm. (B) Quantitative analysis of the percent of fluorescent cells in each cell line. Data are means ± SEM of 18 measures performed in 3 independent experiments. (C) Quantification of relative levels of eGFP investigated by western blotting with anti-GFP antibody in total protein extracts from the two cell lines. Tubulin was used as the loading control. Data are mean ± SEM of values obtained from three experiments in IRAlu-egfp cell line and are expressed as a percent of the corresponding value obtained in Alu-egfp cell line. (D) Nuclear and cytoplasmic egfp mRNA were quantified by qPCR in each cell line and normalized to the relative amount of gapdh mRNA (n=8 for each cell line). Ratio of nuclear versus cytoplasmic egfp mRNA levels are compared between IRAlu-egfp and Alu-egfp cell lines. (E) Enrichment in lncRNA Neat1 after RNA Immuno-Precipitation (RIP) with an antibody directed against PSPC1 relative to an irrelevant antibody (left panel) or after RNA pull-down with two different specific biotinylated oligonucleotides (S oligo 1 and S oligo 2) relative to a non-specific oligonucleotide (two right panels). The relative enrichment in lncRNA Neat1 obtained after either RIP (n=3 for each cell line) or RNA pull-down (n=6 for each cell line) is not statistically different in Alu-egfp versus IRAlu-egfp cell lines F. Enrichment in egfp mRNA after RNA Immuno-Precipitation (RIP) with an antibody directed against PSPC1 relative to an irrelevant antibody (left panel) or after RNA pull-down with two different specific biotinylated oligonucleotides (S oligo 1 and S oligo 2) relative to a non-specific oligonucleotide (two right panels). The relative enrichment in egfp mRNA obtained after either RIP (n=3 for each cell line) or RNA pull-down (n=6 for each cell line) is statistically higher in IRAlu-egfp versus Alu-egfp cell lines. *p<0.05 **p<0.01***p<0.001****p<0.0001.
Figure 4—figure supplement 1
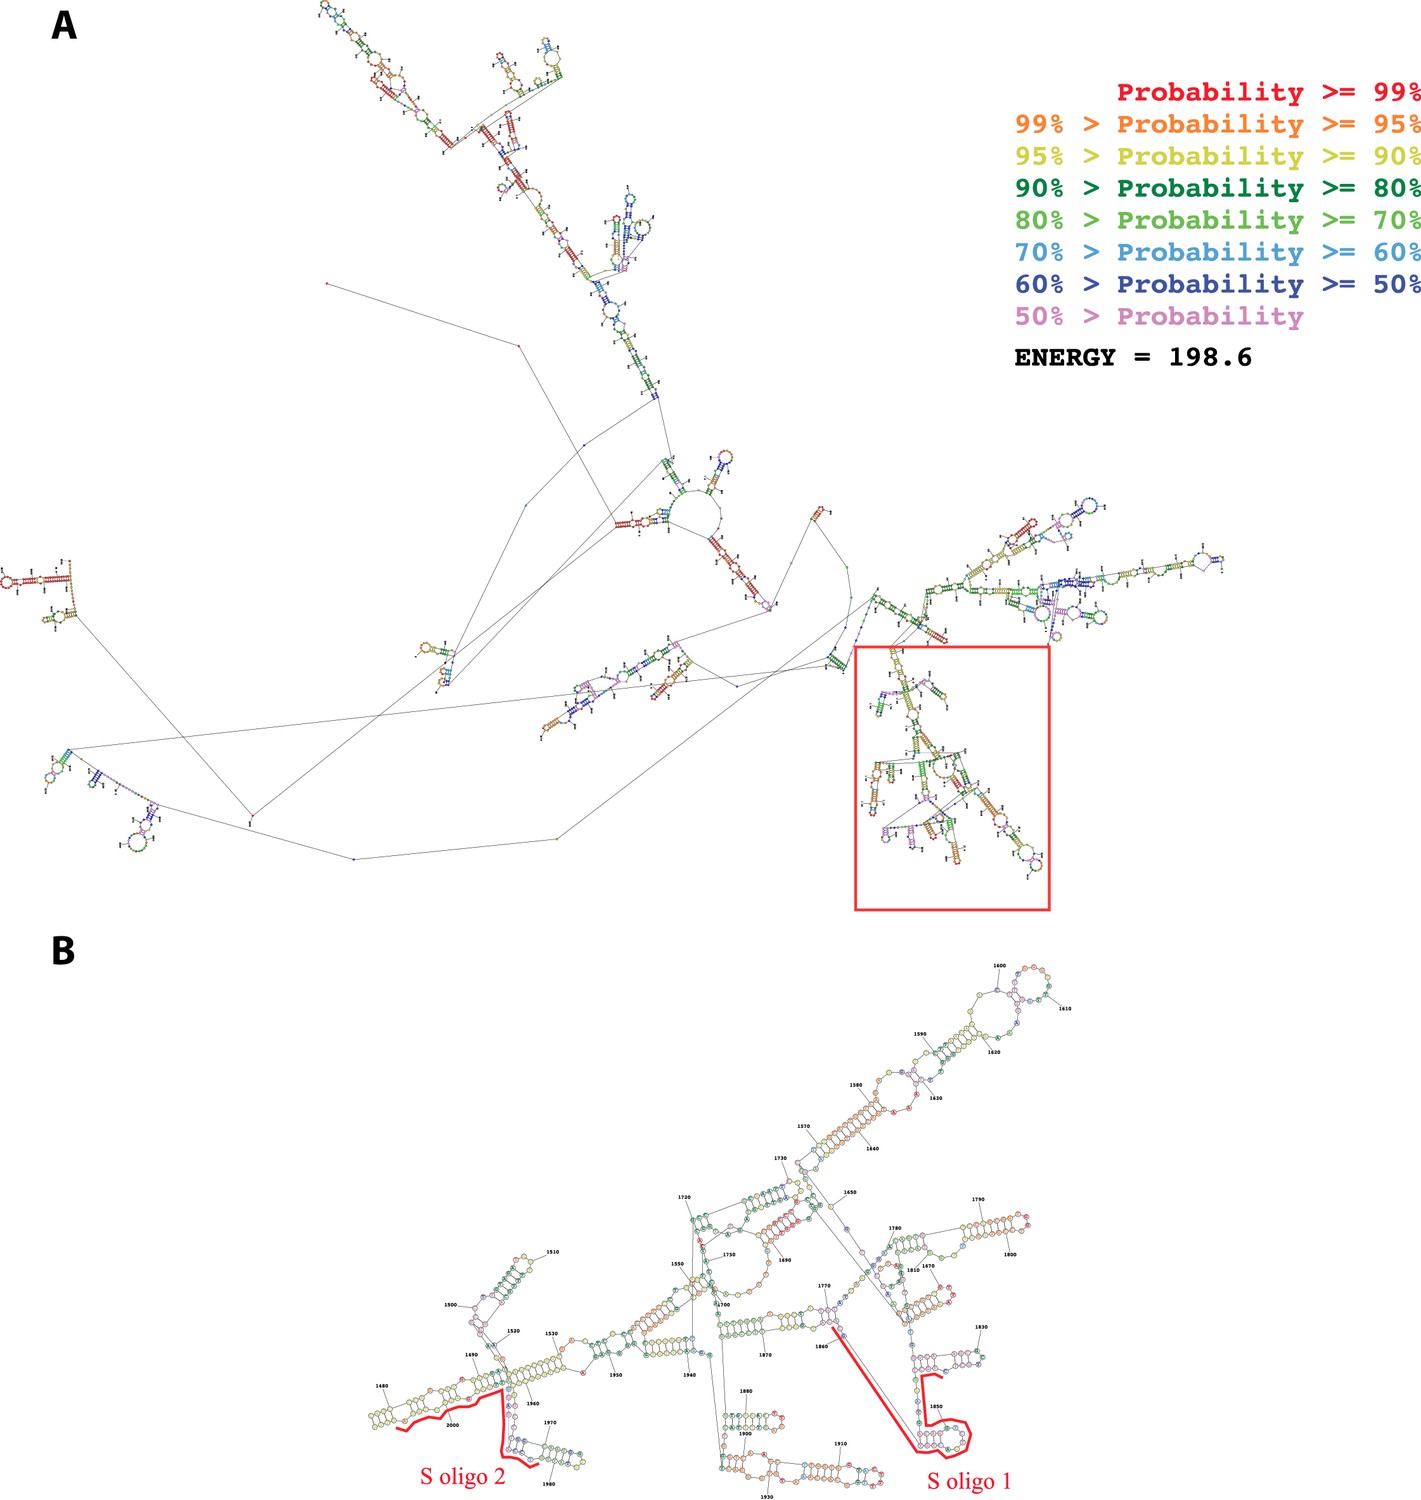
Secondary structure of the first 2500 nucleotides of the Neat1 RNA as predicted by MaxExpect software.
(A) The structure is colored according to a base-pairing probability code (zoom to view base colors). (B) Enlargement of the red box in A. The two anti-sens oligonucleotide probes designed (S oligo 1 and S oligo 2 in red) are positioned along the Neat1 RNA structure.
Figure 4—figure supplement 2
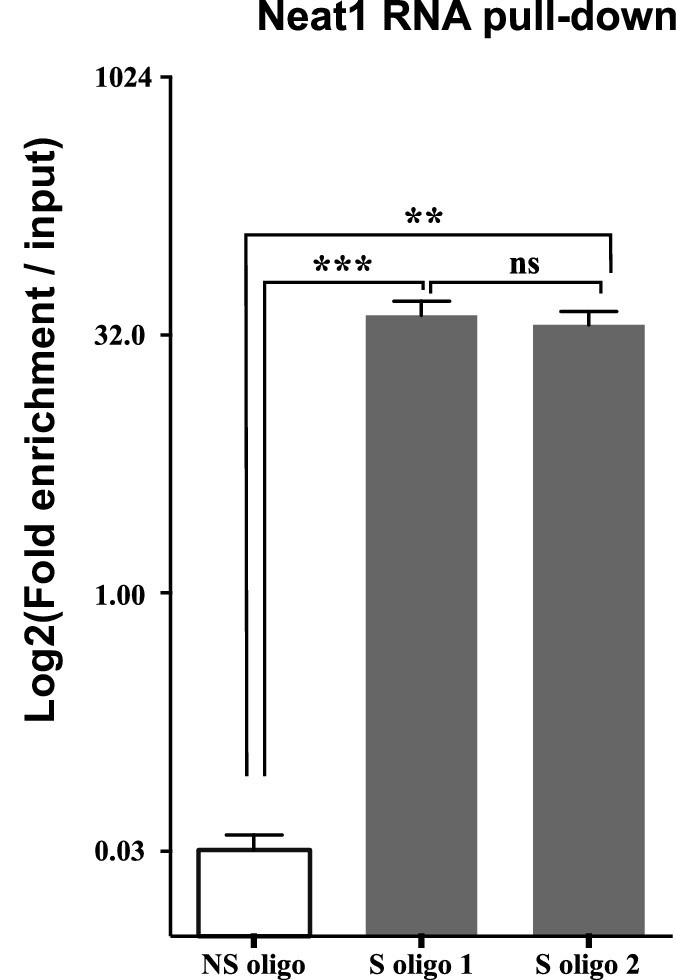
Enrichment of Neat1 RNA relative to input after RNA pull-down.
Enrichment obtained after using the two anti-sens specific (S oligo 1 and S oligo 2) or a non-specific (NS) oligonucleotide probes. **p<0.01 ***p<0.001vs non-specific oligonucleotide probe.
Figure 5 with 1 supplement
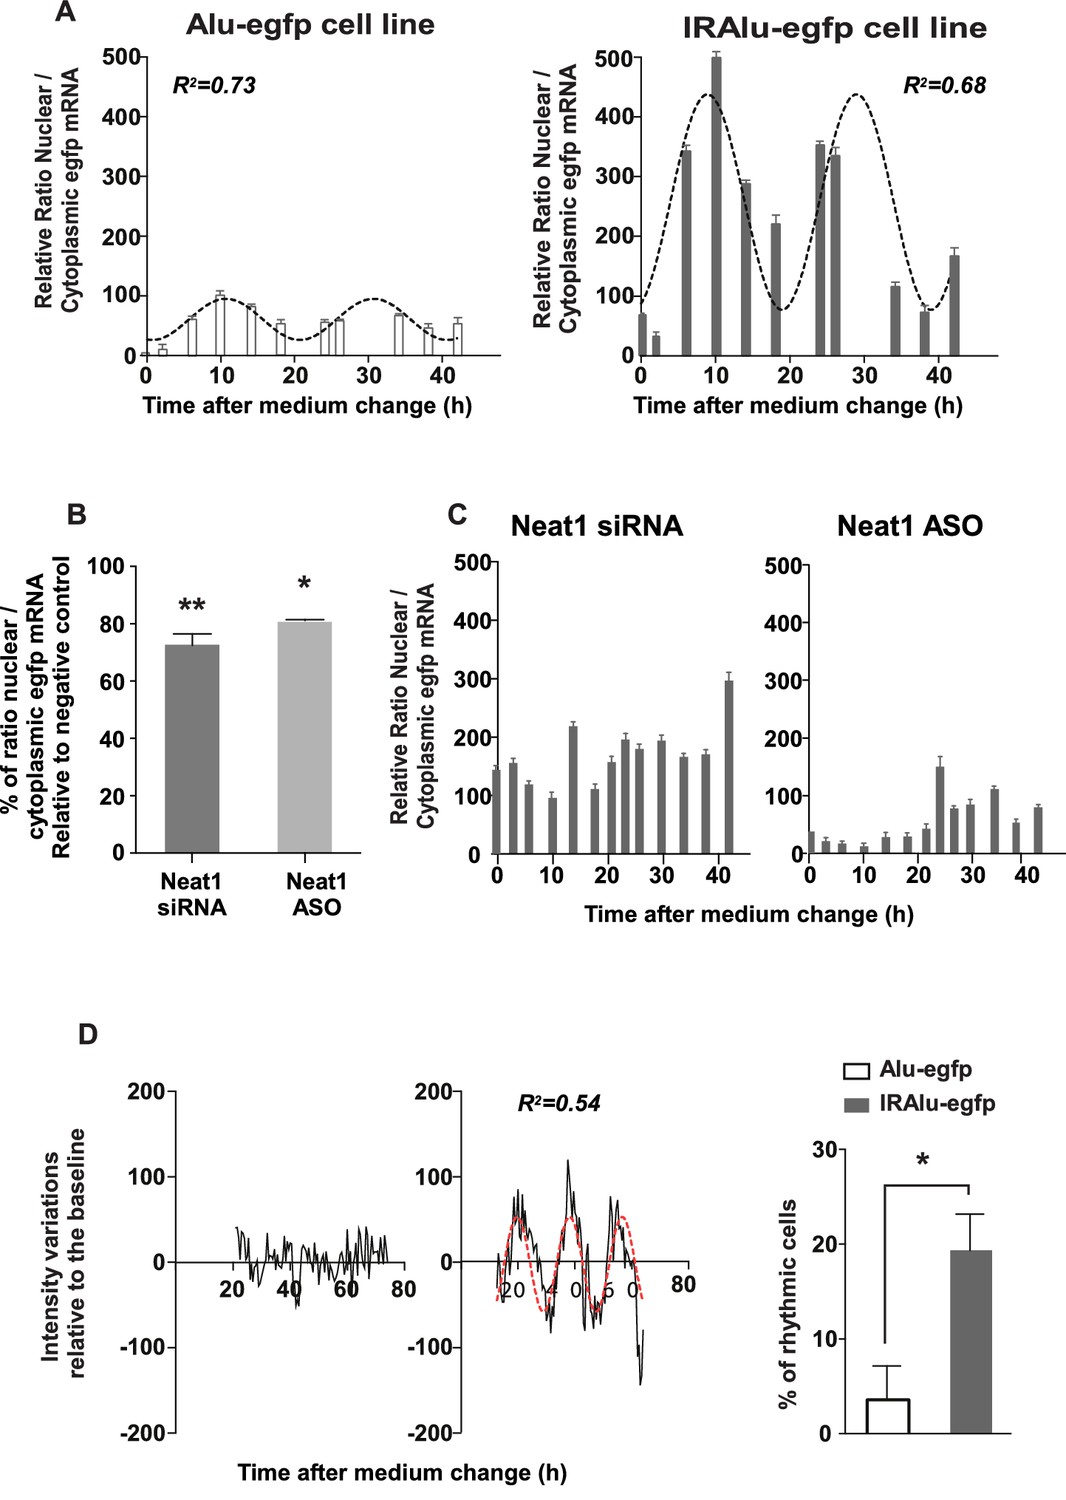
IRAlu element induced egfp mRNA circadian nuclear retention and EGFP circadian cytoplasmic expression.
(A) Rhythmic ratio of nuclear versus cytoplasmic egfp mRNA levels in Alu-egfp and IRAlu-egfp cell lines. Experimental values (n=3 for each cell line) can be adequately fitted (R2>0.55) with a non-linear cosinor equation in which the period value is set to 24 hr (see also Figure 5—source data 1). (B–C) Effects of paraspeckle disruption by Neat1 siRNA or Neat1 antisens oligonucleotides (ASO) on egfp mRNA nuclear retention in IRAlu-egfp cells. Nuclear and cytoplasmic egfp mRNA were quantified by qPCR in each condition and normalized to the relative amount of gapdh mRNA (n=2 for each condition). (B) Ratio of nuclear versus cytoplasmic egfp mRNA levels are compared between negative control and Neat1 siRNA or ASO *p<0.05 **p<0.01 (C) Loss of rhythmic egfp mRNA nuclear retention in IRAlu-egfp cells after Neat1 siRNA or ASO. Experimental values (n=2 for each condition) cannot be adequately fitted (R2<0.55) with a non-linear cosinor equation in which the period value is set to 24 hr. (D) eGFP fluorescence was recorded with real-time video microscopy in individual cells and values were fitted by a cosinor equation. Shown are examples of data from two cells that could not or could be fitted by cosinor equation, in left and right panels respectively. The percent of cells that could be fitted by cosinor equation with a R2 > 0.55 was then calculated for each cell line. This percent was significantly higher in IRAlu-egfp cell line compared to the Alu-egfp and egfp cell lines. *p<0.05
-
Figure 5—source data 1
Cosinor analysis of the rhythmic ratio of nuclear versus cytoplasmic egfp mRNA levels in Alu-egfp and IRAlu-egfp cell lines.
- https://doi.org/10.7554/eLife.14837.014
Figure 5—figure supplement 1

Effects of knockdown of Neat1 by Neat1 siRNA or Neat1 ASO.
(A) On Neat1 RNA levels: Neat1 RNA levels are reduced by about 40% as a result of siRNA or ASO treatment. ****p<0.0001 (B–D) On the Neat1 RNA circadian pattern: The pattern of Neat1 RNA expression is determined by RT-qPCR in cells treated with Neat1 siRNA, Neat1 ASO or negative control. Experimental values from negative control siRNA treatment expressed as a percent of the initial value obtained at ZT 0 can be adequately fitted (R2>0.55) with a non-linear cosinor equation in which the period value is set to 24 hr (B). By contrast, this is not the case for experimental values obtained after Neat1 siRNA (C) or Neat1 ASO (D) treatment.
Figure 6 with 2 supplements
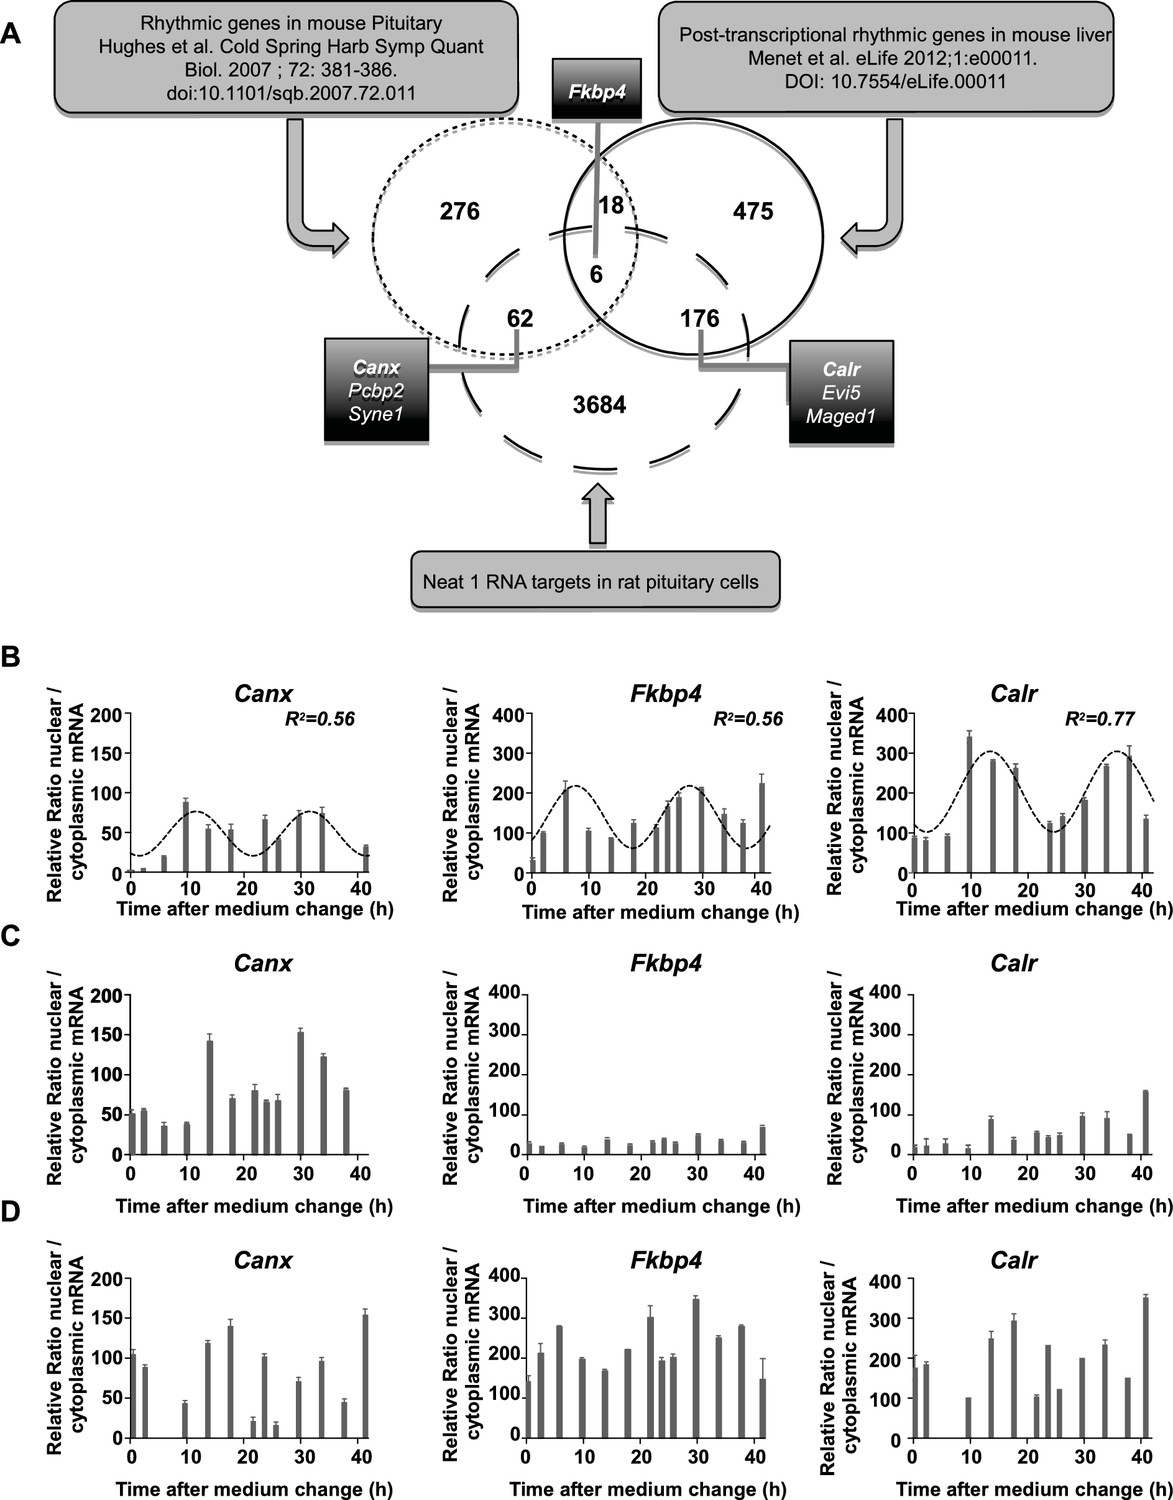
Characterization of paraspeckle-associated mRNA.
(A) Venn diagram representation of the overlap between transcripts linked to the paraspeckle (Neat1 RNA targets) with transcripts known as rhythmic genes in the mouse pituitary gland (Hughes et al., 2007) and/or post-transcriptional rhythmic genes in mouse liver (Menet et al., 2012). To allow comparison between lists from two different species, lists of genes were restricted to official gene symbol lists. Shown are the seven genes that were selected for analysis of mRNA nuclear/cytoplasmic ratio; in bold the three genes illustrated in the figure. (B) Rhythmic ratio of nuclear versus cytoplasmic mRNA levels of three selected genes. Experimental values (n=2) can be adequately fitted (R2>0.55) with a non-linear cosinor equation in which the period value is set to 24 hr (see also Figure 6—source data 1). (C–D) Loss of rhythmic ratio of nuclear versus cytoplasmic mRNA levels of 3 selected genes after Neat1 siRNA (C) or Neat1 ASO (D). Experimental values (n=2) cannot be adequately fitted (R2<0.55) with a non-linear cosinor equation in which the period value is set to 24 hr.
-
Figure 6—source data 1
List of Neat1 RNA target genes.
- https://doi.org/10.7554/eLife.14837.018
-
Figure 6—source data 2
Cosinor analysis of the relative ratio nuclear/cytoplasmic mRNA of seven Neat1 RNA targets in GH4C1 cells.
- https://doi.org/10.7554/eLife.14837.019
Figure 6—figure supplement 1
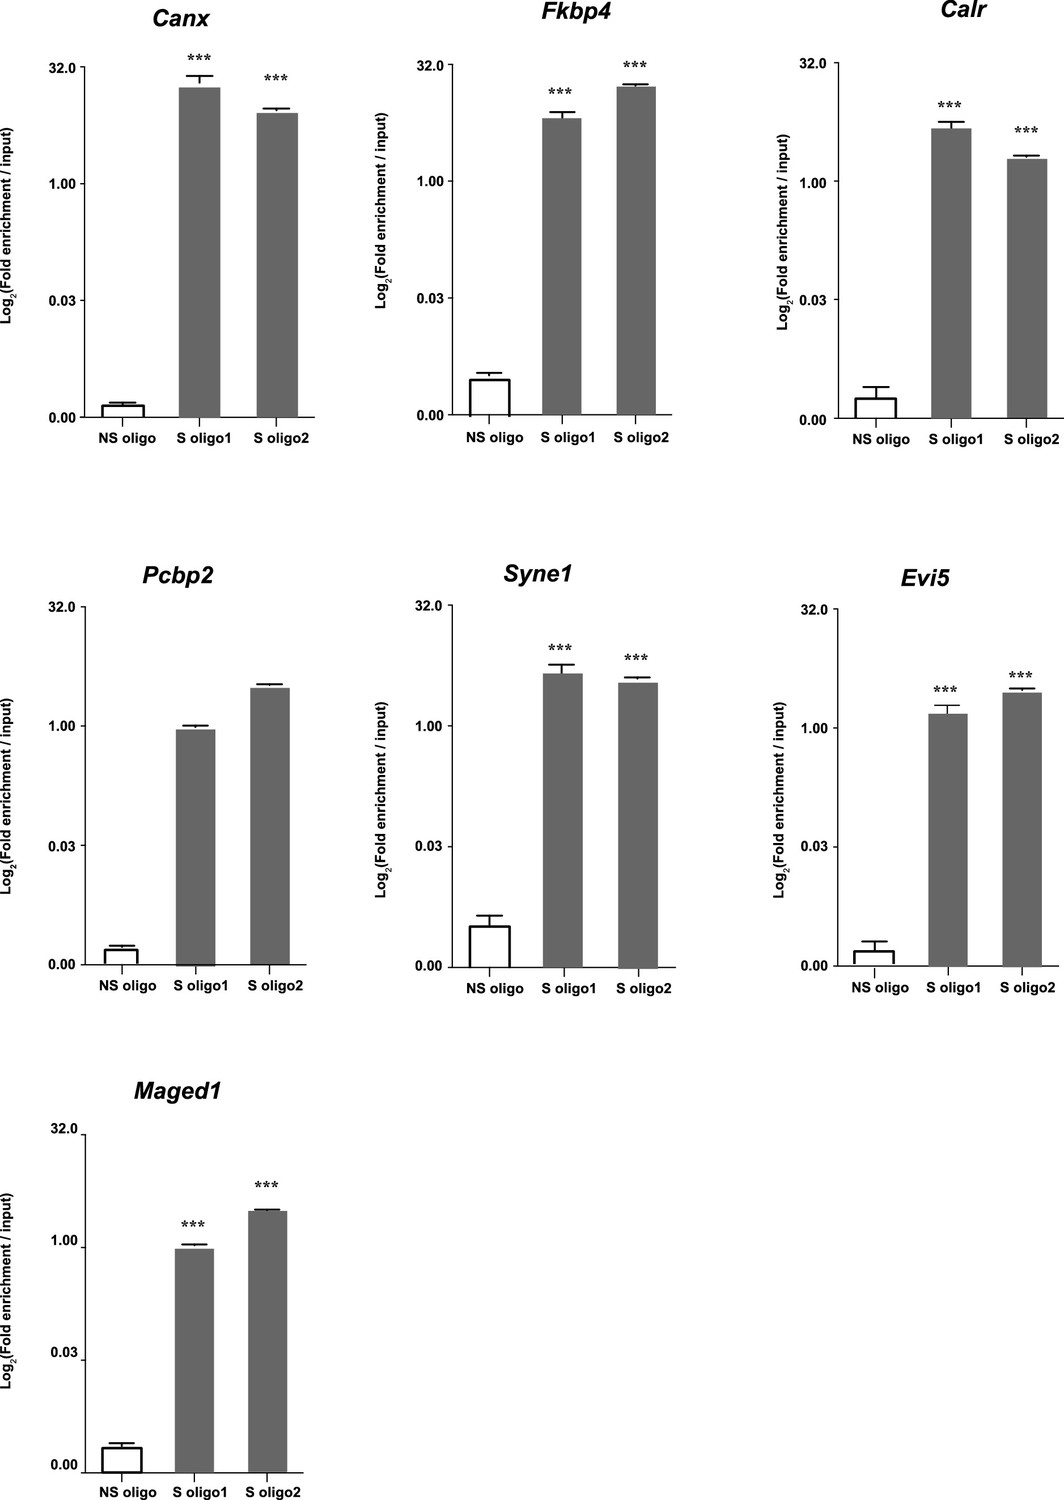
Enrichment relative to input in seven selected mRNA after Neat1 RNA pull-down.
Enrichment relative to input obtained after using the two anti-sens specific (S oligo 1 and S oligo 2) or a non-specific (NS) oligonucleotide probes. ***p<0.001vs non-specific oligonucleotide probe.
Figure 6—figure supplement 2
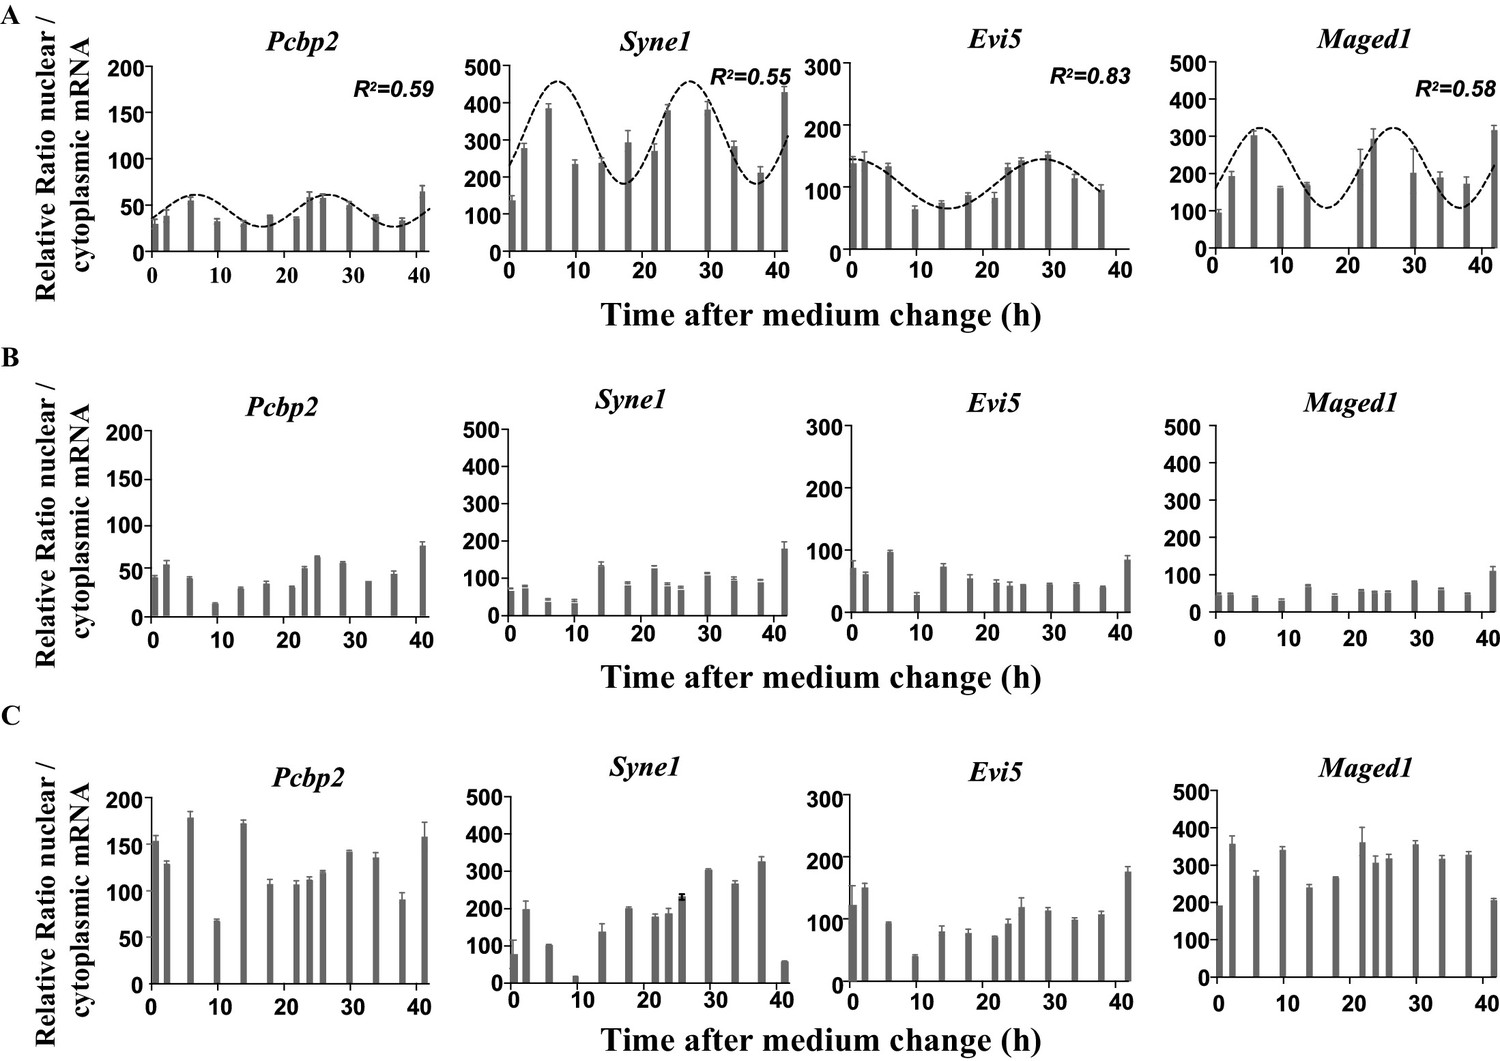
Rhythmic ratio of nuclear versus cytoplasmic mRNA levels of four NEAT1 RNA target genes.
(A) Experimental values (n=2) of the ratio nuclear versus cytoplasmic mRNA levels can be adequately fitted (R2>0.55) with a non-linear cosinor equation in which the period value is set to 24 hr (see also Figure 6—source data 1). (B-C) Loss of rhythmic mRNA nuclear/cytoplasmic ratio after Neat1 siRNA (B) or Neat1 ASO (C). Experimental values (n=2) cannot be adequately fitted (R2<0.55) with a non-linear cosinor equation in which the period value is set to 24 hr.
Videos
Video 1
Rhythmic fluorescence pattern of EGFP expression over 48 consecutive hours in an individual cell from IRAlu-egfp cell line.
https://doi.org/10.7554/eLife.14837.016Download links
A two-part list of links to download the article, or parts of the article, in various formats.
Downloads (link to download the article as PDF)
Open citations (links to open the citations from this article in various online reference manager services)
Cite this article (links to download the citations from this article in formats compatible with various reference manager tools)
Circadian RNA expression elicited by 3’-UTR IRAlu-paraspeckle associated elements
eLife 5:e14837.
https://doi.org/10.7554/eLife.14837


