Calcium influx through CRAC channels controls actin organization and dynamics at the immune synapse
- Stanford University, United States
- Children's Hospital of Philadelphia Research Institute, United States
- Perelman School of Medicine, University of Pennsylvania, United States
Figures
Figure 1
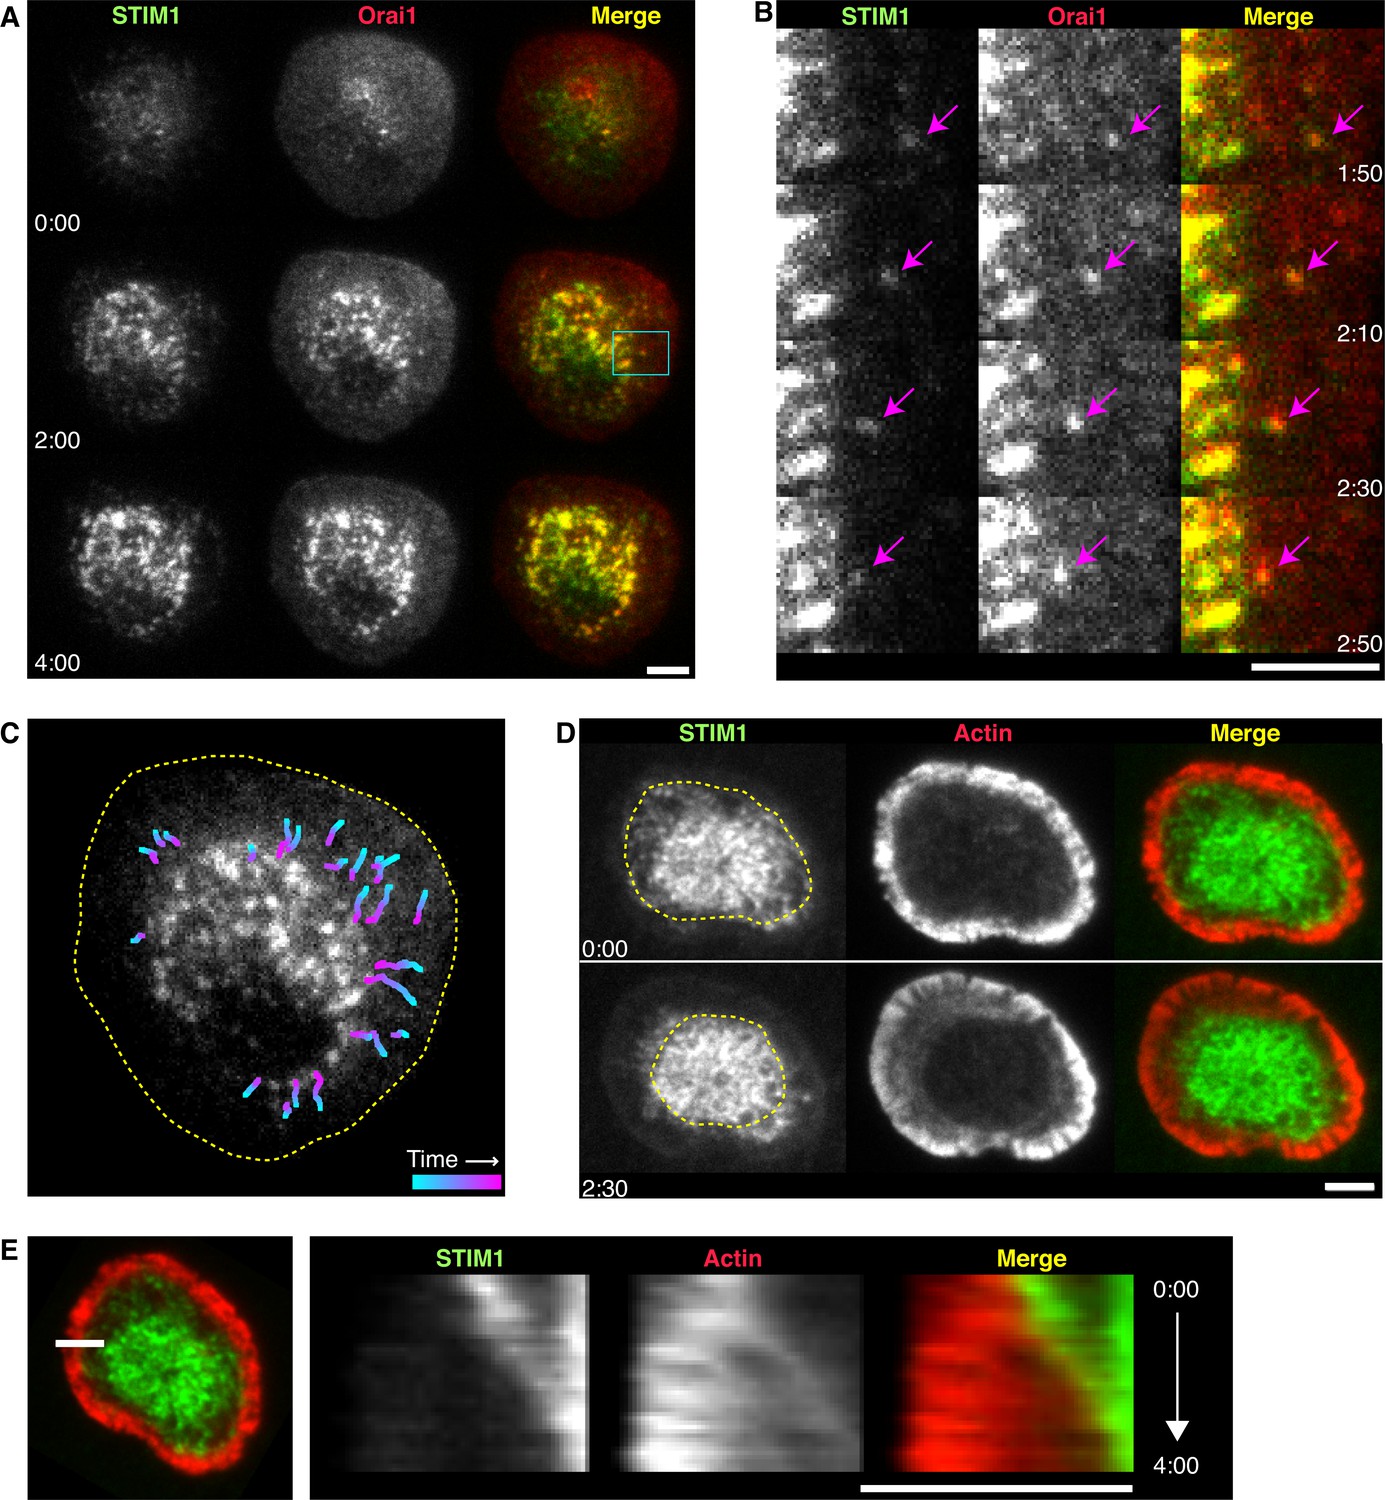
STIM1 and Orai1 accumulate in puncta in the actin-depleted zone of the immune synapse.
(A) TIRF images of Jurkat cells stimulated on anti-CD3 coated coverslips in 0.8 mM Ca2+o. mCh-STIM1 (green) and Orai1-EGFP (red) puncta accumulate in the center of the synapse over time. Images taken from Video 1. Scale bar, 5 µm. (B) Magnification of the boxed region in A shows a STIM1/Orai1 punctum (arrows) moving toward the center of the synapse. Gamma was adjusted to highlight puncta (mCh-STIM1 gamma = 1.3 and Orai1-EGFP gamma = 1.5). (C) Centripetal trajectories of STIM1 and Orai1 puncta overlaid on a single image of Orai1-EGFP. The frame-to-frame punctum velocity was 47 ± 3 nm/s (n = 24 particles, mean ± SEM). Dashed line indicates the cell edge. (D) ER tubules containing mCh-STIM1 (green) move centripetally with contraction of the EGFP-actin (red) ring. The dashed line indicates the boundary of the ADZ. (E) Kymograph analysis along the indicated line (left) from the cell in D (see Video 2). STIM1 moves at the same velocity as the edge of the actin ring. In all panels, time after initial image acquisition is indicated in min:sec; scale bar, 5 µm.
Figure 2 with 1 supplement
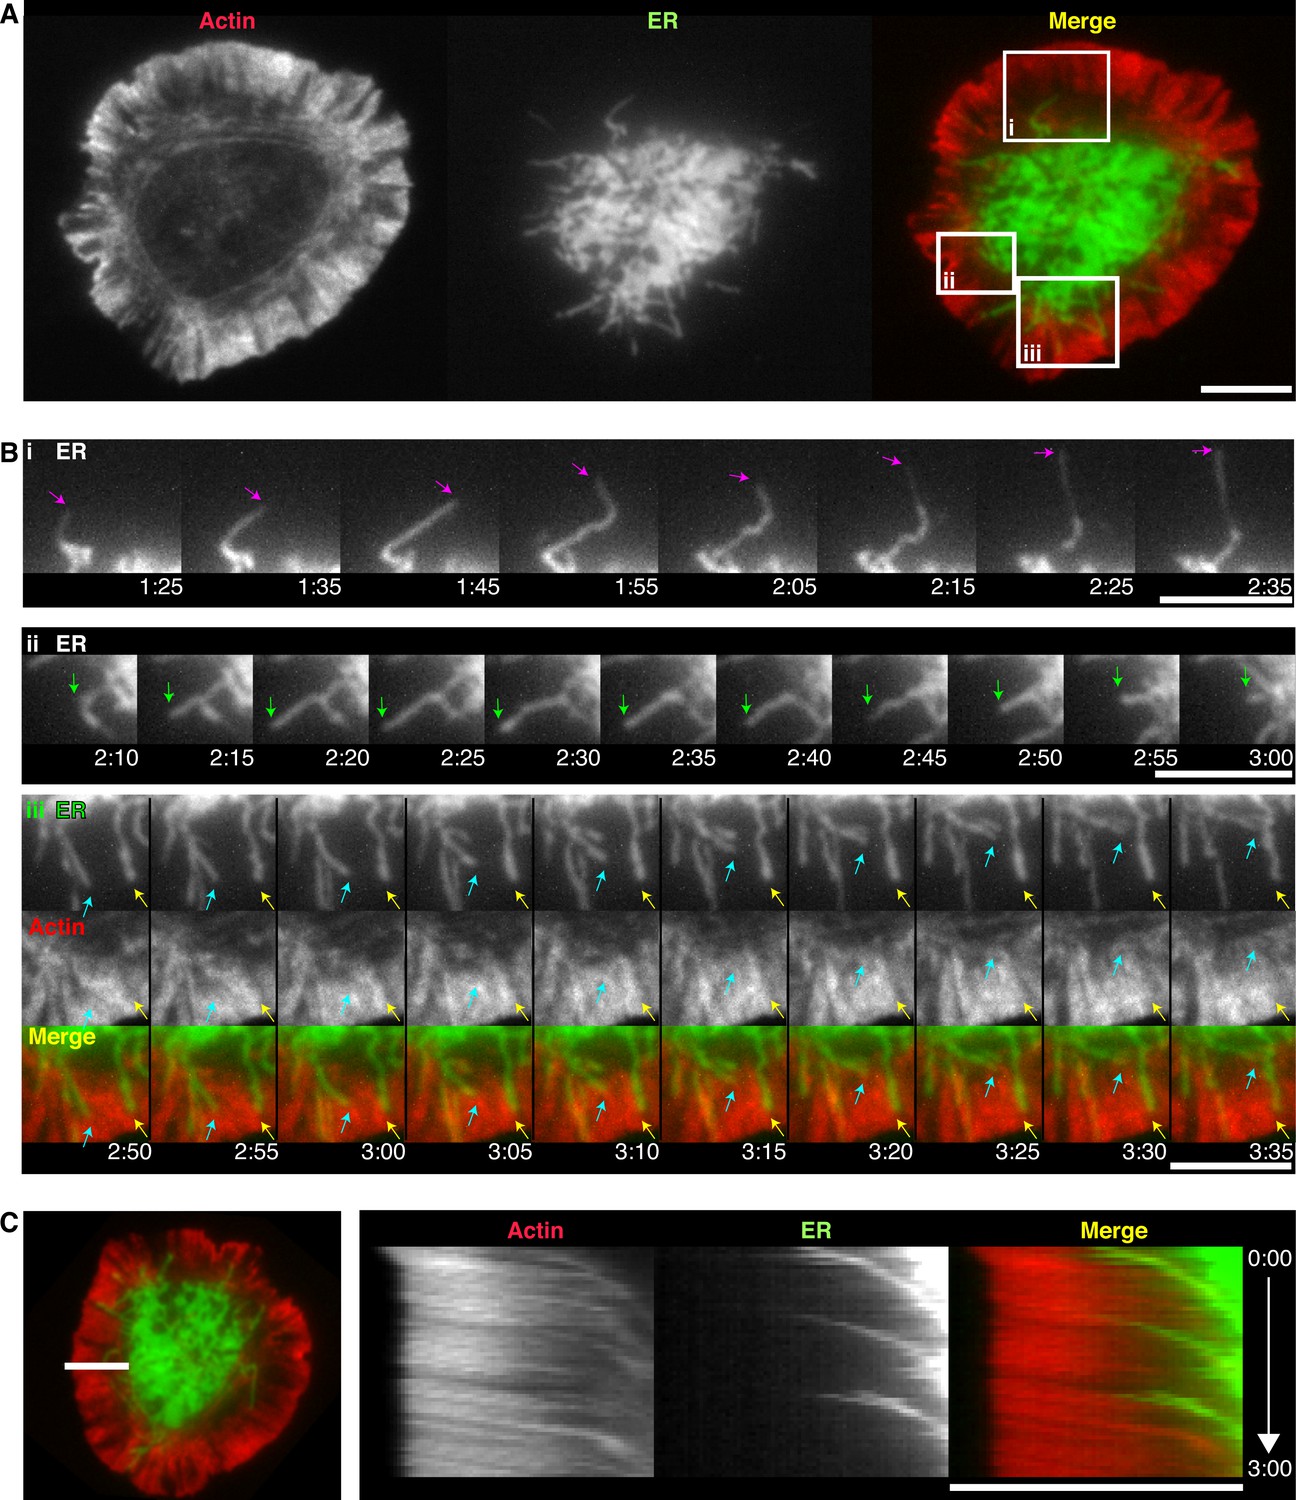
Synaptic ER tubules extend from the ADZ and are moved centripetally by actin.
(A) TIRF images of a Jurkat cell coexpressing GFP-actin (red) and ER-mCh (green), after spreading on an anti-CD3-coated coverslip. (B) Magnification of the boxed regions in A depicting an extending ER tubule (i, pink arrows), a tubule extending and retracting along the same trajectory (ii, green arrows), a tubule bending and moving centripetally between actin filaments (iii, cyan arrows) and an immobile tubule in an actin-poor region (iii, yellow arrows). (C) Kymograph analysis of the cell from A along the line shown (left) demonstrating coordinated centripetal movement of the ER and actin (see Video 3). Time after initial image acquisition is indicated in min:sec; scale bar, 5 µm.
Figure 2—figure supplement 1
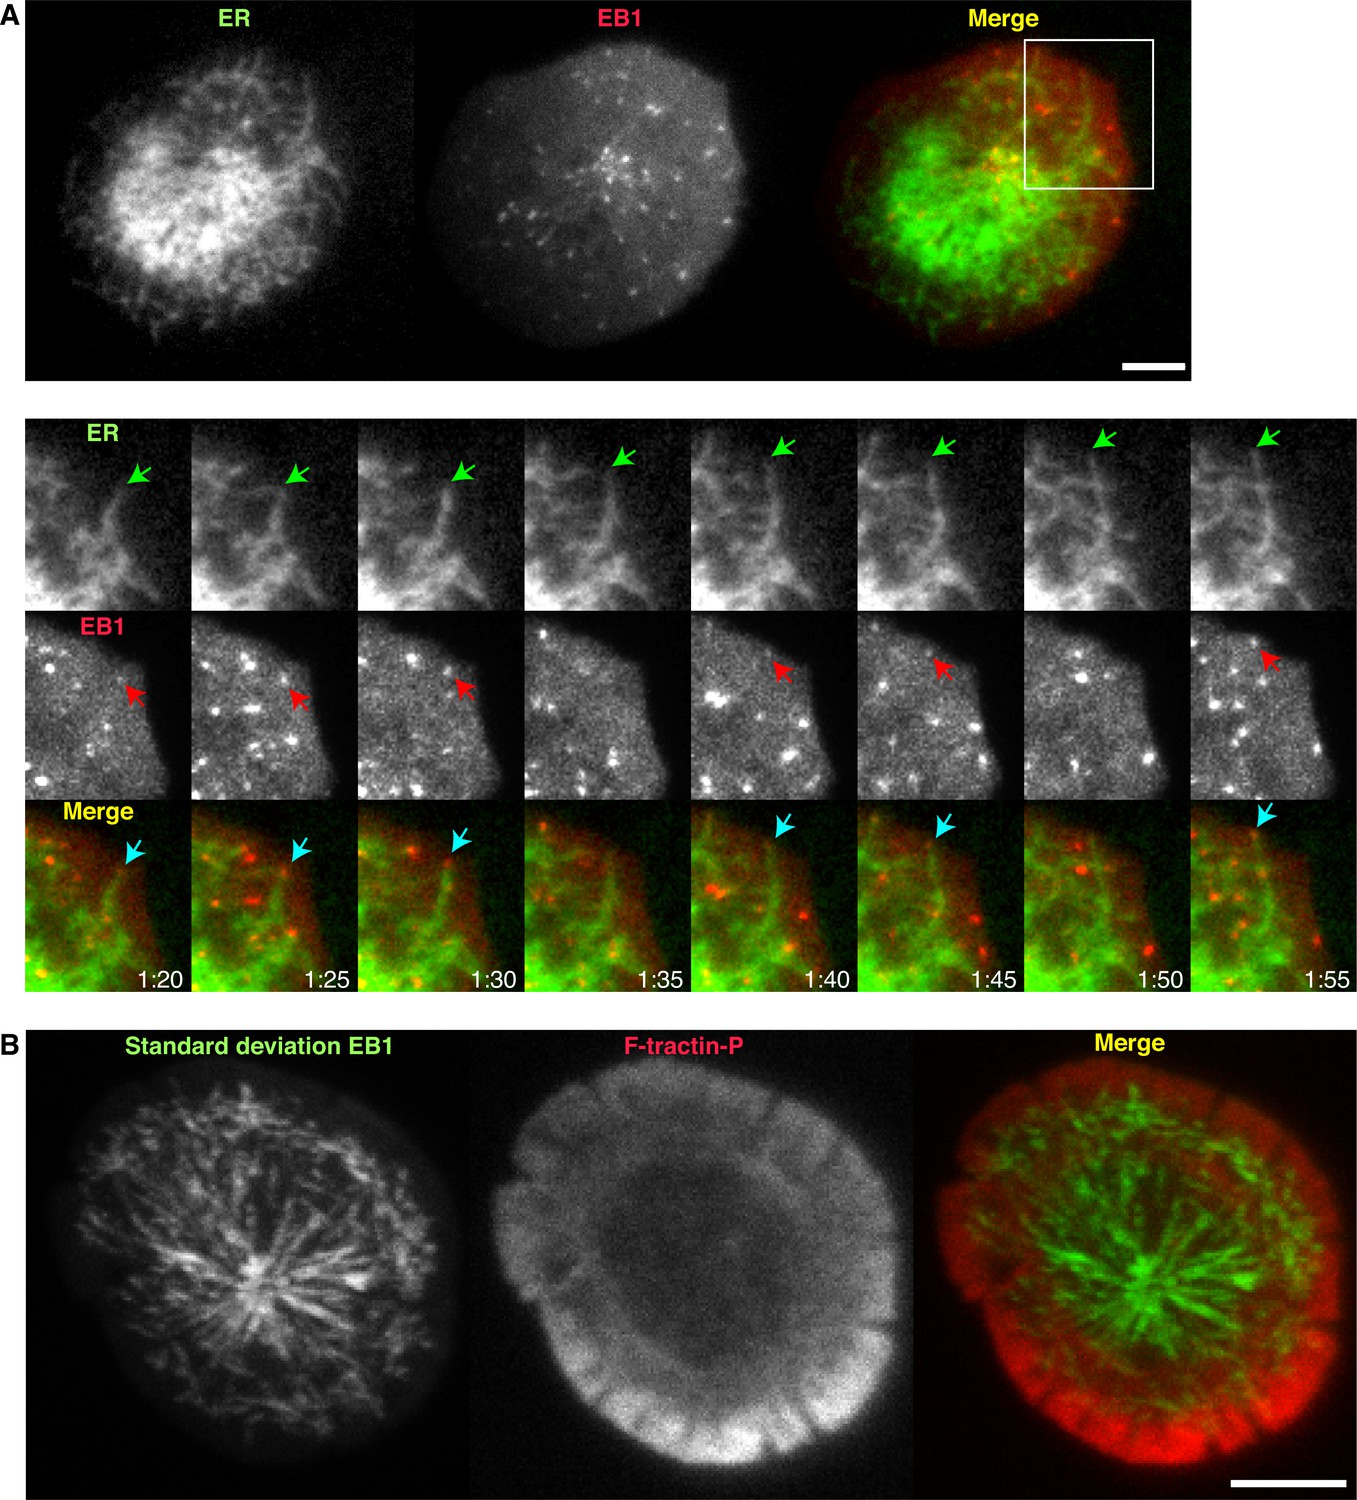
The ER extends at the tips of dynamic microtubules that move radially toward the lamella/lamellipod border.
(A) TIRF images of a Jurkat cell stimulated on anti-CD3 coated coverslips expressing EB1-EGFP (red) and ER-mCh (green). Magnified view of the boxed region shows an ER tubule moving peripherally (green arrow) with EB1 at the tip (red arrow). Images are from Video 4. (B) A projection of the standard deviation of 40 images of EB1 acquired at 1-s intervals overlaid on a single image of F-tractin-P-tdTom, indicating radial EB1 movement in the ADZ and movements perpendicular to cell edge at lamella/lamellipod border. Images are from Video 5. Time after initial image acquisition is indicated in min:sec; scale bar, 5 µm.
Figure 3

Calcium influx organizes synaptic actin and promotes retrograde flow.
(A) TIRF images of a Jurkat cell expressing F-tractin-P-tdTom after spreading on anti-CD3 in 2 mM Ca2+o (left), 3.25 min after Ca2+o removal (center), and 1 min after readdition of 2 mM Ca2+o (right). Ca2+ alters F-actin organization and density. Images taken from Video 6. (B) Spatiotemporal image correlation spectroscopy (STICS) analysis (Hebert et al., 2005) of the cell in A, depicting the direction and relative velocity of actin movement before (left) and after Ca2+o removal (center) and after readdition of 2 mM Ca2+o (right). Color scale represents relative velocities; numerical values were not assigned because small immobile features cause underestimation of velocity by STICS. (C, D) Blocking Ca2+ influx with 2-APB has the same effect on actin as removal of Ca2+o. A representative cell is shown before and 2.5 min after treatment with 100 µM 2-APB, and STICS analysis is shown in D. (E) Spinning disk confocal images of a primary human T lymphoblast expressing Lifeact-GFP after spreading on anti-CD3 and ICAM-1 in 0.5 mM Ca2+o (left), 3 min after Ca2+o removal (center), and 1.5 min after readdition of 2 mM Ca2+o (right). The width of the lamellipod (indicated by the green carets) was reduced in 0 Ca2+o. Images are maximum intensity projections of 3 successive 0.25 µm sections of the cell footprint taken from Video 7. (F) Kymograph analysis of the cell in E along the indicated yellow line (left) demonstrates centripetal actin flow rate of 426 nm/s in 0.5 mM Ca2+o (left, velocity calculated from the slope of the red dashed lines) that slows to 94 nm/s upon Ca2+o removal (center) and accelerates to 130 nm/s following readdition of 2 mM Ca2+o. Time is indicated in min:sec; scale bars, 5 µm.
Figure 4
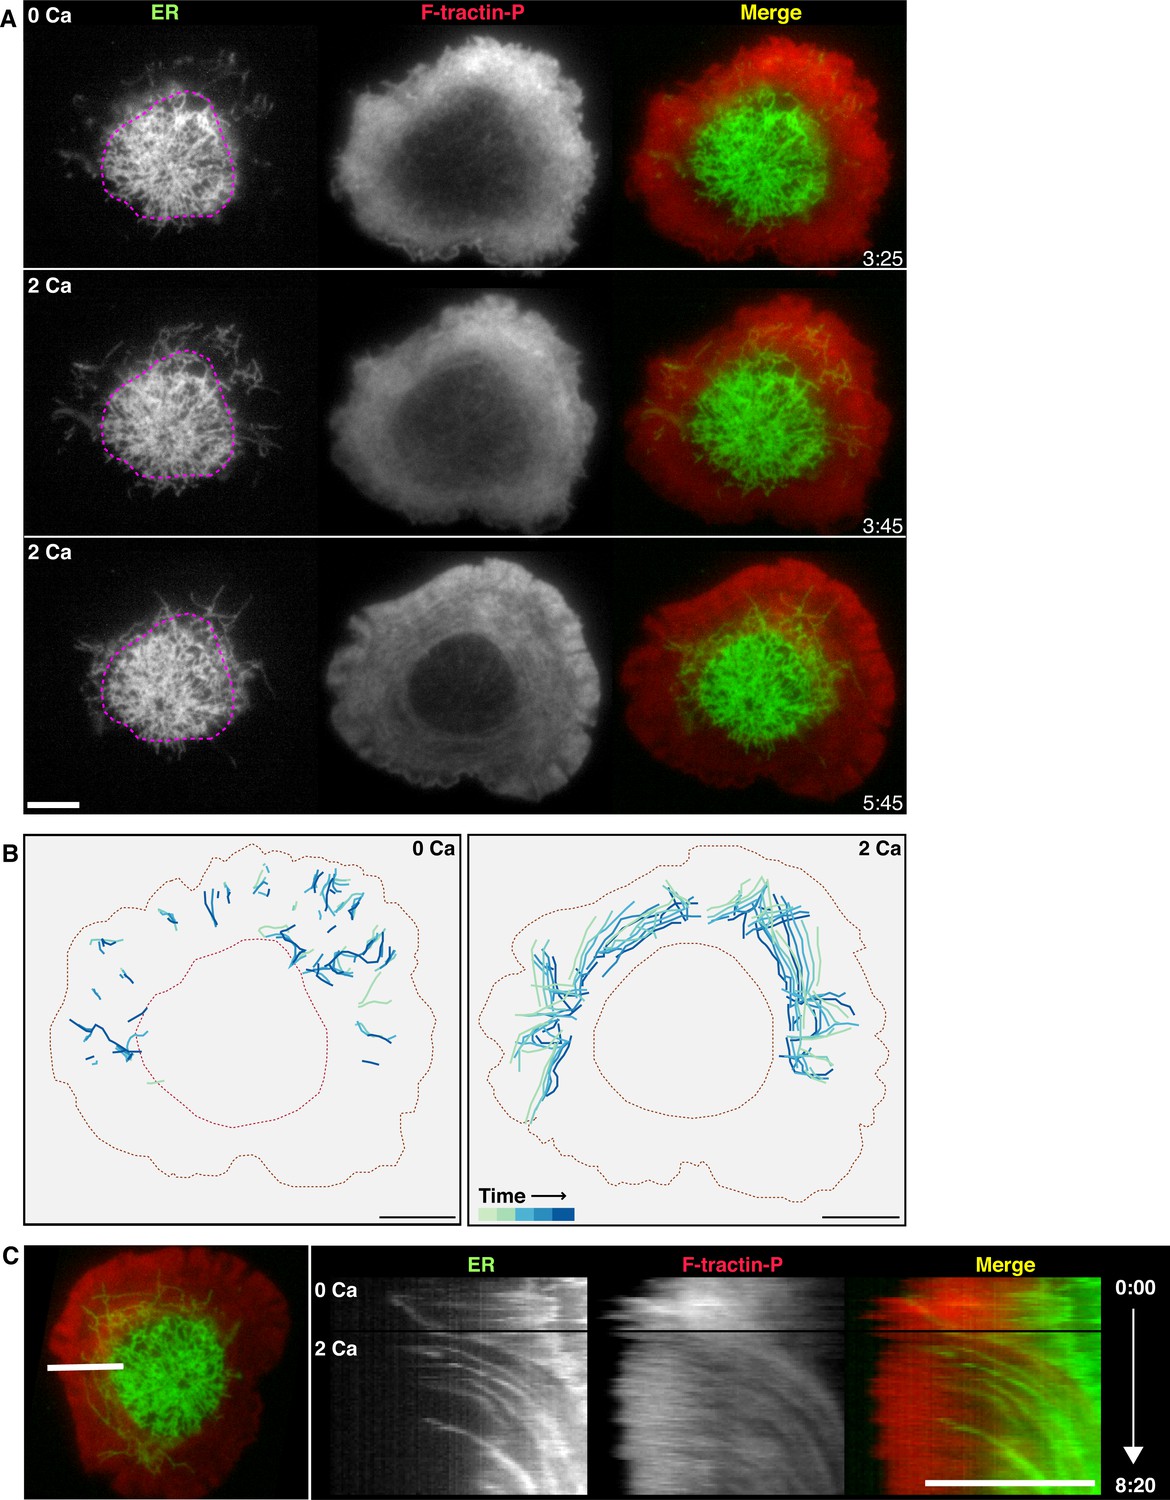
Calcium influx promotes ER corralling.
(A) A cell expressing F-tractin-P-tdTom (red) and ER-GFP (green) on an anti-CD3 coverslip is shown in 0 Ca2+o and after readdition of 2 mM Ca2+o. Peripheral ER tubules in the TIRF images are sparse in 0 Ca2+o, but Ca2+o readdition causes peripheral tubules to appear as they move into the evanescent field. Pink dotted lines outlining the edge of the ADZ in 0 Ca2+o serve as a landmark to highlight centripetal ER movement following Ca2+o readdition. Images taken from Video 9. (B) Peripheral ER tubules were traced in 5 images acquired at 10 s intervals, then color-coded for time and overlaid to indicate movement between frames in 0 Ca2+o (top) and immediately following re-addition of 2 mM Ca2+o (bottom). In 0 Ca2+o, peripheral tubules are sparse, extended and move in radial and non-radial directions. Peripheral tubules appearing upon readdition of Ca2+o move centripetally. (C) Kymograph analysis of the cell in A along the indicated line (left) demonstrates centripetal movement of ER tubules between actin structures upon Ca2+o readdition. Black horizontal lines indicate bath exchange. Gamma adjusted to 0.7 to highlight ER tubules. Time after initial image acquisition is indicated in min:sec; scale bar, 5 µm.
Figure 5 with 1 supplement
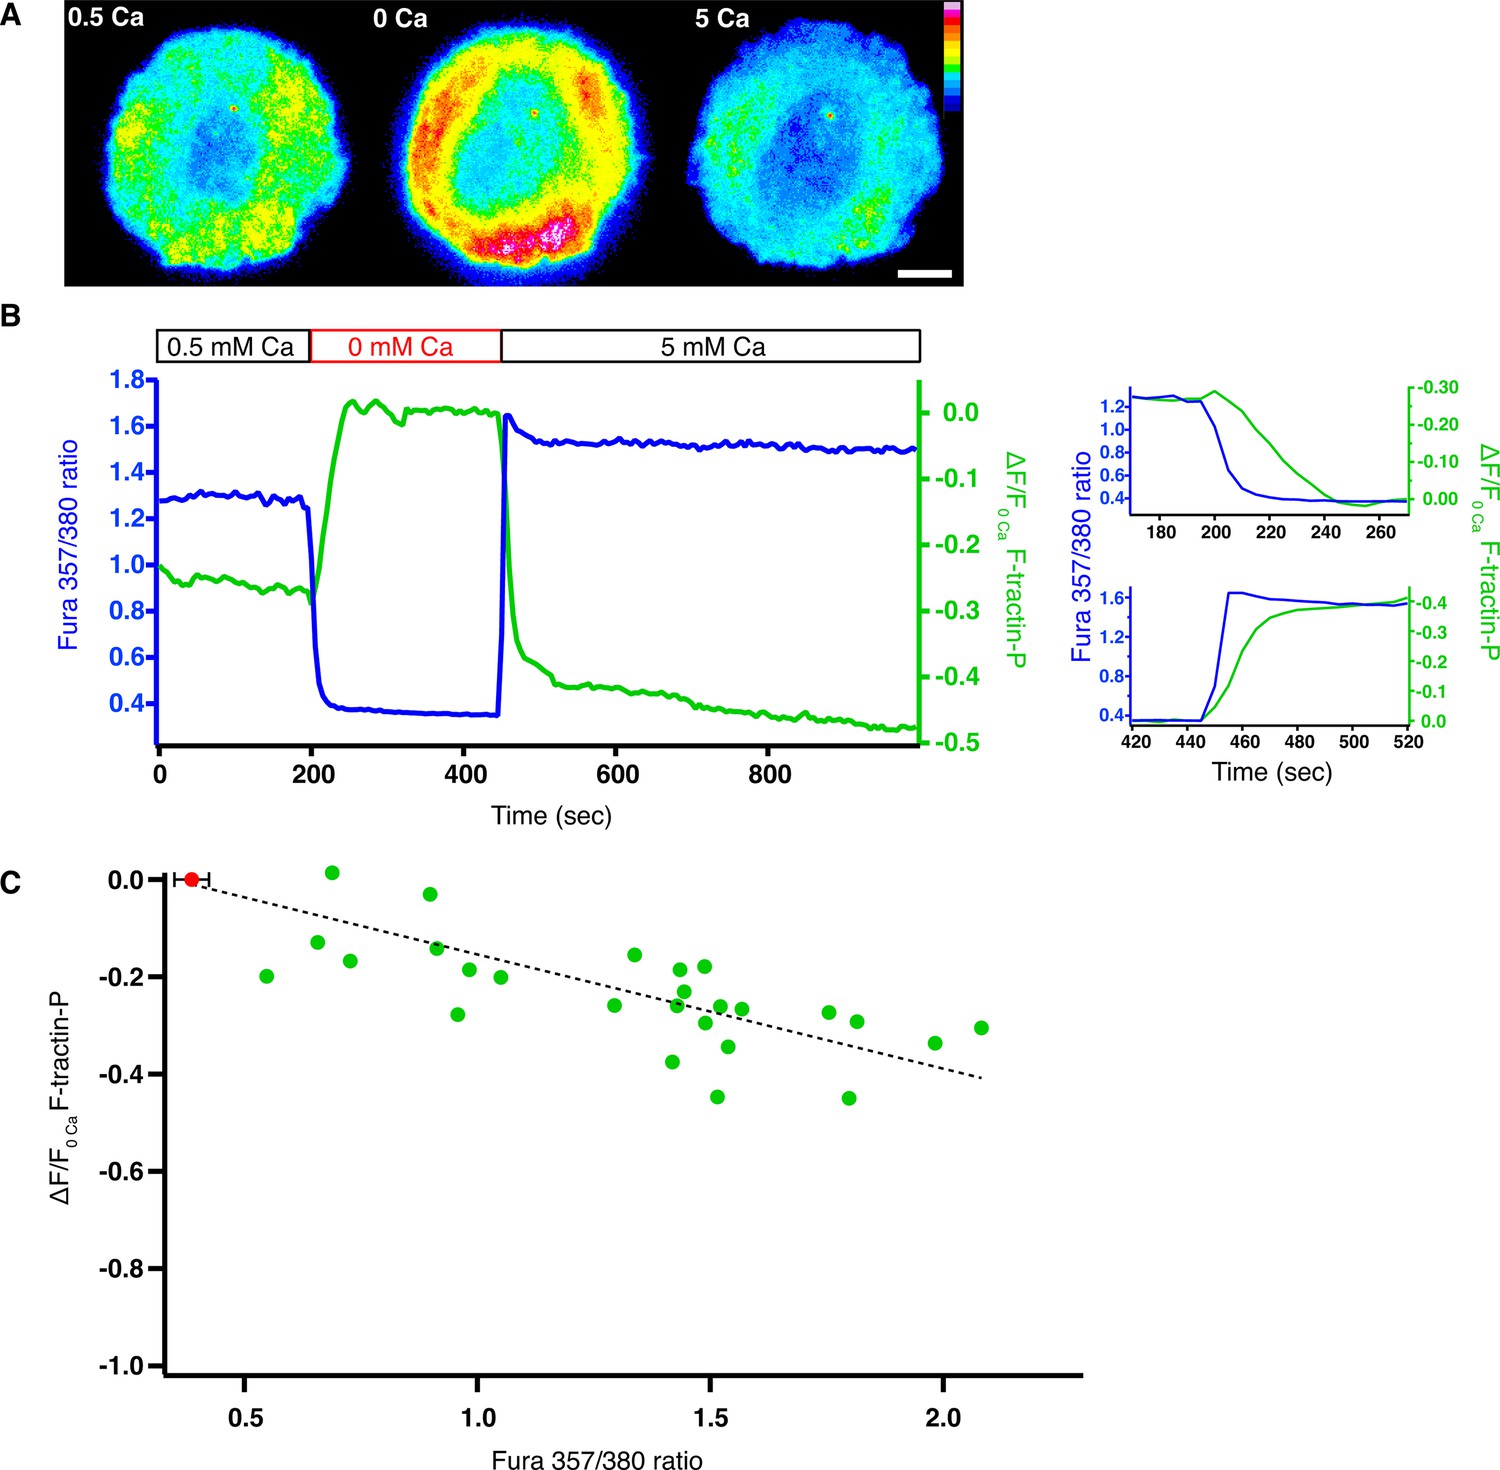
Intracellular calcium reduces the density of F-actin at the synapse.
Jurkat T cells expressing F-tractin-P-tdTom and loaded with fura-2 were stimulated on anti-CD3-coated coverslips. (A) Pseudocolor image of F-tractin-P-tdTom intensity in a cell exposed sequentially to 0.5 mM Ca2+o (left), 0 Ca2+o (center) and 5 mM Ca2+o (right), indicating a Ca2+-dependent decrease in F-actin density. Linear color scale indicates fluorescence intensity (0–1 a.u.); scale bar, 5 µm. (B) Change in F-tractin-P-tdTom fluorescence (green; relative to fluorescence in 0 Ca2+o) and fura-2 ratio (blue) from the cell in A. The data are replotted on the right with an inverted F-tractin-P axis to highlight the delay between changes in [Ca2+]i and F-tractin-P intensity upon Ca2+o removal (top)and readdition (bottom). (C) Change in F-tractin-P-tdTom fluorescence (relative to fluorescence in 0 Ca2+o or 100 µM 2-APB in 0.5 mM Ca2+o) as a function of fura-2 ratio. Each point is an average single-cell value measured at constant fura-2 ratio and F-tractin-P fluorescence in the presence of 0.5–10 mM Ca2+o (green). The red dot indicates the average baseline fura-2 ratio ( ± s.d.) for all cells in 0 Ca2+o or 2-APB. A linear fit to the data is shown (r2 = 0.83).
Figure 5—figure supplement 1
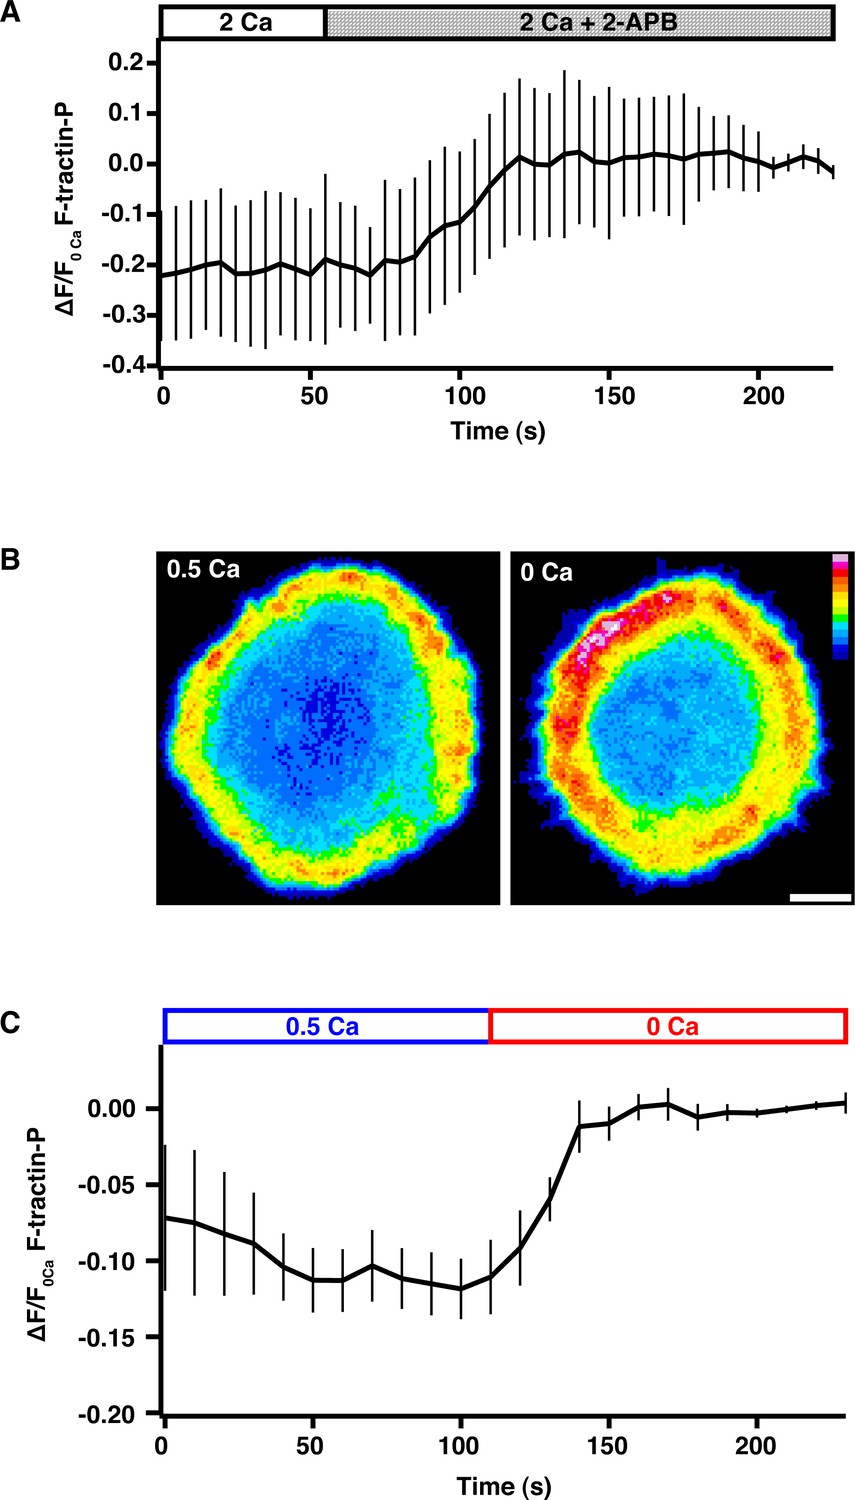
Ca2+ influx through CRAC channels reduces F-actin density at the synapse.
(A) Jurkat cells expressing F-tractin-P-tdTom were allowed to spread on anti-CD3 coated coverslips in 2 mM Ca2+o, followed by perfusion with 100 µM 2-APB to block Ca2+ influx through Orai1. 2-APB causes a 20% increase in F-actin at the synapse as indicated by the F-tractin-P-tdTom intensity vs. time normalized to the average fluorescence of the last five images (means ± SEM; n = 8 cells). (B) Spinning disk confocal images of a Jurkat cell expressing F-tractin-P-tdTom stimulated on anti-CD3 coated coverslips in 0.5 mM Ca2+o (left) and 100 s after perfusion of 0 Ca2+o (right). Scale bar, 5 µm; color scale indicates fluorescence intensity (0–1 a.u.). (C) The average F-tractin-P-tdTom intensity vs. time normalized to the average fluorescence of the last five images for cells stimulated and imaged as in B (means ± SEM; n = 10 cells).
Figure 6 with 2 supplements
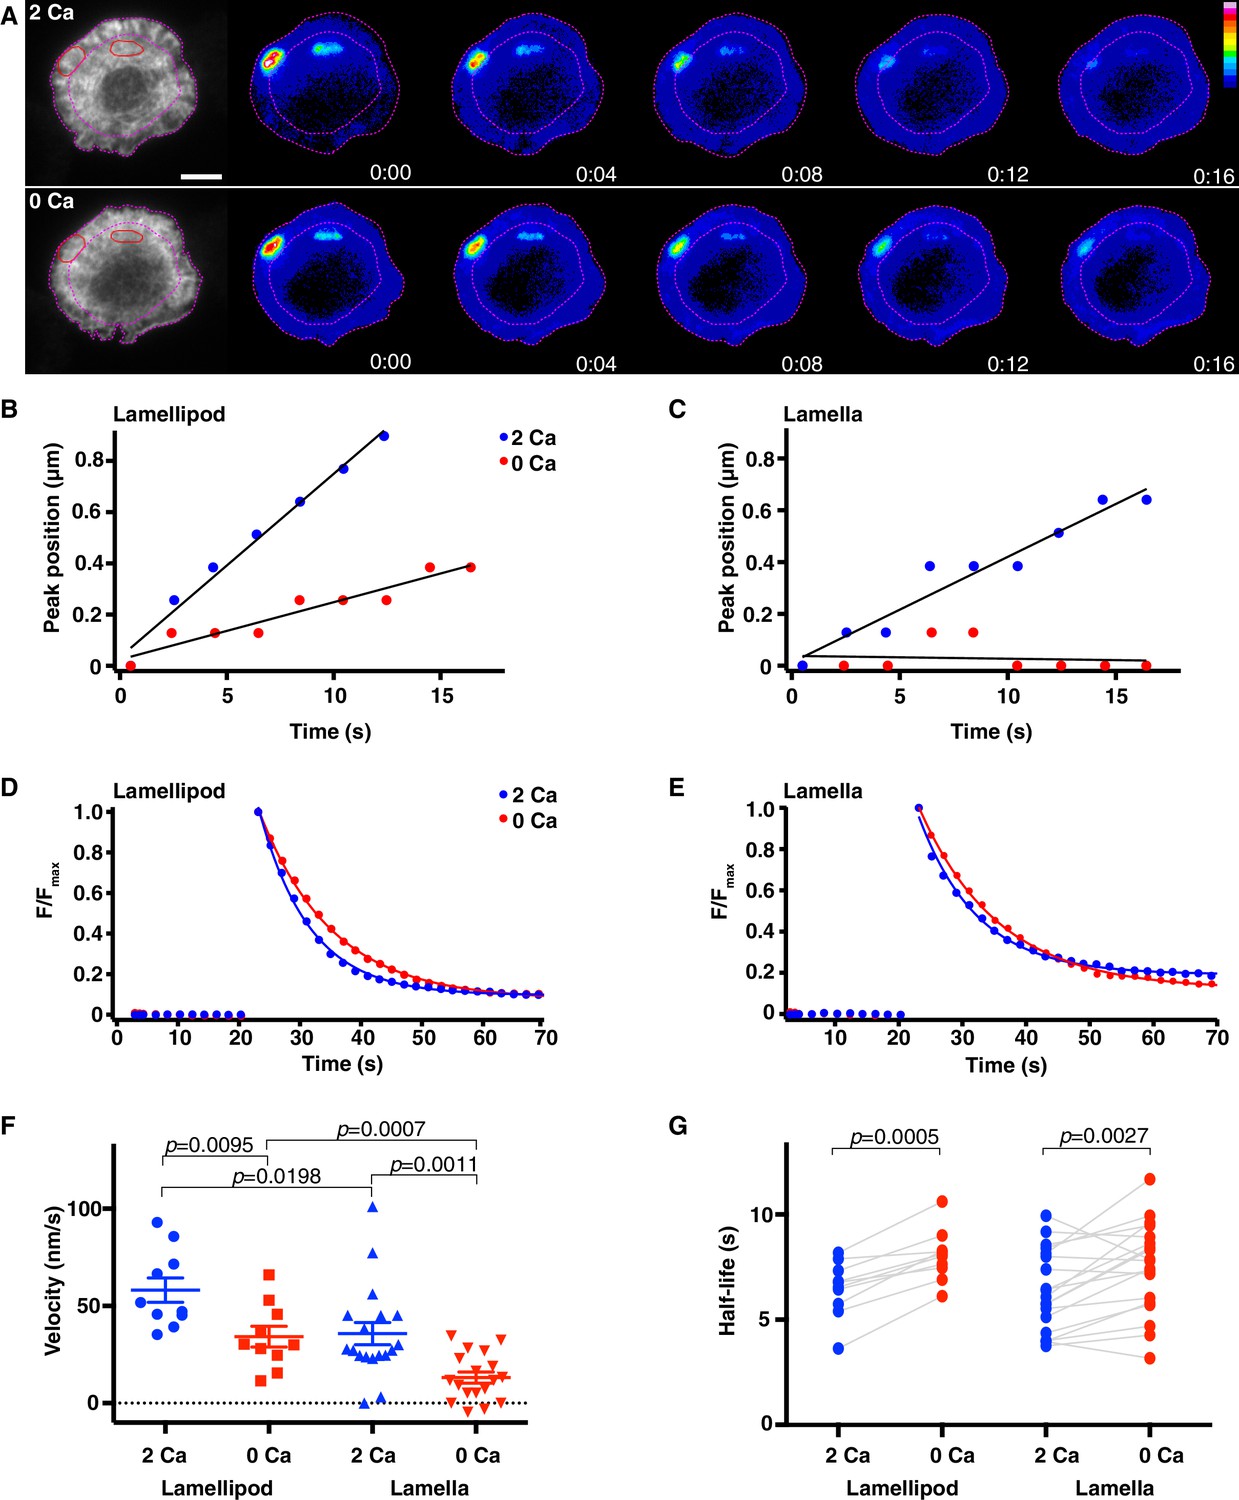
Calcium accelerates actin depolymerization and centripetal velocity at the synapse.
Jurkat T cells expressing F-tractin-P-tdTom and PAGFP-actin were stimulated on anti-CD3 coated coverslips and TIRF images of F-tractin-P-tdTom (A, left) were used to identify regions in the lamellipod and lamella (red ovals) to photoactivate. The lamella/lamellipod border in 2 mM Ca2+o and cell edge are indicated by pink dashed lines. (A) Widefield epifluorescence images of PAGFP-actin after photoactivation in 2 mM Ca2+o (top) and a subsequent photoactivation in 0 Ca2+o (bottom). Images are from Video 10; color scale indicates fluorescence intensity (0–1 a.u.). Time after photoactivation indicated in min:sec. Scale bar, 5 µm. (B, C) Position of peak PAGFP-actin fluorescence as a function of time after photoactivation in the lamellipod (B) and the lamella (C) (see figure supplement 1A-D). Data are plotted in the presence (blue) and absence (red) of Ca2+o for the cell pictured in A. Linear fits to the data indicate lamellipod velocities of 72 nm/s (2 Ca) and 22 nm/s (0 Ca) and lamella velocities of 41 nm/s (2 Ca) and 1 nm/s (0 Ca). (D, E) The fluorescence decay of photoactivated PAGFP-actin in the lamellipod (D) and lamella (E) for the cell in A was fitted by a single exponential. In the lamellipod, τ = 8.3 s (2 Ca) and 12.0 s (0 Ca); in the lamella, τ = 9.2 s (2 Ca) and 12.4 s (0 Ca). F/Fmax is the fluorescence intensity after photoactivation relative to the peak. (F) The centripetal velocity of photoactivated actin in the lamellipod (n = 10 cells) and lamella (n = 18 cells) in the presence of absence of Ca2+o, calculated as described in B, C. Error bars indicate SEM; p-values from Student’s two-tailed t-test. (G) Actin filament half-life calculated from the exponential rate of fluorescence decay in photoactivated regions in the lamellipod (n = 10) and lamella (n = 19) with and without Ca2+o. P-values are from paired Student’s two-tailed t-test.
Figure 6—figure supplement 1
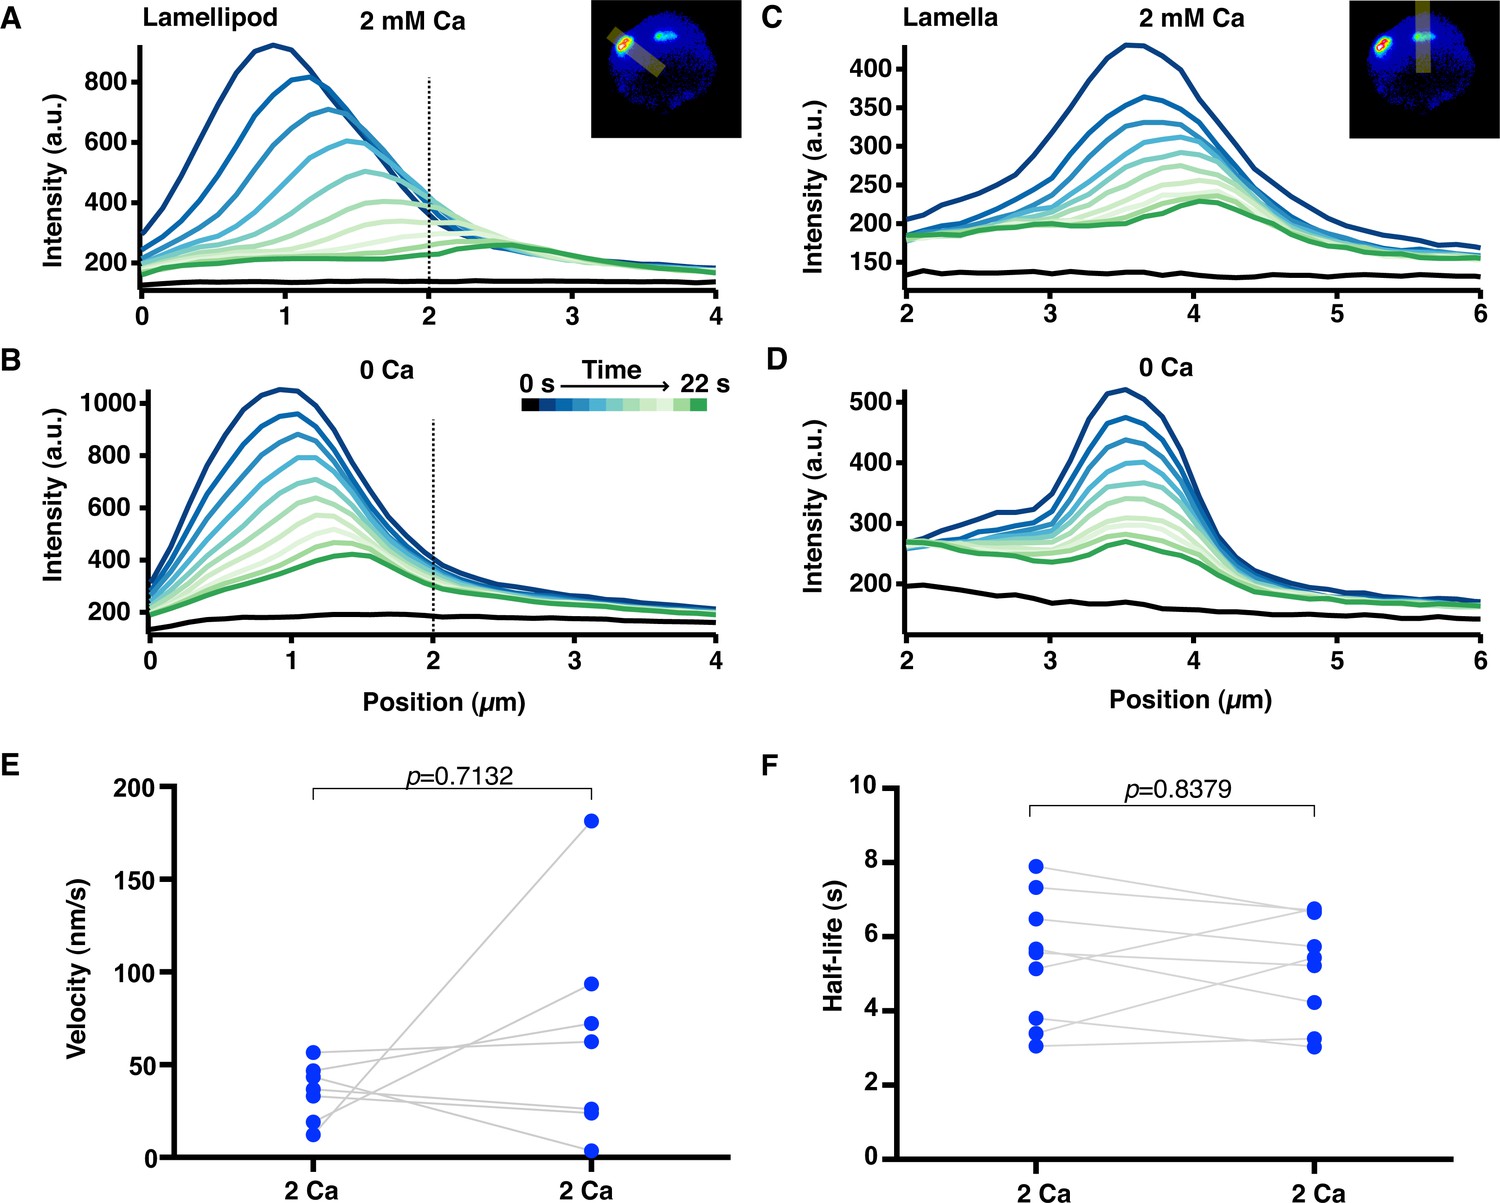
Actin filament velocity and half-life at the synapse.
Jurkat cells were stimulated on anti-CD3 coated coverslips and PAGFP-actin was photoactivated in small regions within the lamellipod and lamella. (A-D) Fluorescence intensity profiles of photoactivated PAGFP-actin in the lamellipod (A, B) and the lamella (C, D) in the presence of 2 mM or 0 Ca2+o as indicated. Each trace is the intensity along a line perpendicular to the direction of actin movement and averaged across its 19-pixel width, displayed every 2 s. Data are from the cell in Figure 6 and Video 10. The 0 position indicates the cell edge, and the dotted line marks the lamellipod/lamella border. Velocity was calculated as in Figure 6 from the peak position versus time. (E) Velocity and (F) actin filament half-life of photoactivated regions were measured in cells before and after perfusion of 2 mM Ca2+o. P-values from paired Student’s two-tailed t-test.
Figure 6—figure supplement 2
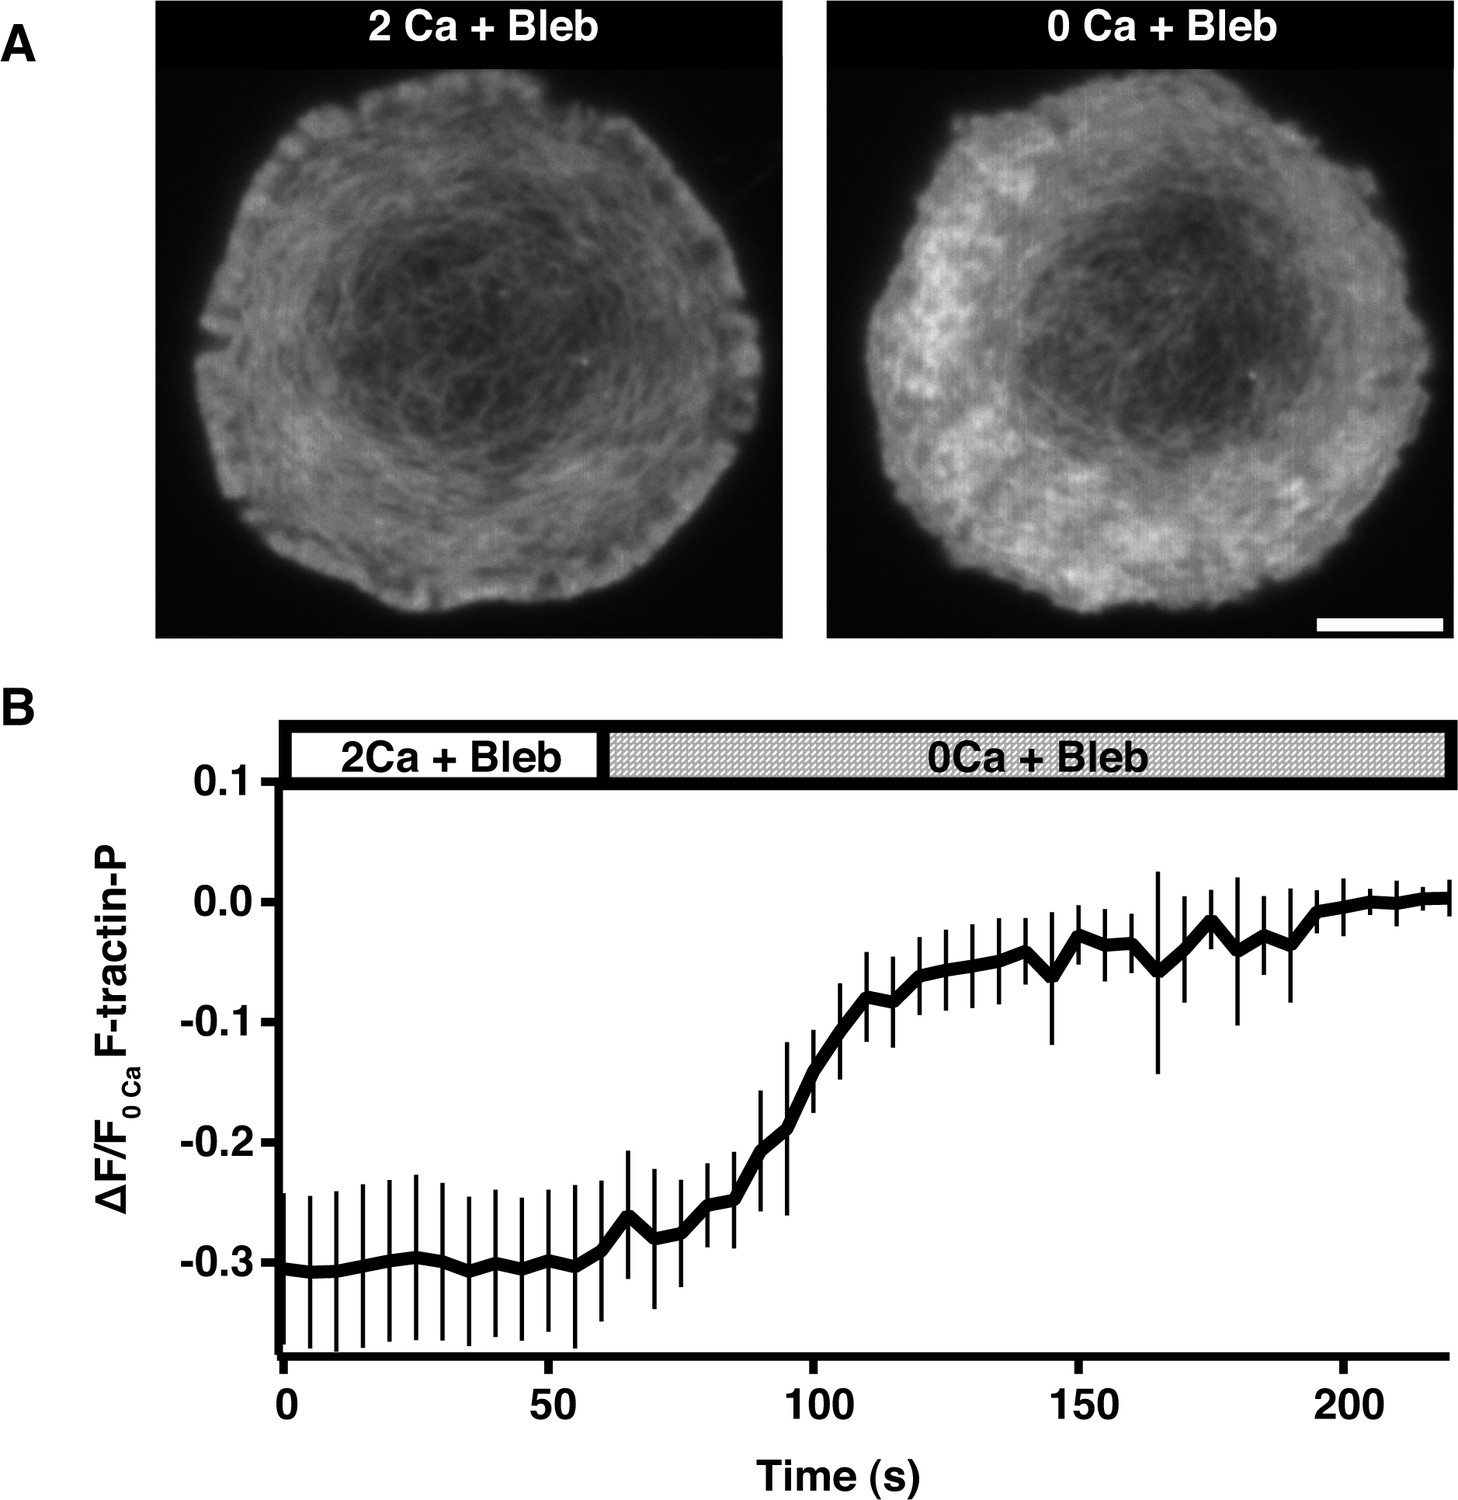
Calcium influx alters actin organization and density independently of myosin activity.
(A) TIRF images of Jurkat cells expressing F-tractin-P-tdTom pretreated for 30 min with 50 µM blebbistatin, then stimulated on anti-CD3 coated coverslips in 2 mM Ca2+o and blebbistatin (left) followed by perfusion with 0 Ca2+o and blebbistatin (right). Scale bar, 5 µm. (B) F-tractin-P-tdTom intensity at the synapse versus time for cells as in A, normalized to the average fluorescence of the last five images (means ± SEM; n = 12 cells).
Figure 7
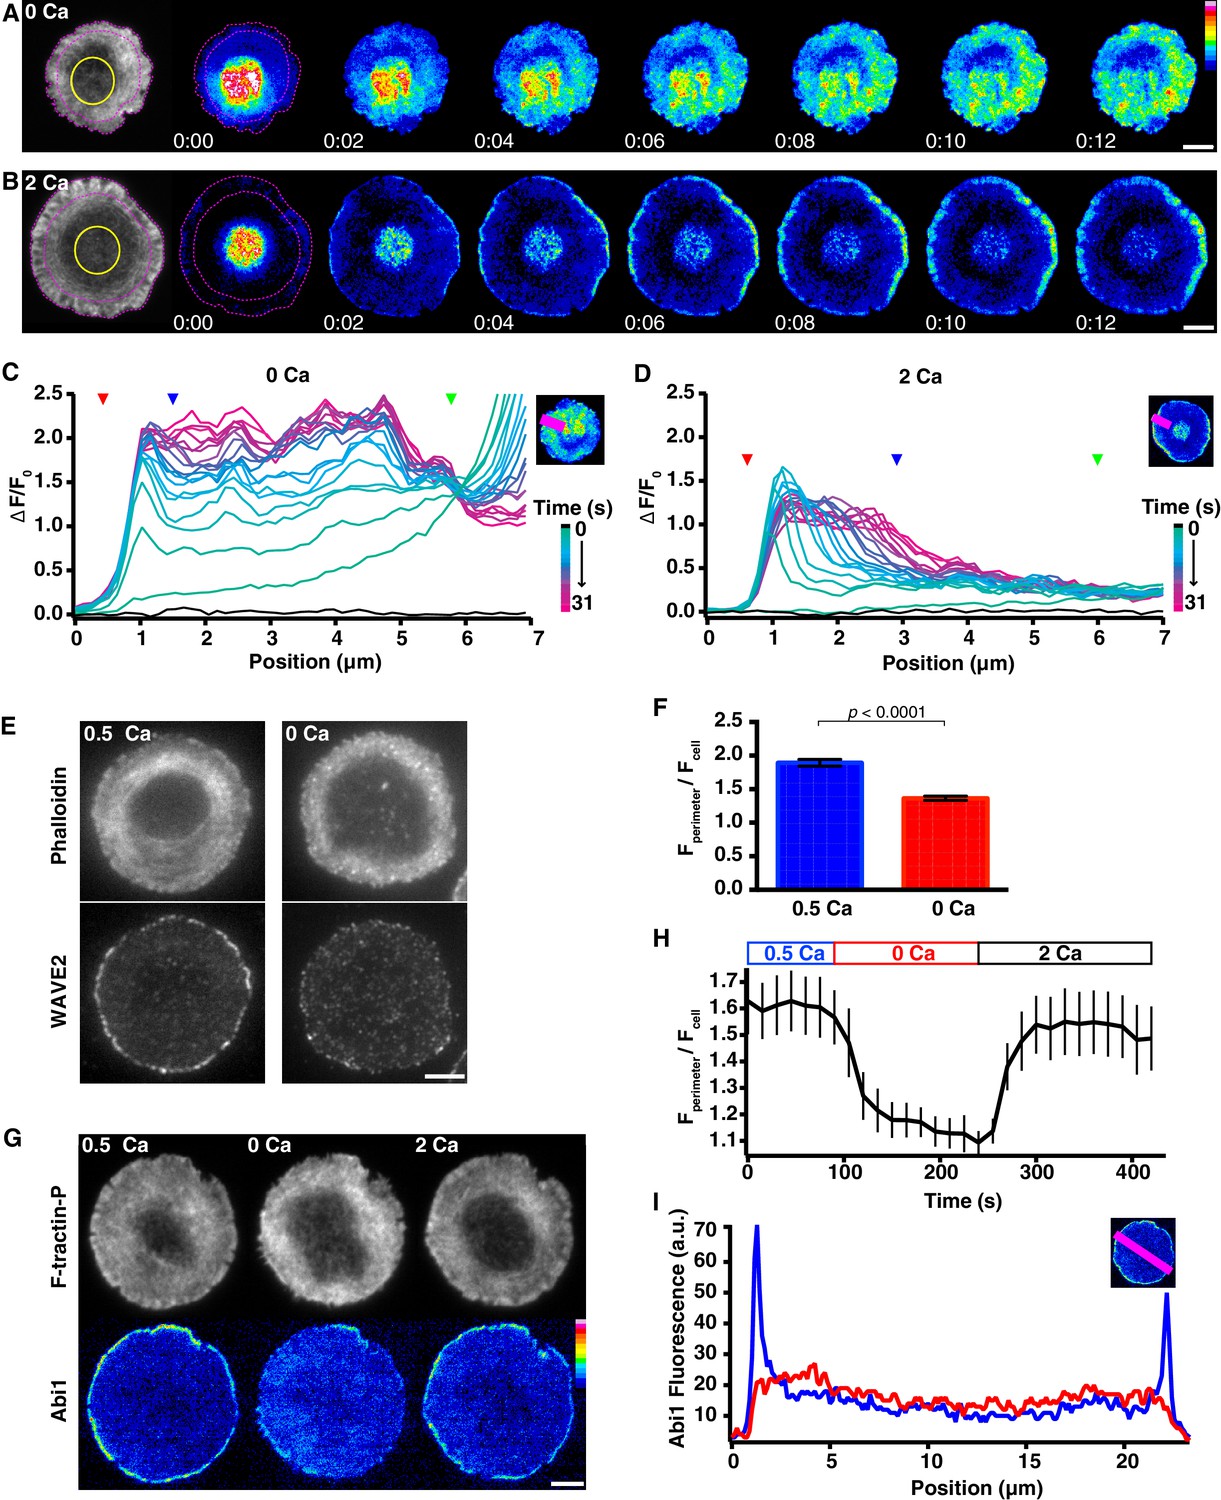
Calcium restricts actin polymerization to the distal edge of the synapse.
(A, B) Two Jurkat T cells expressing F-tractin-P-tdTom and PAGFP-actin were stimulated on anti-CD3 coated coverslips in 0.5 mM Ca2+, and PAGFP-actin was photoactivated in the ADZ regions indicated in the F-tractin-P-tdTom TIRF images (left, yellow circles) 2 min after perfusion of 0 Ca2+o (A) or 2 mM Ca2+o (B). Incorporation of fluorescent PAGFP-actin is shown as a function of time after photoactivation. The lamella/lamellipod border in 2/0.5 mM Ca2+o and cell edge are indicated by pink dashed lines. Images are from Video 11. Time after photoactivation is in min:sec; scale bar, 5 µm; color scale indicates fluorescence intensity (0–1 a.u.). (C, D) Normalized PAGFP-actin fluorescence intensity (see Materials and methods) along the line indicated (top right) as a function of radial position. The fluorescence profile before photoactivation is shown in black; the color scale applies to subsequent profiles acquired every 1.5 s after photoactivation. The cell edge (red arrowhead), the lamellipod/lamella border (blue arrowhead) and the edge of the ADZ (green arrowhead) are indicated. Data are representative of 12–13 cells. (E) Representative TIRF images of Jurkat cells stimulated on anti-CD3 in 0.5 mM Ca2+then transferred to 0.5 Ca2+ (left) or 0 Ca2+ (right) for 2.5 min, labeled with Alexa-594 phalloidin (top) and anti-WAVE2 (bottom) (see Materials and methods). Ca2+ promotes localization of WAVE2 to the edge of the lamellipod. (F) Average anti-WAVE2 fluorescence in a 1-µm band around the perimeter of the synapse (Fperimeter) relative to the average fluorescence across the whole synapse (Fcell) in 0 and 0.5 mM Ca2+ (n = 63 cells each). Error bars indicate SEM; p-values from Student’s two-tailed t-test. (G) TIRF images of a Jurkat cell expressing F-tractin-P-tdTom (top) and EGFP-Abi1 (bottom) stimulated on anti-CD3 in 0.5 mM Ca2+o (left), 1.5 min after Ca2+o removal (center), and 1.5 min after readdition of 2 mM Ca2+o (right). Ca2+ promotes Abi1 localization to the edge of the lamellipod. Images are taken from Video 12. Scale bar, 5 µm; color scale indicates fluorescence intensity (0–1 a.u.). (H) The average fluorescence of EGFP-Abi1 in a 1-µm band around the perimeter of the synapse (Fperimeter) relative to the average fluorescence across the entire synapse (Fcell) versus time (n = 8 cells). (I) The fluorescence intensity (a.u.) of EGFP-Abi1 along the line indicated (top right, pink) in 0.5 mM Ca2+o (blue) and 1.5 min after Ca2+o removal (red).
Figure 8
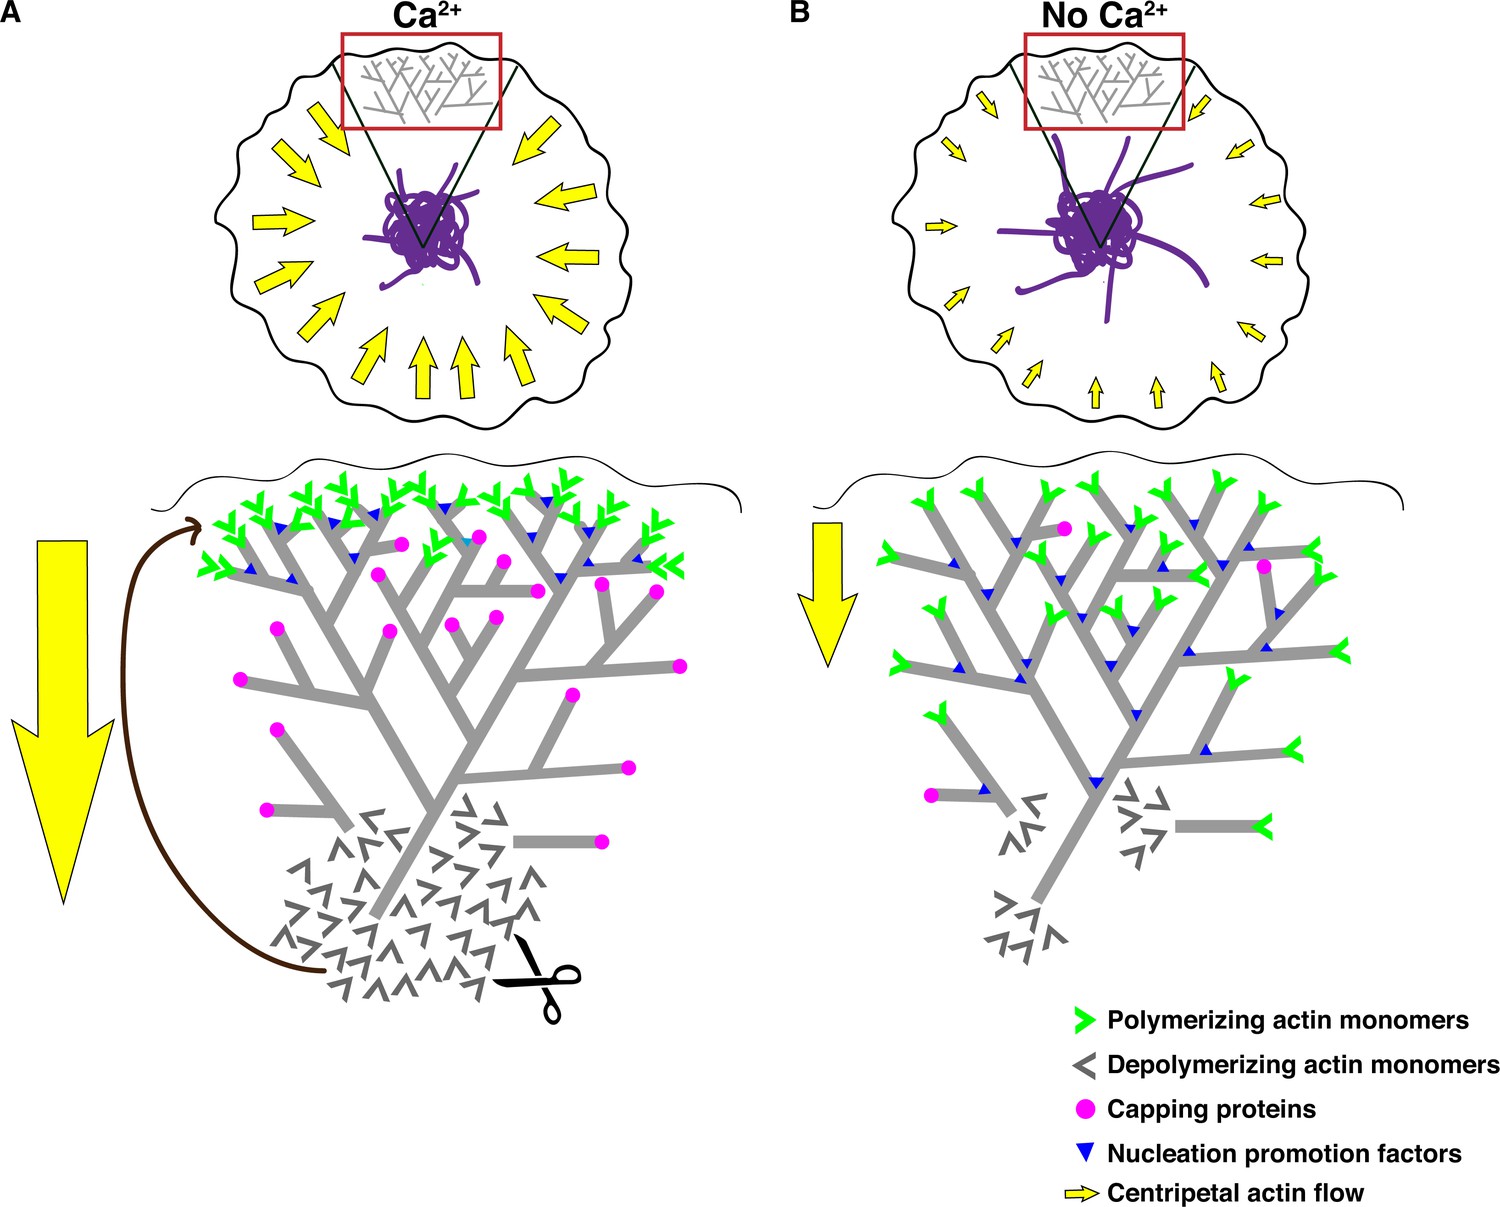
Effects of calcium on actin dynamics and retrograde flow at the synapse.
(A) Retrograde actin flow at the immune synapse (yellow arrows) continually removes extended ER tubules (purple) from the periphery, thereby concentrating the ER in the ADZ. An expanded view of the red-boxed region (top) depicts Ca2+ effects on actin regulation (bottom). Ca2+ drives centripetal actin flow in two ways: (1) by restricting polymerization to the lamellipod edge (green chevrons), it enforces vectorial movement of the actin network; and (2) by increasing the rate of depolymerization, it increases the pool of free actin monomers (grey chevrons), thus enhancing polymerization on free barbed ends at the lamellipod edge (green chevrons). Ca2+ restricts polymerization to the lamellipod edge by localizing WAVE2 and Abi1 to this site where they promote ARP2/3-mediated actin nucleation (blue triangles) and possibly by capping free barbed ends elsewhere (pink circles). (B) Experimentally terminating Ca2+ influx reduces retrograde actin flow such that extended ER tubules are no longer effectively pushed into the ADZ. In the absence of Ca2+o, actin depolymerization is reduced (bottom), nucleation occurs more uniformly throughout the lamellipod/lamella and capping of free barbed ends may be reduced. The overall result is a slowed, non-directional polymerization throughout the lamellipod and lamella resulting in reduced retrograde flow.
Videos
Video 1
STIM1 and Orai1 accumulate in puncta in the center of the synapse.
Time-lapse TIRF movie of a Jurkat cell expressing mCh-STIM1 (left) and Orai1-EGFP (center) stimulated on an anti-CD3-coated coverslip. A merge of the STIM1 (green) and Orai1 (red) channels is shown at right. Images acquired every 5 s and time compressed 35x. Scale bar, 5 µm. This video supplements Figure 1A.
Video 2
STIM1 puncta accumulate in the ADZ of the synapse.
Time-lapse TIRF movie of a Jurkat cell expressing mCh-STIM1 (left) and GFP-actin (center) stimulated on an anti-CD3-coated coverslip. A merge of the STIM1 (green) and actin (red) channels is shown at right. Images acquired every 5 s and time compressed, 35x. Scale bar, 5 µm. This video supplements Figure 1D and E.
Video 3
ER tubules extend from the ADZ into the lamella and are moved centripetally by actin.
Time-lapse TIRF movie of a Jurkat cell expressing GFP-actin (left) and ER-mCh (middle) stimulated on an anti-CD3-coated coverslip. A merge of the actin (red) and ER (green) channels is shown at right. Images acquired every 5 s and time compressed 35x. Scale bar, 5 µm. This video supplements Figure 2.
Video 4
ER tubules extend toward the synapse edge on the tips of microtubules.
Time-lapse TIRF movie of a Jurkat cell expressing ER-mCh (left) and EB1-EGFP (middle) stimulated on an anti-CD3-coated coverslip. A merge of the ER (green) and EB1 (red) channels is shown at right. Images acquired every 5 s and time compressed 35x. Scale bar, 5 µm. This video corresponds to the boxed region in Figure 2—figure supplement 1A.
Video 5
EB1 moves radially in the ADZ but parallel to the cell edge at the lamella/lamellipod border.
Time-lapse TIRF movie of a Jurkat cell expressing F-tractin-P-tdTom (left) and EB1-EGFP (middle) stimulated on an anti-CD3-coated coverslip. A merge of the actin (red) and EB1 (green) channels is shown at right. Images acquired every 1 s and time compressed 7x. Scale bar, 5 µm. This video corresponds to Figure 2—figure supplement 1B.
Video 6
Calcium influx organizes synaptic actin and promotes retrograde flow in Jurkat cells.
Time-lapse TIRF movie of a Jurkat cell expressing F-tractin-P-tdTom after spreading on an anti-CD3 coverslip in 2 mM Ca2+o, followed by perfusion with 0 Ca2+o and 2 mM Ca2+o. Images acquired every 5 s and time compressed 35x; scale bar, 5 µm. This video supplements Figure 3A and B.
Video 7
Calcium influx organizes synaptic actin and promotes retrograde flow in primary human T lymphoblasts plated on anti-CD3 and ICAM-1.
Time-lapse spinning disk confocal movie of a human T lymphoblast expressing Lifeact-GFP after spreading on anti-CD3 and ICAM-1 Fc in 0.5 mM Ca2+o (left), 1.3 min following perfusion with 0 Ca2+o (center) and 2.2 min after perfusion with 2 mM Ca2+o (right). Images are displayed as maximum intensity projections of 3 image planes separated by 0.25 µm that were acquired at 2 s intervals. Time compressed 40x; scale bar, 5 µm. This video supplements Figure 3E and F.
Video 8
Calcium influx organizes synaptic actin and promotes retrograde actin flow in primary human T lymphoblasts plated on anti-CD3 without ICAM-1.
Time-lapse spinning disk confocal movie of a primary human T lymphoblast expressing Lifeact-GFP after spreading on anti-CD3 in 0.5 mM Ca2+o (left), 4.3 min following perfusion with 0 Ca2+o (center) and 2 min following perfusion with 2 mM Ca2+o (right). Images are displayed as maximum intensity projections of sets of 3 image planes separated by 0.25 µm that were acquired at 2 s intervals. Time compressed 40x; scale bar, 5 µm. This video supplements Figure 3.
Video 9
Calcium-dependent retrograde actin flow corrals the ER in the ADZ.
Time-lapse TIRF movie of a Jurkat cell expressing ER-GFP (left) and F-tractin-P-tdTom (center) that had spread in 2 mM Ca2+o before perfusion with 0 Ca2+o. Video begins with the cell in 0 Ca2+o and shows the effect of restoring 2 mM Ca2+o. A merge of the ER (green) and F-tractin-P (red) channels is shown at right. Images acquired every 5 s and time compressed 35x. Scale bar, 5 µm. This video supplements Figure 4A–C.
Video 10
Calcium increases actin depolymerization and centripetal velocity at the synapse.
Time-lapse TIRF movie of a Jurkat cell expressing F-tractin-P-tdTom and PAGFP-actin. Bars of PAGFP-actin are photoactivated in the lamella and lamellipod of the same cell in 2 mM Ca2+o (left) and 0 Ca2+o (right). Intensity is rendered in pseudocolor using the scale in Figure 6A. Images acquired every 2 s and time compressed 6x. Scale bar, 5 µm. The video supplements Figure 6A.
Video 11
Calcium restricts actin polymerization to the distal edge of the synapse.
Time-lapse TIRF movie of a Jurkat cell expressing F-tractin-P-tdTom and PAGFP-actin. Monomeric PAGFP-actin is photoactivated in the ADZ of two different cells in 2 mM Ca2+o (left) and 0 Ca2+o (right). Intensity is rendered in pseudocolor using the scale in Figure 7A. Images acquired every 500 ms and time compressed 3.5x. Scale bar, 5 µm. This video supplements Figure 7A and B.
Video 12
Calcium promotes localization of Abi1 to the distal edge of the synapse.
Time-lapse TIRF movie of a Jurkat cell expressing F-tractin-P-tdTom and EGFP-Abi1 stimulated on anti-CD3 coated coverslip in 0.5 mM Ca2+o, followed by perfusion with 0 Ca2+o and 2 mM Ca2+o. Images acquired every 15 s and time compressed 45x; scale bar, 5 µm. This video supplements Figure 7G, H and I.
Tables
Table 1
Effects of calcium on actin dynamics at the primary T cell immune synapse
| Anti-CD3 | Anti-CD3 + ICAM-1 | |||||
|---|---|---|---|---|---|---|
| 0.5 Ca2+ | 0 Ca2+ | 2 Ca2+ | 0.5 Ca2+ | 0 Ca2+ | 2 Ca2+ | |
| Velocity (nm/s) | 243 ± 8 (9) | 145 ± 6 (9) | 208 ± 8 (9) | 167 ± 4 (11) | 94 ± 3 (11) | 162 ± 5 (11) |
| Lamellipod width (µm) | 3.0 ± 0.2 (9) | 1.5 ± 0.1 (9) | 2.3 ± 0.2 (9) | 2.8 ± 0.1 (10) | 1.1 ± 0.1 (10) | 2.3 ± 0.2 (8) |
-
[Ca2+]o indicated in mM in the order in which the solutions were applied (see text). Means ± SEM; number of cells indicated in parentheses. Velocities are from a total of 104-133 measurements from kymographs made at 3 different locations per cell
Table 2
Effects of calcium on actin dynamics at the Jurkat cell immune synapse
| Lamellipod | Lamella | |||
|---|---|---|---|---|
| 2 Ca2+ | 0 Ca2+ | 2 Ca2+ | 0 Ca2+ | |
| Half-life (s) | 6.5 ± 0.4 (10) | 8.0 ± 0.4 (10) | 6.4 ± 0.4 (19) | 7.5 ± 0.5 (19) |
| Velocity (nm/s) | 58 ± 6 (10) | 34 ± 5 (10) | 36 ± 6 (18) | 13 ± 3 (18) |
-
[Ca2+]o indicated in mM. Means ± SEM; number of cells indicated in parentheses.
Download links
A two-part list of links to download the article, or parts of the article, in various formats.
Downloads (link to download the article as PDF)
Open citations (links to open the citations from this article in various online reference manager services)
Cite this article (links to download the citations from this article in formats compatible with various reference manager tools)
Calcium influx through CRAC channels controls actin organization and dynamics at the immune synapse
eLife 5:e14850.
https://doi.org/10.7554/eLife.14850


