Behavioral-state modulation of inhibition is context-dependent and cell type specific in mouse visual cortex
- University of Edinburgh, United Kingdom
- University of Freiburg, Germany
Figures
Figure 1
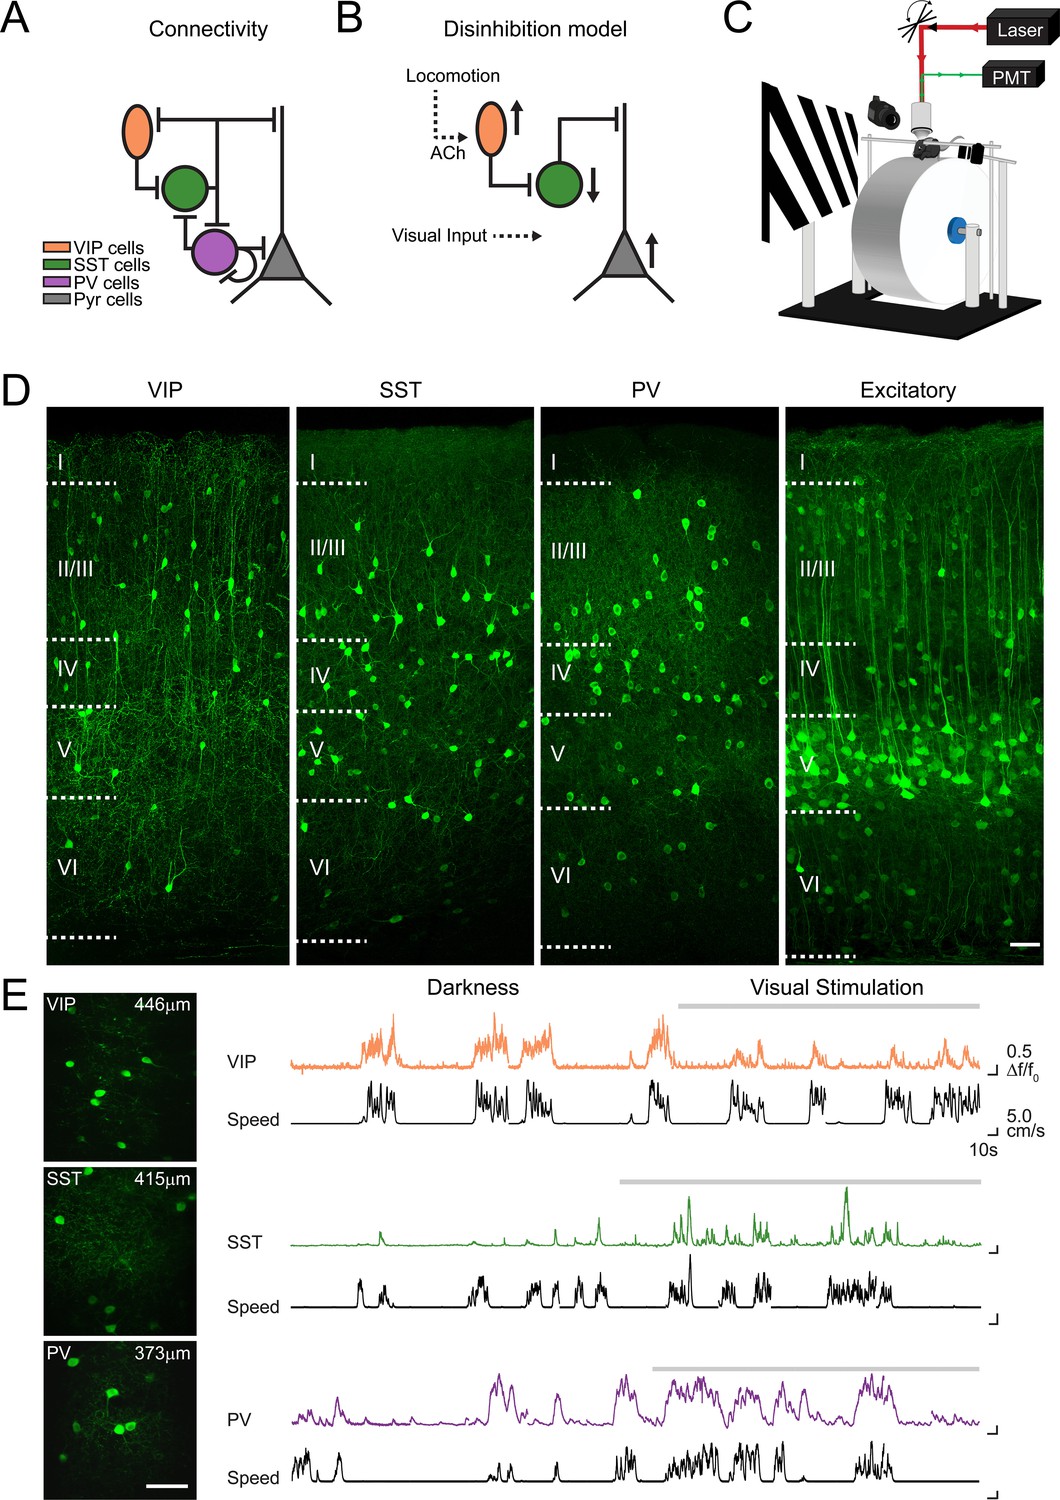
Imaging locomotion responses of excitatory and inhibitory neurons in mouse V1.
(A) Schematic of the connectivity between pyramidal neurons (Pyr) and subtypes of inhibitory neurons, vasoactive intestinal peptide (VIP), somatostatin (SST) and parvalbumin (PV) expressing neurons, established from in vitro studies in V1 (Pfeffer et al., 2013; Jiang et al., 2015). (B) Proposed disinhibition model: locomotion activates VIP neurons through cholinergic (ACh) inputs, SST neurons are inhibited, which leads to a disinhibition of Pyr neurons and an increase in the gain of visual responses during locomotion (Fu et al., 2014). (C) Experimental set-up for two-photon calcium imaging in V1 of awake-behaving mice. Mice are head-fixed and can run freely on a cylindrical treadmill either during the presentation of a visual stimulus (oriented gratings) or in darkness. (D) Confocal images of 50 µm thick coronal sections showing cell type specific GCaMP6f expression in VIP, SST and PV-positive inhibitory neurons as well as in CaMKII-positive excitatory populations. Boundaries between cortical layers are indicated. (E) Left panel, in vivo two-photon images of VIP, SST and PV neurons labelled with GCaMP6f; cortical depth of imaging is indicated. Right panel, example calcium transients (ΔF/F0, coloed traces) of single VIP, SST and PV neurons, imaged in darkness and during visual stimulation with oriented gratings (grey bar above trace), and aligned with the corresponding running speed (cm/s, black traces). Scale bars on images, 50 µm.
Figure 2 with 3 supplements
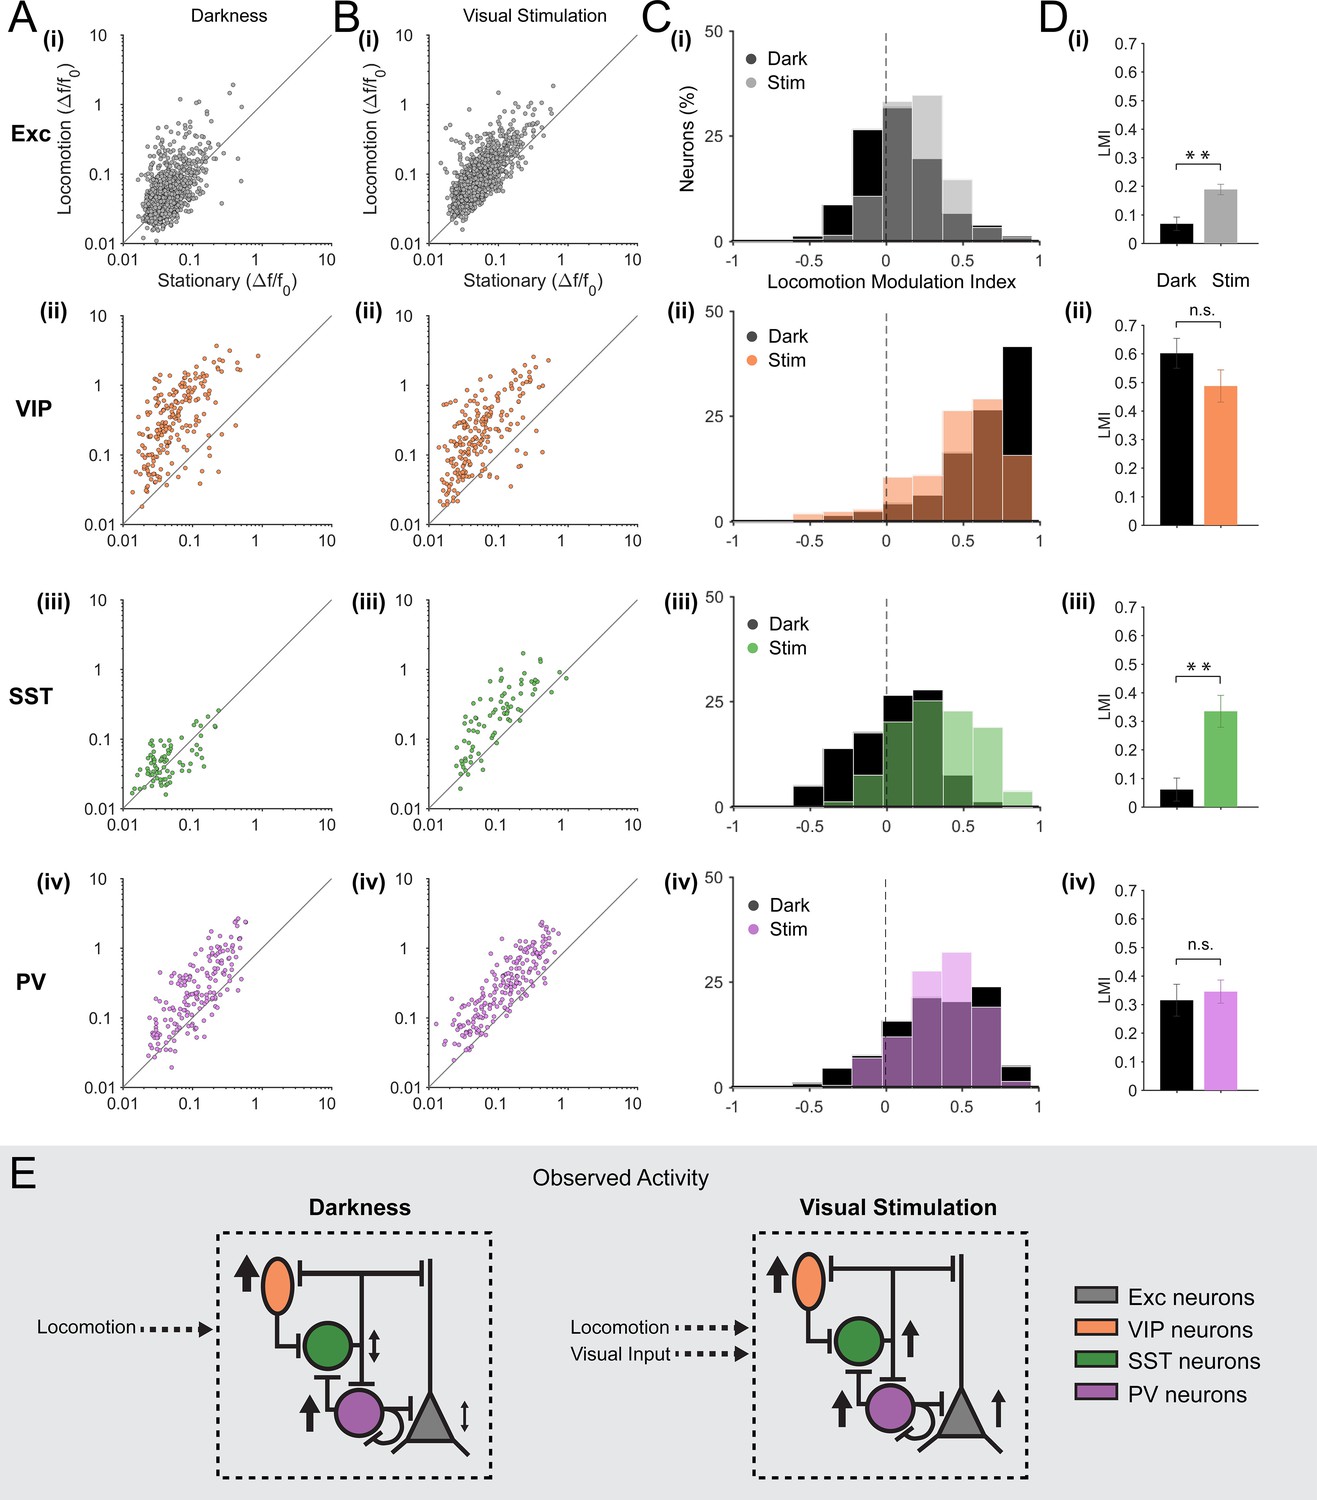
Locomotion differentially modulates excitatory and inhibitory neuronal responses in darkness and during visual stimulation in V1 layer 2/3.
(A–B) Scatter plots of the mean amplitude of fluorescence changes (ΔF/F0) of each neuron for locomotion periods versus stationary periods, in darkness (A) and during visual stimulation (oriented gratings) (B); (i) excitatory cells (Exc), n = 1124; (ii) VIP, n = 210; (iii) SST, n = 79; (iv) PV, n = 199 neurons. (C) Histograms of the distribution of locomotion modulation indices (LMI = (RL – RS)/(RL + RS), where RL and RS are the mean ∆F/F0 during locomotion and stationary periods, respectively), for each cell type, in darkness (Dark, black) and during visual stimulation (Stim, coloed). An LMI equal to 0 indicates no difference between locomotion and stationary periods, while an LMI equal to 0.5 indicates that the average amplitude of calcium transients was three times higher during locomotion than during stationary periods. (D) Mean of the median LMI per animal and s.e.m. **p<0.01, n.s., not significant (p>0.05); n = 12 (i), 12 (ii), 11 (iii), 13 (iv) mice; Kruskal–Wallis test. (E) Schematic representation of the results. Size and direction of the arrows indicate the average response per cell type during locomotion (increasing or decreasing activity). In darkness, SST and excitatory neurons were largely non-responsive to locomotion while VIP and PV neurons were strongly activated by locomotion. However, during visual stimulation, locomotion increases the responses of excitatory neurons as well as of the three classes of inhibitory neurons (VIP, SST and PV).
Figure 2—figure supplement 1
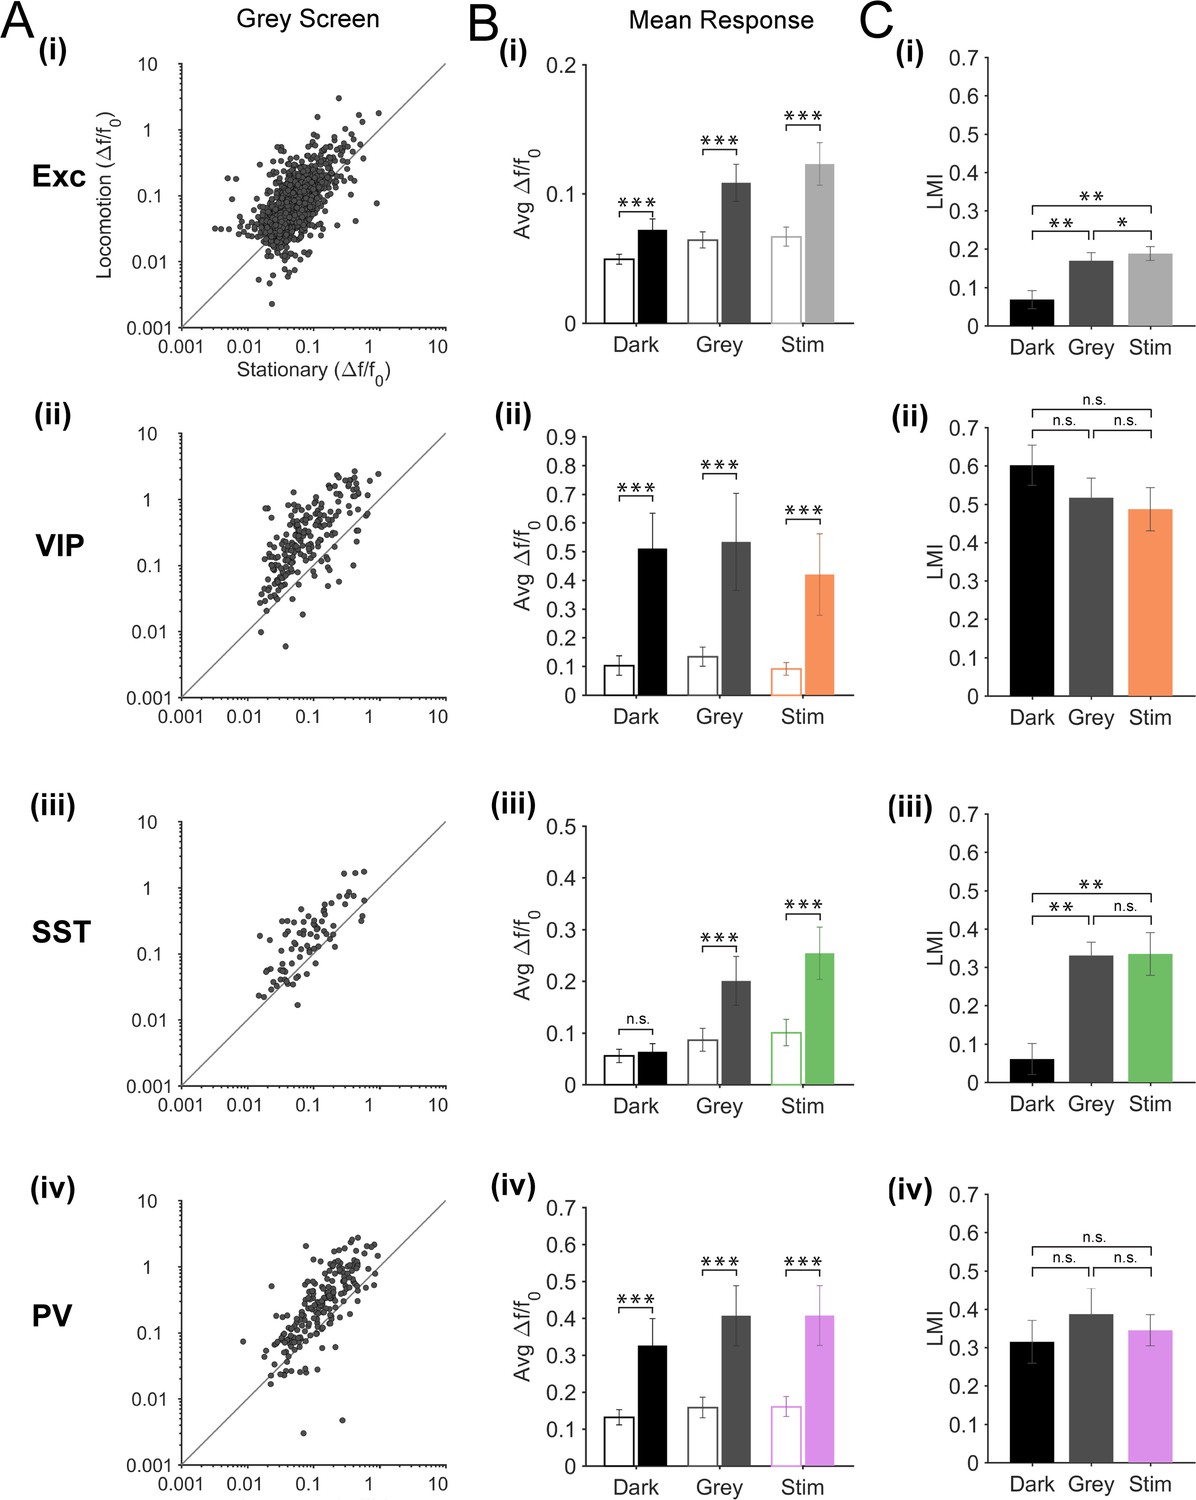
Modulation of excitatory and inhibitory neurons responses by locomotion during the presentation of patterned (oriented gratings) and non-patterned (grey screen) visual stimuli.
(A) Scatter plots of the mean amplitude of fluorescence changes (mean ΔF/F0) of each neuron for locomotion periods versus stationary periods, during grey screen presentation; (i) excitatory cells (Exc), n = 1124; (ii) VIP, n = 210; (iii) SST, n = 79; (iv) PV, n = 199 neurons. (B) Mean ΔF/F0 per animal and s.e.m. for stationary (open bars) and locomotion (solid bars) periods in darkness (Dark), during a grey screen presentation, and during the presentation of oriented gratings (Stim); statistics based on the Wilcoxon signed rank test. (C) Mean of the median LMI per animal and s.e.m.; statistics based on the Kruskal–Wallis test. For (B–C), n = 12 (i), 12 (ii), 11 (iii), 13 (iv) mice; *p<0.05, **p<0.01 and ***p<0.001, n.s., not significant (p>0.05).
Figure 2—figure supplement 2
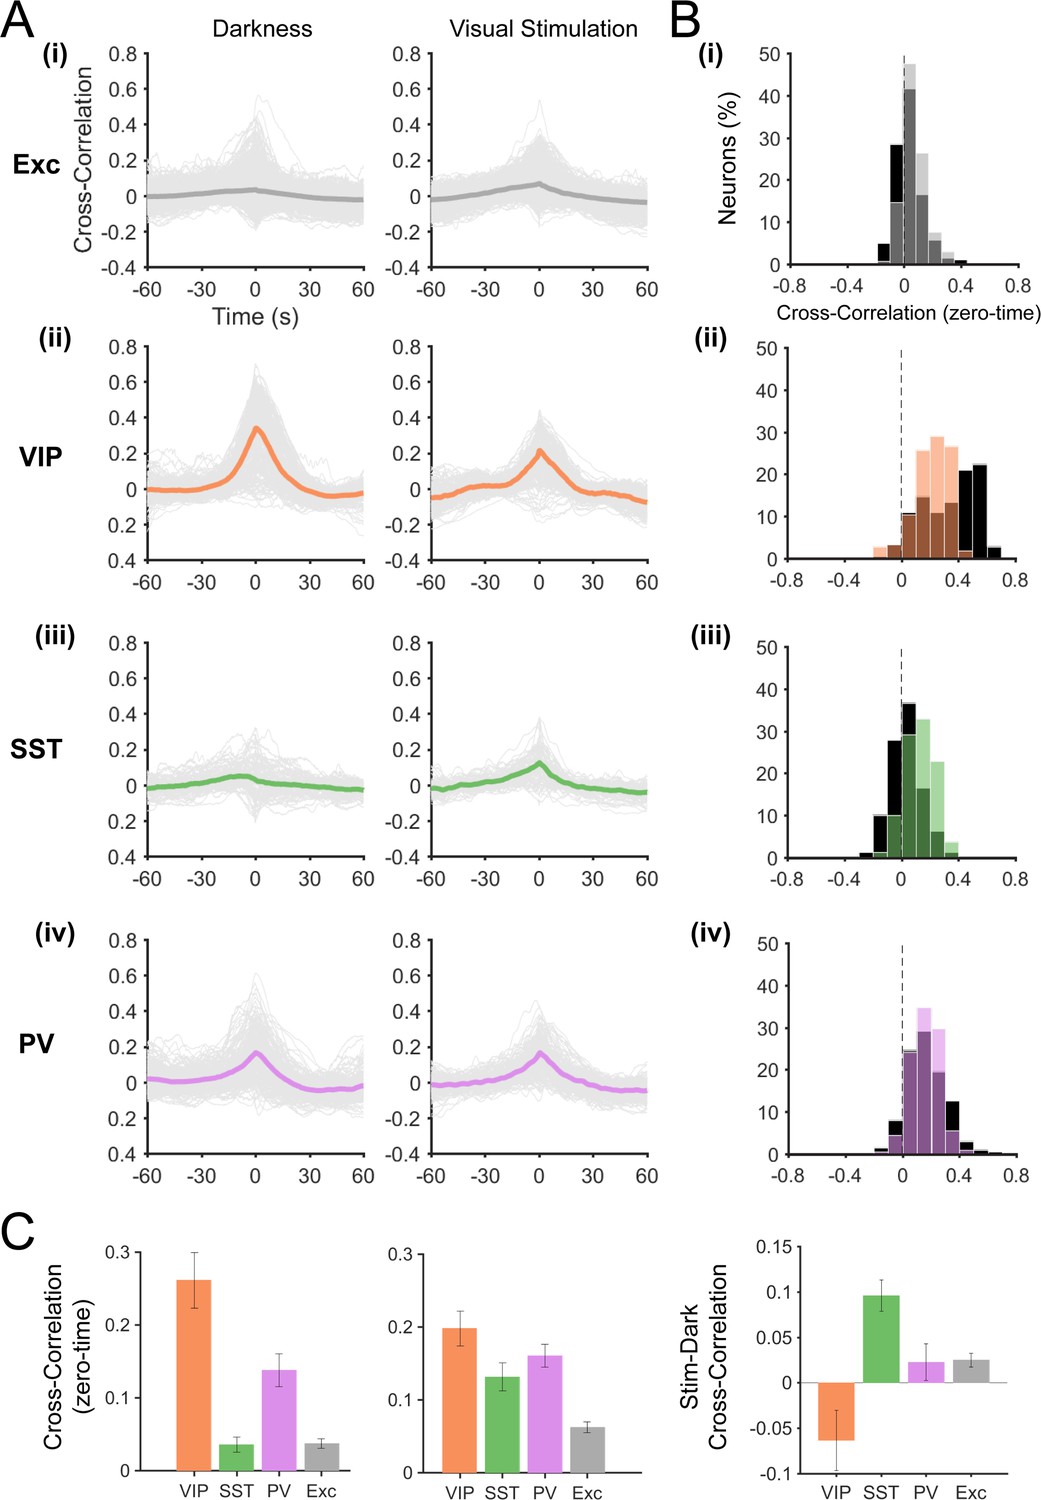
Cross correlation of fluorescence changes (ΔF/F0) with running speed.
(A) Cross-correlation between ΔF/F0 and running speed during darkness (left) and visual stimulation (right) for each neuronal subtype. Thin grey lines represent individual neurons and thick lines represent the mean cross-correlation across all neurons within a subtype. (B) Histograms of the zero-time correlation values per neuron in darkness (dark bars) and during visual stimulation (coloed bars). (C) Mean zero-time correlation and s.e.m. for each neuronal subtype across animals, in darkness (left) and during visual stimulation (middle). Right panel shows the difference between darkness and visual stimulation conditions (mean zero-time values, Stim-Dark). Note that SST neurons show significantly higher zero-time correlation values during visual stimulation (p=0.001), as do excitatory neurons (p=0.024). In contrast, VIP neurons have lower zero-time correlation values during visual stimulation, however this difference is not significant across animals (p=0.225). PV neurons show no significant change between darkness and visual stimulation conditions (p=0.778).
Figure 2—figure supplement 3
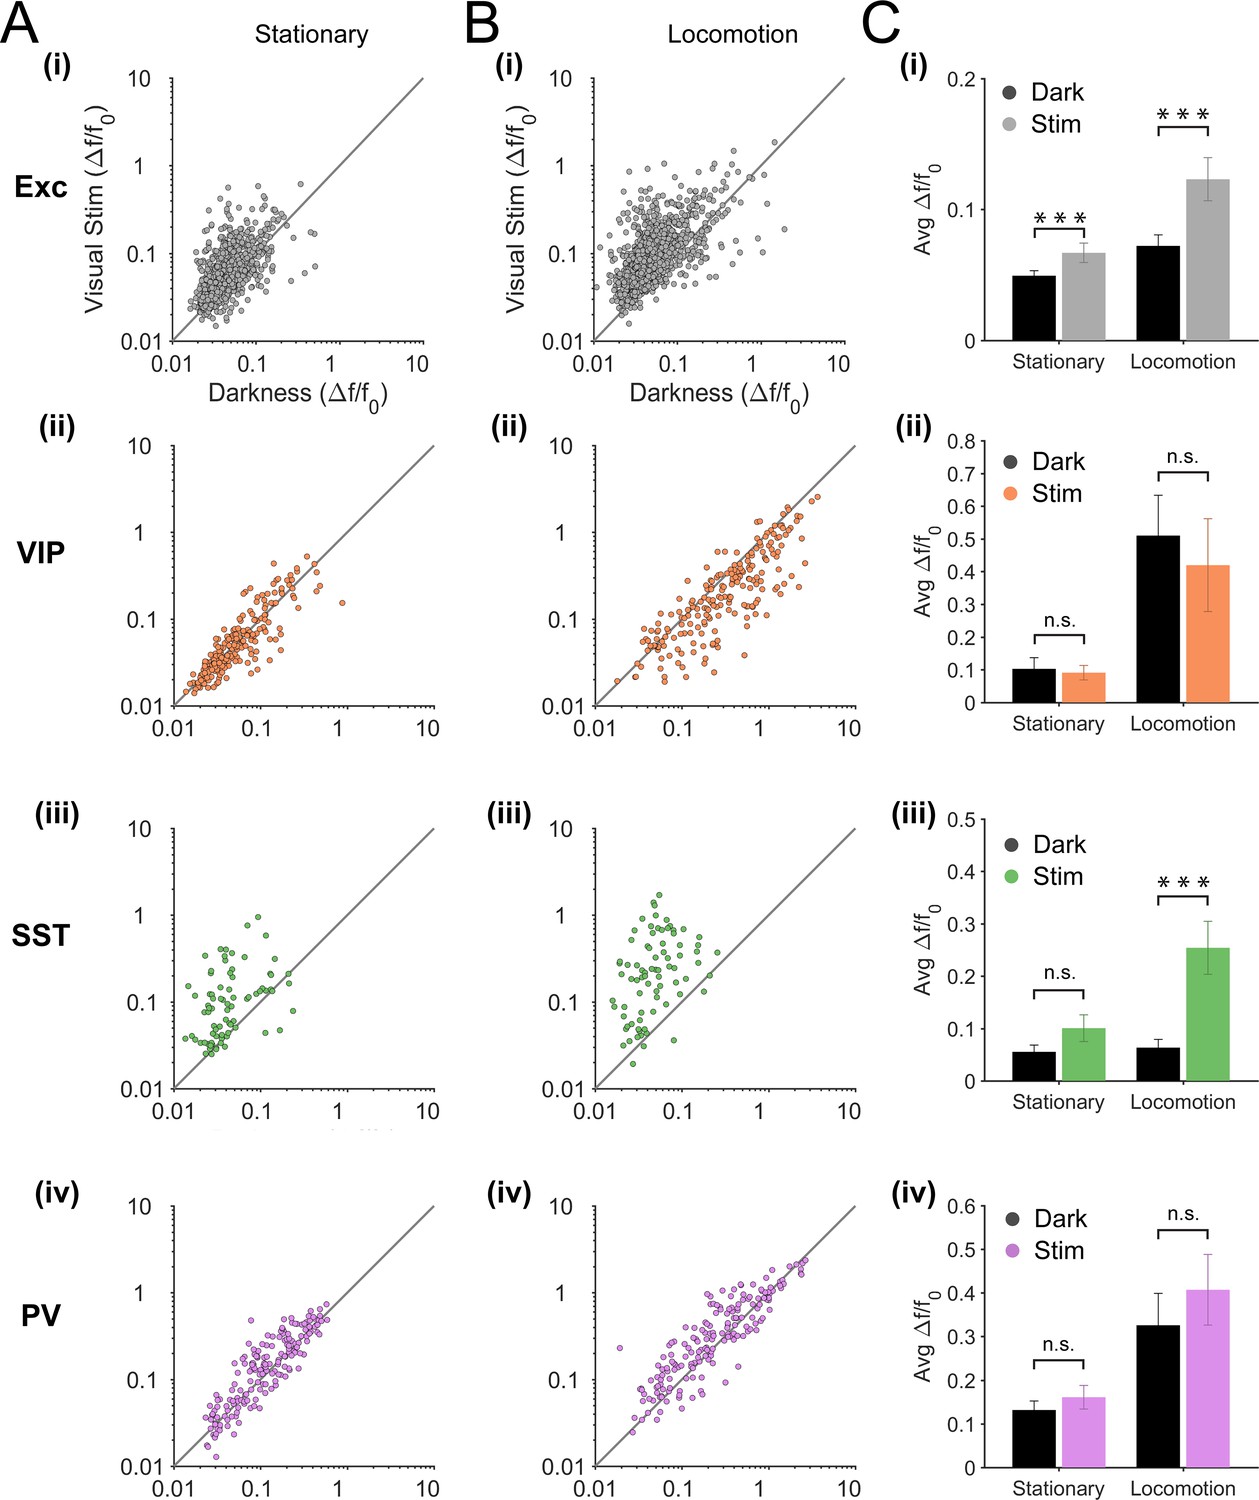
Visual responsiveness of excitatory and inhibitory neurons during stationary and locomotion periods.
(A–B) Scatter plots of the mean amplitude of fluorescence changes (ΔF/F0) of each neuron during visual stimulation (oriented gratings) versus darkness, during stationary (A) and locomotion (B) periods. (C) Mean ΔF/F0 per animal and s.e.m. in darkness (Dark, black bars) versus during the presentation of visual stimulation (oriented gratings; Stim, coloed bars) during stationary and locomotion periods; statistics based on Wilcoxon signed rank test; n = 12 (i), 12 (ii), 11 (iii), 13 (iv) mice; *p<0.05, **p<0.01 and ***p<0.001, n.s., not significant (p>0.05).
Figure 3 with 2 supplements
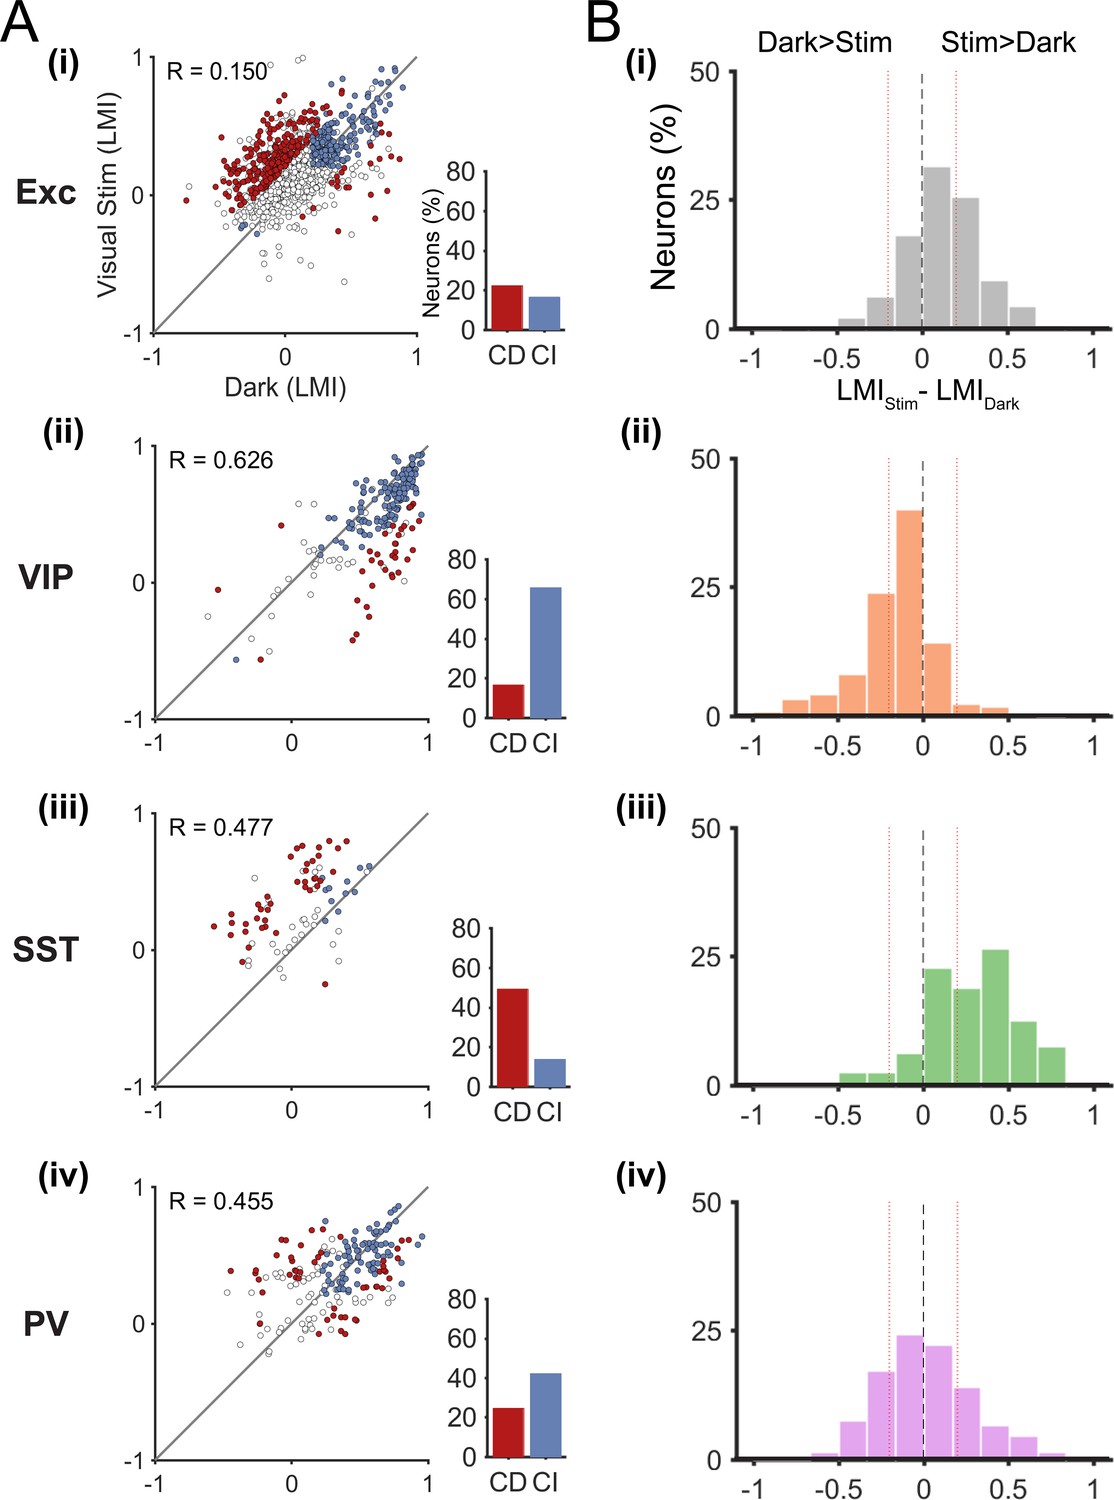
Context-dependent responses to locomotion of individual excitatory and inhibitory neurons in layer 2/3.
(A) Left panels, scatter plots of the locomotion modulation index (LMI) of individual neurons in darkness versus during visual stimulation (gratings) with an associated Pearson correlation coefficient (R-values). Context-dependent (CD; red) and context-independent (CI; blue) locomotion responsive neurons are highlighted. Context dependency was defined for each neuron by its distance from the identity line and the variability of its locomotion responses (see Materials and methods and Figure 3—figure supplement 1). Neurons that were either non-responsive to locomotion or responded unreliably are shown as open circles. Right panels, percentages of context-dependent (CD) and context-independent (CI) neurons for each neuronal subtype. Note the high proportion of CI VIP neurons (66%), the high proportion of CD SST neurons (49%), and the diversity of both PV and excitatory (Exc) neurons. (B) Histograms of the difference between the LMI value in darkness and during visual stimulation (LMIStim-LMIDark) for each neuronal population. Negative values indicate increased responses to locomotion in darkness compared with visual stimulation, positive numbers indicate increased responses to locomotion during visual stimulation, and numbers close to 0 (within red lines; –0.2 < LMIStim-LMIDark < 0.2) indicate context-independent responses.
Figure 3—figure supplement 1
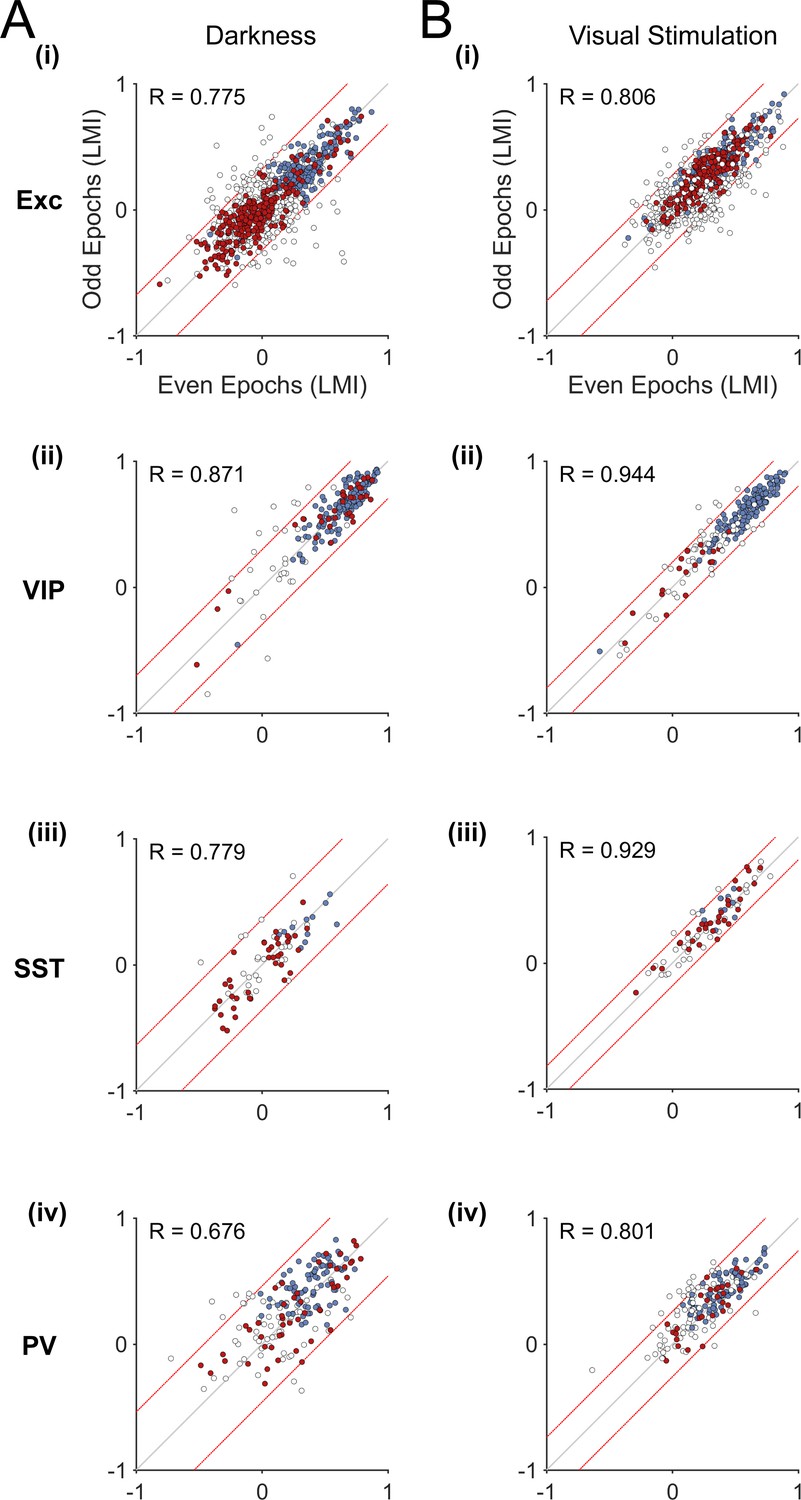
Variability of locomotion responses in darkness and during visual stimulation.
(A–B) Scatter plots of LMI values calculated for each neuron from their responses during even and odd locomotion and stationary periods, in darkness (A) and during visual stimulation (oriented gratings) (B). Individual periods of locomotion separated by stationary periods (epochs) were divided into odd and even epochs and mean LMIs were calculated for each context (darkness and visual stimulation). Pearson correlation coefficient R-values are shown for each scatter plot. Note the high correlation values for all neuronal populations both in darkness and during visual stimulation (p<0.001). Red lines delineate 5% of the neurons with the highest variability, as measured by the difference in LMI during odd and even epochs. Context-dependent (red) and context-independent (blue) locomotion responsive neurons identified in Figure 3A are highlighted.
Figure 3—figure supplement 2
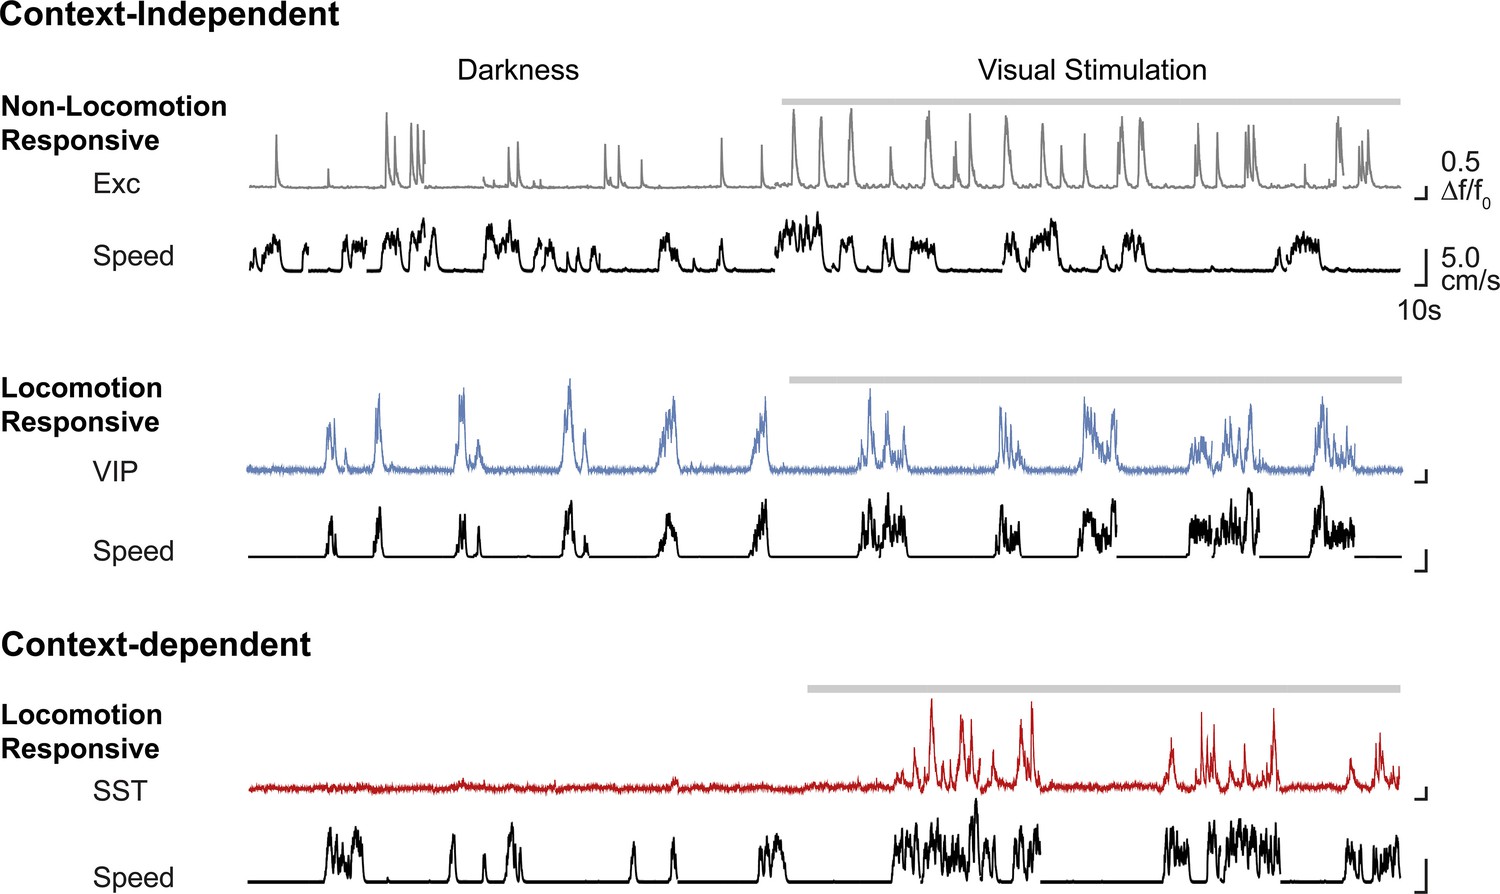
Representative examples of calcium transients (ΔF/F0) of context-independent and context-dependent neurons, in darkness and during visual stimulation with oriented gratings (grey bar above trace).
The corresponding running speed is shown below each trace (cm/s, black). Exc, excitatory neuron.
Figure 4
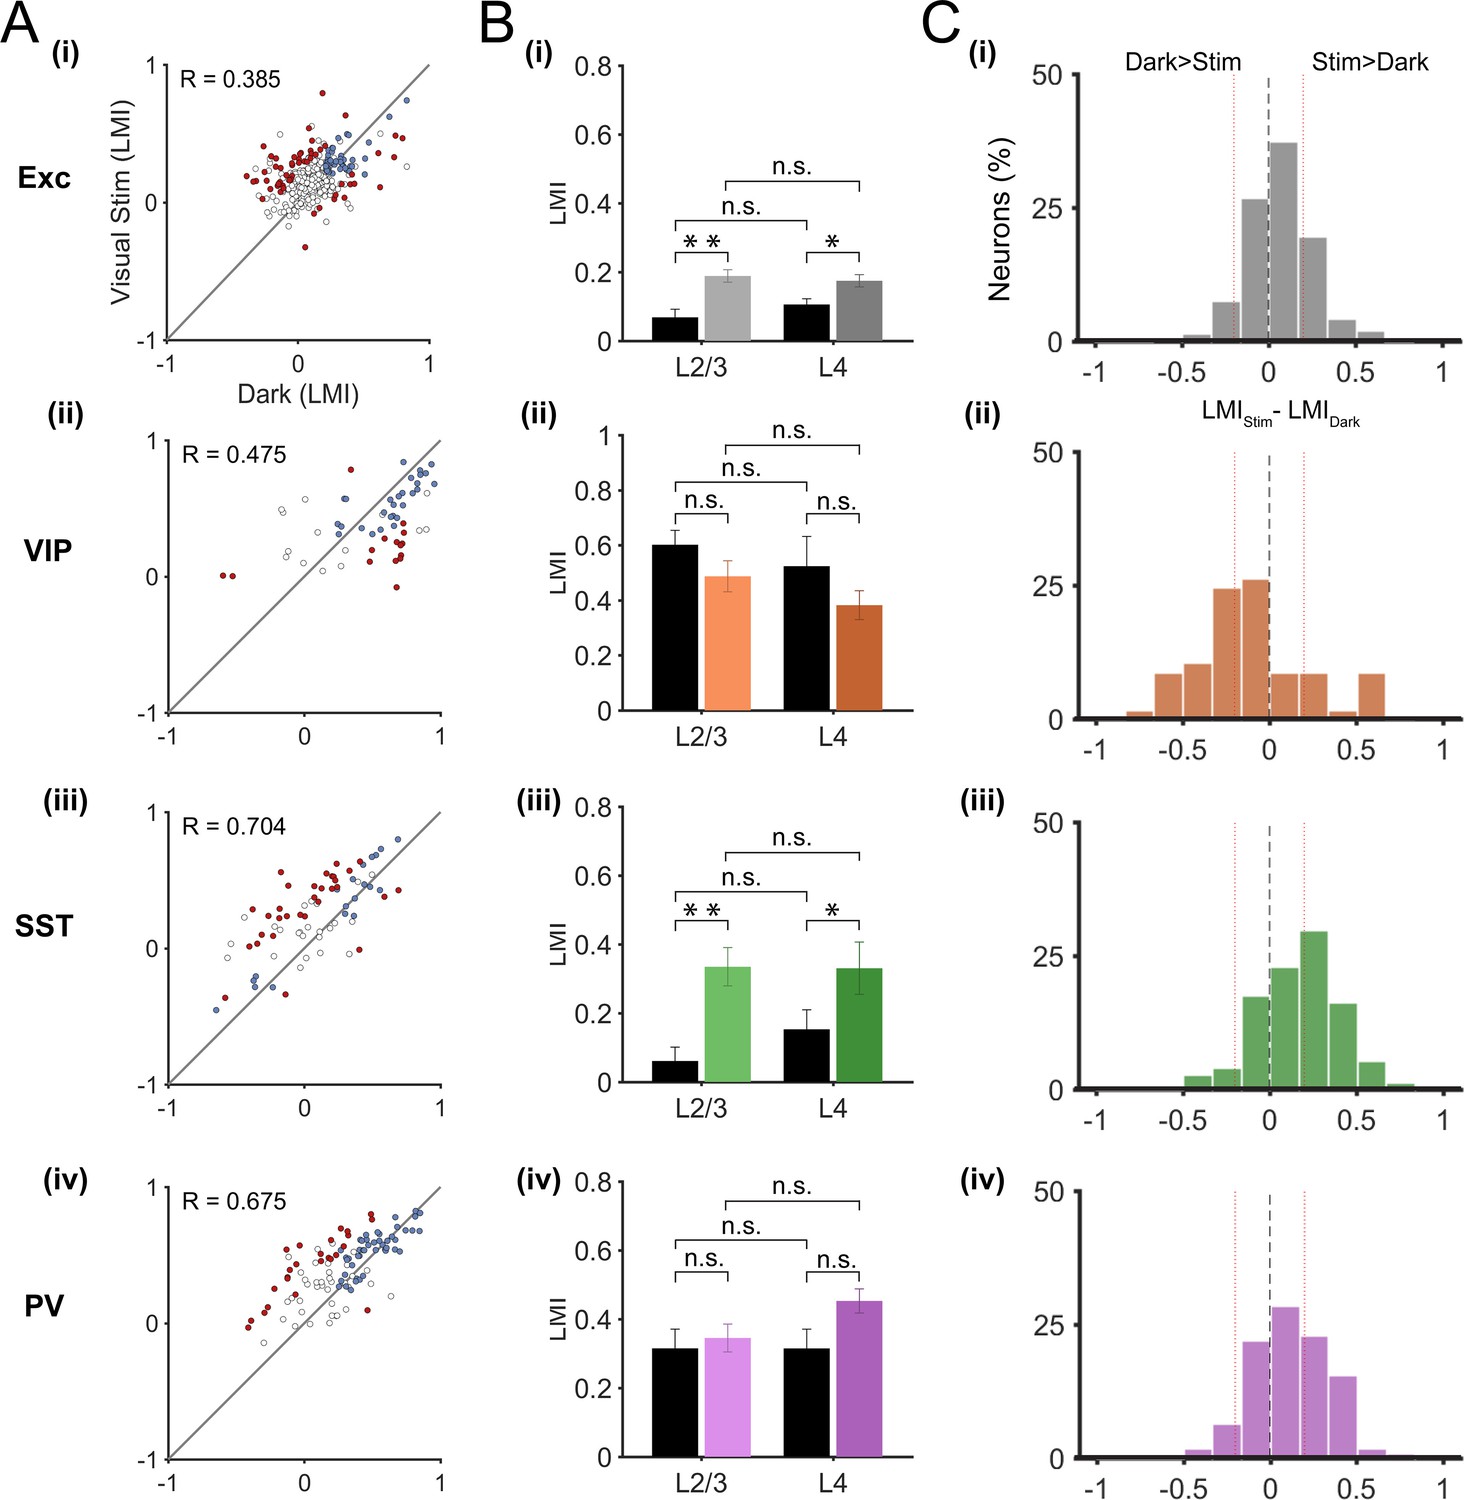
Locomotion responses of individual inhibitory and excitatory neurons in V1 cortical layer 4.
(A) Scatter plots of locomotion modulation index (LMI) of individual neurons in darkness versus during visual stimulation (oriented gratings), with associated Pearson correlation coefficient (R-values) for excitatory (Exc; n = 331), VIP (n = 57), SST (n = 74), and PV (n = 109) neurons. Context-dependent (red) and context-independent (blue) locomotion responsive neurons are highlighted. Context dependency per neuron was defined by its distance from the identity line and its variability to locomotion periods (see Materials and methods). Neurons that were either non-responsive to locomotion or responded unreliably are shown as open circles. (B) Mean of the median LMI per animal and s.e.m. for layer 2/3 (L2/3) as well as layer 4 (L4), in darkness (Dark, black bars) and during visual stimulation (Stim, coloed bars) for Exc (L2/3, n = 12; L4, n = 6), VIP (L2/3, n = 12; L4, n = 4), SST (L2/3, n = 11; L4, n = 6), and PV (L2/3, n =13; L4, n =6) mice. Within each cell type, there was no significant difference (n.s., p>0.05, Mann-Whitney U test) between the median LMI across layers in either context (darkness: Exc, p=0.151; VIP, p=0.521; SST, p=0.350; PV, p=0.966; visual stimulation: Exc, p=0.750; VIP, p=0.133; SST, p=0.961; PV, p=0.058; (C) Histograms of the difference between the LMI value in darkness and during visual stimulation (LMIStim-LMIDark) for each cell type. Negative values indicate increased responses to locomotion in the dark compared with visual stimulation, positive numbers indicate increased responses to locomotion during visual stimulation, and numbers close to 0 (within red lines; –0.2 < LMIStim-LMIDark < 0.2) indicate context-independent responses.
Download links
A two-part list of links to download the article, or parts of the article, in various formats.
Downloads (link to download the article as PDF)
Open citations (links to open the citations from this article in various online reference manager services)
Cite this article (links to download the citations from this article in formats compatible with various reference manager tools)
Behavioral-state modulation of inhibition is context-dependent and cell type specific in mouse visual cortex
eLife 5:e14985.
https://doi.org/10.7554/eLife.14985


