Reconstruction of genetically identified neurons imaged by serial-section electron microscopy
- Harvard University, United States
- University of Notre Dame, United States
- California Institute of Technology, United States
Figures
Figure 1 with 5 supplements

Enhanced staining of genetically encoded tags for EM.
(a–b) Bright-field images of HEK-cells rendered photon-dense by DAB polymerization, catalyzed either by APEX2 tagged with a nuclear export signal (APEX2NES) (a) or endoplasmic reticulum tagged HRP (erHRP) (b). (c–d) Bright-field images of direction-selective retinal ganglion cells (ooDSGC) expressing APEX2NES (c) or erHRP (d) and rendered photon-dense as in (a). (e) Enhanced staining strategy. (f–g) EM-micrographs of HEK-cells rendered electron-dense after DAB-polymerization as in (a). A standard EM staining protocol showed no detectable cytosolic DAB-polymer staining (f), whereas the addition of a reduction step dramatically enhanced DAB-polymer staining (g). (h) Ribbon synapses in the outer plexiform layer; ultrastructure is well preserved after reduction. (i) EM-micrograph of an ooDSGC soma (arrowhead) rendered electron dense after tissue reduction next to a non-expressing RGC (asterisk). (j) Close-up of cytosolic APEX2 staining. (k) Dendritic processes expressing APEX2 (asterisk) contacted by a presynaptic partner (arrowhead) in the inner plexiform layer. (l) Axonal long-range projections of an APEX2-expressing ooDSGC in the superior colliculus (asterisk) with a postsynaptic target (arrowhead). (m) erHRP-expressing (arrowhead) RGC next to a non-expressing RGC (asterisk). (n,o) Close-up of erHRP staining of a J-RGC soma (n) and dendrite (o) (arrowhead point to presynaptic partners). (c,d,i-l) are from Cart-cre mice; (m–o) from Jam-B-creER mice. Scale bars: (a–d) :25 μm; (f–g): 10 μm; I, m : 5 μm; h, j−l, n,o : 500 nm;
Figure 1—figure supplement 1
DAB-polymer enhancement.
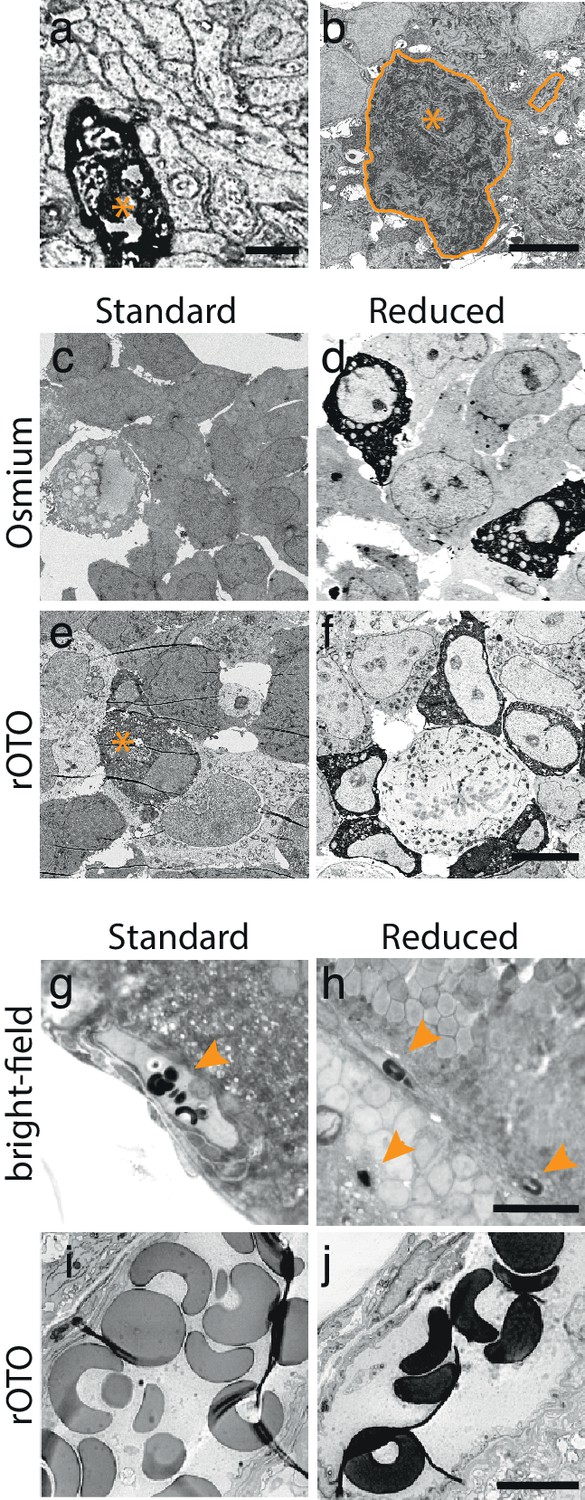
(a) EM-micrograph of an APEX2NES expressing process. Long DAB reaction times (5 hr) allowed visualizing the DAB-polymer using a standard EM-staining protocol, but severely deteriorated the quality of the ultrastructure. (b) EM-micrograph of an RGC using a fixation and staining protocol optimized to preserve good ultrastructure. Under these conditions, DAB-polymer signals were absent or very weak, as exemplified by the weakly stained soma (encircled with asterisk) and its corresponding unstained process (encircled). (c–f) EM-micrograph of APEX2NES expressing HEK-cells fixed with the same protocol used for retinas and stained for EM after the DAB reaction. Four conditions were tested: the osmium only (c,d) or rOTO stainings (e,f) with the standard and reduction protocol (see Materials and methods). Using the standard protocol, no or very weak signal was detected using the osmium (c) or the rOTO (e) staining, respectively. Asterisks in (e) depict weakly stained HEK-cell. In contrast, reducing the tissue dramatically enhanced the signal in both conditions (d–f). (g–h) Bright-field images of erythrocytes in retinal tissue after DAB-polymerization (arrowheads) before (g) and after the reduction step (h). The heme content in erythrocytes catalyzes the DAB reaction producing a strong precipitate that is enhanced by a reduction step. (i–j) EM-micrograph of erythrocytes using the rOTO staining protocol in standard (i) and reduced (j) conditions. The reduction enhances the DAB-polymer’s affinity to osmium. Scale bars: (a) : 1 μm; (b) : 5 μm; c–f: 10 μm; g–h : 20 μm; i–j : 5 μm.
Figure 1—figure supplement 2
Cytosolic APEX2.
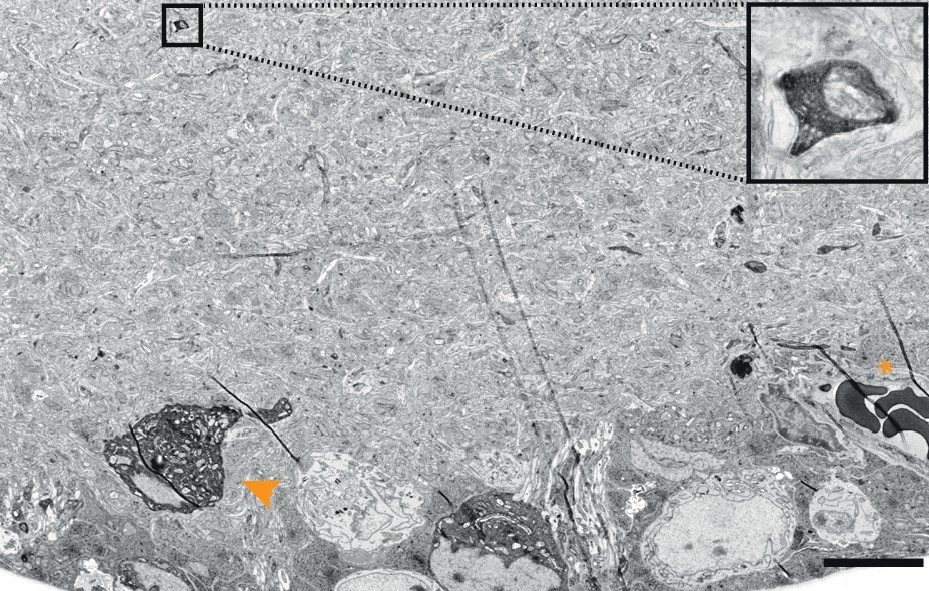
EM-micrograph of a mouse direction selective RGC soma rendered electron dense after tissue reduction (arrowhead). Note the small process visible in the inner plexiform layer (boxes, enlarged image on the right) and the strongest signal of the erythrocytes (asterisk). Scale bar: 10 μm.
Figure 1—figure supplement 3
Endoplasmic reticulum tagged HRP (erHRP).
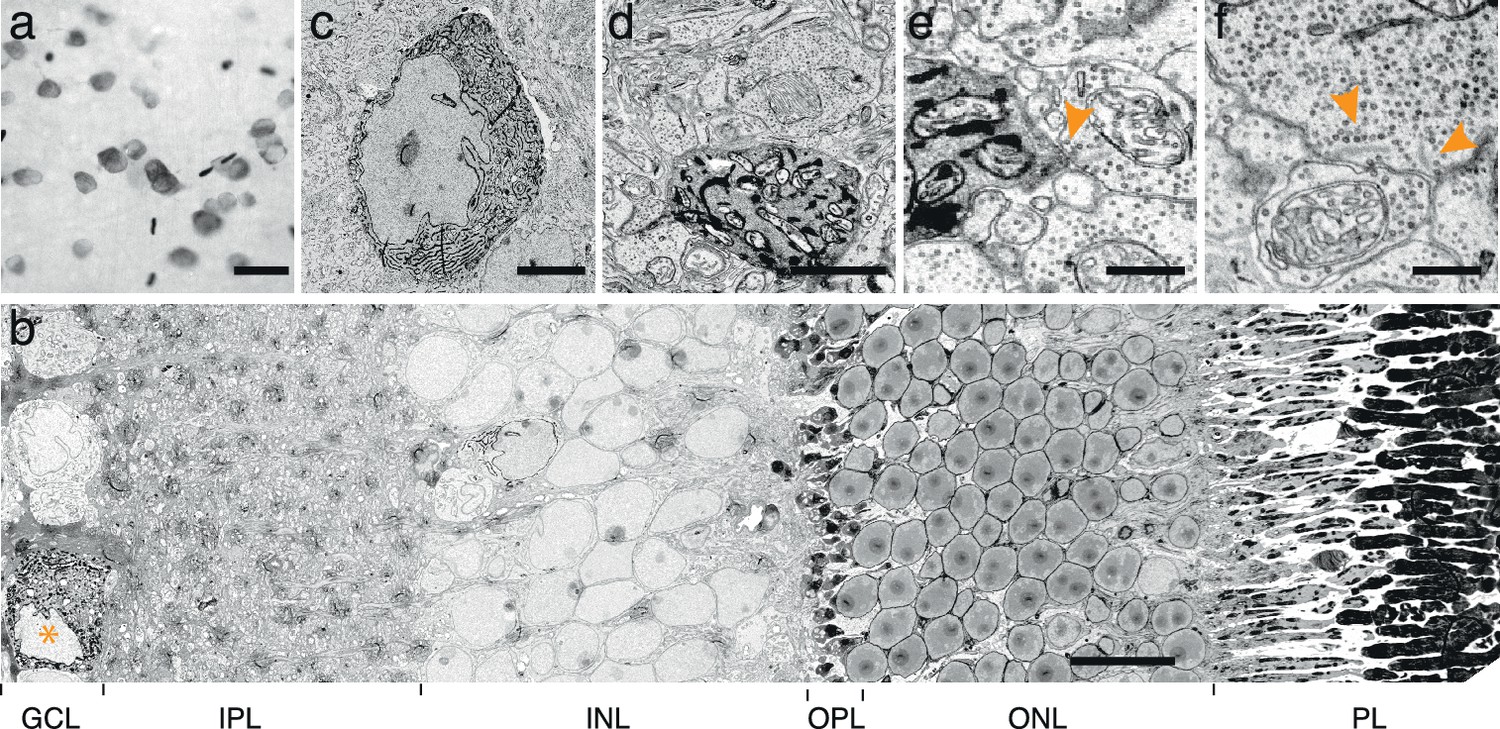
(a) Bright-field images of Cre-dependent virally infected mouse direction-selective retinal ganglion cell (ooDSGC) expressing erHRP and rendered photon-dense. (b) EM-micrograph of a vertical retinal cross-section with an erHRP expressing RGC. Asterisk depicts erHRP-expressing soma. GCL: ganglion cell layer, IPL: inner plexiform layer, INL, inner nuclear layer, OPL, outer plexiform layer, ONL, outer nuclear layer, PL: photoreceptor layer. (c) erHRP expressing soma. (d–e) erHRP expressing dendritic compartments in the IPL. (f) Micrograph of ribbon synapses in the IPL (arrowheads). Ultra-structural quality is preserved. Scale bars: a :20 μm; b:10 μm; c:5 μm; d : 1 μm; e–f : 500 nm.
Figure 1—figure supplement 4
Chemical tissue reduction improves contrast-to-noise ratio between membrane and cytosol.
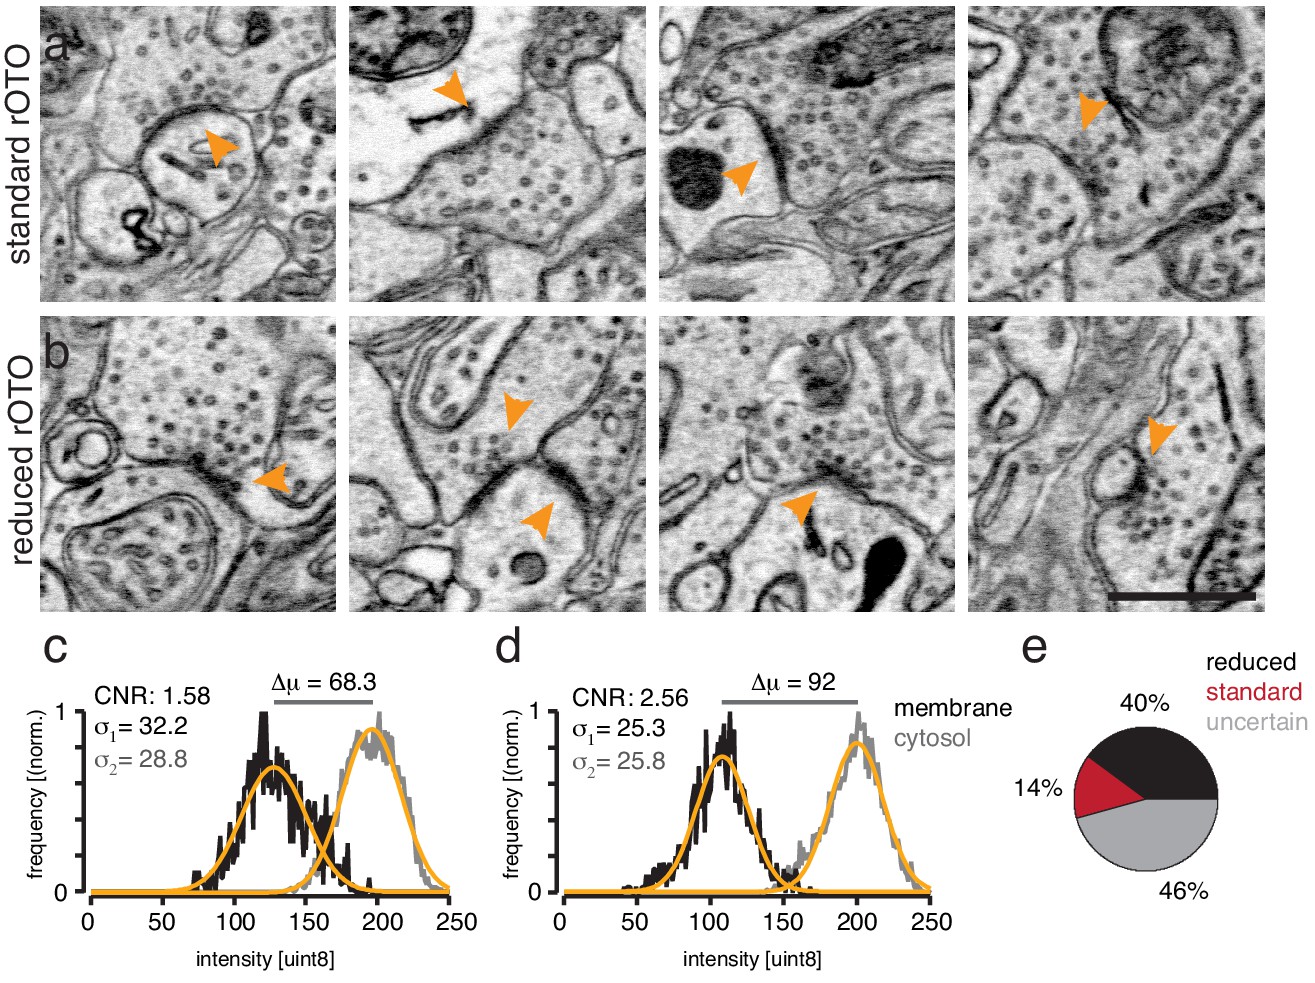
(a–b). EM-micrographs of the inner plexiform layer of mouse retinas not treated with DAB and stained with the standard (a) or reduction protocol (b). Note the enhancement of the membrane and synaptic density stain in (b) compared to (a). (c–d) Intensity histograms of manually selected membrane or cytosol pixels from standard and reduced EM micrographs. The reduction shifts the distribution of the membrane pixels (black traces) by 24 intensity values to a lower mean value (μ) compared to the cytosolic distribution (gray traces; Intensity values: 0 = dark; 255 = white). Thus, the reduction step increases the electron density of membranes specifically. Orange traces: Gaussian fits. The contrast-to-noise value is defined as: Contrast-to-noise improves by 62% by reducing the tissue and therefore could be a valuable signal enhancing step to improve automatic segmentation results that are based on machine-learning approaches. (e) Blind-to-condition selection of synaptic quality based on randomized pairwise comparisons. Scale bar: 1 μm.
Figure 1—figure supplement 5
Synaptic contacts received and made by peroxidase expressing cells.
(a) EM-micrographs of the inner plexiform layer of mouse retinas expressing APEX2 in ooDS ganglion cells contacted by presynaptic partners (arrowheads). (b) EM-micrographs of the upper layers of the superior colliculus including axonal termini of APEX2 in ooDS ganglion cells contacting postsynaptic partners (arrowheads). (c) EM-micrographs of the inner plexiform layer of retinas expressing erHRP in ganglion cells (asterisks) contacted by presynaptic partners (arrowheads). Scale bars: 500 nm
Figure 2
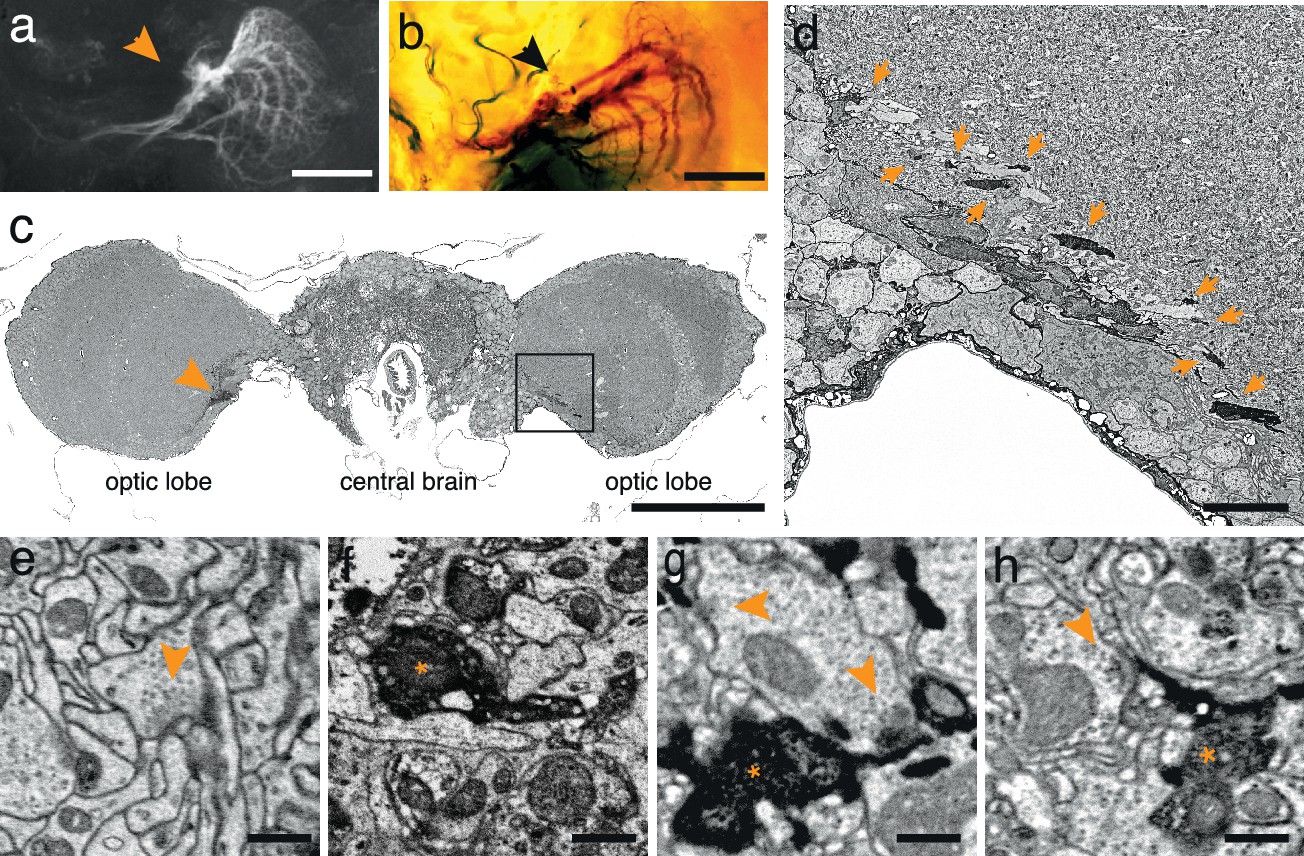
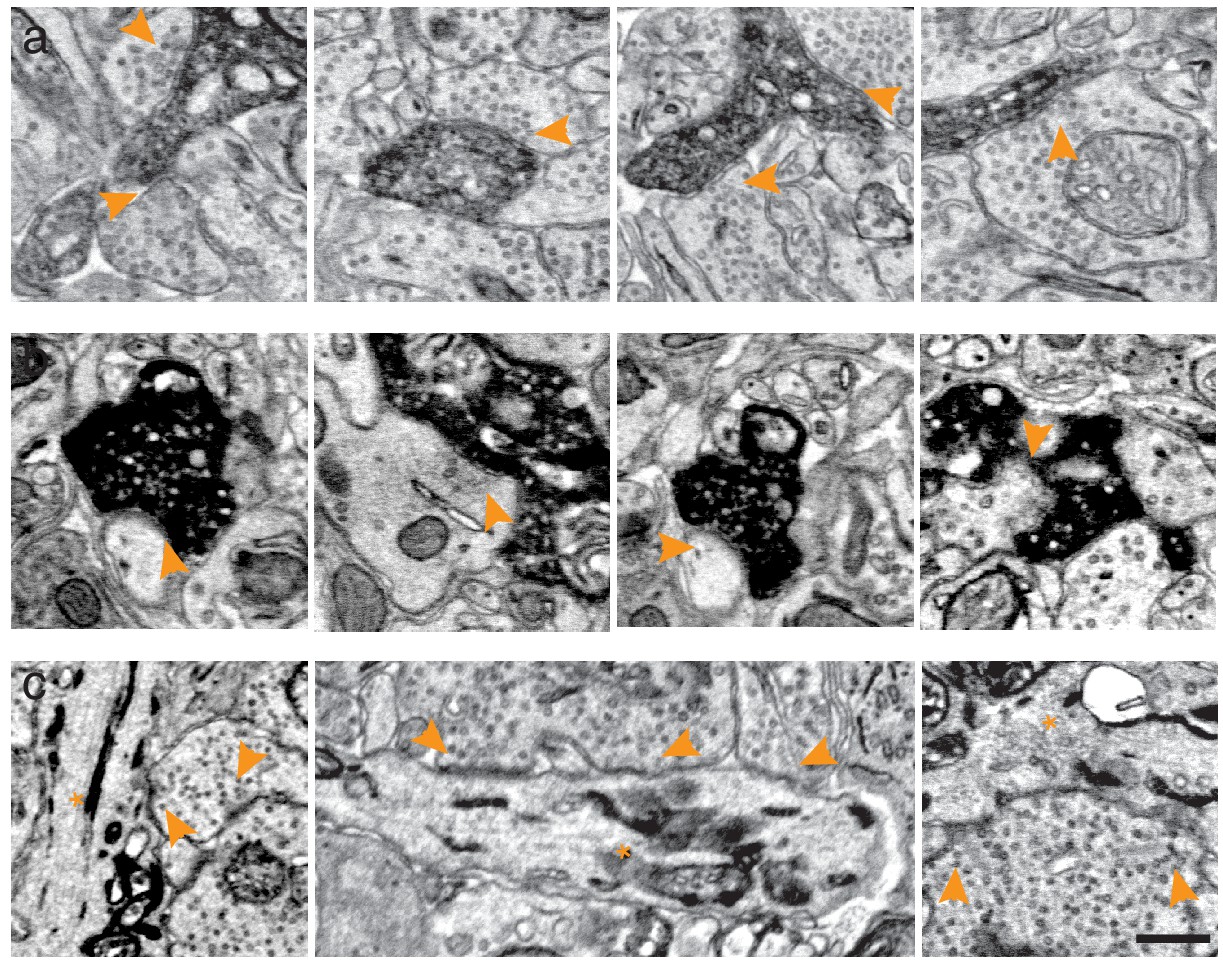
APEX expressing interneurons in Drosophila melanogaster.
(a) Fluorescent image of a brain of Drosophila melanogaster (DB331-Gal4 → UAS-APEX-GFP) expressing APEX in direction-selective lobula plate tangential cells (LPTCs). (b) Bright field image of a similar plane from another (DB331-Gal4 → UAS-APEX-GFP) fly, labeled with DAB. (c) Electron micrograph of a frontal brain section (30 nm thickness) containing electron dense staining in axonal processes of LPTCs (arrowhead and framed box). (d) Enlarged view of the framed region in (c). Arrows point to electron dense processes. (e) Unstained synaptic terminal, showing quality of ultrastructural detail. (f) Synaptic nerve terminal in an APEX-positive process, identifiable by contrast-reversed vesicles. (g,h) APEX-positive postsynaptic processes, identifiable by the presence of adjacent vesicle-laden, T-bar-containing terminals. Scale bars: a–c :100 μm; d :10 μm; e–g : 500 nm.
Figure 3

Targeted interrogation of serial-section EM volumes in mouse retina.
(a). Overview-resolution EM volume containing J-RGCs expressing APEX2NES. Every 10th section was imaged at 30 nm/pixel. (b) Two consecutive sections containing APEX2NES expressing J-RGC processes (arrows). (c) Reconstructed J-RGC. Note the reduced complexity of the dendritic field due to the subsampling of the overview dataset. (d) Overview-resolution EM volume that contains SACs expressing APEX2NES. The sections were imaged at 20 nm/pixel. (e) Two consecutive sections showing a SAC-SAC contact (arrowheads). (f) Reconstruction of the SAC-SAC interaction in (e); arrowhead indicates contact shown in e. (g–h). Comparison of ultrastructural detail visible at 20 nm/pix (g) or 4 nm/pix (h). Although both images contain ribbon synapses, the low-resolution image (g) lacks the required resolution to identify them. Arrowheads point to ribbons. (i) High-resolution (4 nm/pixel) EM subvolume selected from (d). (j) Two high-resolution EM-micrographs containing SAC-processes expressing APEX2NES receiving synaptic contacts (arrowheads). (k) Reconstruction of the SAC plexus with its characteristic dendritic fasciculation and net-like structure. Asterisk indicates contact and arrowheads the synaptic inputs shown in j (top panel). Scale bars: b: 5 μm; c: 50 μm; e, j: 1 μm; g–h: 200 nm.
Figure 4
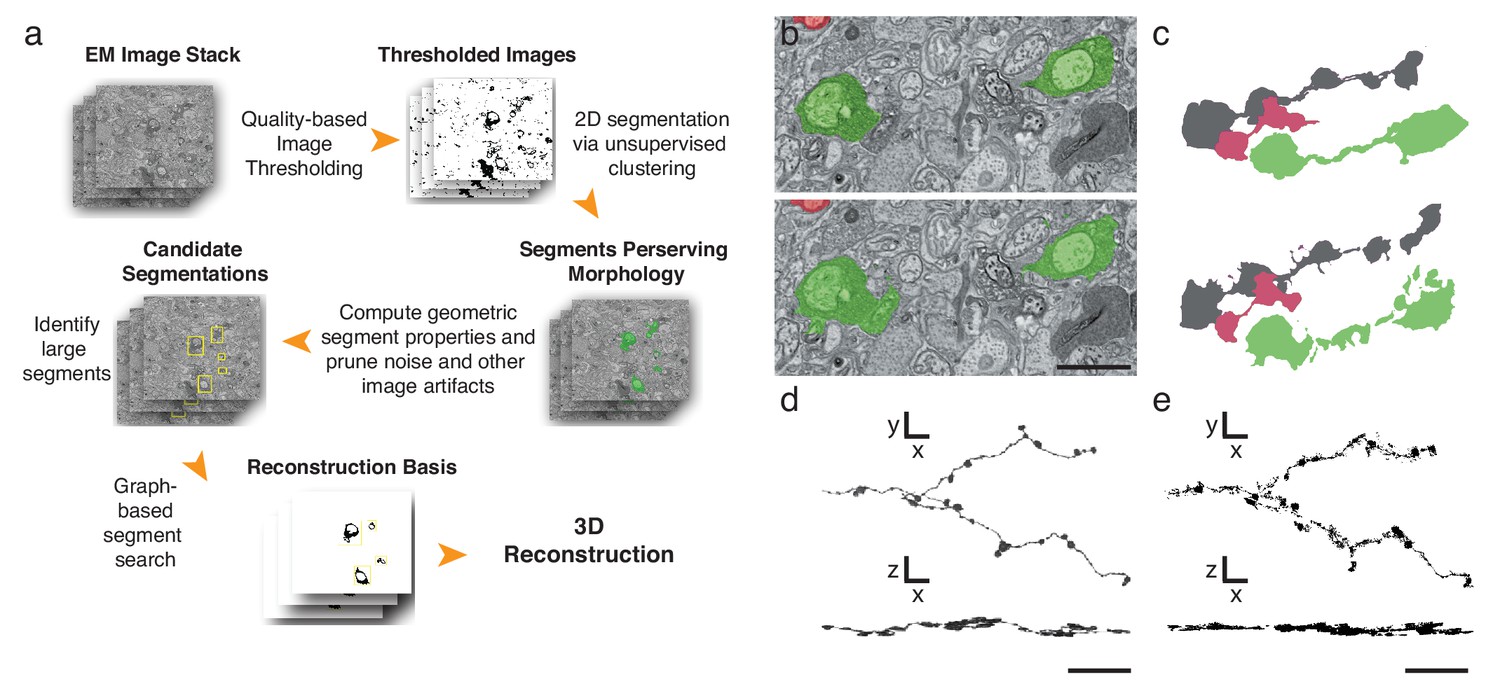
Automatic segmentation and reconstruction algorithm for APEX2 positive processes.
(a) The algorithm performs unsupervised 2D segmentation and 3D reconstruction without the need of pre-training. The procedure follows these steps: 1. Clustering-based image thresholding over pixel intensities from known contrast-enhanced ranges, modulated via quality assessment; 2. 2D segmentation based on unsupervised clustering; 3. Calculation of geometric properties for each identified segment, followed by noise and artifact pruning based on these properties; 4. Identification of large segments based on segment properties; 5. Graph-based segment search for reconstruction and labeling in 3D, followed by a final merging procedure to enforce consistency across the volume. (b) Unsupervised automatic segmentation of mouse SAC processes. Top: manual segmentation, ground-truth; bottom: automatic segmentation. (c).Reconstructions of the dendritic process in (b), comparing manual (top) and automatic reconstructions. (d) Manual reconstruction of a starburst amacrine cell process. En face (top) and side view (bottom). (e) Automatic reconstruction of the same process shown in d. En face (top) and side view (bottom). Scale bar in b: 1 μm; d, e: 10 μm.
Additional files
-
Supplementary file 1
AAV constructs used in this study.
- https://doi.org/10.7554/eLife.15015.012
-
Supplementary file 2
Fixation, reaction and staining method: rOTO protocol.
- https://doi.org/10.7554/eLife.15015.013
-
Supplementary file 3
Fixation, reaction and staining method: reduced osmium protocol.
- https://doi.org/10.7554/eLife.15015.014
-
Supplementary file 4
Table of contents - Artemis Live Scripts.mlx.
- https://doi.org/10.7554/eLife.15015.015
Download links
A two-part list of links to download the article, or parts of the article, in various formats.
Downloads (link to download the article as PDF)
Open citations (links to open the citations from this article in various online reference manager services)
Cite this article (links to download the citations from this article in formats compatible with various reference manager tools)
Reconstruction of genetically identified neurons imaged by serial-section electron microscopy
eLife 5:e15015.
https://doi.org/10.7554/eLife.15015


