Mechanistic insight into a peptide hormone signaling complex mediating floral organ abscission
- University of Geneva, Switzerland
- University of Oslo, Norway
- Leibniz University, Germany
Figures
Figure 1 with 3 supplements
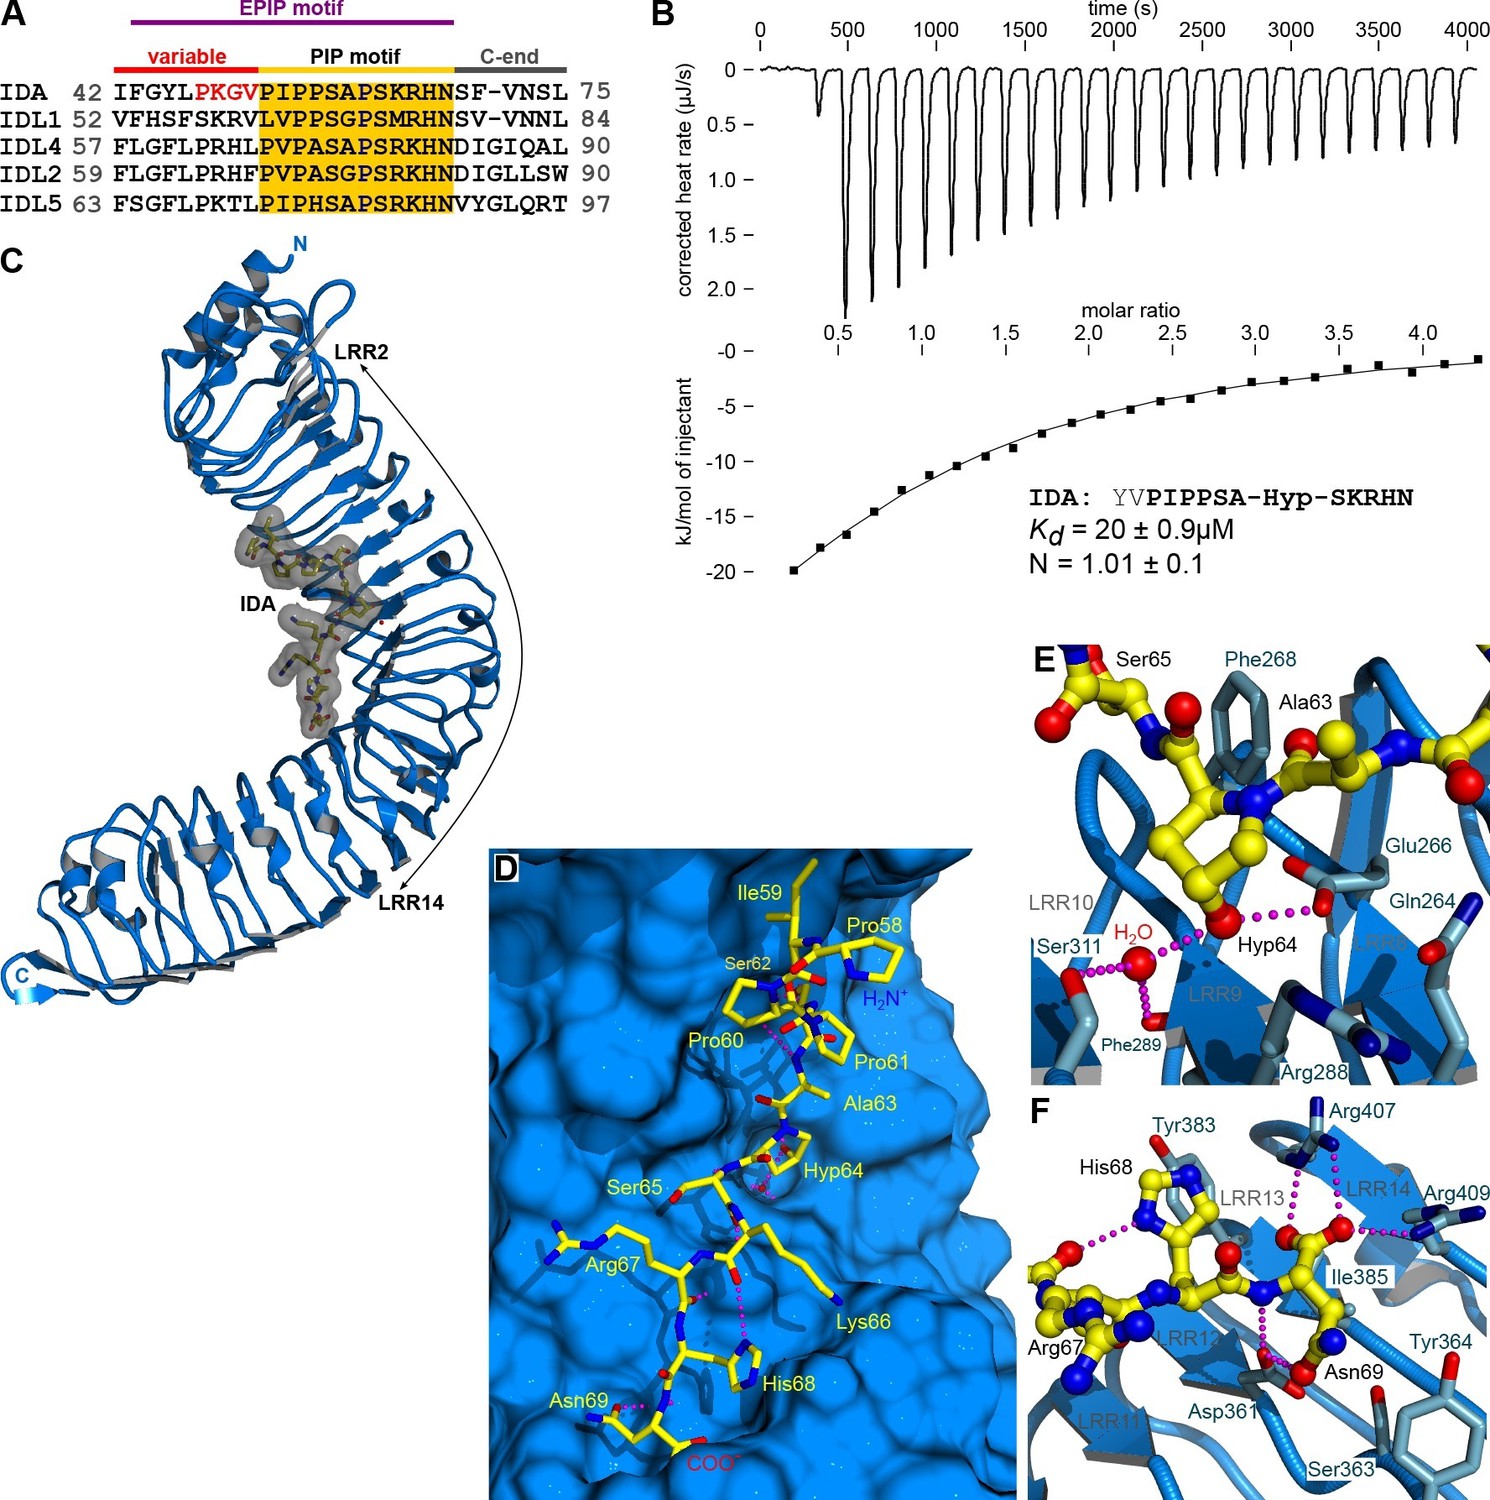
The peptide hormone IDA binds to the HAESA LRR ectodomain.
(A) Multiple sequence alignment of selected IDA family members. The conserved PIP motif is highlighted in yellow, the central Hyp in blue. The PKGV motif present in our N-terminally extended IDA peptide is highlighted in red. (B) Isothermal titration calorimetry of the HAESA ectodomain vs. IDA and including the synthetic peptide sequence. (C) Structure of the HAESA – IDA complex with HAESA shown in blue (ribbon diagram). IDA (in bonds representation, surface view included) is depicted in yellow. The peptide binding pocket covers HAESA LRRs 2–14. (D) Close-up view of the entire IDA (in yellow) peptide binding site in HAESA (in blue). Details of the interactions between the central Hyp anchor in IDA and the C-terminal Arg-His-Asn motif with HAESA are highlighted in (E) and (F), respectively. Hydrogren bonds are depicted as dotted lines (in magenta), a water molecule is shown as a red sphere.
Figure 1—figure supplement 1

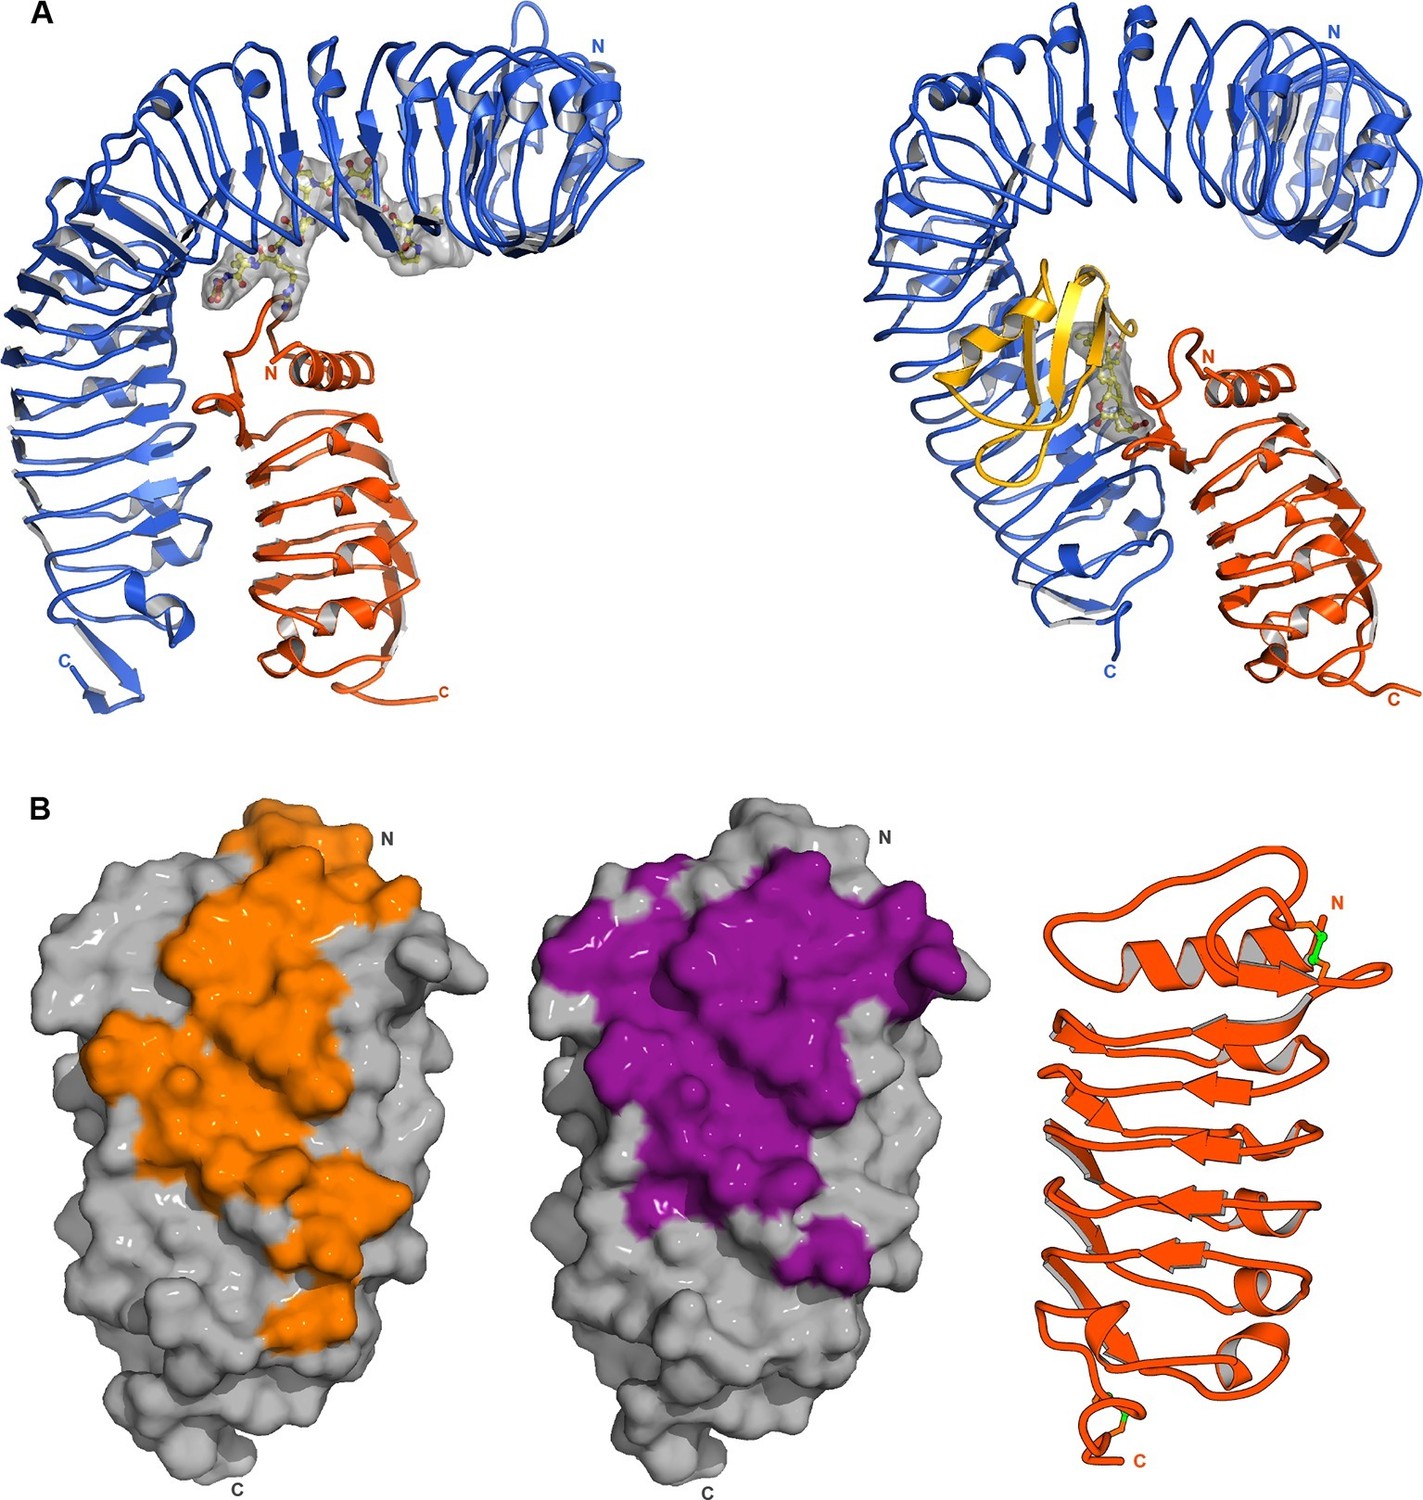
The HAESA ectodomain folds into a superhelical assembly of 21 leucine-rich repeats.
(A) SDS PAGE analysis of the purified Arabidopsis thaliana HAESA ectodomain (residues 20–620) obtained by secreted expression in insect cells. The calculated molecular mass is 65.7 kDa, the actual molecular mass obtained by mass spectrometry is 74,896 Da, accounting for the N-glycans. (B) Ribbon diagrams showing front (left panel) and side views (right panel) of the isolated HAESA LRR domain. The N- (residues 20–88) and C-terminal (residues 593–615) capping domains are shown in yellow, the central 21 LRR motifs are in blue and disulphide bonds are highlighted in green (in bonds representation). (C) Structure based sequence alignment of the 21 leucine-rich repeats in HAESA with the plant LRR consensus sequence shown for comparison. Conserved hydrophobic residues are shaded in gray, N-glycosylation sites visible in our structures are highlighted in blue, cysteine residues involved in disulphide bridge formation in green. (D) Asn-linked glycans mask the N-terminal portion of the HAESA ectodomain. Oligomannose core structures (containing two N-actylglucosamines and three terminal mannose units) as found in Trichoplusia ni cells and in plants were modeled onto the seven glycosylation sites observed in our HAESA structures, to visualize the surface areas potentially not masked by carbohydrate. The HAESA ectodomain is shown in blue (in surface representation), the glycan structures are shown in yellow. Molecular surfaces were calculated with the program MSMS (Sanner et al., 1996), with a probe radius of 1.5 Å.
Figure 1—figure supplement 2
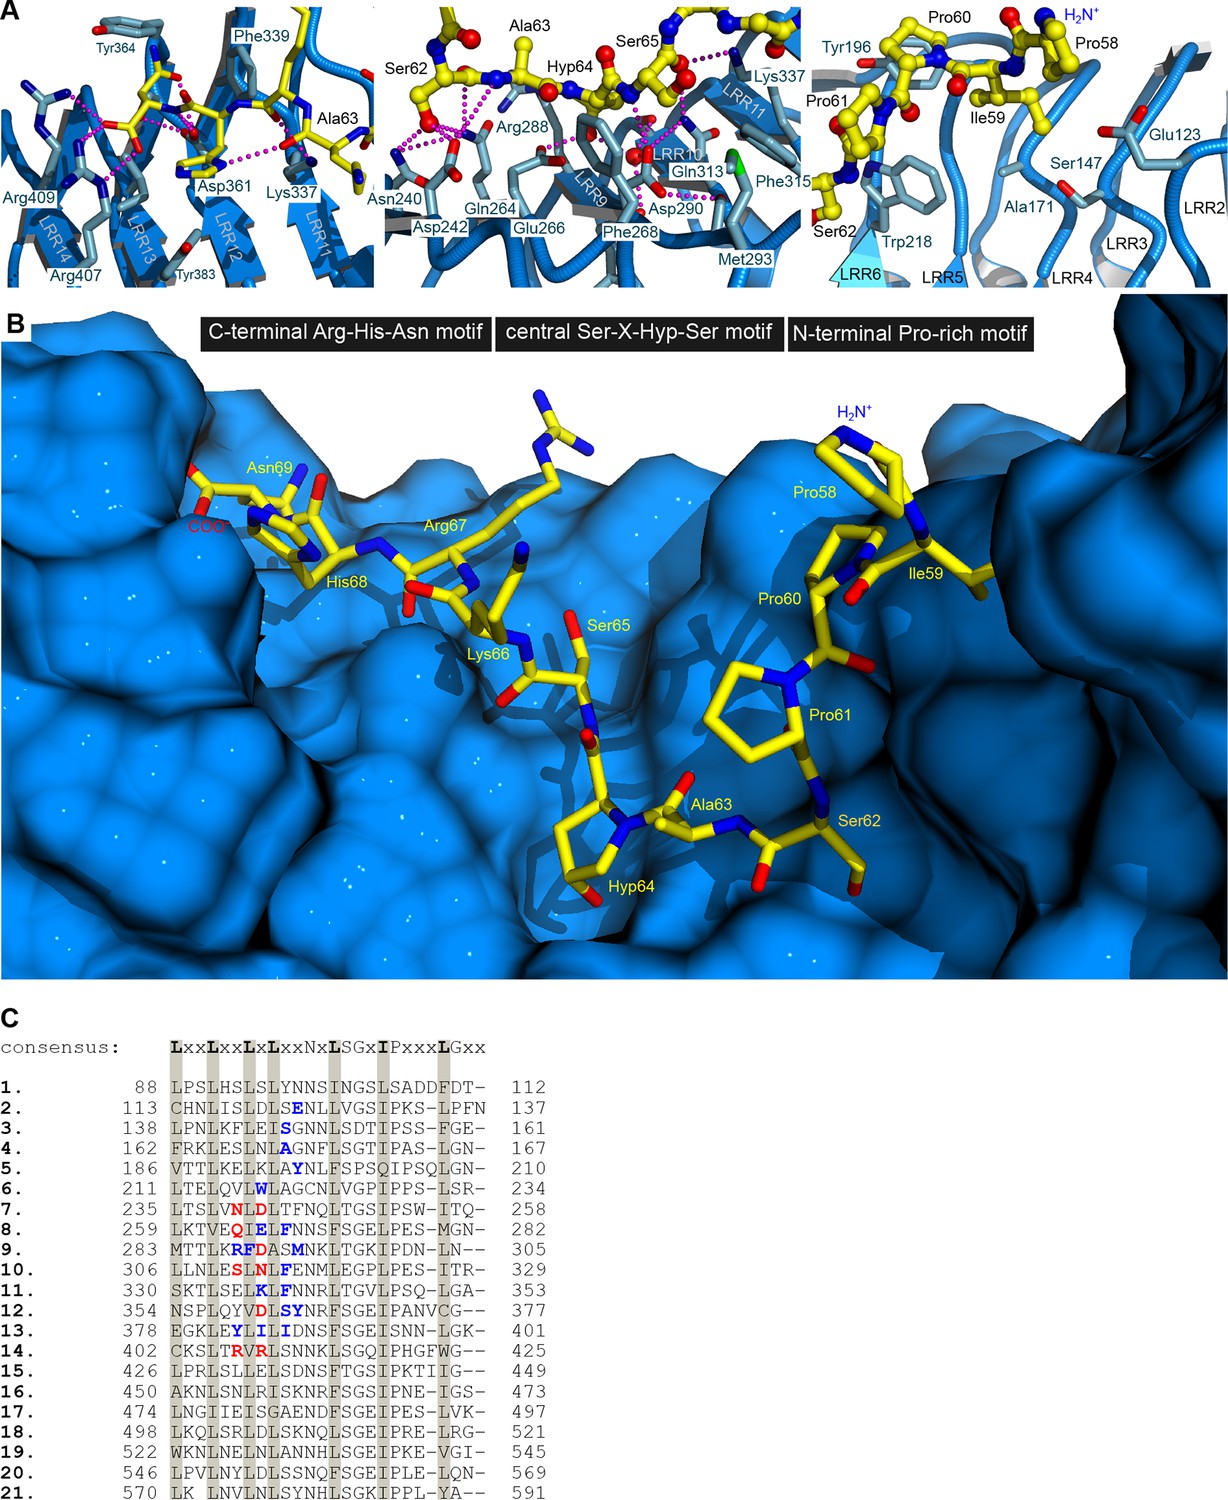
Hydrophobic contacts and a hydrogen-bond network mediate the interaction between HAESA and the peptide hormone IDA.
(A) Details of the IDA binding pocket. HAESA is shown in blue (ribbon diagram), the C-terminal Arg-His-Asn motif (left panel), the central Hyp anchor (center) and the N-terminal Pro-rich motif in IDA (right panel) are shown in yellow (in bonds representation). HAESA interface residues are shown as sticks, selected hydrogen bond interactions are denoted as dotted lines (in magenta). (B) View of the complete IDA (in bonds representation, in yellow) binding pocket in HAESA (surface view, in blue). Orientation as in (A). (C) Structure based sequence alignment of leucine-rich repeats in HAESA with the plant LRR consensus sequence shown for comparison. Residues mediating hydrophobic interactions with the IDA peptide are highlighted in blue, residues contributing to hydrogen bond interactions and/or salt bridges are shown in red. The IDA binding pocket covers LRRs 2–14 and all residues originate from the inner surface of the HAESA superhelix.
Figure 1—figure supplement 3
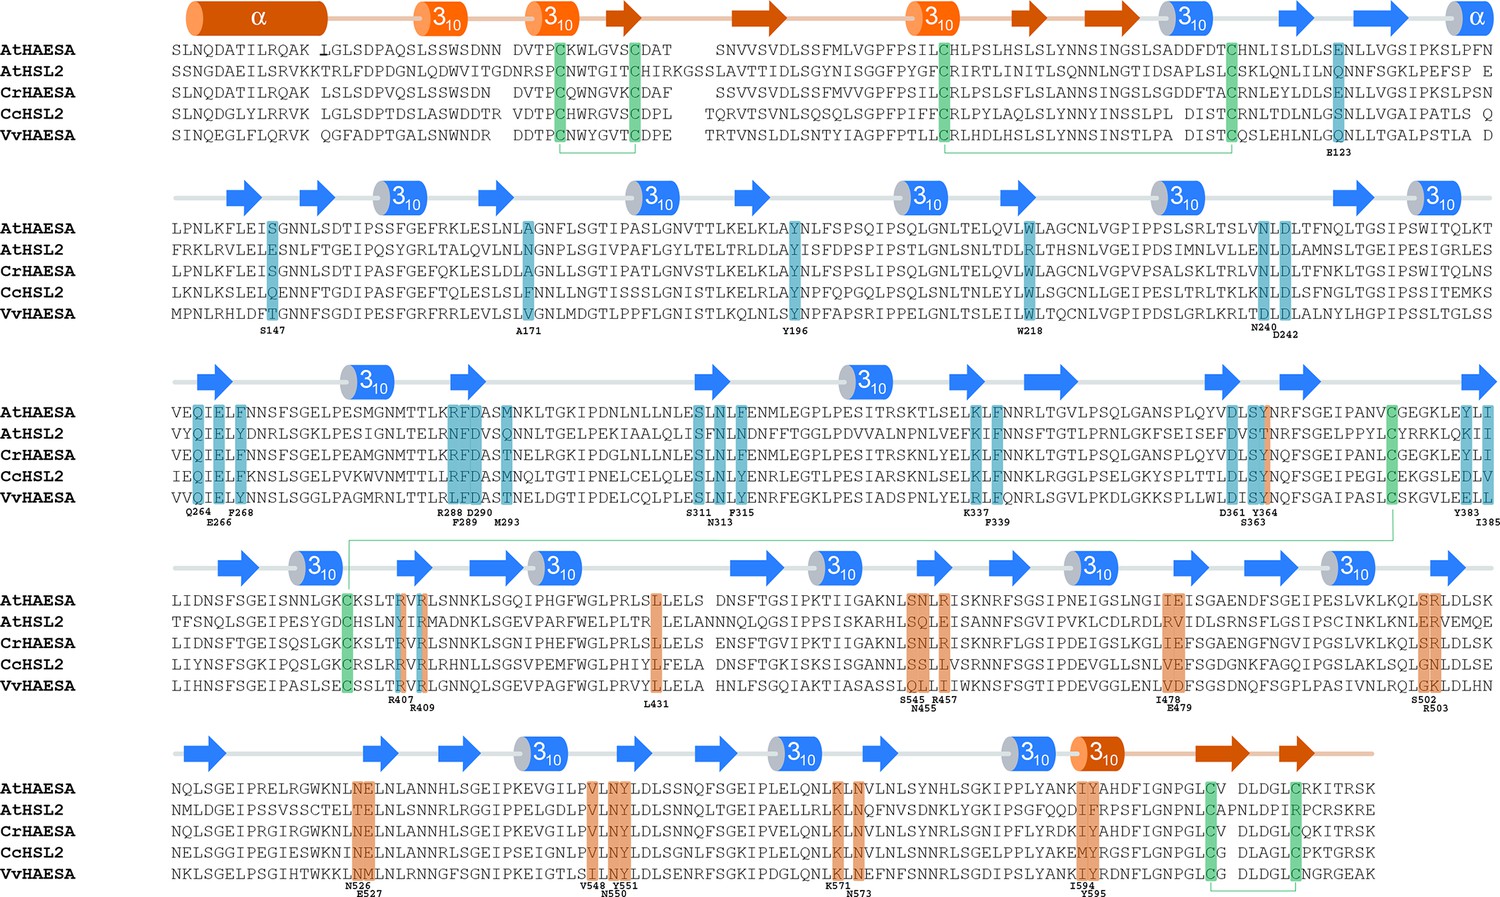
The IDA-HAESA and SERK1-HAESA complex interfaces are conserved among HAESA and HAESA-like proteins from different plant species.
Structure-based sequence alignment of the HAESA family members: Arabidopsis thaliana HAESA (Uniprot (http://www.uniprot.org) ID P47735), Arabidopsis thaliana HSL2 (Uniprot ID C0LGX3), Capsella rubella HAESA (Uniprot ID R0F2U6), Citrus clementina HSL2 (Uniprot ID V4U227), Vitis vinifera HAESA (Uniprot ID F6HM39). The alignment includes a secondary structure assignment calculated with the program DSSP (Kabsch and Sander, 1983) and colored according to Figure 1, with the N- and C-terminal caps and the 21 LRR motifs indicated in orange and blue, respectively. Cysteine residues engaged in disulphide bonds are depicted in green. HAESA residues interacting with the IDA peptide and/or the SERK1 co-receptor kinase ectodomain are highlighted in blue and orange, respectively.
Figure 2

Active IDA-family peptide hormones are hydroxyprolinated dodecamers.
Close-up views of (A) IDA, (B) the N-terminally extended PKGV-IDA and (C) IDL1 bound to the HAESA hormone binding pocket (in bonds representation, in yellow) and including simulated annealing 2Fo–Fc omit electron density maps contoured at 1.0 σ. Note that Pro58IDA and Leu67IDA are the first residues defined by electron density when bound to the HAESA ectodomain. (D) Table summaries for equilibrium dissociation constants (Kd), binding enthalpies (ΔH), binding entropies (ΔS) and stoichoimetries (N) for different IDA peptides binding to the HAESA ectodomain ( ± fitting errors; n.d. no detectable binding). (E) Structural superposition of the active IDA (in bonds representation, in gray) and IDL1 peptide (in yellow) hormones bound to the HAESA ectodomain. Root mean square deviation (r.m.s.d.) is 1.0 Å comparing 100 corresponding atoms.
Figure 3
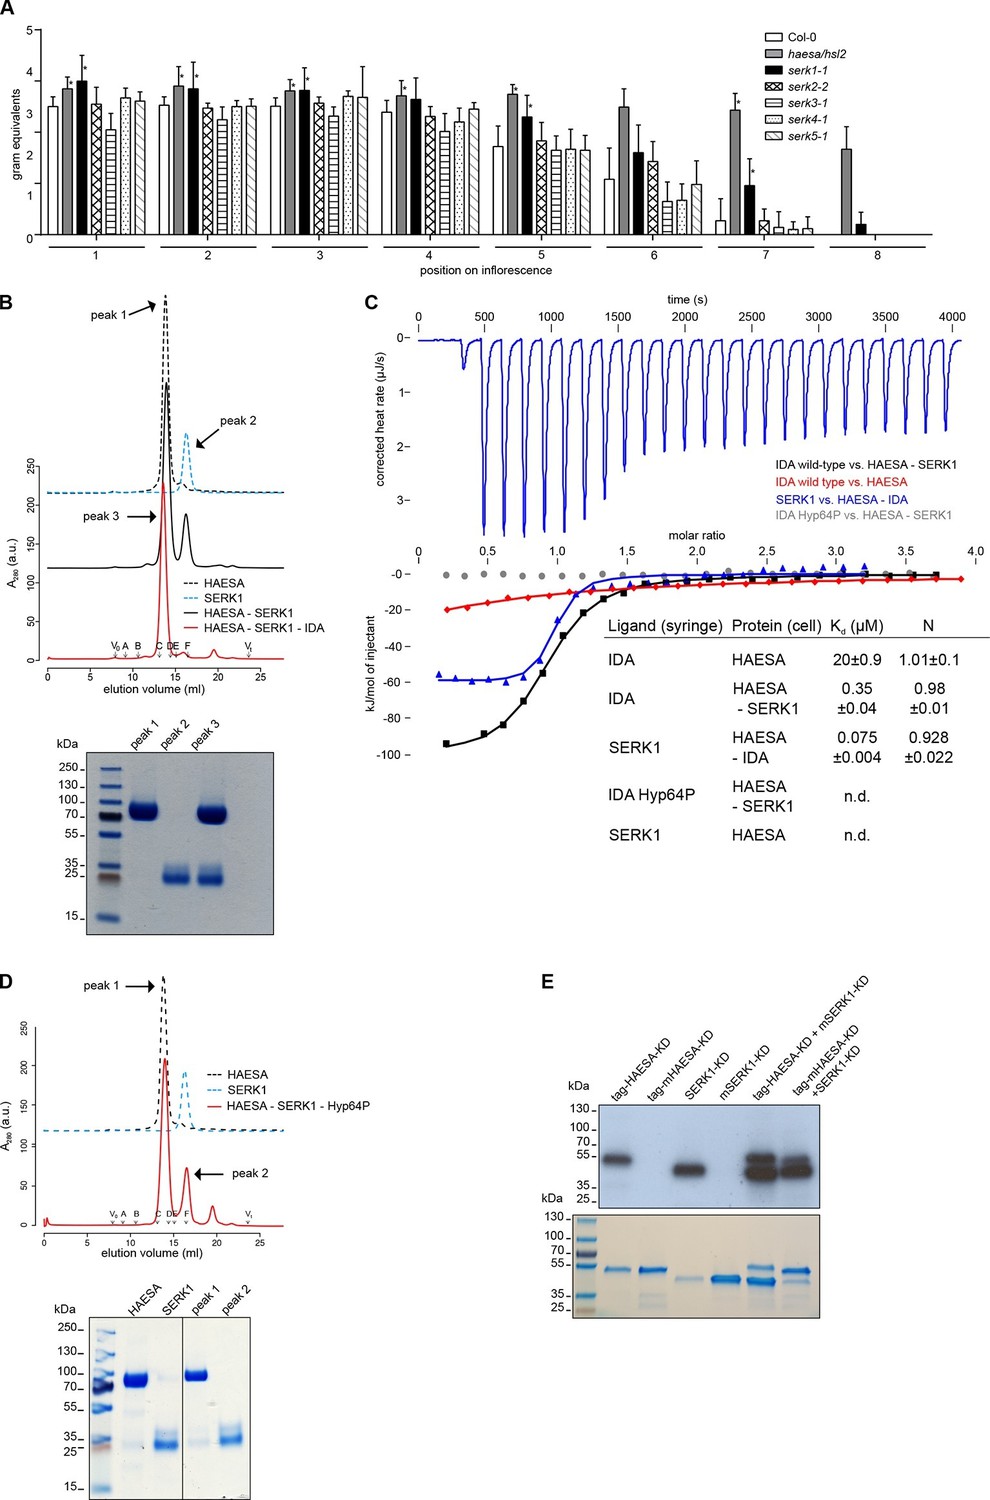
The receptor kinase SERK1 acts as a HAESA co-receptor and promotes high-affinity IDA sensing.
(A) Petal break-strength assays measure the force (expressed in gram equivalents) required to remove the petals from the flower of serk mutant plants compared to haesa/hsl2 mutant and Col-0 wild-type flowers. Petal break-strength is measured from positions 1 to 8 along the primary inflorescence where positions 1 is defined as the flower at anthesis (n=15, bars=SD). This treatment-by-position balanced two-way layout was analyzed separately per position, because of the serious interaction, by means of a Dunnett-type comparison against the Col-0 control, allowing for heterogeneous variances (Hasler and Hothorn, 2008). Petal break-strength was found significantly increased in almost all positions (indicated with a *) for haesa/hsl2 and serk1-1 mutant plants with respect to the Col-0 control. Calculations were performed in R (R Core Team, 2014) (version 3.2.3). (B) Analytical size-exclusion chromatography. The HAESA LRR domain elutes as a monomer (black dotted line), as does the isolated SERK1 ectodomain (blue dotted line). A HAESA – IDA – SERK1 complex elutes as an apparent heterodimer (red line), while a mixture of HAESA and SERK1 yields two isolated peaks that correspond to monomeric HAESA and SERK1, respectively (black line). Void (V0) volume and total volume (Vt) are shown, together with elution volumes for molecular mass standards (A, Thyroglobulin, 669,000 Da; B, Ferritin, 440,00 Da, C, Aldolase, 158,000 Da; D, Conalbumin, 75,000 Da; E, Ovalbumin, 44,000 Da; F, Carbonic anhydrase, 29,000 Da). A SDS PAGE of the peak fractions is shown alongside. Purified HAESA and SERK1 are ~75 and ~28 kDa, respectively. (C) Isothermal titration calorimetry of wild-type and Hyp64→Pro IDA versus the HAESA and SERK1 ectodomains. The titration of IDA wild-type versus the isolated HAESA ectodomain from Figure 1B is shown for comparison (red line; n.d. no detectable binding) (D) Analytical size-exclusion chromatography in the presence of the IDA Hyp64→Pro mutant peptide reveals no complex formation between HAESA and SERK1 ectodomains. A SDS PAGE of the peak fractions is shown alongside. (E) In vitro kinase assays of the HAESA and SERK1 kinase domains. Wild-type HAESA and SERK1 kinase domains (KDs) exhibit auto-phosphorylation activities (lanes 1 + 3). Mutant (m) versions, which carry point mutations in their active sites (Asp837HAESA→Asn, Asp447SERK1→Asn) possess no autophosphorylation activity (lanes 2+4). Transphosphorylation activity from the active kinase to the mutated form can be observed in both directions (lanes 5+6). A coomassie-stained gel loading control is shown below.
Figure 4
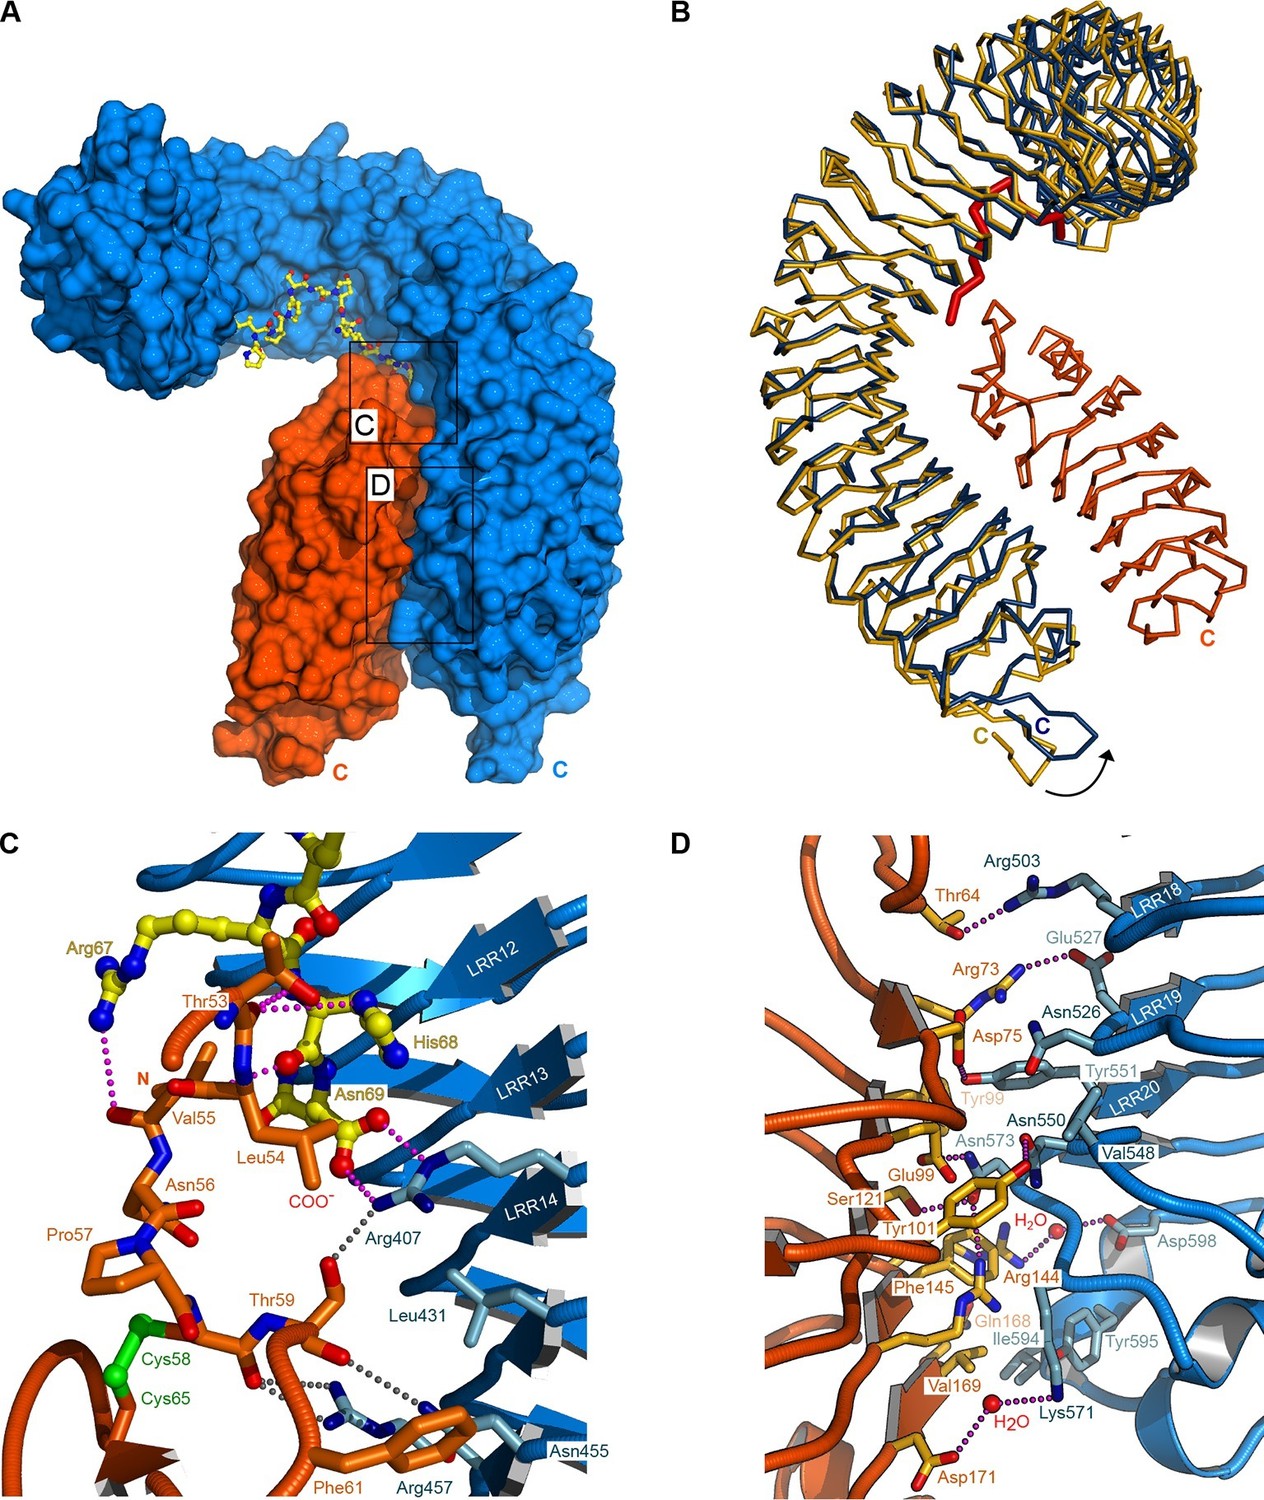
Crystal structure of a HAESA – IDA – SERK1 signaling complex.
(A) Overview of the ternary complex with HAESA in blue (surface representation), IDA in yellow (bonds representation) and SERK1 in orange (surface view). (B) The HAESA ectodomain undergoes a conformational change upon SERK1 co-receptor binding. Shown are Cα traces of a structural superposition of the unbound (yellow) and SERK1-bound (blue) HAESA ectodomains (r.m.s.d. is 1.5 Å between 572 corresponding Cα atoms). SERK1 (in orange) and IDA (in red) are shown alongside. The conformational change in the C-terminal LRRs and capping domain is indicated by an arrow. (C) SERK1 forms an integral part of the receptor's peptide binding pocket. The N-terminal capping domain of SERK1 (in orange) directly contacts the C-terminal part of IDA (in yellow, in bonds representation) and the receptor HAESA (in blue). Polar contacts of SERK1 with IDA are shown in magenta, with the HAESA LRR domain in gray. (D) Details of the zipper-like SERK1-HAESA interface. Ribbon diagrams of HAESA (in blue) and SERK1 (in orange) are shown with selected interface residues (in bonds representation). Polar interactions are highlighted as dotted lines (in magenta).
Figure 5

The IDA C-terminal motif is required for HAESA-SERK1 complex formation and for IDA bioactivity.
(A) Size exclusion chromatography experiments similar to Figure 3B,D reveal that IDA mutant peptides targeting the C-terminal motif do not form biochemically stable HAESA-IDA-SERK1 complexes. Deletion of the C-terminal Asn69IDA completely inhibits complex formation. Void (V0) volume and total volume (Vt) are shown, together with elution volumes for molecular mass standards (A, Thyroglobulin, 669,000 Da; B, Ferritin, 440,00 Da, C, Aldolase, 158,000 Da; D, Conalbumin, 75,000 Da; E, Ovalbumin, 44,000 Da; F, Carbonic anhydrase, 29,000 Da). Purified HAESA and SERK1 are ~75 and ~28 kDa, respectively. Left panel: IDA K66A/R67A; center: IDA ΔN69, right panel: SDS-PAGE of peak fractions. Note that the HAESA and SERK1 input lanes have already been shown in Figure 3D. (B) Isothermal titration thermographs of wild-type and mutant IDA peptides titrated into a HAESA - SERK1 mixture in the cell. Table summaries for calorimetric binding constants and stoichoimetries for different IDA peptides binding to the HAESA – SERK1 ectodomain mixture ( ± fitting errors; n.d. no detectable binding) are shown alongside. (C) Quantitative petal break-strength assay for Col-0 wild-type flowers and 35S::IDA wild-type and 35S::IDA K66A/R67A mutant flowers. Petal break is measured from positions 1 to 8 along the primary inflorescence where positions 1 is defined as the flower at anthesis (n=15, bars=SD). The three treatment groups in this unbalanced one-way layout were compared by Tukey’s all-pairs comparison procedure using the package multcomp (Hothorn et al., 2008) in R (R Core Team, 2014) (version 3.2.3). 35S::IDA plants showed significantly increased abscission compared to Col-0 controls in inflorescence positions 2 and 3 (a). Up to inflorescence position 4, petal break in 35S::IDA K66A/R67A mutant plants was significantly increased compared to both Col-0 control plants (b) and 35S::IDA plants (c) (D) Normalized expression levels (relative expression ± standard error; ida: -0.02 ± 0.001; Col-0: 1 ± 0.11; 35S::IDA 124 ± 0.75; 35S::IDA K66A/R67A: 159 ± 0.58) of IDA wild-type and mutant transcripts in the 35S promoter over-expression lines analyzed in (C). (E) Magnified view of representative abscission zones from 35S::IDA, Col-0 wild-type and 35S::IDA K66A/R67A double-mutant T3 transgenic lines. 15 out of 15 35S::IDA plants, 0 out of 15 Col-0 plants and 0 out of 15 35S::IDA K66A/R67A double-mutant plants, showed an enlarged abscission zone, respectively (3 independent lines were analyzed).
Figure 6
SERK1 uses partially overlapping surface areas to activate different plant signaling receptors.
(A) Structural comparison of plant steroid and peptide hormone membrane signaling complexes. Left panel: Ribbon diagram of HAESA (in blue), SERK1 (in orange) and IDA (in bonds and surface represention). Right panel: Ribbon diagram of the plant steroid receptor BRI1 (in blue) bound to brassinolide (in gray, in bonds representation) and to SERK1, shown in the same orientation (PDB-ID. 4lsx) (Santiago et al., 2013). (B) View of the inner surface of the SERK1 LRR domain (PDB-ID 4lsc (Santiago et al., 2013), surface representation, in gray). A ribbon diagram of SERK1 in the same orientation is shown alongside. Residues interacting with the HAESA or BRI1 LRR domains are shown in orange or magenta, respectively.
Figure 7
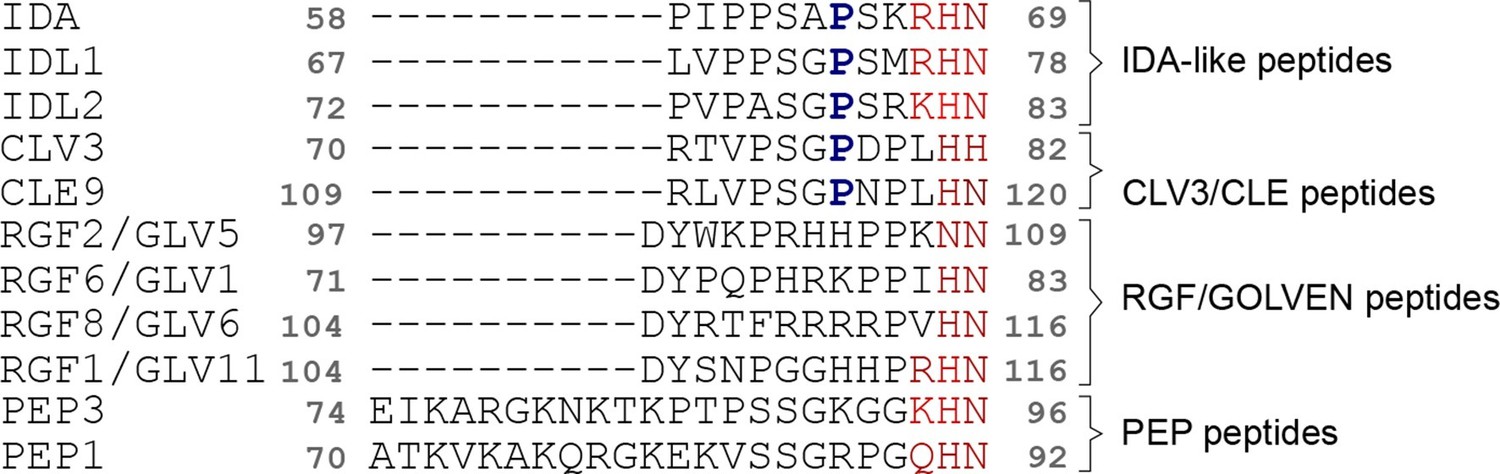
Different plant peptide hormone families contain a C-terminal (Arg)-His-Asn motif, which in IDA represents the co-receptor recognition site.
Structure-guided multiple sequence alignment of IDA and IDA-like peptides with other plant peptide hormone families, including CLAVATA3 – EMBRYO SURROUNDING REGION-RELATED (CLV3/CLE), ROOT GROWTH FACTOR – GOLVEN (RGF/GLV), PRECURSOR GENE PROPEP1 (PEP1) from Arabidopsis thaliana. The conserved (Arg)-His-Asn motif is highlighted in red, the central Hyp residue in IDLs and CLEs is marked in blue.
Author response image 1
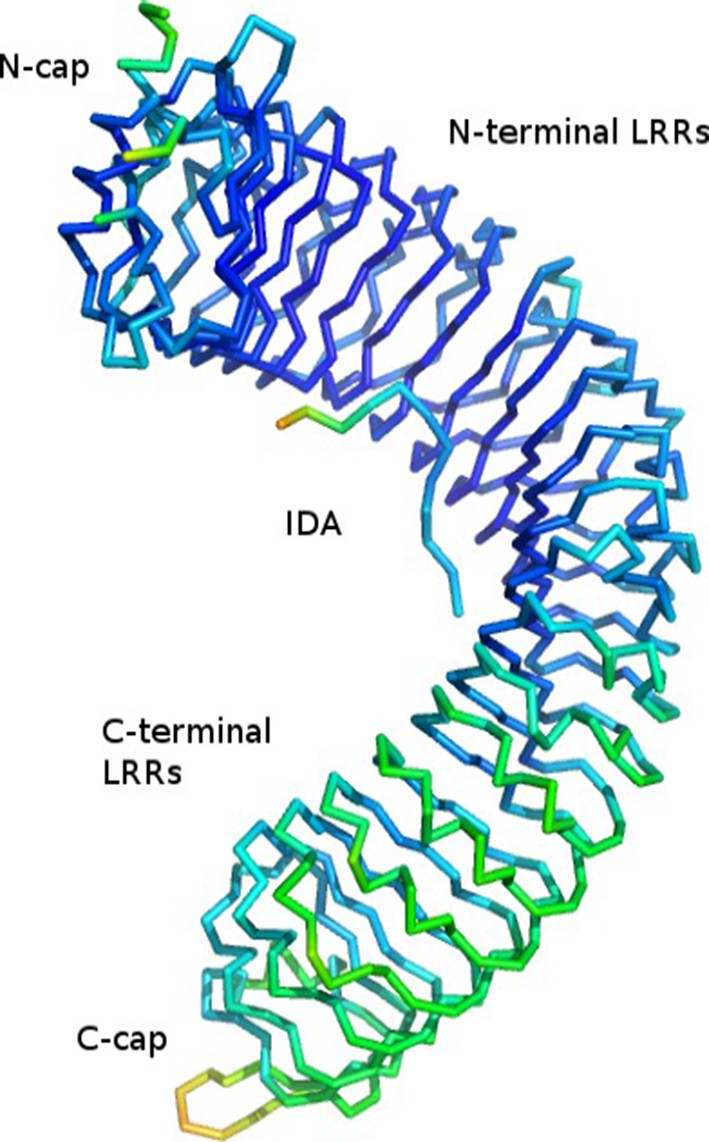
Cα trace of the HAESA LRR domain and IDA peptide colored according to B-factor from low (60.9, in blue) to high (134.7, in red).
Mean B-value is 79.5.
Author response image 2
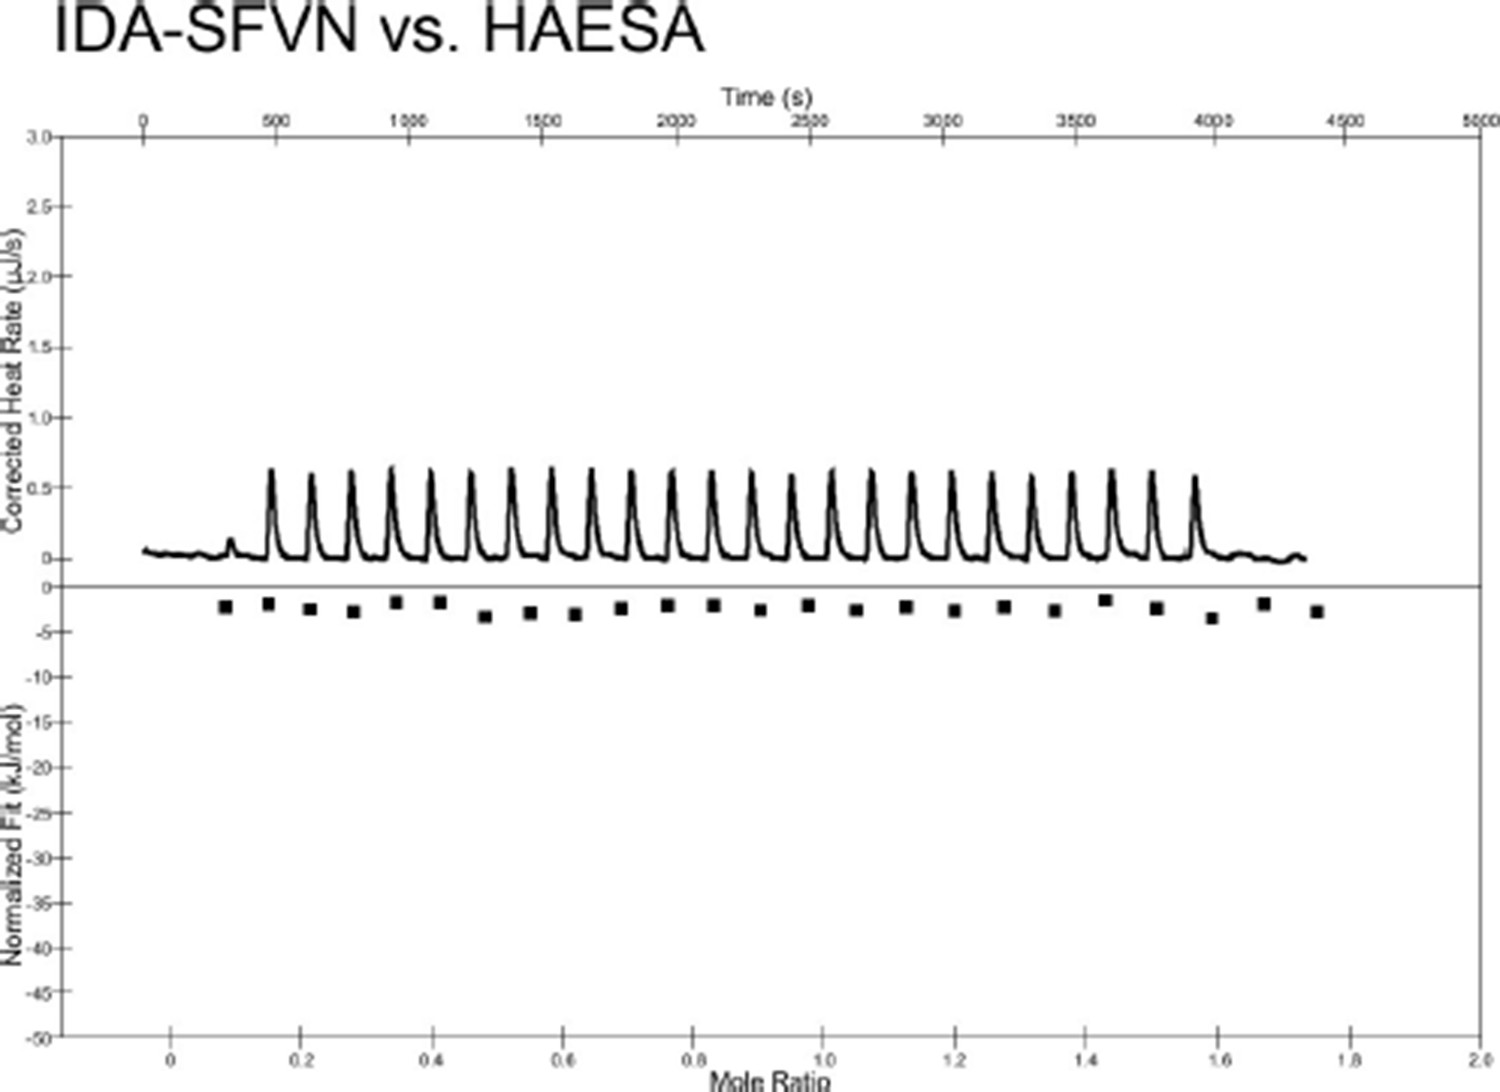
Isothermal titration calorimetry thermograph of the C-terminally extended IDA-SFVN peptide (200 μM) titrated into a solution containing 20 μM of the purified HAESA ectodomain.
No detectable binding is observed.
Tables
Table 1
Crystallographic data collection, phasing and refinement statistics for the isolated A. thaliana HAESA ectodomain.
| HAESA NaI shortsoak | HAESA apo | |
|---|---|---|
| PDB-ID | 5IXO | |
| Data collection | ||
| Space group | P31 21 | P31 21 |
| Cell dimensions | ||
| a, b, c (Å) | 148.55, 148.55, 58.30 | 149.87, 149.87, 58.48 |
| α, β, γ (°) | 90, 90, 120 | 90, 90, 120 |
| Resolution (Å) | 48.63–2.39 (2.45–2.39) | 45.75–1.74 (1.85–1.74) |
| Rmeas# | 0.096 (0.866) | 0.038 (1.02) |
| CC(1/2)# | 100/86.6 | 100/75.6 |
| I/σ I# | 27.9 (4.9) | 18.7 (1.8) |
| Completeness (%)# | 99.9 (98.6) | 99.6 (97.4) |
| Redundancy# | 53.1 (29.9) | 14.4 (14.0) |
| Wilson B-factor (Å2)# | 84.45 | 81.10 |
| Refinement | ||
| Resolution (Å) | 45.75 – 1.74 | |
| No. reflections | 71,213 | |
| Rwork/Rfree$ | 0.188/0.218 | |
| No. atoms | ||
| Protein/glycan | 4,533/126 | |
| Water | 71 | |
| Res. B-factors (Å2)$ | ||
| Protein | 77.54 | |
| Glycan | 95.98 | |
| Water | 73.20 | |
| R.m.s deviations$ | ||
| Bond lengths (Å) | 0.0095 | |
| Bond angles (°) | 1.51 |
-
Highest resolution shell is shown in parenthesis.
-
#As defined in XDS (Kabsch, 1993)
-
$As defined in Refmac5 (Murshudov et al., 1997)
Table 2
Crystallographic data collection and refinement statistics for the HAESA – IDA, – PKGV-IDA, – IDL1 and – IDA – SERK1 complexes.
| HAESA – IDA | HAESA – PKGV-IDA | HAESA – IDL1 | HAESA – IDA – SERK1 | |
|---|---|---|---|---|
| PDB-ID | 5IXQ | 5IXT | 5IYN | 5IYX |
| Data collection | ||||
| Space group | P31 21 | P31 21 | P31 21 | P212121 |
| Cell dimensions | ||||
| a, b, c (Å) | 148.55, 148.55, 58.30 | 148.92, 148.92, 58.02 | 150.18, 150.18, 60.07 | 74.51, 100.46, 142.76 |
| α, β, γ (°) | 90, 90, 120 | 90, 90, 120 | 90, 90, 120 | 90, 90, 90 |
| Resolution (Å) | 48.54–1.86 (1.97–1.86) | 48.75–1.94 (2,06–1.94) | 49.16–2.56 (2.72–2.56) | 47.59–2.43 (2.57–2.43) |
| Rmeas# | 0.057 (1.35) | 0.037 (0.97) | 0.056 (1.27) | 0.113 (1.37) |
| CC(1/2)# | 100/77.9 | 100/80.3 | 100/89.5 | 100/77.6 |
| I/σI# | 16.7 (2.0) | 20.9 (2.4) | 26.0 (1.9) | 16.12 (2.0) |
| Completeness# (%) | 99.8 (98.6) | 99.4 (97.9) | 99.5 (98.8) | 99.4 (96.4s |
| Redundancy# | 20.3 (19.1) | 11.2 (11.1) | 14.7 (14.7) | 9.7 (9.3) |
| Wilson B-factor (Å2)# | 80.0 | 81.7 | 89.5 | 59.3 |
| Refinement | ||||
| Resolution (Å) | 48.54–1.86 | 48.75–1.94 | 49.16–2.56 | 47.59–2.43 |
| No. reflections | 58,551 | 51,557 | 23,835 | 38,969 |
| Rwork/Rfree$ | 0.190/0.209 | 0.183/0.208 | 0.199/0.236 | 0.199/0.235 |
| No. atoms | ||||
| Protein/Glycan | 4,541/176 | 4,545/176 | 4,499/176 | 5,965/168 |
| Peptide | 93 | 93 | 90 | 112 |
| Water | 39 | 40 | 9 | 136 |
| Res. B-factors (Å2)$ | ||||
| Protein/Glycan | 79.48/109.02 | 79.63/113.24 | 102.12/132.49 | 60.05/73.48 |
| Peptide | 87.19 | 89.50 | 125.74 | 51.06 |
| Water | 75.32 | 71.92 | 74.65 | 51.47 |
| R.m.s deviations$ | ||||
| Bond lengths (Å) | 0.0087 | 0.0091 | 0.0081 | 0.0074 |
| Bond angles (°) | 1.48 | 1.47 | 1.36 | 1.34 |
-
Highest resolution shell is shown in parenthesis.
-
#As defined in XDS (Kabsch, 1993)
-
$As defined in Refmac5 (Murshudov et al., 1997)
Download links
A two-part list of links to download the article, or parts of the article, in various formats.
Downloads (link to download the article as PDF)
Open citations (links to open the citations from this article in various online reference manager services)
Cite this article (links to download the citations from this article in formats compatible with various reference manager tools)
Mechanistic insight into a peptide hormone signaling complex mediating floral organ abscission
eLife 5:e15075.
https://doi.org/10.7554/eLife.15075


