Synaptic pruning in the female hippocampus is triggered at puberty by extrasynaptic GABAA receptors on dendritic spines
- SUNY Downstate Medical Center, United States
- Tianjin Medical University, China
Figures
Figure 1 with 2 supplements
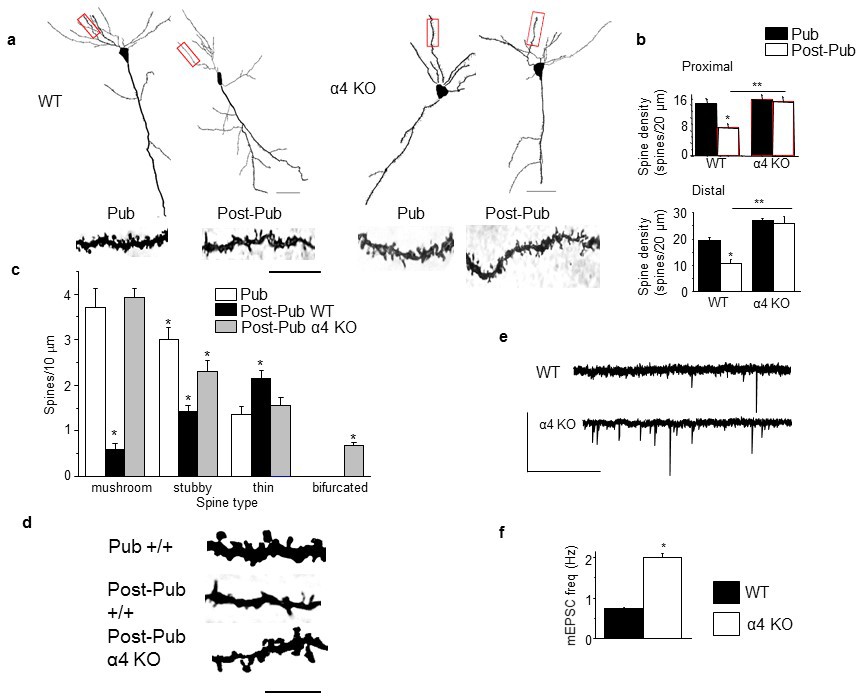
Synaptic pruning of CA1 hippocampus of adolescent female mice is prevented in the α4 knock-out.
Pub, pubertal; post-Pub, post-pubertal. (a) CA1 hippocampal pyramidal cells, Pub and post-Pub (8-week old) WT and α4 KO female mouse hippocampus. Upper panel, neurolucida images, scale, 50 µm; lower panel, z-stack (100x) images; scale, 20 µm. Additional images and data from male mice provided in Figure 1—figure supplement 1 and Figure 1—figure supplement 2, respectively. Source data for all figures are available as separate files. (b) Averaged data for spine density, Proximal (left), WT, t-test, t(41)=7.15, p<0.0001*, power=1; n= 21–22 neurons (5–6 mice)/group; α4 KO, t-test, t(47)=0.43, P=0.67; n= 24–25 neurons (6 mice)/group; post-Pub, WT vs. α4 KO, t-test, t(45)=5.8, p<0.0001*; Distal (right), WT, t-test, t(28)=5.73, p<0.0001, power=1*; n= 15 neurons (5–6 mice)/group; α4 KO, t-test, t(39)=2.11, P=0.04; n= 20–21 neurons (6 mice)/group; post-Pub, WT vs. α4 KO, t-test, t(33)=8.1, p<0.0001*. *p<0.05 vs. Pub; **p<0.05 vs. WT. (Figure 1—source data 1) (c) Quantification of spines according to type, *p<0.05 vs. other pubertal/genotype groups. Mushroom, ANOVA, F(2,54)=110.65, p<0.0001*, power=1; Stubby, ANOVA, F(2,54)=23.1, p<0.0001, power=1; Thin, ANOVA, F(2,54)=9.29, p=0.0003*, power=0.94; Bifurcated, ANOVA, F(2,54)=39, p<0.0001*, power=1; (n=19 neurons, 5 mice/group). *p<0.05 vs. other groups. (Figure 1—source data 2) (d) Representative high-contrast z-stack images; scale, 10 µm. (e) Representative mEPSCs, post-Pub WT and α4 KO. Scale, 50pA, 10 s. (f) Averaged data, mEPSC frequency; *t-test, t(16)=11.4, p<0.0001*, power=1; n= 8–10 cells (mice)/group. (Figure 1—source data 2)
-
Figure 1—source data 1
Spine counts/20 μm on dendrites of CA1 hippocampal pyramidal cells for Figure 1b for wild-type (WT) and α4 knock-out (KO) female mice assessed at puberty (Pub, PND 35, identified by vaginal opening) and post-puberty (Post-pub, PND 56).
- https://doi.org/10.7554/eLife.15106.004
-
Figure 1—source data 2
Spine counts/10 μm for different spine-types on dendrites of CA1 hippocampal pyramidal cells for Figure 1c for Pub and Post-pub WT and Post-pub α4 KO.
Spines were identified as: mushroom, stubby, thin or bifurcated (Bif).
- https://doi.org/10.7554/eLife.15106.005
-
Figure 1—source data 3
Figure 1f. mEPSC frequency, # mEPSCs/s recorded from CA1 hippocampal pyramidal cells using whole cell patch clamp techniques for post-pubertal WT (left) and α4 KO mice.
- https://doi.org/10.7554/eLife.15106.006
Figure 1—figure supplement 1
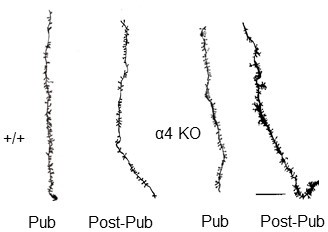
Neurolucida images of spine density across pubertal stage and α4 genotype.
Representative Neurolucida drawings. Scale, 10 μm.
Figure 1—figure supplement 2
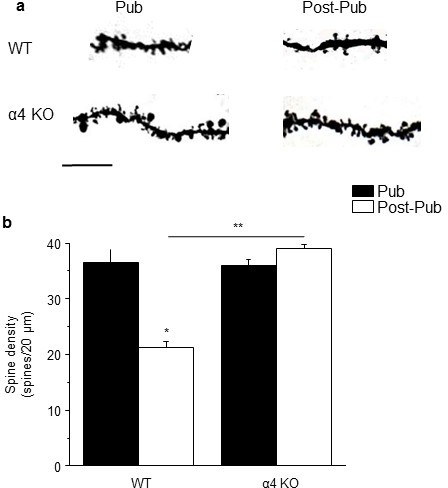
Synaptic pruning of CA1 hippocampus of adolescent male mice is prevented in the α4 knock-out.
Pub, pubertal; post-Pub, post-pubertal. (a) CA1 hippocampal pyramidal cells, Pub and post-Pub (8-week old) WT and α4 KO male mouse hippocampus. (a) Representative z-stack (100x) images; scale, 5 µm. (b) Averaged data for spine density, WT, pub vs. post-pub, t-test, t(22)=5.84, p<0.0001*, power=1; n= 12 neurons (3 mice)/group; α4 KO, pub vs. post-pub, t-test, t(22)=2, P=0.97; n= 12 neurons (3 mice)/group; post-pub, WT vs. α4 KO, t-test, t(22)=12.5, p<0.0001*, power=1. *p<0.05 vs. Pub; **p<0.05 vs. WT. (Source data 1)
-
Figure 1—figure supplement 2—source data 1
Spine counts/20 μm on dendrites of CA1 hippocampal pyramidal cells for Figure 1b for wild-type (WT) and α4 knock-out (KO) male mice assessed at puberty (Pub, PND 35) and post-puberty (Post-pub, PND 56).
- https://doi.org/10.7554/eLife.15106.009
Figure 2
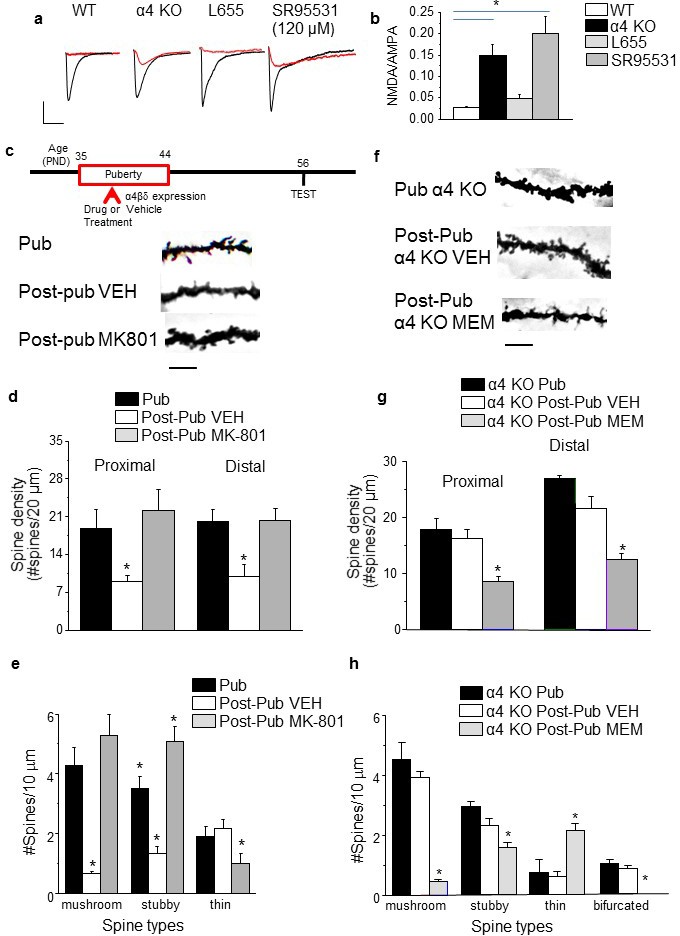
NMDA receptors maintain spines during puberty.
(a) Representative EPSCs (black) and NMDA EPSCs (red) recorded during puberty in WT or α4 KO hippocampus, in some cases during α5 (50 nM L655) or total (120 μM SR95531) GABAR blockade. In all other cases, 200 nM SR95531 was bath applied block synaptic GABARs (Stell and Mody, 2002). Scale, 150 pA, 15 ms. (b) Averaged NMDA/AMPA ratios; ANOVA, F(3,31)=20.21, p=0.0001*, power=1; n=8–10 cells (mice)/group. (Figure 2—source data 1) *p<0.05 vs. WT. (c) Inset, Drug treatment during puberty (PND 35–44) was tested for its effect on post-pubertal spine density (PND 56). Z-stack images, pub and post-pub hippocampus, showing the effects of pubertal vehicle or MK-801 treatment, at a dose shown to increase NMDAR expression (Gao and Tamminga, 1995). Scale, 6 μm. (d) Averaged spine density. Proximal (left): ANOVA, F(2,32)=54.16, p<0.0001*, power=1, n= 11–12 neurons (5 mice)/group; Distal (right)l: ANOVA, F(2,32)=460.1, p<0.0001*, power=1; n=11–12 neurons (5 mice)/group. (Figure 2—source data 2) *p<0.05 vs. other groups. (e) Quantification of spine types. Mushroom, ANOVA, F(2,33)=24.7, p<0.0001*; Stubby, ANOVA, F(2,33)=25.4, p<0.0001*; Thin, ANOVA, F(2,33)=7.66, P=0.002*; power=0.9–1; n=12 neurons (6 mice) /group. *p<0.05 vs. other groups. (Figure 2—source data 3) (f) Z-stack images, pub and post-pub hippocampus, showing the effects of pubertal vehicle or memantine (MEM) treatment, a NMDAR blocker which does not alter NMDAR expression (Cole et al., 2013). Scale, 6 μm. (g) Averaged spine density. *Proximal: ANOVA, F(2,54)=64.12, p<0.0001*, power=1, n=17–20 neurons (4–5 mice) /group; Distal: ANOVA, F(2,56)=33.2, p<0.0001*, power=1, n=19–20 neurons (4–5 mice) /group. (Figure 2—source data 4) *p<0.05 vs. other groups. (h) Quantification of spine types. Mushroom, ANOVA, F(2,45)=89.9, p<0.0001*; Stubby, ANOVA, F(2,45)=9.4, P=0.0004*; Thin, ANOVA, F(2,45)=13.7, P=0.0001*; Bifurcated, ANOVA, F(2,45)=17.7, p<0.0001*; power=1, n=16 neurons (4–5 mice)/group. (Figure 2—source data 5) *p<0.05 vs. other groups.
-
Figure 2— source data 1
Figure 2b: NMDA EPSC/ AMPA EPSC ratios recorded from CA1 hippocampal pyramidal cells using whole cell patch clamp techniques for post-pubertal WT (a), α4 KO mice (b), WT hippocampus with SR95531 (c) and WT hippocampus with L-655,708 (L655) (d).
- https://doi.org/10.7554/eLife.15106.013
-
Figure 2—source data 2
Figure 2d: Spine counts/20 μm on dendrites of CA1 hippocampal pyramidal cells – proximal (left) and distal (right) for pubertal (Pub), Post-pubertal (Post-pub) – vehicle (VEH), and Post-pub MK-801 (treated with MK-801 during the pubertal period).
- https://doi.org/10.7554/eLife.15106.014
-
Figure 2—source data 3
Figure 2e: Spine counts/10 μm for different spine-types on dendrites of CA1 hippocampal pyramidal cells for Figure 1c for Pub, Post-pub vehicle (VEH) and Post-pub MK-801 (treated with MK-801during the pubertal period).
Spines were identified as: mushroom, stubby, or thin.
- https://doi.org/10.7554/eLife.15106.015
-
Figure 2—source data 4
Figure 2g: Spine counts/20 μm on dendrites of CA1 hippocampal pyramidal cells – proximal (left) and distal (right) for α4 KO: pubertal (Pub), Post-pubertal (Post-pub) – vehicle (VEH), and Post-pub memantine (treated with memantine during the pubertal period).
- https://doi.org/10.7554/eLife.15106.016
-
Figure 2—source data 5
Figure 2h: Spine counts/10 μm for different spine-types on dendrites of CA1 hippocampal pyramidal cells for Figure 1c for α4 KO: Pub, Post-pub vehicle (VEH) and Post-pub memantine (treated with memantine during the pubertal period).
Spines were identified as: mushroom, stubby, thin or bifurcated (Bif).
- https://doi.org/10.7554/eLife.15106.017
Figure 3 with 1 supplement
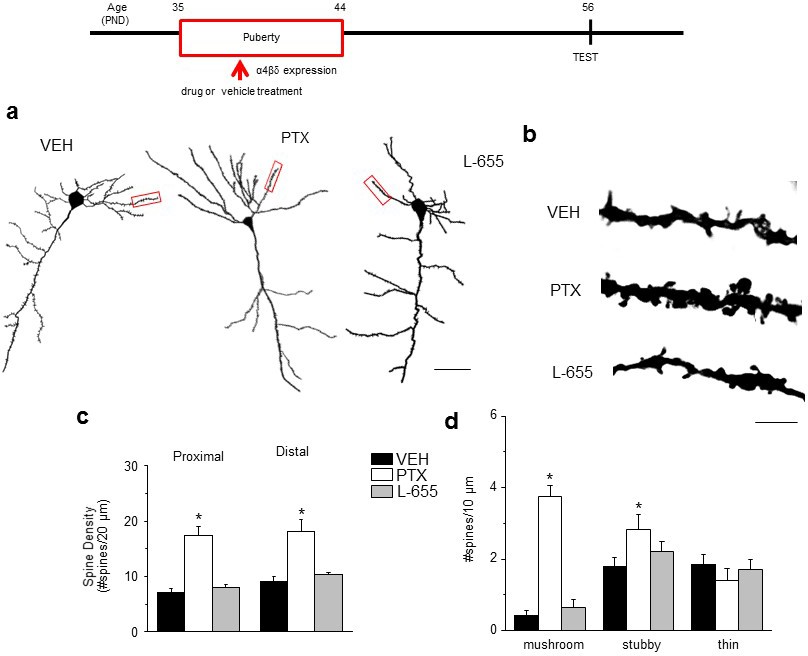
Effect of GABAR blockade on spine density in the post-pubertal hippocampus.
Inset, Drug treatment during puberty (PND 35–44) was tested for its effect on post-pubertal spine density (PND 56). Drugs: PTX, picrotoxin, a GABAR antagonist; L655, L-655,708, an inverse agonist at α5-GABAR; VEH, vehicle (oil). (a) Neurolucida images, post-Pub CA1 pyramidal cells, following pubertal drug treatment; scale, 50 µm. (b) z-stack (100x) images; scale, 10 µm. (c) Spine density, Proximal (left): ANOVA, F(2,30)=45.5, p<0.0001*, power=1; Distal (right): ANOVA, F(2,30)=60.8, p<0.0001*, power=1; n=11 neurons (6 mice)/group. (Figure 3—source data 1) *p<0.05 vs. other groups. (d) Spine morphology changes. Mushroom, ANOVA, F(2,45)=104.2, p<0.0001*; Stubby, ANOVA, F(2,45)=4.78, p=0.013*; Thin, ANOVA, F(2,45)=1.37, P=0.27; power=0.8–1, n=16 neurons (6 mice)/group. (Figure 3—source data 1) *p<0.05 vs. other groups. Lorazepam effects on spine density are depicted in Figure 3—figure supplement 1.
-
Figure 3—source data 1
Figure 3c: Spine counts/20 μm on dendrites of CA1 hippocampal pyramidal cells – proximal (left) and distal (right) for Post-pubertal (Post-pub) mice treated with L-655,708 (L655, left), vehicle (VEH, middle) or picrotoxin (Picro, right), during the pubertal period.
- https://doi.org/10.7554/eLife.15106.019
-
Figure 3—source data 2
Figure 3d: Spine counts/10 μm for different spine-types on dendrites of CA1 hippocampal pyramidal cells for Post-pubertal (Post-pub) mice treated with L-655,708 (L655, left), vehicle (VEH, middle) or picrotoxin (Picro, right), during the pubertal period. Spines were identified as: mushroom, stubby, or thin.
- https://doi.org/10.7554/eLife.15106.020
Figure 3—figure supplement 1
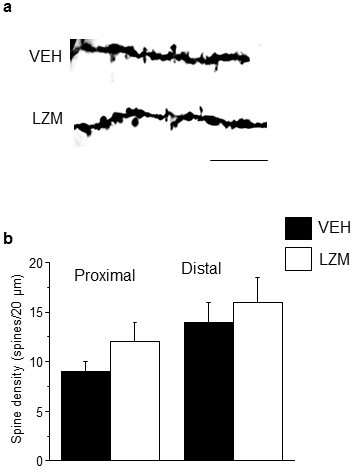
Pubertal lorazepam treatment does not alter spine density in post-pubertal mice.
(a) Representative z-stack images; (b) Averaged spine densities for proximal (left) and distal (right) dendrites of post-pubertal female mice treated during the pubertal period with the positive GABA modulator lorazepam, which targets non-α4 GABARs of the α[1–3,5]βγs sub-type. Proximal: t(23)=1.02, p=0.32; Distal: t(20)=0.28, p=0.78; Scale, 20 μm; n=11–13 neurons (5 mice)/group. (Figure 3—figure supplement 1—source data 1)
-
Figure 3—figure supplement 1—source data 1
Spine counts/20 μm on dendrites of CA1 hippocampal pyramidal cells – proximal (left) and distal (right) for post-pubertal mice treated with MK-801 during the pubertal period.
- https://doi.org/10.7554/eLife.15106.022
Figure 4 with 1 supplement
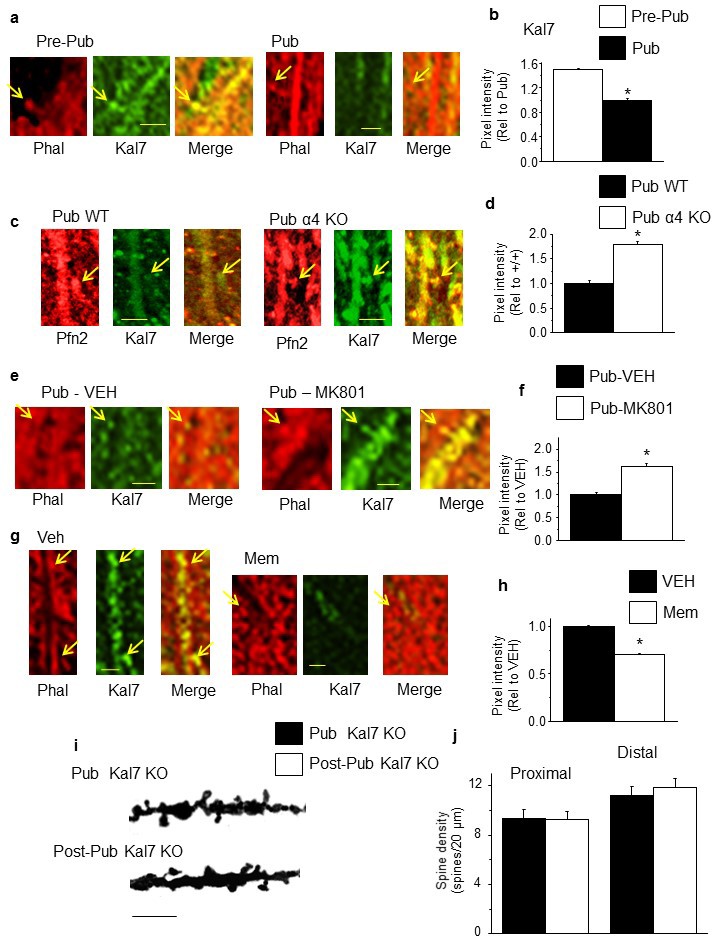
NMDA receptor-dependent Kalirin-7 expression decreases at puberty.
(a,c,e,g) Representative images, scale, 2.5 μm. Arrows, spines. (a) Phalloidin (Phal), Kalirin-7 (Kal7) and merged images from pre-pub and pub CA1 hippocampus. (b) Mean pixel intensity, *t-test, t(26)=29.2, p<0.0001*, power=1; n=14 neurons (6 mice)/group. (c) Pfn2, Kal7 and merged images from pub WT and α4 KO CA1. (d) Mean pixel intensity, *t-test, t(26)=12.0, p<0.0001*, power=1; n=14 neurons (4 mice)/group. (e) Phal, Kal7 and merged images from pub CA1 hippocampus following in vivo treatment with vehicle or MK801 to increase NMDAR expression (Gao and Tamminga, 1995). (f) Mean pixel intensity, *t-test, t(26)=6.25, p<0.0001*, power=1; n=14 neurons (5 mice)/group. (g) Phal, Kal7 and merged images from post-pub CA1 hippocampus following in vivo treatment with vehicle or memantine (MEM), an NMDAR blocker. (h) Mean pixel intensity, *t-test, t(26)=6.5, p<0.0001*, power=1; n=14 neurons (5 mice)/group. Original uncropped images of Kal7 immunohistochemistry are shown in Figure 4—figure supplement 1. (Figure 4—source data 1) (i) Representative z-stack images, Pub, post-Pub Kal7 KO. Scale, 10 μm. (j) Averaged data, spine density. Proximal: t(32)=0.06, p=0.95, n=17 neurons (6 mice)/group; Distal: t(32)=0, p=1, n=17 neurons (6 mice)/group. (Figure 4—source data 2)
-
Figure 4—source data 1
Figure 4b,d,f,h: Measurements of Kalirin-7 (Kal7) luminescence taken from CA1 hippocampal pyramidal cells for Pre-pub and Pub WT (4b), Pub, WT and α4 KO (4d), Pub WT-treated with MK-801 or vehicle (VEH) (4f) and Post-pub WT-treated with memantine or VEH (4h).
- https://doi.org/10.7554/eLife.15106.024
-
Figure 4—source data 2
Figure 4j: Spine counts/20 μm on dendrites of CA1 hippocampal pyramidal cells – proximal (left) and distal (right) for pubertal (Pub) and post-pubertal (Post-pub) Kal7 KO mice.
- https://doi.org/10.7554/eLife.15106.025
Figure 4—figure supplement 1

Kalirin-7 expression varies across pubertal stage, α4 genotype and level of pubertal NMDAR expression.
Representative images of Kalirin-7 (Kal7) expression in CA1 hippocampus across pubertal stage (a), in pubertal WT and α4 KO hippocampus (b), following pubertal treatment with vehicle or MK-801 to increase NR1 expression (Aoki et al., 2012) (c) or following post-pubertal treatment with vehicle or memantine to block NMDARs (d). Scale, 10 μm. (Averaged data of pixel intensity included in Figure 3).
Figure 5 with 2 supplements
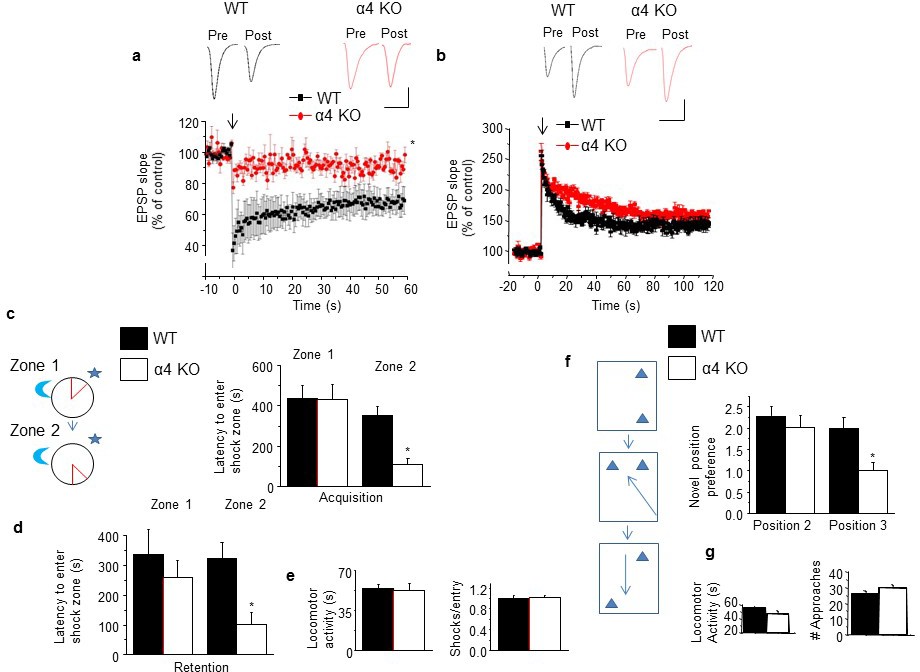
Induction of long-term depression and re-learning are impaired under conditions of high spine density in the α4 KO mouse.
(a) Induction of long-term depression (LTD) using low frequency stimulation (arrow). WT, black, α4 KO, red. *t-test, t(6)=3.56, p=0.01, power=0.84; n=4/group. (Figure 5—source data 1) Inset, representative field EPSPs. Scale, 0.2 mV, 20 ms. (b) Induction of long-term potentiation (LTP) using theta burst stimulation (arrow). WT, black, α4 KO, red. t-test, t(7)=0.28, p=0.78; n=4–5/group. (Figure 5—source data 2) Inset, representative field EPSPs. Scale, 0.2 mV, 25 ms. (c) [Inset, The active place avoidance task (APA). The animal is trained to avoid a shock zone (red) on a rotating arena. Day 1, training for zone 1; day 2, training for zone 2.] Average latency to enter shock zone 1 (Z1) and 2 (Z2), Acquisition. *t-test, Zone 1, t(9)=0.02, p=0.99; Zone 2, t(10)=3.37, p=0.007*, power=0.86; n=5–7 mice. (d) Average latency to enter shock zone 1 (Z1) and 2 (Z2), Retention. * t-test, Zone 1, t(9)=1.17, p=0.27; Zone 2, t(10)=3.08, p=0.012*, power=0.80; n=5–7 mice. (Figure 5—source data 3) (e) Locomotor activity (left, t test, t(10)=0.67, p=0.52) and # shocks/entry, a measure of escape behavior (right, t test, t(10)=0.08, p=0.93). n=5–7 mice/group. (Figure 5—source data 4) (f) Inset, the multiple placement object recognition task (MPORT). Sequence of positions (1–3) of object 2 across 3 training trials. Novel position preference for positions 2 and 3. Position 2, *t-test, t(23)=0.85, p=0.40; Position 3, t(23)=4.61, p<0.0001*, power=1; WT, n=15 mice; α4 KO, n=10 mice. (Figure 5—source data 5) (g) Locomotor activity (left, t-test, t(23)=0.34, p=0.74; WT, n=15 mice; α4 KO, n=10 mice) and # approaches, a measure of object interest (right, t t-test, t(23)=0.97, p=0.339; WT, n=15 mice; α4 KO, n=10 mice) (Figure 5—source data 6). Effects on MK-801 and memantine on learning and re-learning are depicted in Figure 5—figure supplement 1. Picrotoxin effects on learning and re-learning are depicted in Figure 5—figure supplement 2.
-
Figure 5—source data 1
Figure 5a: Percent baseline slope of field EPSPs recorded after low frequency (1 Hz) stimulation to induce LTD for post-pubertal WT and α4 KO CA1 hippocampus (120 min, 30 s intervals).
Each column is a separate slice recording.
- https://doi.org/10.7554/eLife.15106.028
-
Figure 5—source data 2
Figure 5b: Left, Percent baseline slope of field EPSPs recorded after theta burst stimulation to induce LTP for post-pubertal WT and α4 KO CA1 hippocampus (final 20 min 100 min after LTP induction, 30 s intervals).
Each column is a separate slice recording. Right, Averaged values for the final 20 min. segment.
- https://doi.org/10.7554/eLife.15106.029
-
Figure 5—source data 3
Figure 5c: Learning acquisition (left) and retention (right) for zone 1 of the active place avoidance task (APA).
Latency to enter shock zone (s) for post-pub WT and α4 KO mice. Figure 5d, Re-learning acquisition (left) and retention (right) for zone 2 of the APA. Latency to enter shock zone (s) for post-pub WT and α4 KO mice.
- https://doi.org/10.7554/eLife.15106.030
-
Figure 5—source data 4
Figure 5e: #shocks/entry (left) and locomotor activity (right) for post-pub WT and α4 KO mice assessed for the active place avoidance task (APA).
- https://doi.org/10.7554/eLife.15106.031
-
Figure 5—source data 5
Figure 5f: Learning acquisition for zones 1–3 for post-pub WT (left) and α4 KO (right) of the multiple placement object relocation task (MPORT).
Duration of time spent, M, moved object; unm, unmoved object; m/unm, ratio of time spent moved versus unmoved object.
- https://doi.org/10.7554/eLife.15106.032
-
Figure 5—source data 6
Figure 5g: Locomotor activity (left) and # approached, a measure of interest (right) for for post-pub WT (left) and α4 KO (right) mice using MPORT.
- https://doi.org/10.7554/eLife.15106.033
Figure 5—figure supplement 1

NMDAR antagonist treatment alters behavioral flexibility.
Treatment with MK-801 or memantine during puberty, to increase NR1-NMDAR expression or decrease NMDAR activity (Gao and Tamminga, 1995; Cole et al., 2013), respectively, produces opposite effects on behavioral flexibility tested using MPORT post-pubertally. (a) Post-pubertal increases in spine density produced by pubertal treatment with MK-801 resulted in a decrease in position preference for trial 3 of MPORT, reflecting a reduced ability to re-learn object position. Position 2: student’s unpaired t-test, t(12)=0.07, p=0.95; Position 3, t(12)=2.47, p=0.03*, power=0.92 (n=7/group) *p<0.05 vs. Veh. (Figure 5—figure supplement 1—source data 1) (b) Post-pubertal decreases in spine density produced by pubertal treatment of α4 KO mice with the NMDAR antagonist memantine resulted in an increase in position preference for trial 3 of MPORT, reflecting an increased ability to re-learn object position. Position 2: student’s unpaired t-test, t(12)=0.54, p=0.60; Position 3, t(12)=4.32, p=0.0005*, power=0.99 (n=8/group) *p<0.05 vs. Veh. (Figure 5—figure supplement 1—source data 2)
-
Figure 5—figure supplement 1—source data 1
Learning acquisition for positions (Pos) 2 and 3 for the multiple placement object relocation task (MPORT).
Ratio of time spent for the moved versus unmoved object for post-pubertal mice treated with MK-801 during the pubertal period.
- https://doi.org/10.7554/eLife.15106.035
-
Figure 5—figure supplement 1—source data 2
Learning acquisition for positions (Pos) 2 and 3 for the multiple placement object relocation task (MPORT).
Ratio of time spent for the moved versus unmoved object for post-pubertal α4 KO mice treated with memantine during the pubertal period.
- https://doi.org/10.7554/eLife.15106.036
Figure 5—figure supplement 2
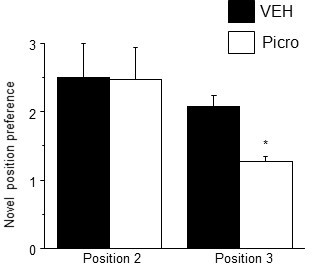
Pubertal GABAR antagonist treatment impairs behavioral flexibility post-pubertally.
Mice were treated with picrotoxin (Picro, 3 mg/kg, i.p.), to block GABARs, or vehicle during puberty (PND 35–44) and tested on PND 56 using MPORT. Post-pubertal increases in spine density produced by pubertal treatment with Picro resulted in a decrease in position preference for trial 3 of MPORT, reflecting a reduced ability to re-learn object position. However, initial learning (position 2) was not impaired compared to vehicle-treated animals. Position 2: student’s unpaired t-test, t(10)=1.24, p=0.24; Position 3, t(10)=3.6, p=0.0024*, power=0.96; n=6/group *p<0.05 vs. Veh. (Figure 5—figure supplement 2—source data 1Source data 1)
-
Figure 5—figure supplement 2—source data 1
Learning acquisition for positions (Pos)1–3 for the multiple placement object relocation task (MPORT).
Ratio of time spent for the moved versus unmoved object for post-pubertal mice treated with picrotoxin during the pubertal period.
- https://doi.org/10.7554/eLife.15106.038
Figure 6
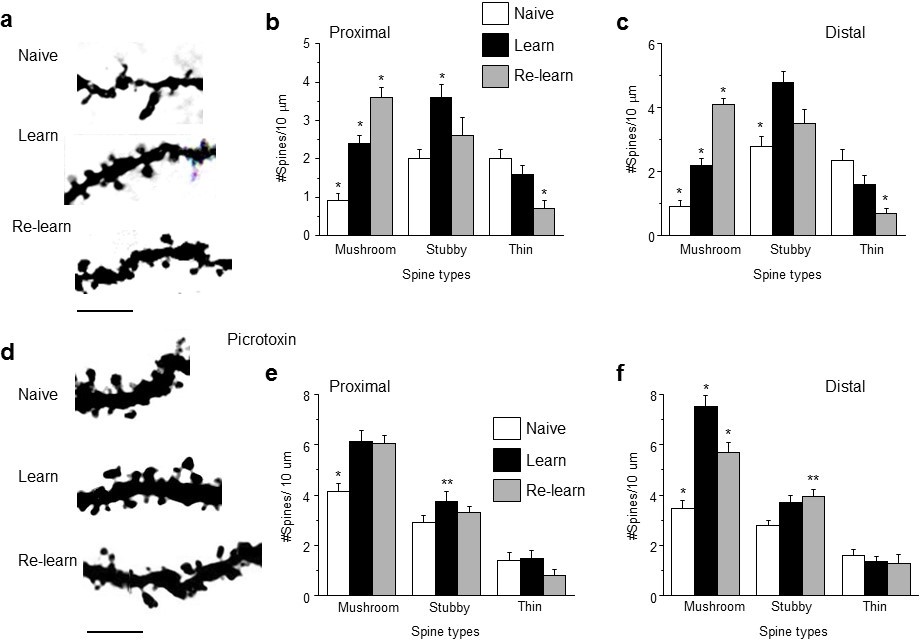
Learning and re-learning increase mushroom-type dendritic spines in CA1 hippocampus following adolescent synaptic pruning.
(a) Representative z-stack images from CA1 hippocampal pyramidal cells illustrating changes in spine type and number after hippocampal-dependent learning and re-learning, compared to naïve conditions. Scale, 5 μm. (b, c) Means ± S.E.M. for proximal and distal dendrites. Proximal, Mushroom, ANOVA, F(2,39)=44.9, p<0.0001*, power=1; Stubby, ANOVA, F(2,39)=6.0, p=0.005*. power=0.86; Thin, ANOVA, F(2,39)=7.24, p=0.004*; power=0.97, n=14 neurons (5 mice)/group. *p<0.05 vs. other groups. Distal, Mushroom, ANOVA, F(2,39)=84.1, p<0.0001*, power=1; Stubby, ANOVA, F(2,39)=13.7, p<0.0001*, power=1; Thin, ANOVA, F(2,39)=13, p<0.0001*; power=1, n=14 neurons (4–6 mice)/group. *p<0.05 vs. other groups. **p<0.05 vs. naïve. (Figure 6—source data 1) (d) Representative z-stack images from hippocampus of adult mice treated during the pubertal period with 3 mg/kg picrotoxin (Figure 3) to prevent synaptic pruning. Changes in spine type and number are evident after hippocampal-dependent learning and re-learning, compared to naïve conditions. Scale, 5 μm. (e,f) Means ± S.E.M. for proximal and distal dendrites. Proximal, Mushroom, ANOVA, F(2,39)=12.6, p<0.0001*, power=0.99; Stubby, ANOVA, F(2,39)=3.78, p=0.03*. power=0.86; Thin, ANOVA, F(2,39)=0.87, p=0.43, n=14 neurons (5 mice)/group. *p<0.05 vs. other groups. **p<0.05 vs. naïve. Distal, Mushroom, ANOVA, F(2,39)=33.1, p<0.0001*, power=1; Stubby, ANOVA, F(2,39)=3.87, p<0.029*, power=1; Thin, ANOVA, F(2,39)=0.42, p=0.66, n=14 neurons (5 mice)/group. *p<0.05 vs. other groups. **p<0.05 vs. naïve. (Figure 6—source data 2)
-
Figure 6—source data 1
Figure 6b: (proximal), 6c (distal), Spine counts/10 μm for different spine-types on dendrites of CA1 hippocampal pyramidal cells assessed 1–2 hr after learning, re-learning or naïve conditions.
Spines were identified as: mushroom, stubby, or thin.
- https://doi.org/10.7554/eLife.15106.040
-
Figure 6—source data 2
Figure 6e: (proximal), 6f (distal), Spine counts/10 μm for different spine-types on dendrites of CA1 hippocampal pyramidal cells assessed 1–2 hr after learning, re-learning or naïve conditions in mice with high spine densities (treated with picrotoxin during the pubertal period).
Spines were identified as: mushroom, stubby, or thin.
- https://doi.org/10.7554/eLife.15106.041
Tables
Table 1
Dendrite length is not altered during adolescence or after α4 knock-out. Mean ± SEM, n=4 neurons (mice)/group. Dendrite length, ANOVA, F(3,15)=0.35, p=0.80.
| Dendrite length (Mean ± SEM) | Pubertal | Post-pubertal |
|---|---|---|
| WT | 190 ± 5.8 | 205 ± 27.5 |
| α4 KO | 183.7 ± 5.5 | 195 ± 9.6 |
-
Table 1—source data 1
Dendrite length for pubertal (Pub) and post-pubertal (Post-pub) WT and α4 KO female mice.
- https://doi.org/10.7554/eLife.15106.011
Download links
A two-part list of links to download the article, or parts of the article, in various formats.
Downloads (link to download the article as PDF)
Open citations (links to open the citations from this article in various online reference manager services)
Cite this article (links to download the citations from this article in formats compatible with various reference manager tools)
Synaptic pruning in the female hippocampus is triggered at puberty by extrasynaptic GABAA receptors on dendritic spines
eLife 5:e15106.
https://doi.org/10.7554/eLife.15106


