Rewiring MAP kinases in Saccharomyces cerevisiae to regulate novel targets through ubiquitination
- University of Washington, United States
Figures
Figure 1 with 4 supplements
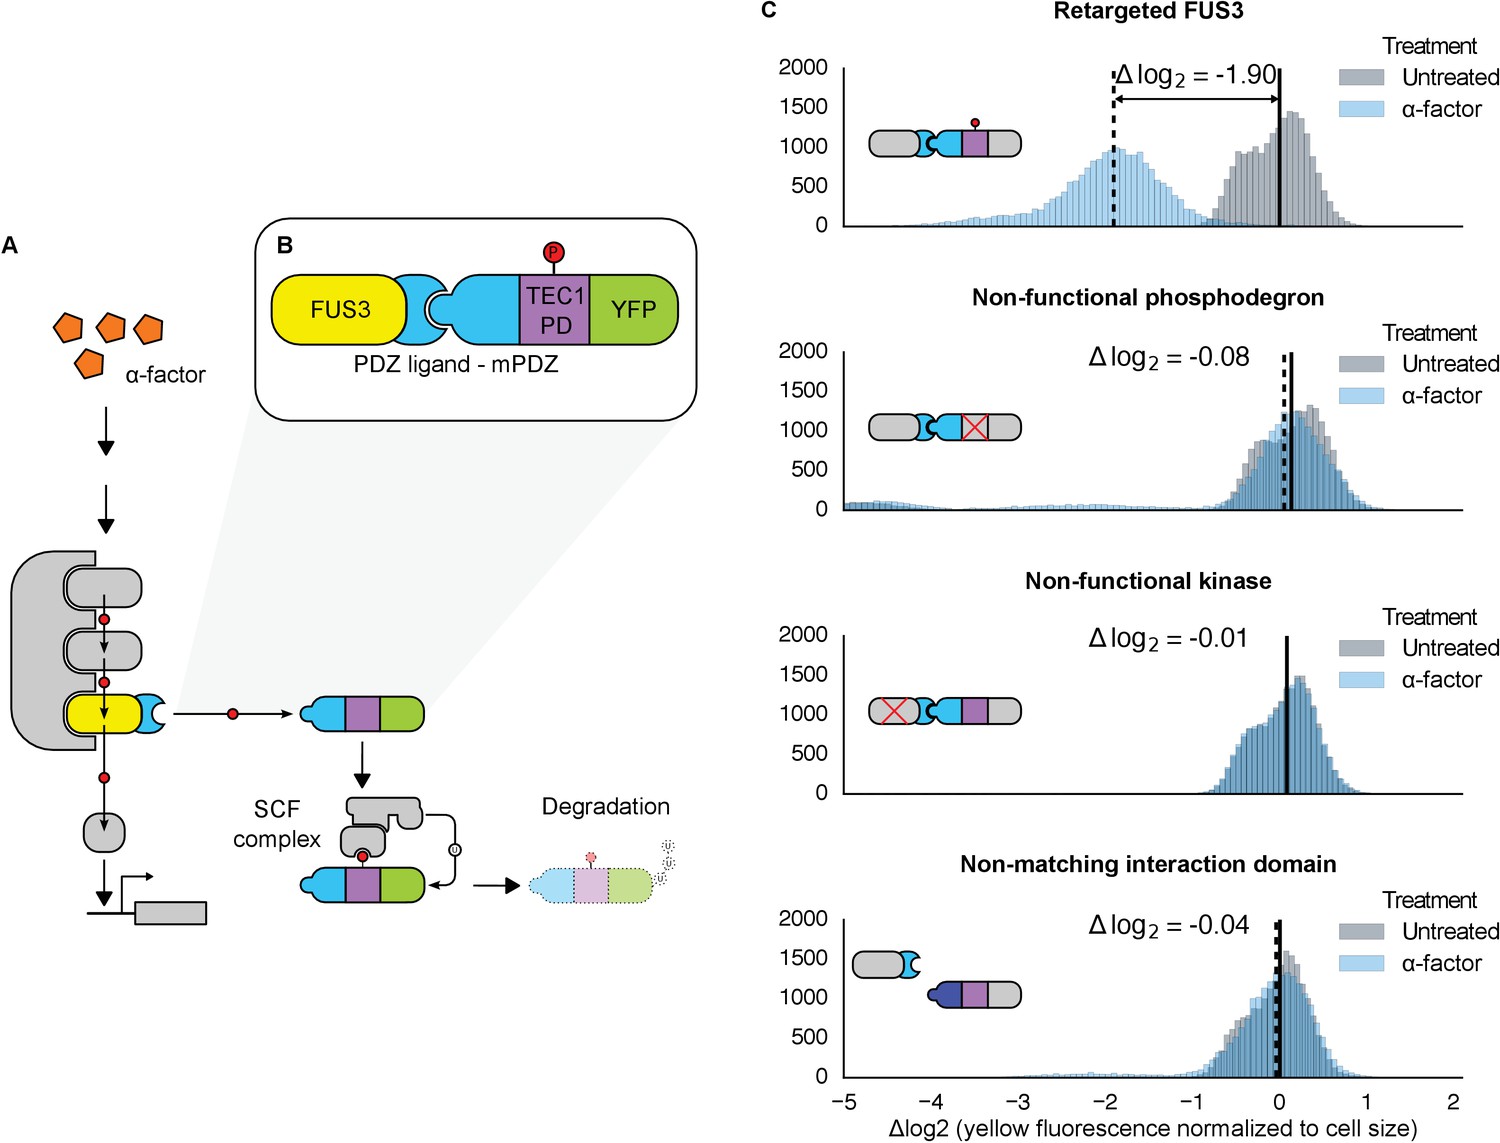
Rewiring the mating cascade MAPK, Fus3, to regulate the degradation of YFP.
(A) The core components of the yeast mating cascade. The yeast mating factor – α-factor – triggers the sequential activation of the kinases Ste11 and Ste7 (rounded gray rectangles) followed by the MAPK, Fus3 (yellow). Arrows with red circles denote phosphorylation-mediated regulation. All three kinases are organized on the scaffold Ste5 (also gray). Among other effectors, Fus3 activates the transcription factor Ste12 (rounded gray box). (B) Fus3 targeted regulation of YFP (green). The colocalization was controlled by the addition of the mPDZ domain to YFP and a PDZ ligand to Fus3 (light blue). Degradation was mediated by the addition of a phosphodegron derived from the transcription factor Tec1 (purple). Upon activation of the mating pathway, Fus3 phosphorylates the phosphodegron fused to YFP, resulting in the recruitment of an E3 ubiquitin ligase and the ubiquitination and subsequent degradation of YFP. (C) Cells bearing the modified Fus3 and either the fully functional system, a reporter construct with an inactivated phosphodegron, a Fus3 with its kinase activity knocked out or an unmatched interaction domain (an SH3 domain instead of mPDZ) were grown to log phase and induced with 10 μM α-factor (blue histograms) or un-induced (gray histograms). Data shown are from 3 hrs post-induction. The vertical dashed black lines on the histograms represent medians of treated populations and solid black lines represent medians of untreated populations. In all figures, the fluorescence has been normalized to the cell size (see Figure 1—figure supplement 1). Full time-course experiments appear in the supplement to Figure 2.
Figure 1—figure supplement 1
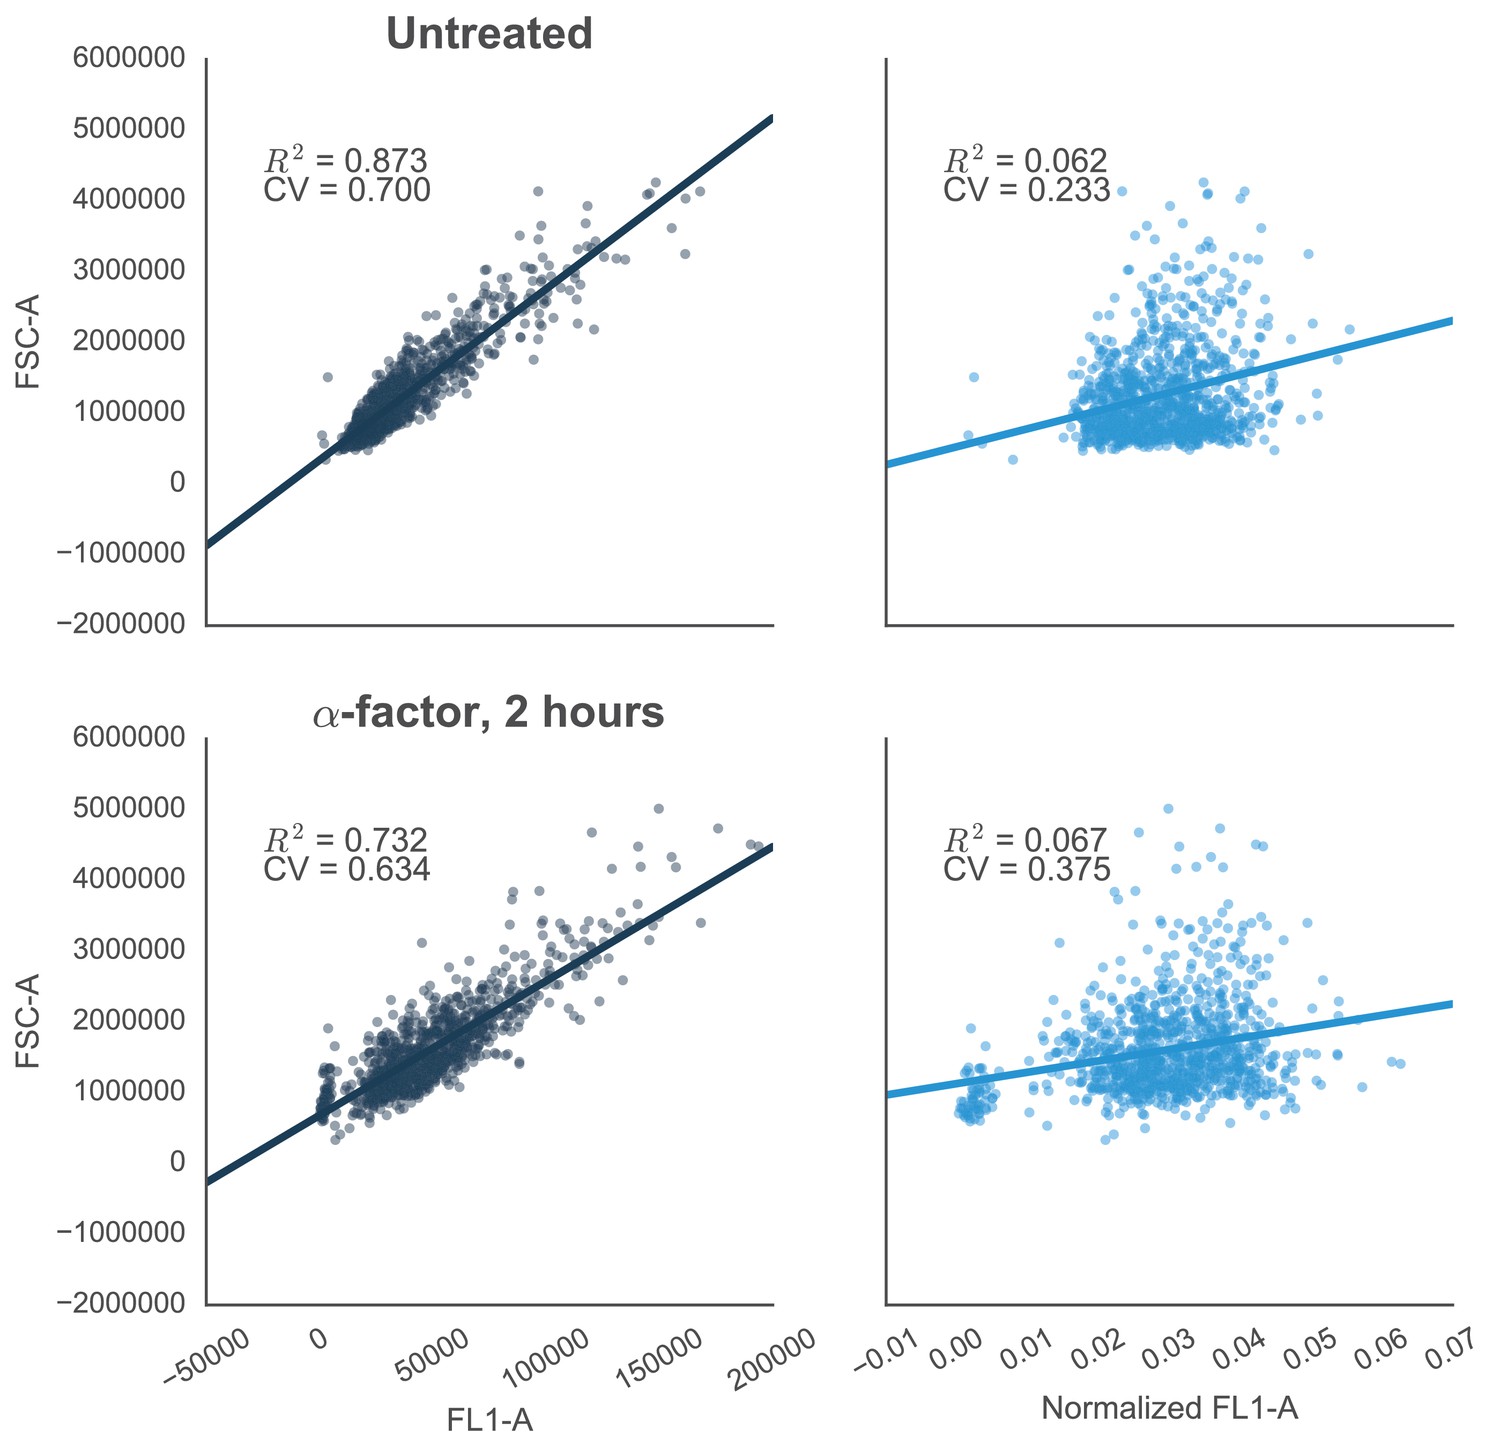
Reducing the variability of single-cell fluorescence by accounting for cell-to-cell variation in cell size.
In yeast constitutively expressing a single-copy fluorescent protein inserted in the genome, fluorescence (FL1-A) is strongly correlated with cell size (approximated by FSC-A)—shown by R2 values. This is true in both cells that are untreated (top left) or treated with 10 µM α-factor (bottom left). The effect is likely due to the way that flow cytometers measure fluorescence, where cells with the same concentration of fluorescent protein – but with different volumes – will have different levels of fluorescence. For example, smaller cells that have just divided will have a lower fluorescence value than larger cells that are just about to divide. Normalizing by cells size – dividing FL1-A by FSC-A – reduces the coefficient of variation (CV) of the fluorescent signal by ~67% or ~41% in untreated or treated cells, respectively (graphs on right).
Figure 1—figure supplement 2
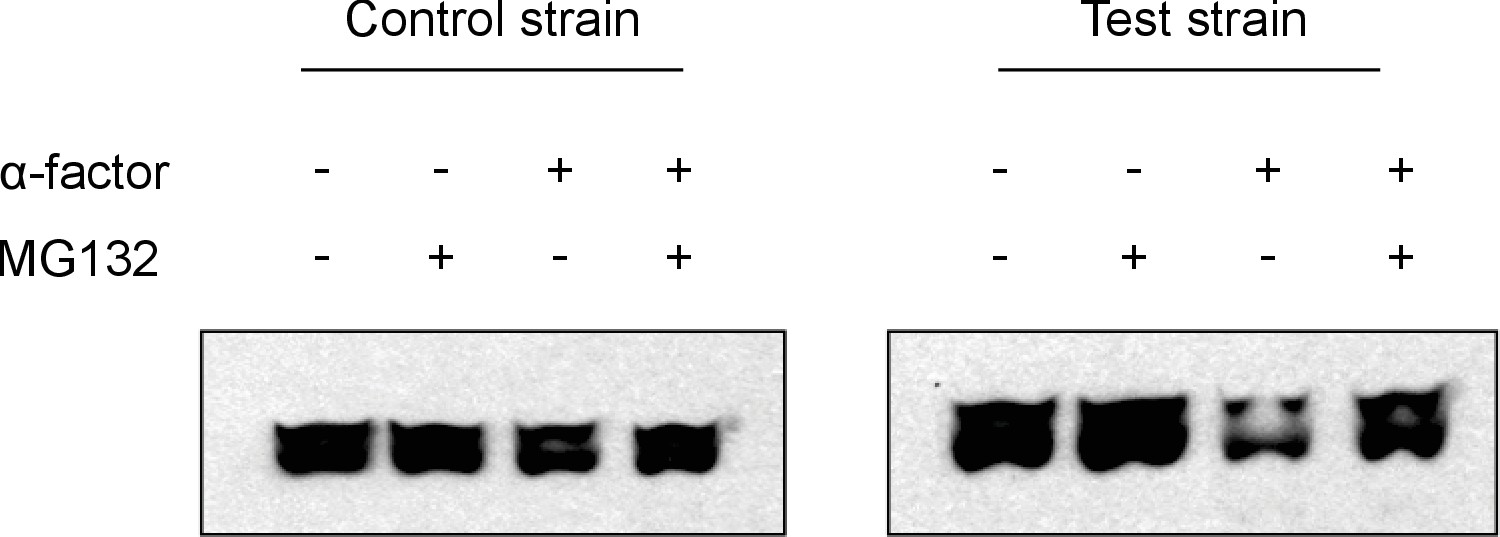
Western Analyses of degradation assays.
The representative western blots above show results from degradation assays on a test strain with the entirely functional system described in Figure 1 and a control strain that has a non-functional phosphodegron. We observe that upon treatment with α-factor, the test strain has a significantly fainter band as compared to the untreated lane, whereas the control strain does not. This is consistent with our flow cytometry observations. We also observe that when cells are treated with MG132, a proteasome inhibitor, the alpha-factor triggered degradation in the test strain is prevented, implying that the degradation we observe is indeed due to the proteasome as hypothesized.
Figure 1—figure supplement 3
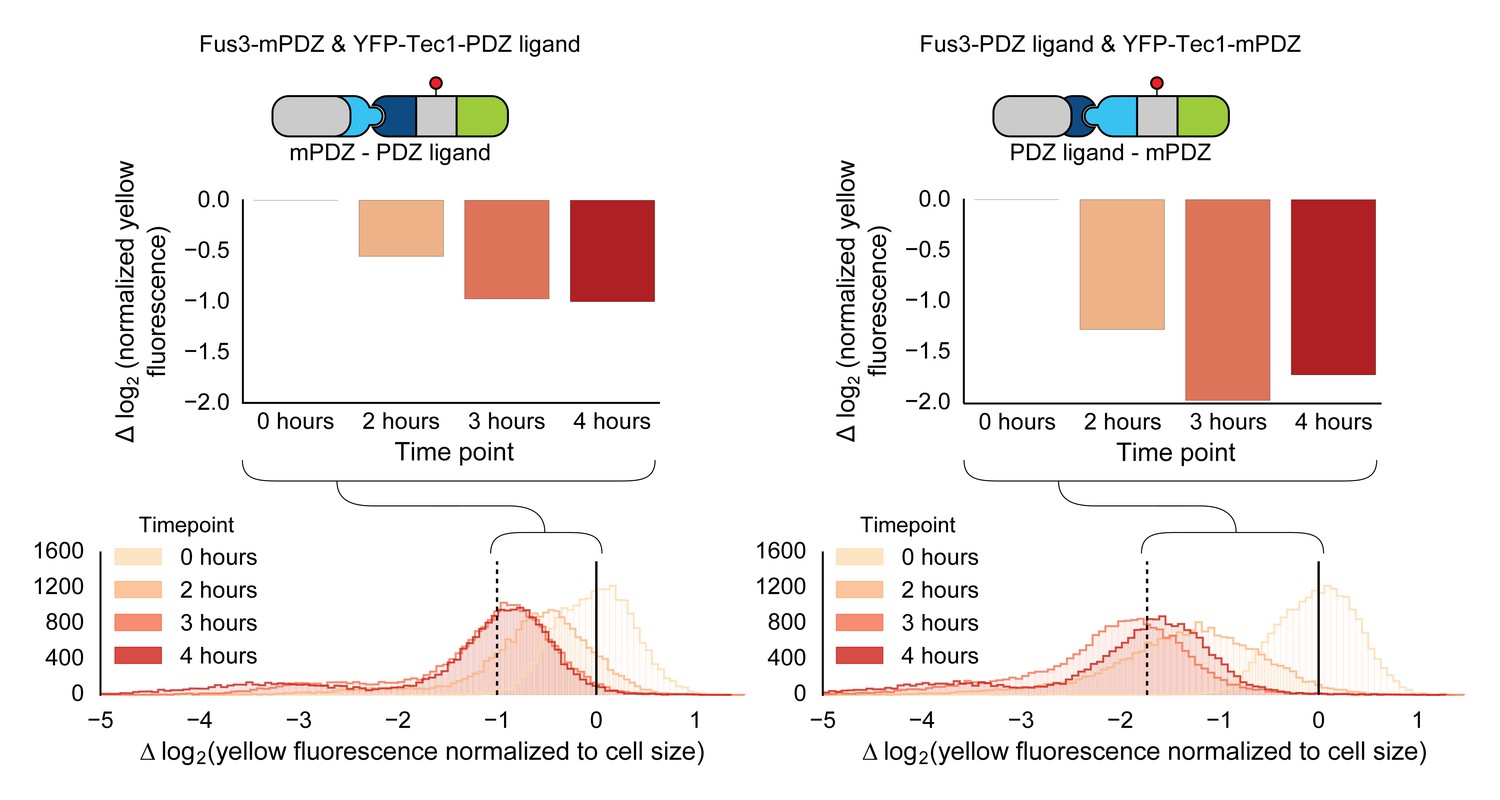
Swapping interaction domains between kinase and substrate.
Population histograms and medians of YFP fluorescence signal normalized by cell size for yeast strains that have either a Fus3 kinase fused to a PDZ ligand and YFP fused to a PDZ domain (right) or Fus3 kinase fused to a PDZ domain and YFP fused to a PDZ ligand. These strains were diluted down from saturated overnights and were grown for 5 hrs to log phase and then cytometry reads were performed after 2, 3 and 4 hrs post induction with α-factor. The dashed black lines represent the median fluorescence at 4 hrs and the solid black lines are the media fluorescence at 0 hr.
Figure 1—figure supplement 4
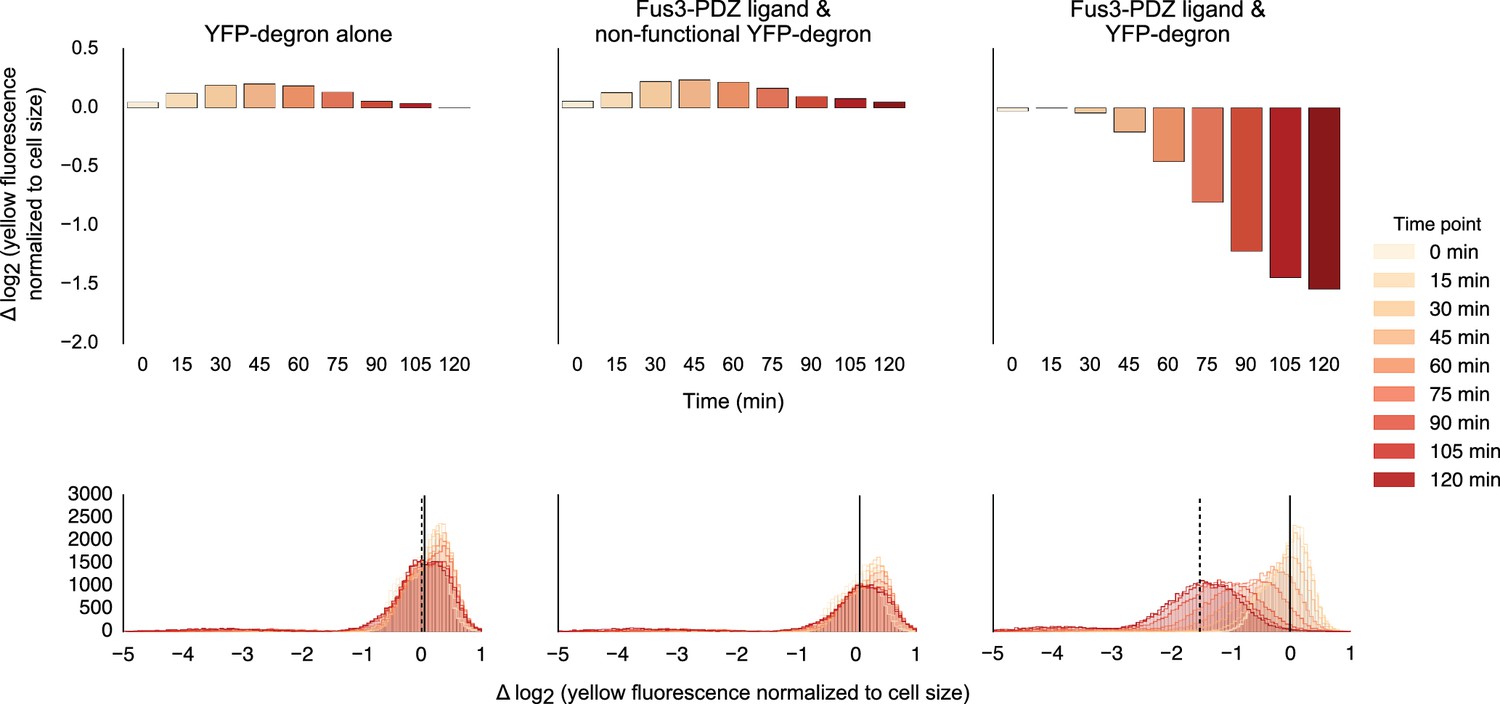
Fusing interaction domain to the native copy of the kinase.
Population histograms (bottom) and corresponding medians (top) of YFP fluorescence signal normalized by cell size for yeast strains where the native copy of the kinase is fused to a PDZ ligand. The left most panel describes a strain with just the YFP substrate, the middle one represents a strain where the endogenous copy of Fus3 had an interaction domain fused to it but the YFP substrate has a non-functional degron and the rightmost panel describes a strain that has both an interaction domain on the Fus3 and a functional degron on the YFP substrate. These strains were diluted down from saturated overnights and were grown for 5 hrs to log phase and then cytometry reads were performed at 15 min intervals post induction with α-factor.
Figure 2 with 1 supplement
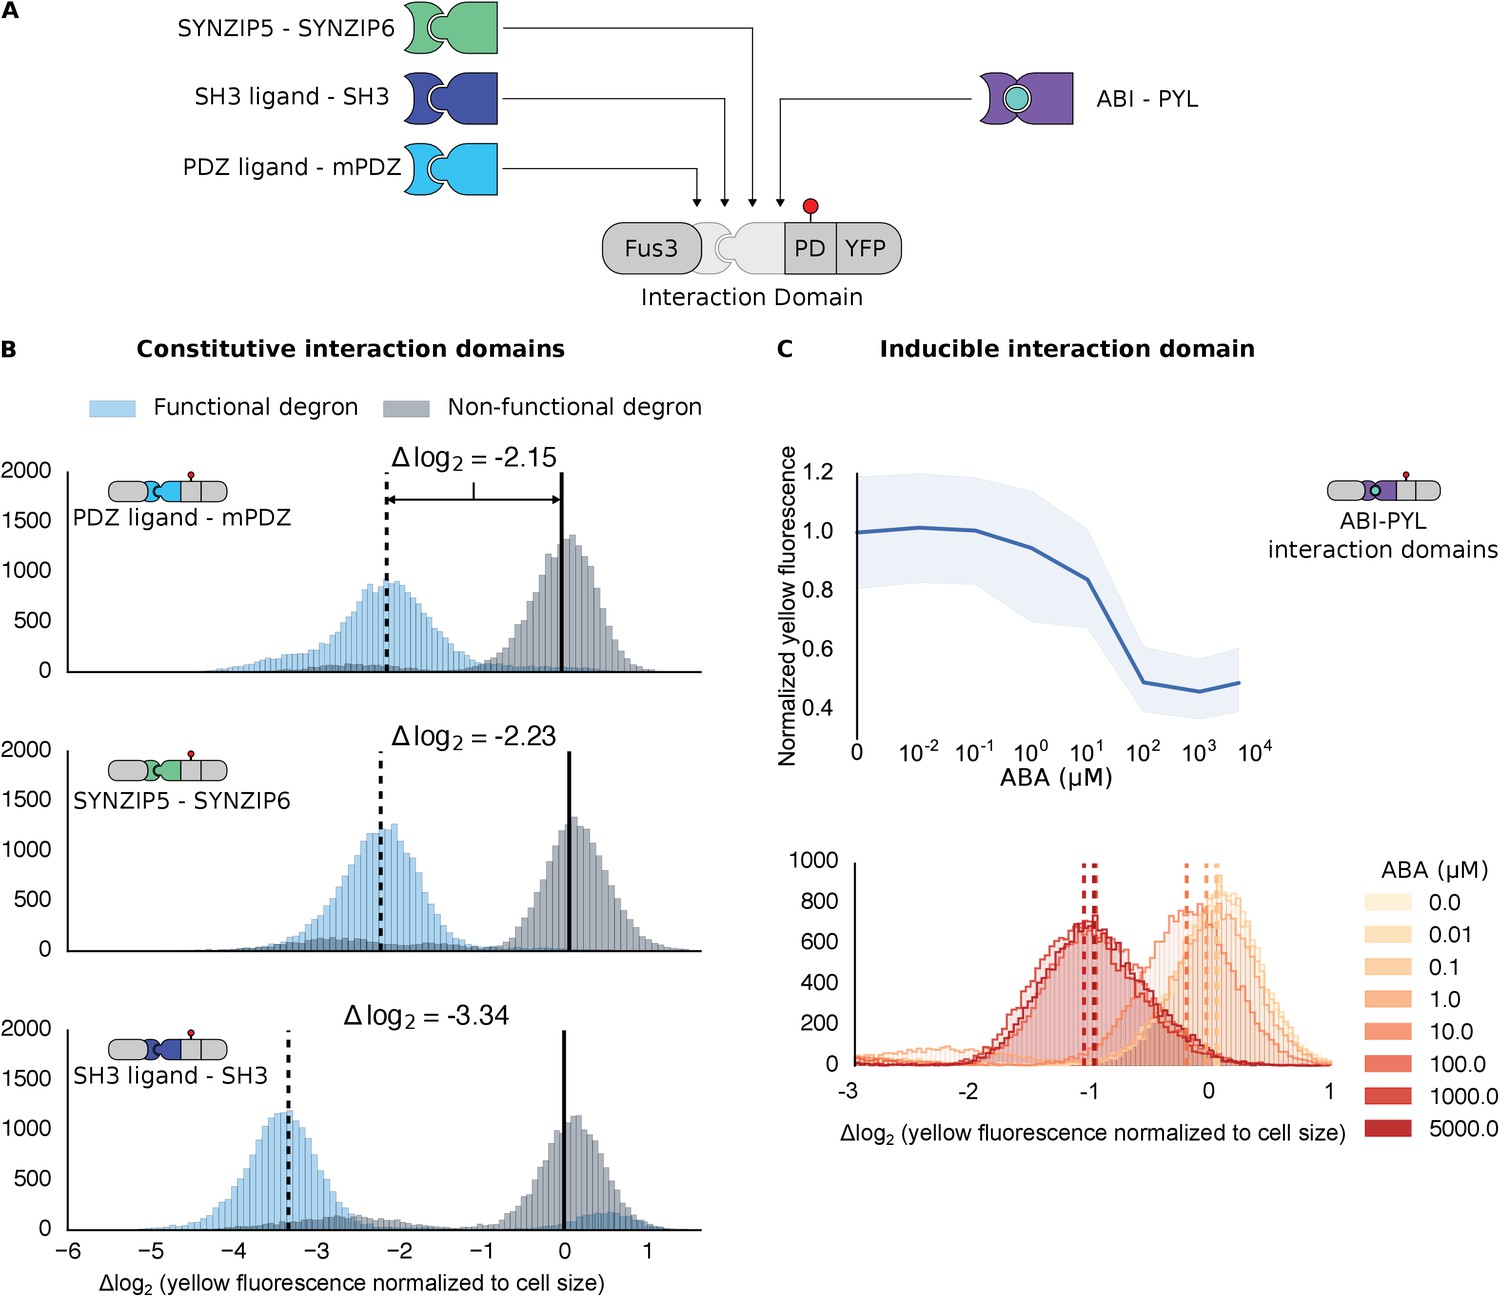
Demonstrating the flexibility and scalability of the system by varying interaction domains.
(A) Variants of the different complementary interaction domains used. The constitutive interaction domains mPDZ, SH3 and SYNZIP are shown on the left; the ABA inducible ABI-PYL interaction domains appear on the right. (B) Comparison of YFP signal normalized by cell size from constructs bearing the indicated interaction domains along with either a functional (blue histograms) or non-functional (gray histograms) phosphodegron in yeast treated with 10 μM α-factor as in Figure 1C. The vertical dashed black lines on the histograms represent the medians of the populations with functional degrons whereas the solid black lines represent the median of the populations with non-functional degrons. (C) Median fluorescence – shaded regions cover the interquartile range – and population histograms of the YFP signal normalized to cell size from cells expressing the ABA inducible ABI-PYL interaction domains fused to Fus3 and YFP, respectively for a range of ABA concentrations. The raw time-course data corresponding to these endpoint observations can be found in Figure 2—figure supplement 1.
Figure 2—figure supplement 1
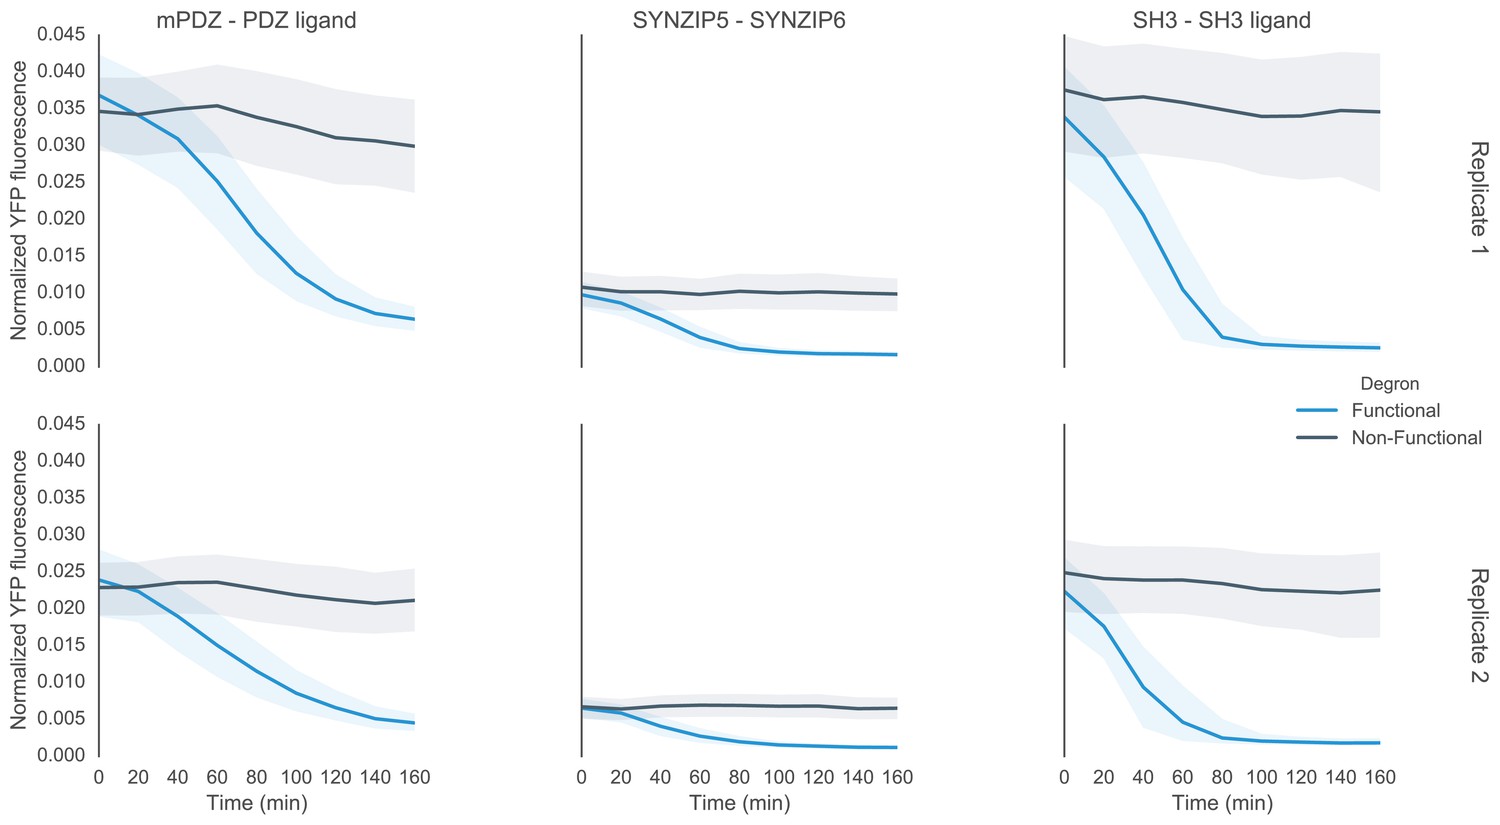
Time course characterization of different interaction domain variants post induction with α-factor.
In this plot each subplot is labeled with the name of the interaction domain pair that was used to target the MAPK Fus3 to degrade a YFP reporter in the yeast strain. These yeast strains were grown up to log phase from saturated cultures for 5 hrs and then induced with 10 μM α-factor at time 0 to activate the kinase. The dashed lines are uninduced controls. In the case of the ABI-PYL strain two additional induction conditions were assayed, namely with ABA (100 μM) and with ABA and α-factor. For these cultures the medium used to grow the yeast up to log phase had ABA in it. The fluorescence of these cultures was then assayed at regular intervals using flow cytometry. Raw data for two replicates performed on different days under identical conditions is shown.
Figure 3 with 2 supplements
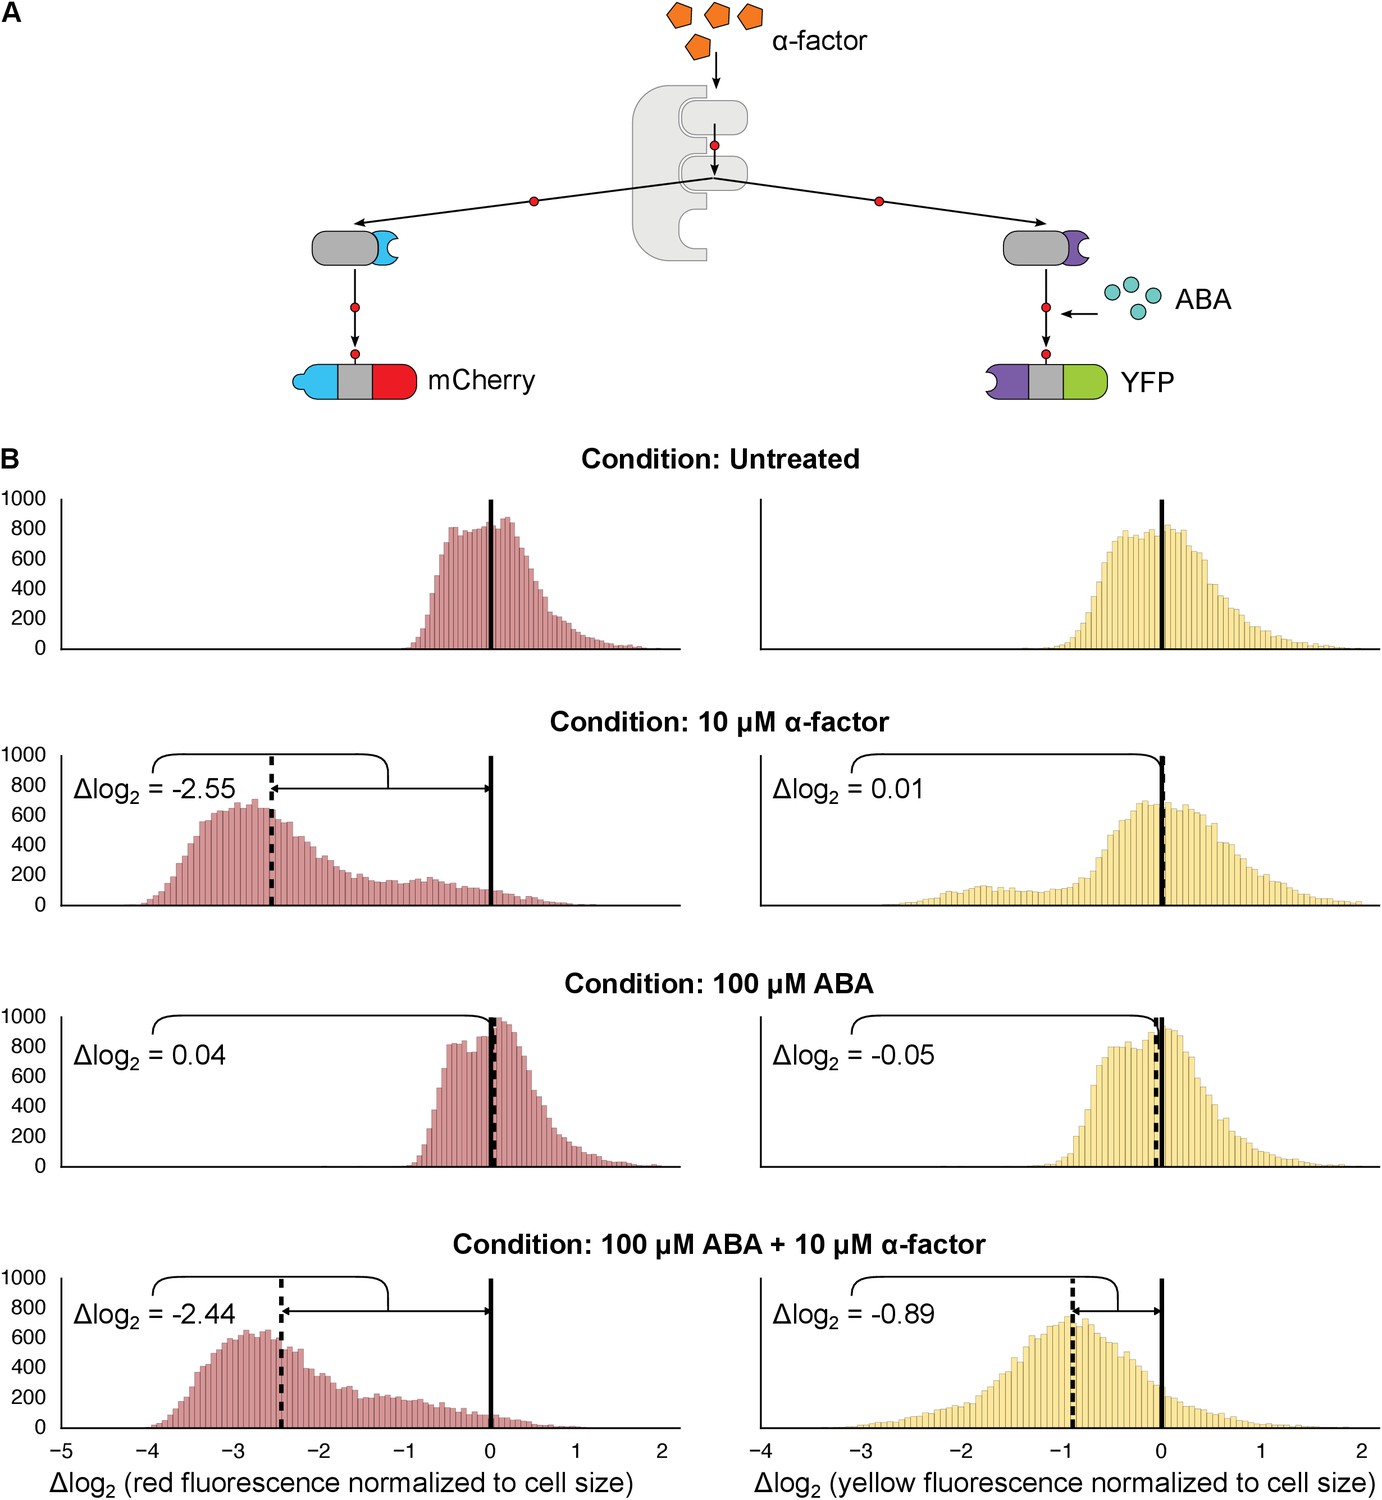
Targeting of orthogonal substrates.
(A) Cells expressed two distinct forms of modified Fus3 and used either a constitutive interaction domain (left) or the ABA inducible domains (right) to target mCherry or YFP, respectively. (B) Population histograms of mCherry (left) and YFP (right) fluorescence normalized by cell size for cells under the indicated conditions—i.e. untreated, treated with 10 μM α-factor, treated with 100 μM ABA or both. The solid vertical black lines on the histograms represent the medians of the untreated populations and the dashed black lines represent the medians of the treated populations.
Figure 3—figure supplement 1
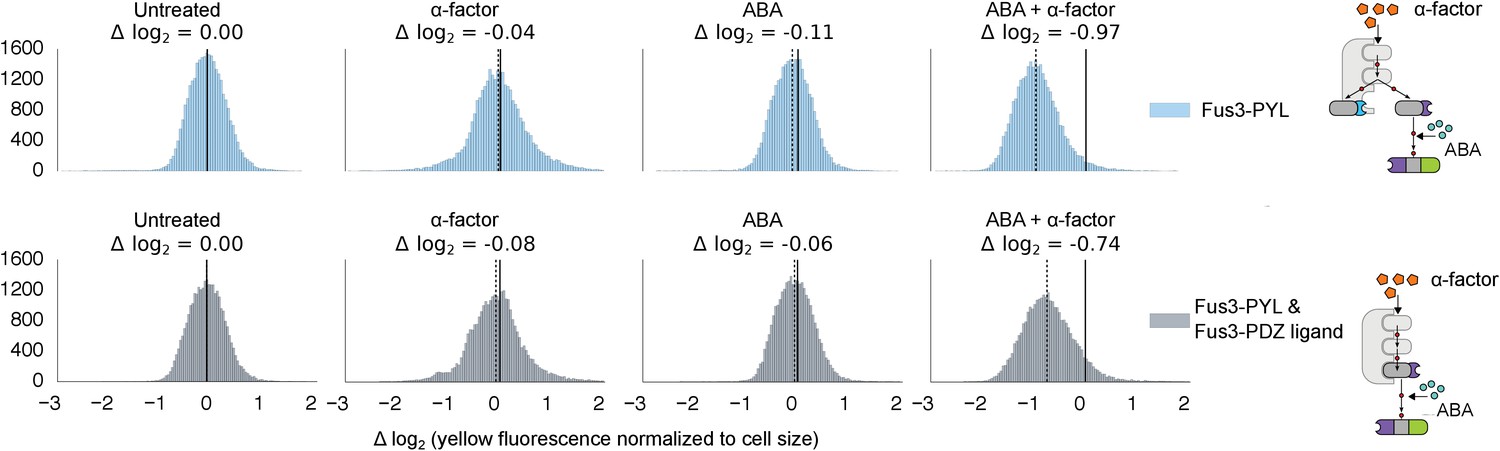
Competition between two Fus3 MAPKS with different interaction domains for MAPKK Ste7.
Population histograms of YFP fluorescence signal normalized by cell size for yeast strains that have either a single copy of Fus3 targeted to a YFP substrate via an ABA dependent PYL interaction domain (top) or two copies of Fus3 one with a PDZ ligand and another with a PYL domain (bottom). These strains were diluted down from saturated overnights and were grown for 5 hrs to log phase with and without ABA and then cytometry reads were performed after 2 hrs post-induction with α-factor. Each plot corresponds to a specific induction condition, with the solid black lines indicating the median of the untreated controls and the dashed black lines indicating the median of that particular treatment. The magnitude of log differences between treated and untreated medians for each treatment is displayed the treatment label.
Figure 3—figure supplement 2
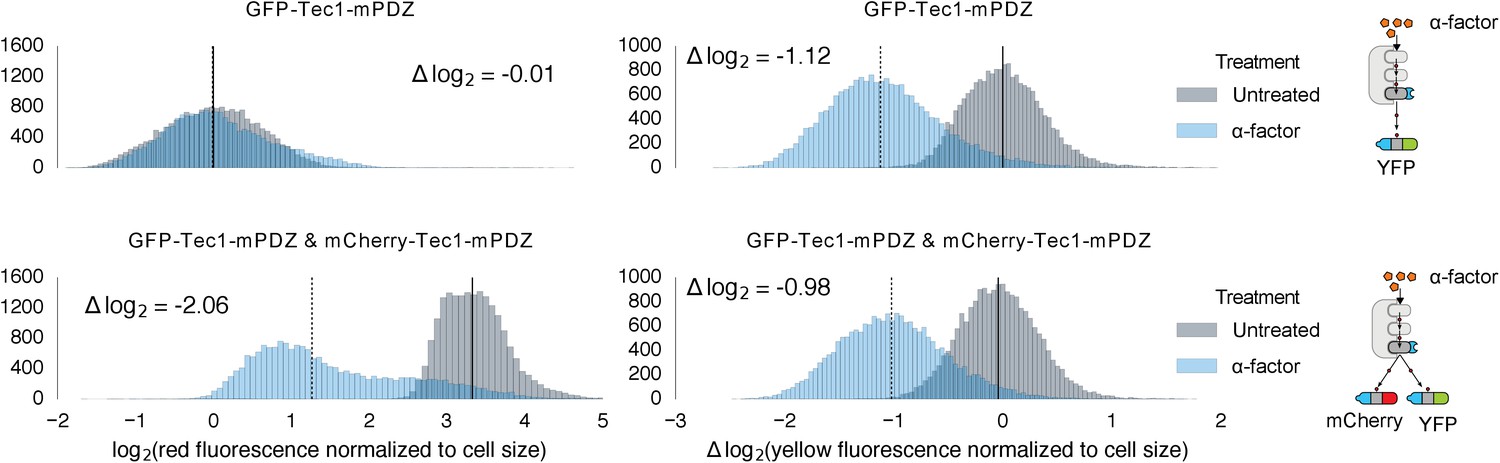
Competition between mCherry and GFP when targeted by the same Fus3.
Population histograms of mCherry (left) and YFP (right) fluorescence signal normalized by cell size for yeast strains that have either a single YFP substrate targeted by Fus3 via a PDZ interaction (top) or two substrates, YFP and mCherry, both of which are targeted by Fus3 via a PDZ interaction (bottom). These strains were diluted down from saturated overnights and were grown for 5 hrs to log phase. Measurement of fluorescence was performed with flow cytometry 2 hrs post-induction with α-factor. The treated populations are depicted as blue histograms and the untreated as gray histograms. The solid black lines indicating the median of the untreated controls and the dashed black lines indicating the median of α-factor treated cells. The magnitude of log differences between the median values of the treated and untreated samples are indicated on each plot.
Figure 4 with 2 supplements
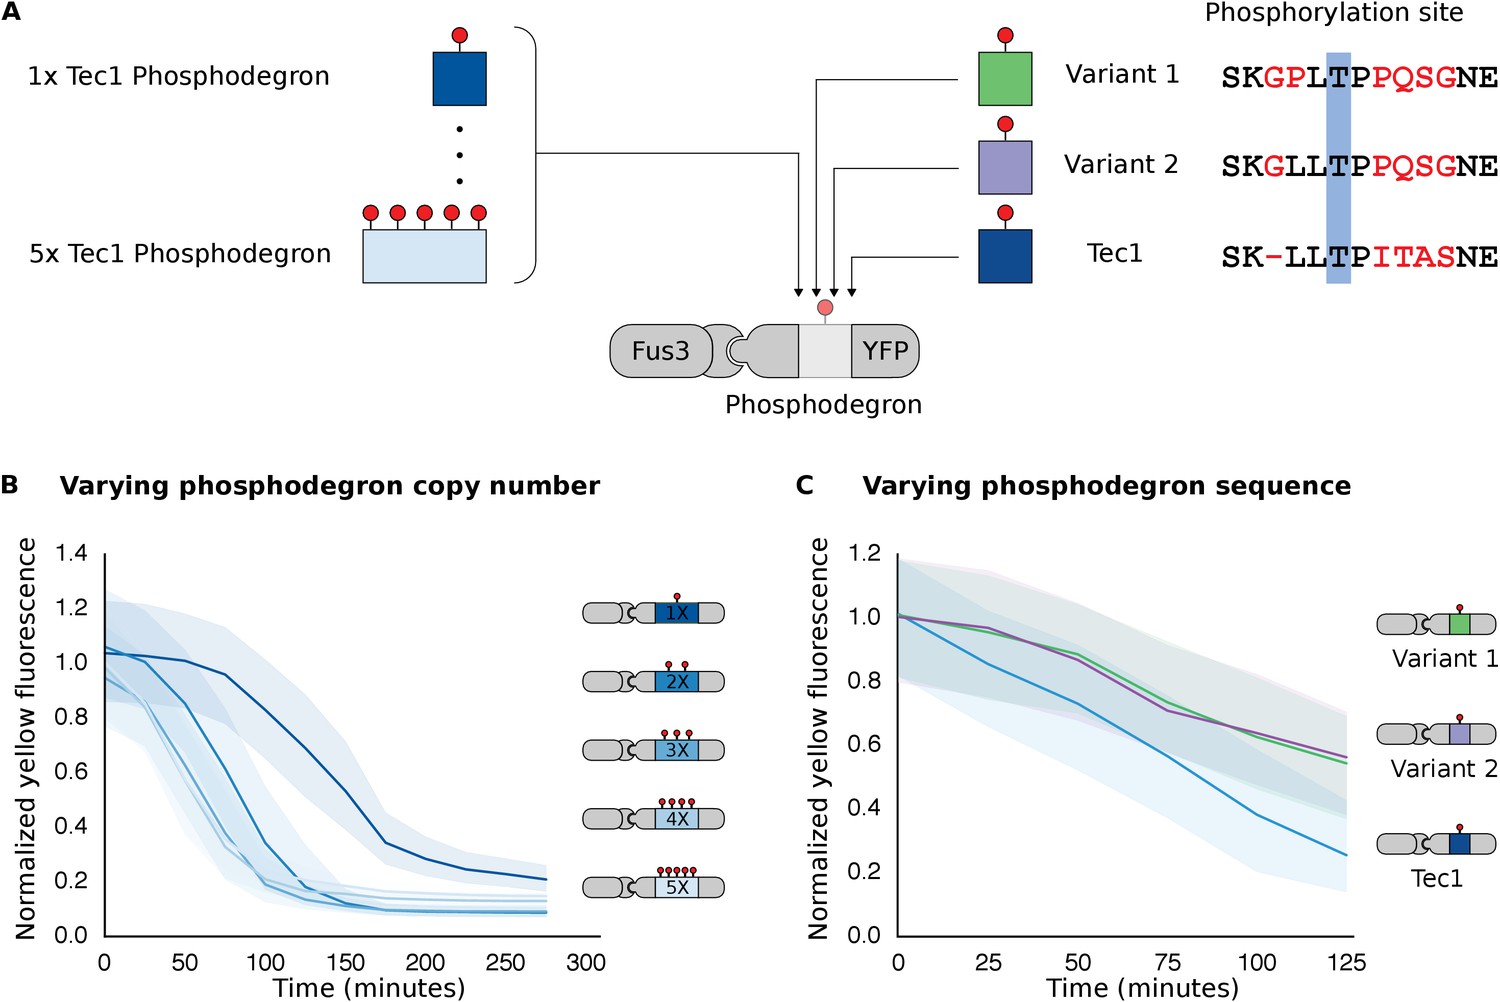
Modulating regulation by altering the number and sequence of phosphodegrons.
(A) We varied either the phosphodegron number (left) or the sequence (right)—differing residues are red, the phosphorylated residue is highlighted in blue. (B) Time-course data of strains induced with 10 μM α-factor and expressing Fus3 targeting YFP reporters with one to five phosphodegrons. The fluorescence of each strain was normalized to cell size and then to its initial fluorescence. Data normalized only to cell size can be found in Figure 3—figure supplement 1. (C) Fus3 targeting of YFP substrates with the indicated phosphodegron sequence variants. As in B), the fluorescence of each strain is normalized to cell size and then against its initial fluorescence. Data normalized only to cell size can be found in Figure 3—figure supplement 2. The curves indicate the median values, while the shaded regions cover the interquartile range.
Figure 4—figure supplement 1
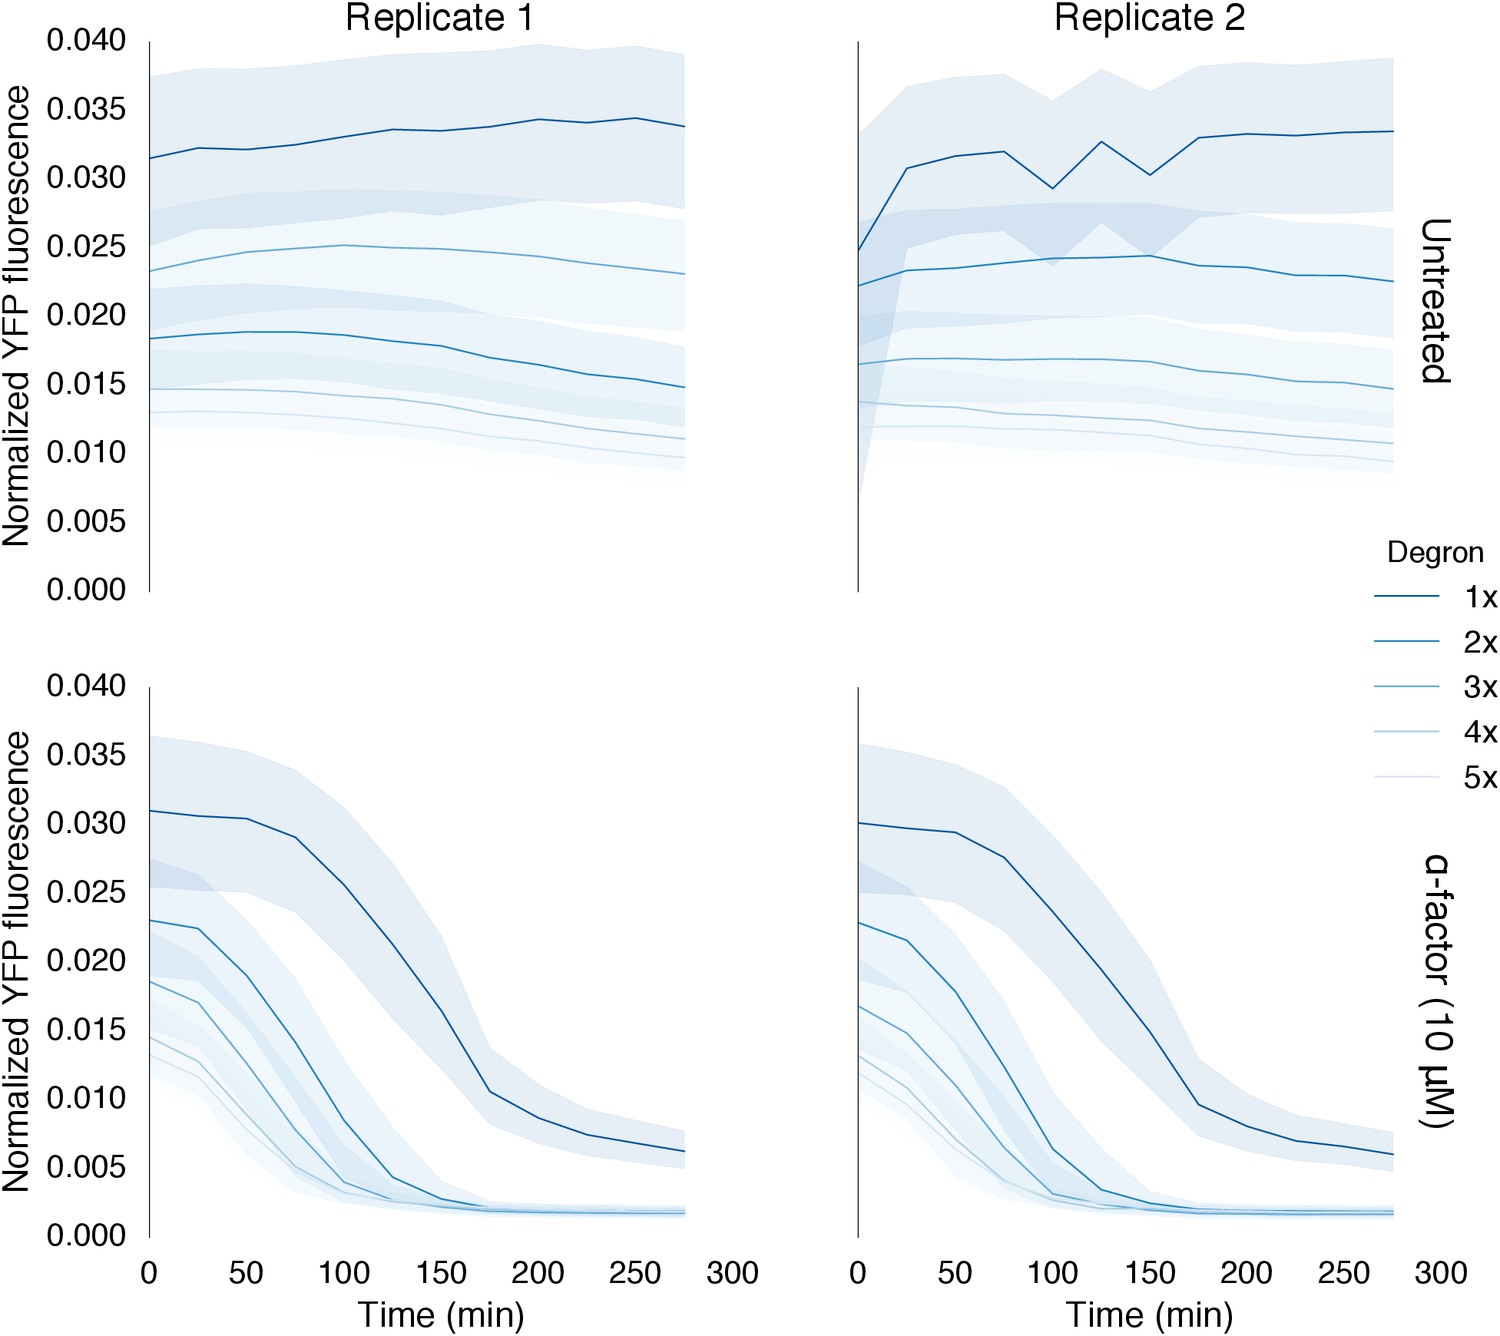
Time course data of reporter variants with different numbers of phosphodegrons normalized by cell size.
Each subplot in this plot is a replicate of the experiment performed on different days under identical conditions. Each yeast strain assayed was diluted from a saturated culture, grown for 5 hours to reach log phase growth and then induced with 10 μM α-factor at time 0 to activate the kinase. The fluorescence of these cultures was then assayed at regular intervals using flow cytometry. Data for each variant is depicted in a different color with dark blue being one degron and light blue being five adjacent degrons. Solid lines indicate the median value, while shaded regions indicate the interquartile range.
Figure 4—figure supplement 2
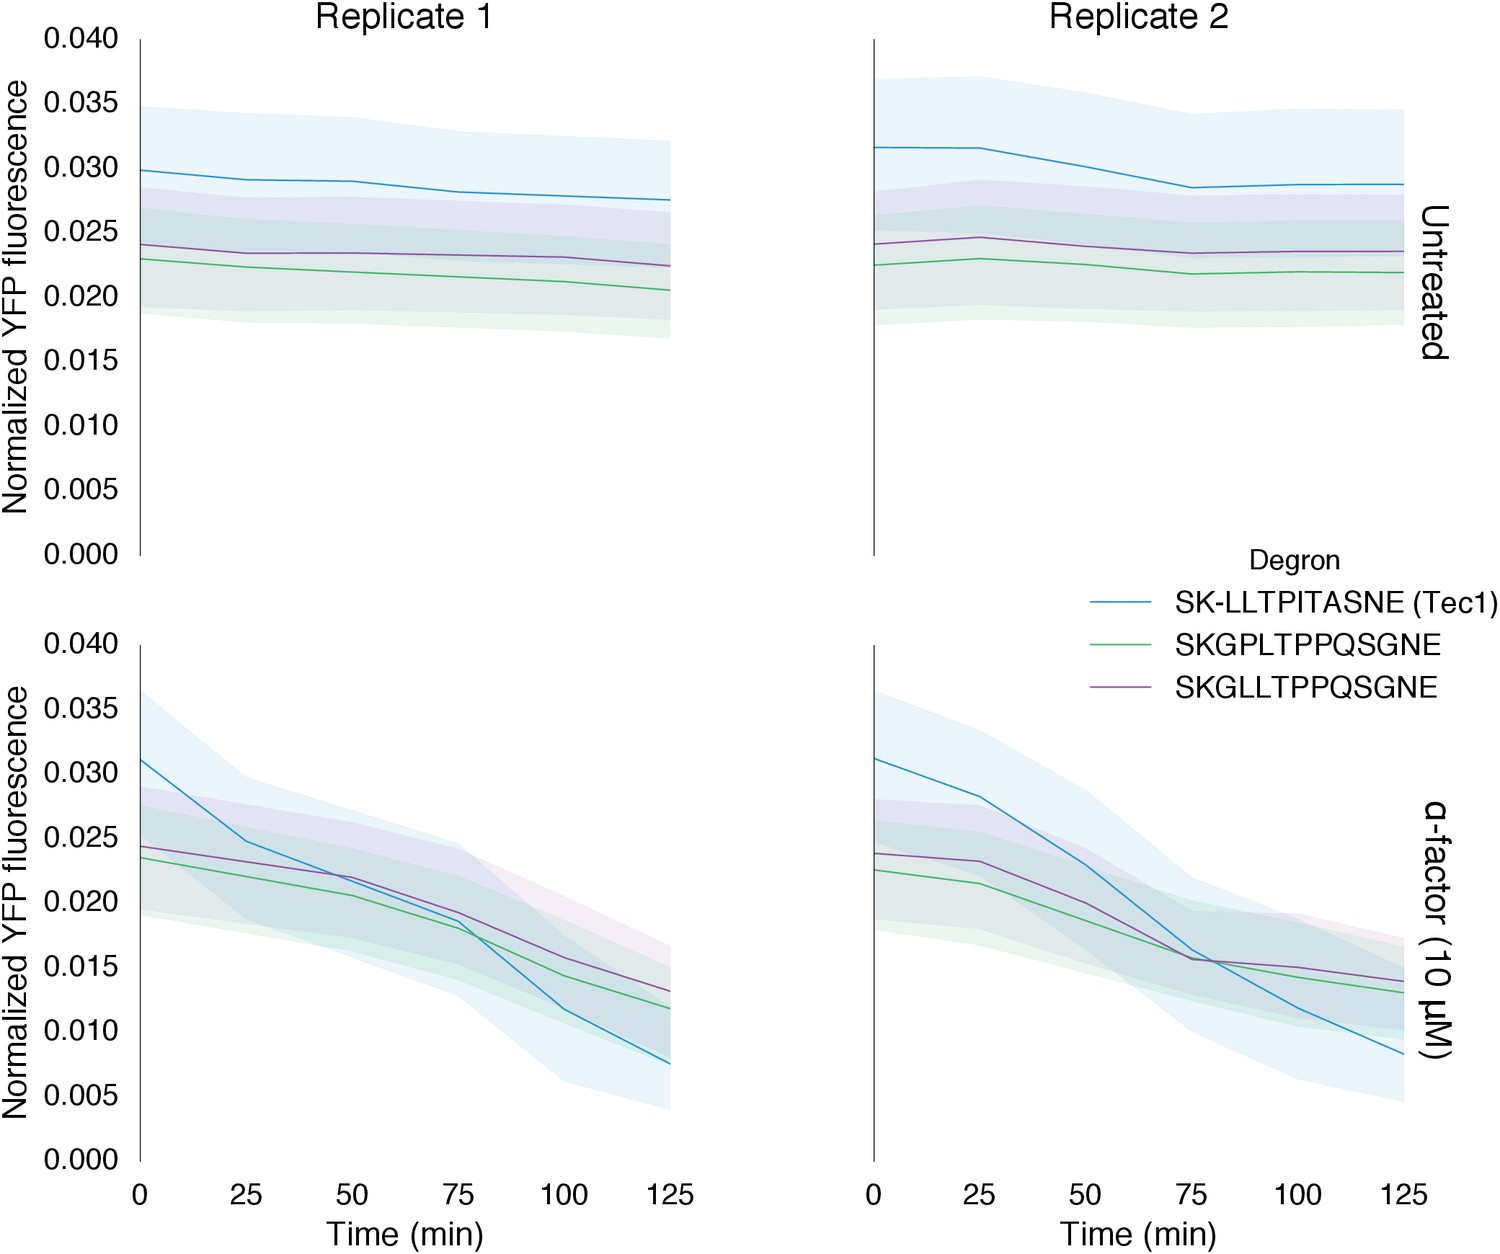
Time course data of reporter variants with different degron sequences normalized by cell size.
Each yeast strain assayed was grown up to log phase from saturated cultures for 5 hrs and then induced with 10 μM α-factor at time 0 to activate the kinase. The fluorescence of these cultures was then assayed at regular intervals using flow cytometry. Solid lines indicate the median value, while shaded regions indicate the interquartile range.
Figure 5

Retargeting the mammalian MAPK, ERK2.
(A) As with Fus3, the human MAPK, ERK2, was targeted to a YFP reporter (green) via an interaction between the mPDZ domain and the PDZ ligand. A phosphodegron (yellow) fused to the YFP reporter was derived from the mammalian MKP-1. ERK2 was rendered constitutively active by fusing it to a constitutively active form of MEK1 (purple). (B) Population histograms of YFP fluorescence normalized by cell size of yeast strains in log phase growth with active ERK2 targeted to YFP with a functional phosphodegron (blue histogram). Controls strains with an inactive phosphodegron fused to YFP and/or an untargeted version of the kinase were also tested (gray histograms). The solid vertical black lines on the histograms represent the medians of the first histogram – the untargeted kinase paired with the non-functional degron – and the dashed black lines represent the medians of each subsequent population.
Figure 6 with 1 supplement

Implementation of negative feedback and feed-forward signaling topologies using a rewired MAPK.
(A–C) Plots and schematics that depict the relationship between the α-factor input and the YFP reporter for yeast strains with synthetic post-translational negative feedback or feed-forward loops. Fus3 (yellow) was rewired to target (A) the scaffold Ste5, (B) the kinase Ste7 or (C) the transcription factor Ste12 (all depicted in light blue)–in each case, the endogenous copies of these proteins were modified by inserting a phosphodegron and a complementary interaction domain at their C-terminus. Plots of the median fluorescence of the YFP reporter – under the control of the mating-specific pFUS1 promoter – normalized to cell size for increasing concentrations of α-factor. Data from control strains with an untargeted kinase – and thus no feedback/feed-forward control – are shown in dark blue. Points indicate the median values at each α-factor concentration, while the vertical bars cover the interquartile range of the data. The data from both the no feedback and feedback conditions were used to determine the parameter values used with the formula: – where was fixed between the two data sets. and ] are the hill coefficient and the α-factor concentration, respectively. Fits are plotted as dashed lines. Time courses of the same strains treated with 10 µM α-factor are shown in Figure 6—figure supplement 1.
Figure 6—figure supplement 1
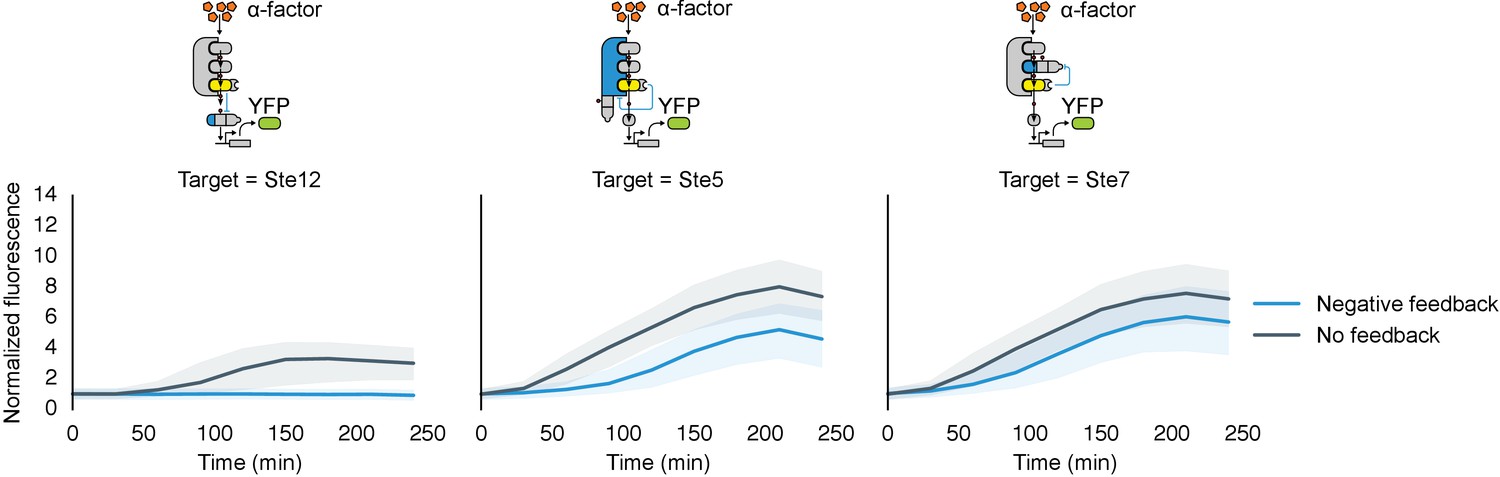
Time course charecterization of Negative feedback topologies.
Timecourse data of YFP fluorescence for populations of yeast cells where the MAPK Fus3 is targeted to phosphorylate and cause the degradation of Ste12, Ste5 or Ste7 (from left to right) after they were induced with 10 μM α-factor at time 0. The blue solid lines depict medians of strains that had a negative feedback topology described in the corresponding cartoon and the gray solid lines are medians for control strains that had a non-frunctional phosphodegrons. The blue and gray ribbons describe the interquartile range.
Figure 7 with 1 supplement
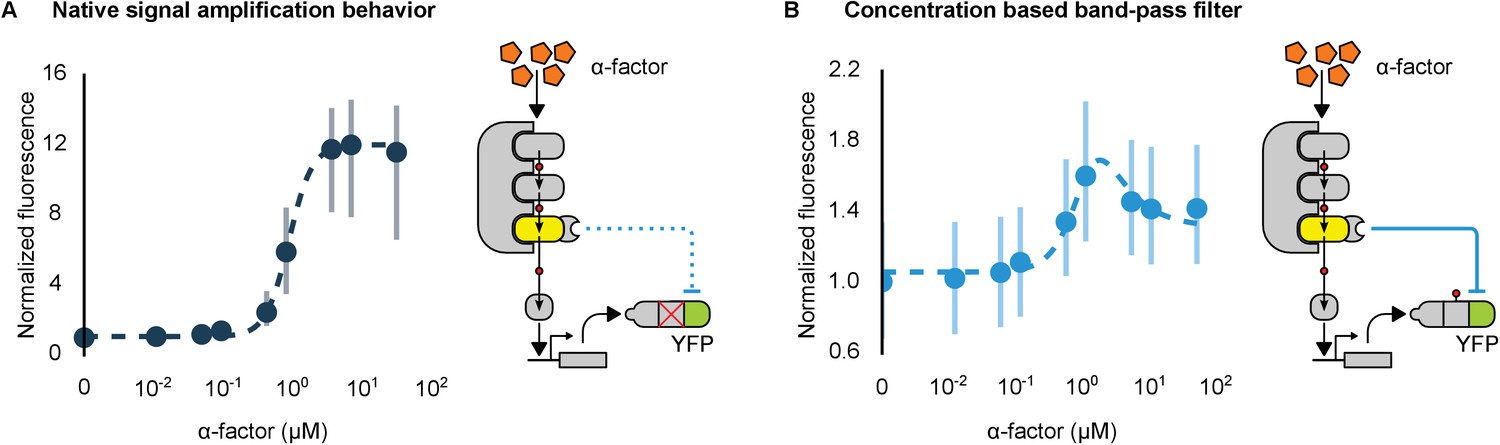
Conversion of a native amplifier to a band-pass filter.
(A, B) The relationship between the α-factor input and YFP expression – driven by the mating pathway-specific promoter pFUS1 – for strains without and with a synthetic post-translational incoherent feed-forward loop. Induction of the mating pathway activated a modified Fus3 (yellow) that indirectly up-regulates the expression of a YFP reporter (green) fused to a phosphodegron. An interaction between the Fus3 and the YFP-degron reporter was enabled via complementary interaction domains. In one case (A) the phosphodegron was mutated and inactive, while in the other (B) it was fully functional. The points indicate the median YFP signal – normalized by cell size and then to the untreated condition – in yeast strains in log phase growth treated with the indicated concentration of α-factor. The error bars depict the interquartile range of the population data. Dashed lines are fits to the equation – model derivation and fitting are described in more detail in Appendix 1. Time-course data is shown in Figure 7—figure supplement 1.
Figure 7—figure supplement 1
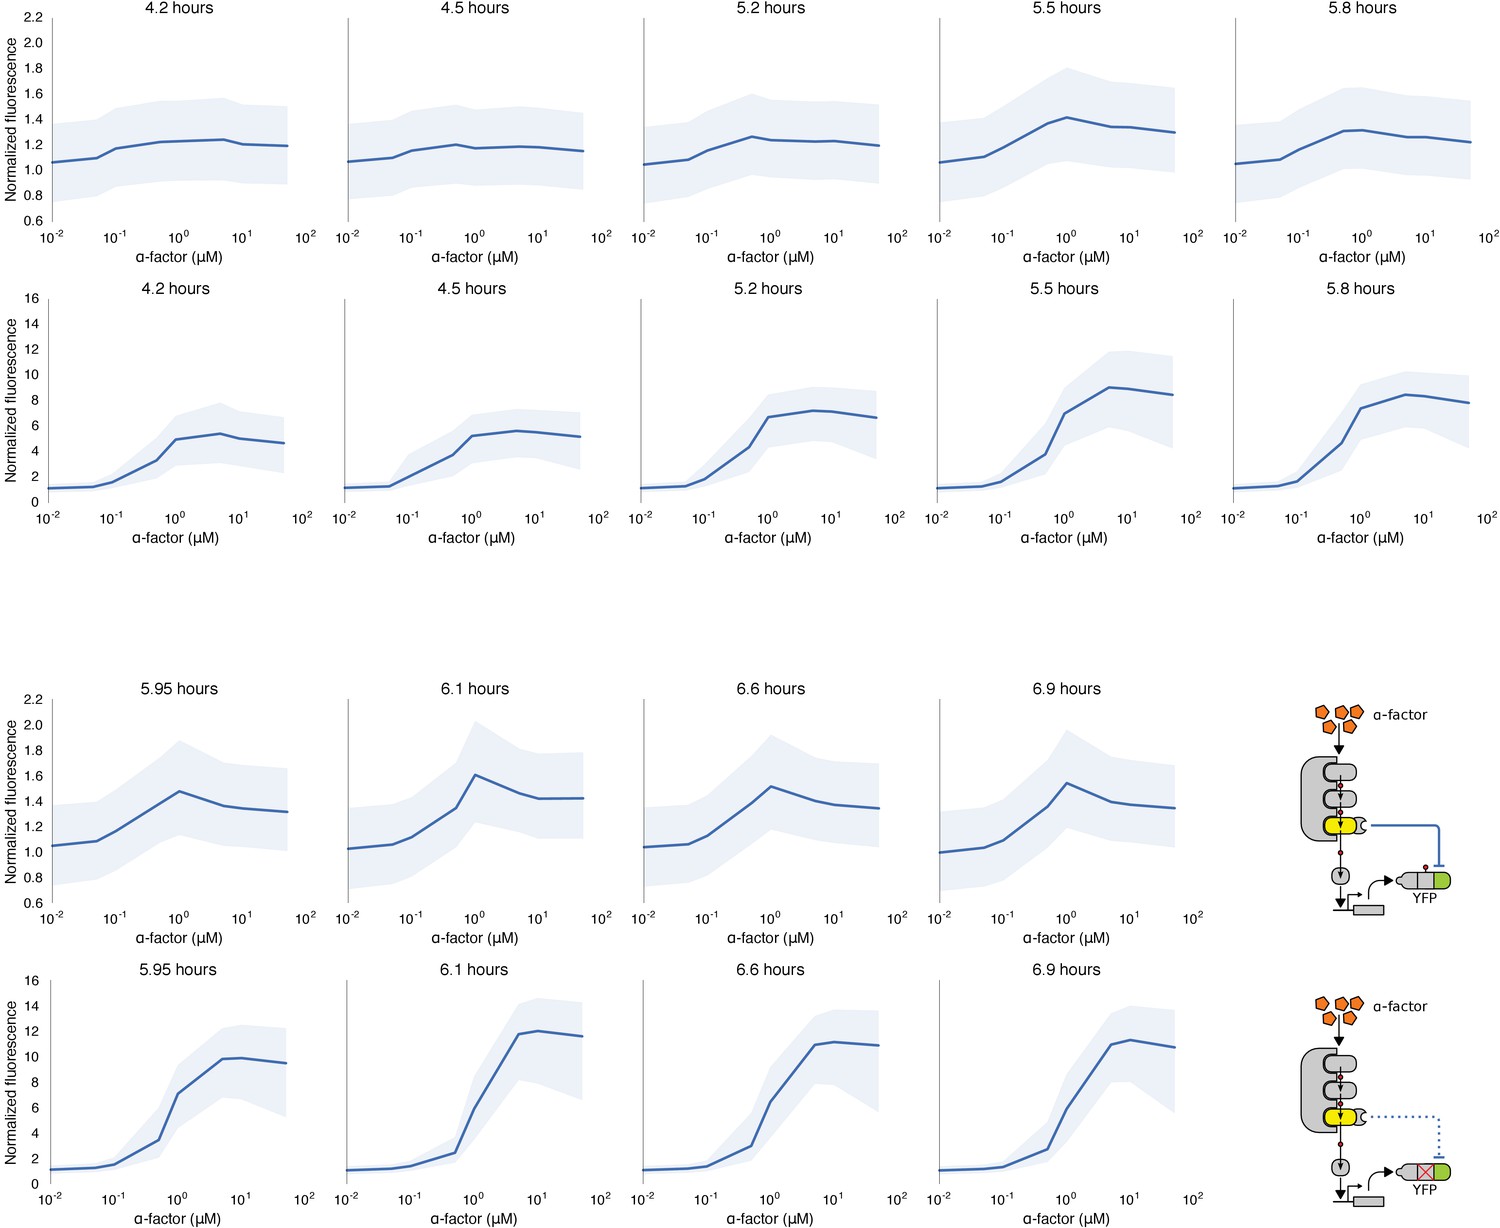
Time course of dose response behavior to α-factor induction of yeast strains with (top row) and without (bottom row) the mating cascade modified with an incoherent feed forward loop.
Each yeast strain assayed was grown up to log phase from saturated cultures for 5 hrs and then induced with a range of different α-factor concentrations. The fluorescence of these cultures was then assayed at regular intervals — indicated above each graph — using flow cytometry. Median data (solid blue line) with the interquartile range (blue ribbon) of the population for two replicates performed on different days under identical conditions is shown.
Additional files
-
Supplementary file 1
Table of yeast strains.
- https://doi.org/10.7554/eLife.15200.021
Download links
A two-part list of links to download the article, or parts of the article, in various formats.
Downloads (link to download the article as PDF)
Open citations (links to open the citations from this article in various online reference manager services)
Cite this article (links to download the citations from this article in formats compatible with various reference manager tools)
Rewiring MAP kinases in Saccharomyces cerevisiae to regulate novel targets through ubiquitination
eLife 5:e15200.
https://doi.org/10.7554/eLife.15200


