Dual functions of a small regulatory subunit in the mitochondrial calcium uniporter complex
- Brandeis University, United States
- Howard Hughes Medical Institute, Brandeis University, United States
Figures
Figure 1
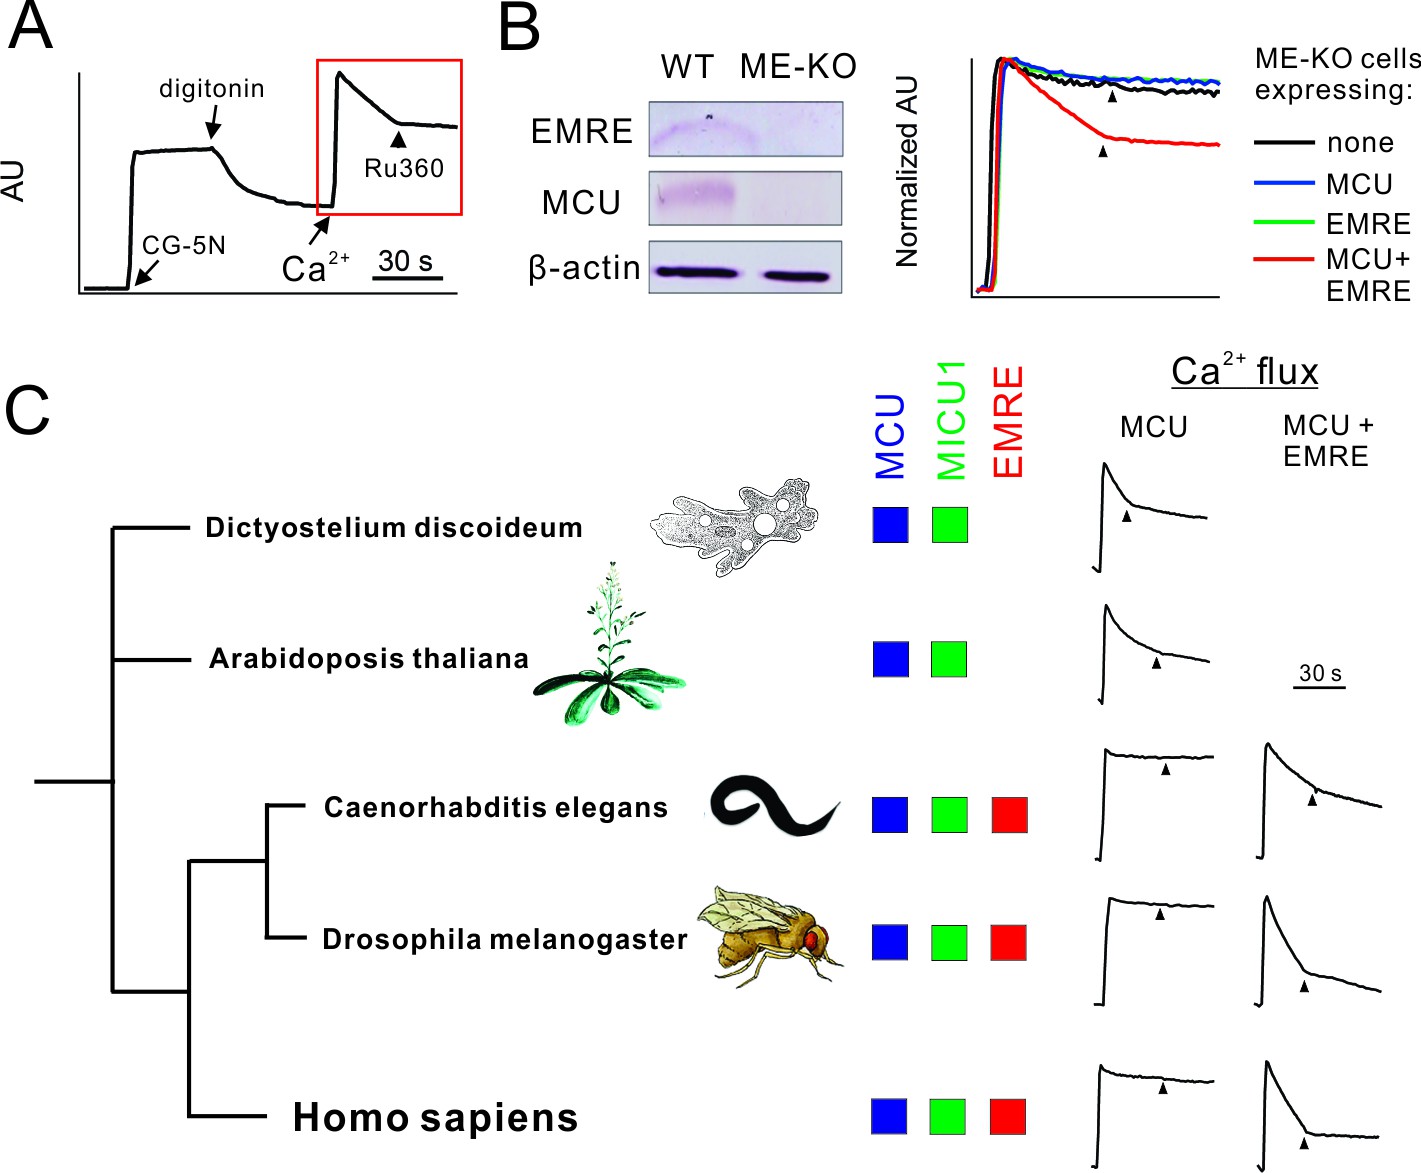
Functional analysis of uniporter in various species.
(A) A representative fluorescence-based Ca2+ flux experiment. (B) Characterization of ME-KO HEK 293 cells. Left: western analysis comparing EMRE, MCU, and actin expression in WT or ME-KO cells. Right: Loss of MCU-mediated Ca2+ uptake in ME-KO cells, and rescue by delivering both MCU and EMRE genes. (C) Activity of uniporters in species indicated. Ca2+ flux experiments were performed using ME-KO cells expressing MCU alone or MCU and EMRE from the same species.
Figure 2 with 1 supplement

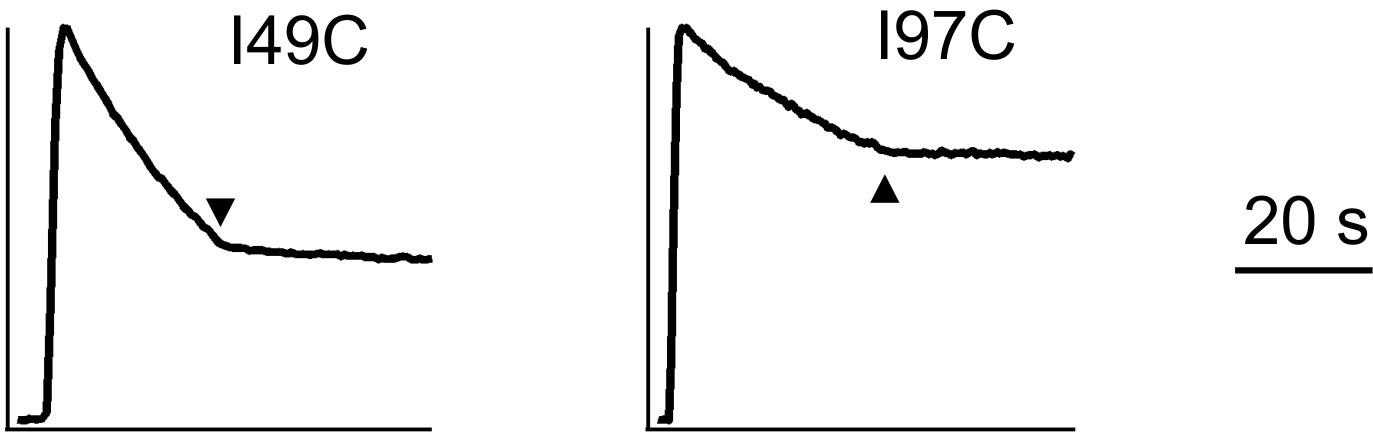
Transmembrane orientation of MCU and EMRE.
(A) Western blot analysis of WT-MCU response to PEGM, in the absence or presence of DDM detergent, with molecular weight marker positions indicated on left. (B) PEGM treatment of WT, I49C, or I97C EMRE. EMRE’s molecular weight is ~10 kDa. (C) Cartoon illustrating the proposed membrane orientation of MCU and EMRE. The N-terminus of EMRE is fused to the C-terminus of MCU (dashed line). Blue circles: native cysteines. Green boxes: soluble region. (D) WT-MCU or MCU-EMRE fusion protein (Fus) probed with anti-MCU (left) or anti-EMRE (right) antibodies. (E) MCU-EMRE fusion treated with PEGM. In the presence of DDM, PEGM treatment produces 4 bands, representing fusion proteins with various numbers of cysteines modified. (F) Mitochondrial Ca2+ uptake in ME-KO cells with (red) or without (black) expression of the MCU-EMRE fusion protein. See also Figure 2—figure supplement 1.
Figure 2—figure supplement 1
Uniporter function supported by indicated EMRE mutants.
https://doi.org/10.7554/eLife.15545.005
Figure 3 with 1 supplement
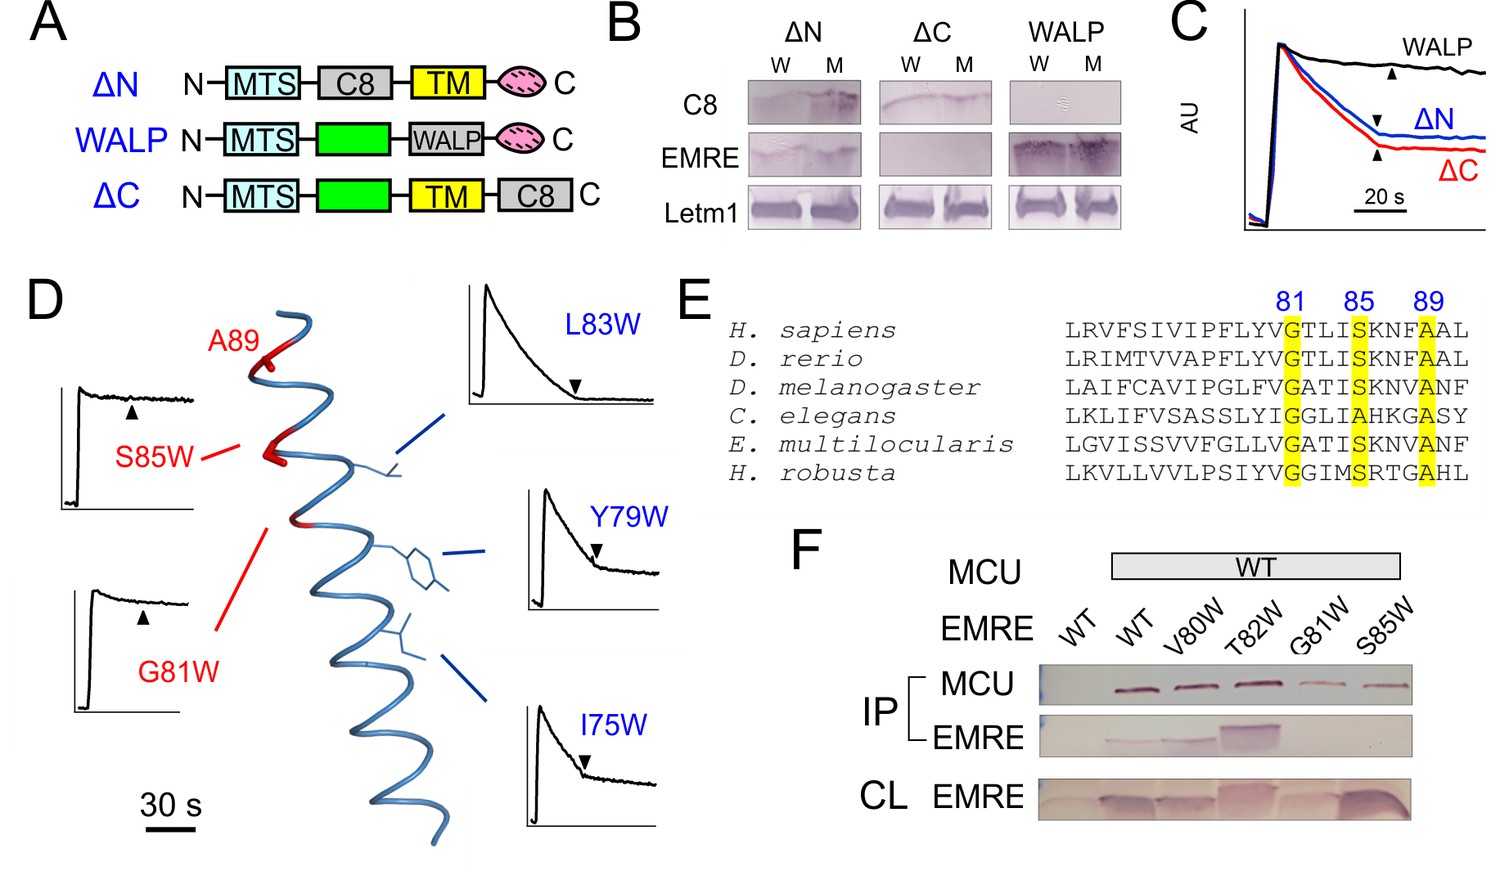
MCU-interacting residues in EMRE.
(A) EMRE constructs with indicated regions substituted by either the C8 epitope or the WALP helix. MTS: mitochondrial targeting sequence. Green boxes: soluble regions. Pink ovals: polyaspartate tail. (B) The presence of these mutants in whole cell lysate (W) or isolated mitochondria (M). ΔC-EMRE is not detectable by the EMRE antibody because the C-terminal truncation removes the epitope. (C) Mitochondrial Ca2+ uptake in EMRE-KO cells expressing WALP-, ΔN-, or ΔC-EMRE. (D) Diagram summarizing Trp scan of the EMRE TM helix. Red shows positions where Trp substitution reduces the rate of Ca2+ uptake by >50%. (E) Sequence alignment of EMRE TM helix. Yellow indicates residues intolerant to Trp substitutions in human EMRE. (F) Co-IP experiments using 1D4-tagged MCU immobilized in 1D4 affinity columns to pull down indicated EMRE mutants. IP: elution, analyzed using indicated antibody. CL: whole cell lysate input. Upper panel: proteins being expressed in ME-KO cells. Leftmost lane: MCU-free control to rule out non-specific binding of EMRE in the 1D4 column. See also Figure 3—figure supplement 1.
Figure 3—figure supplement 1
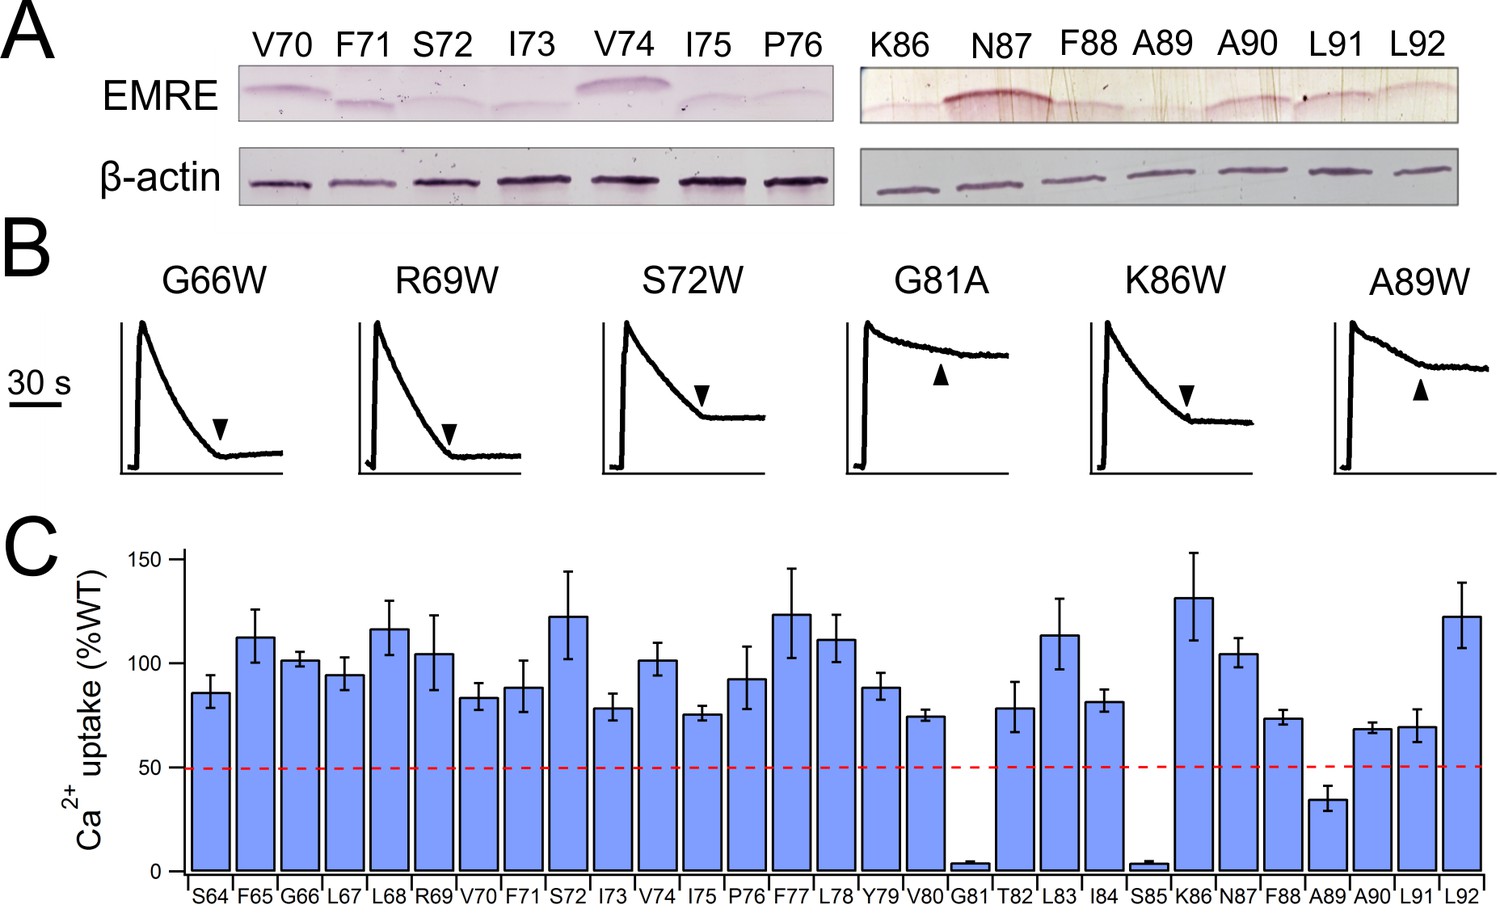
Functional impact of mutations in EMRE’s TM helix.
(A) Expression of indicated EMRE mutants. (B) Ca2+ flux traces in EMRE-KO cells expressing EMRE mutants. (C) Bar chart summarizing Ca2+ uptake activity in cells expressing various EMRE mutants. Dashed red line: 50% WT activity.
Figure 4 with 3 supplements

Interactions between EMRE and MCU’s TMH1.
(A) Helical projection diagram summarizing functional impact of Trp substitutions in TMHs of MCU. Trp mutation that reduces Ca2+ uptake by >70% is defined as high impact (red), and <30% as low impact (black). Red arc highlights proposed helical surface sensitive to Trp substitutions. (B) Residue swap showing an impaired MCU mutant (A241F) forming a highly functional uniporter complex with an EMRE mutant (F77A). Left: Ca2+ uptake in ME-KO cells expressing indicated MCU and EMRE mutants. Right: Ca2+ uptake (upper) and expression of key uniporter proteins (lower) in cells transfected with A241F-MCU and WT- or F77A-EMRE. (C) Co-IP experiments comparing complex formation of A241F-MCU with WT- or F77A-EMRE. (D) Ca2+ flux in a hMCU-ceMCU chimera (human portion: yellow, C. elegans portion: blue), coexpressed with either hEMRE or ceEMRE in ME-KO cells. See also Figure 4—figure supplements 1–3.
Figure 4—figure supplement 1
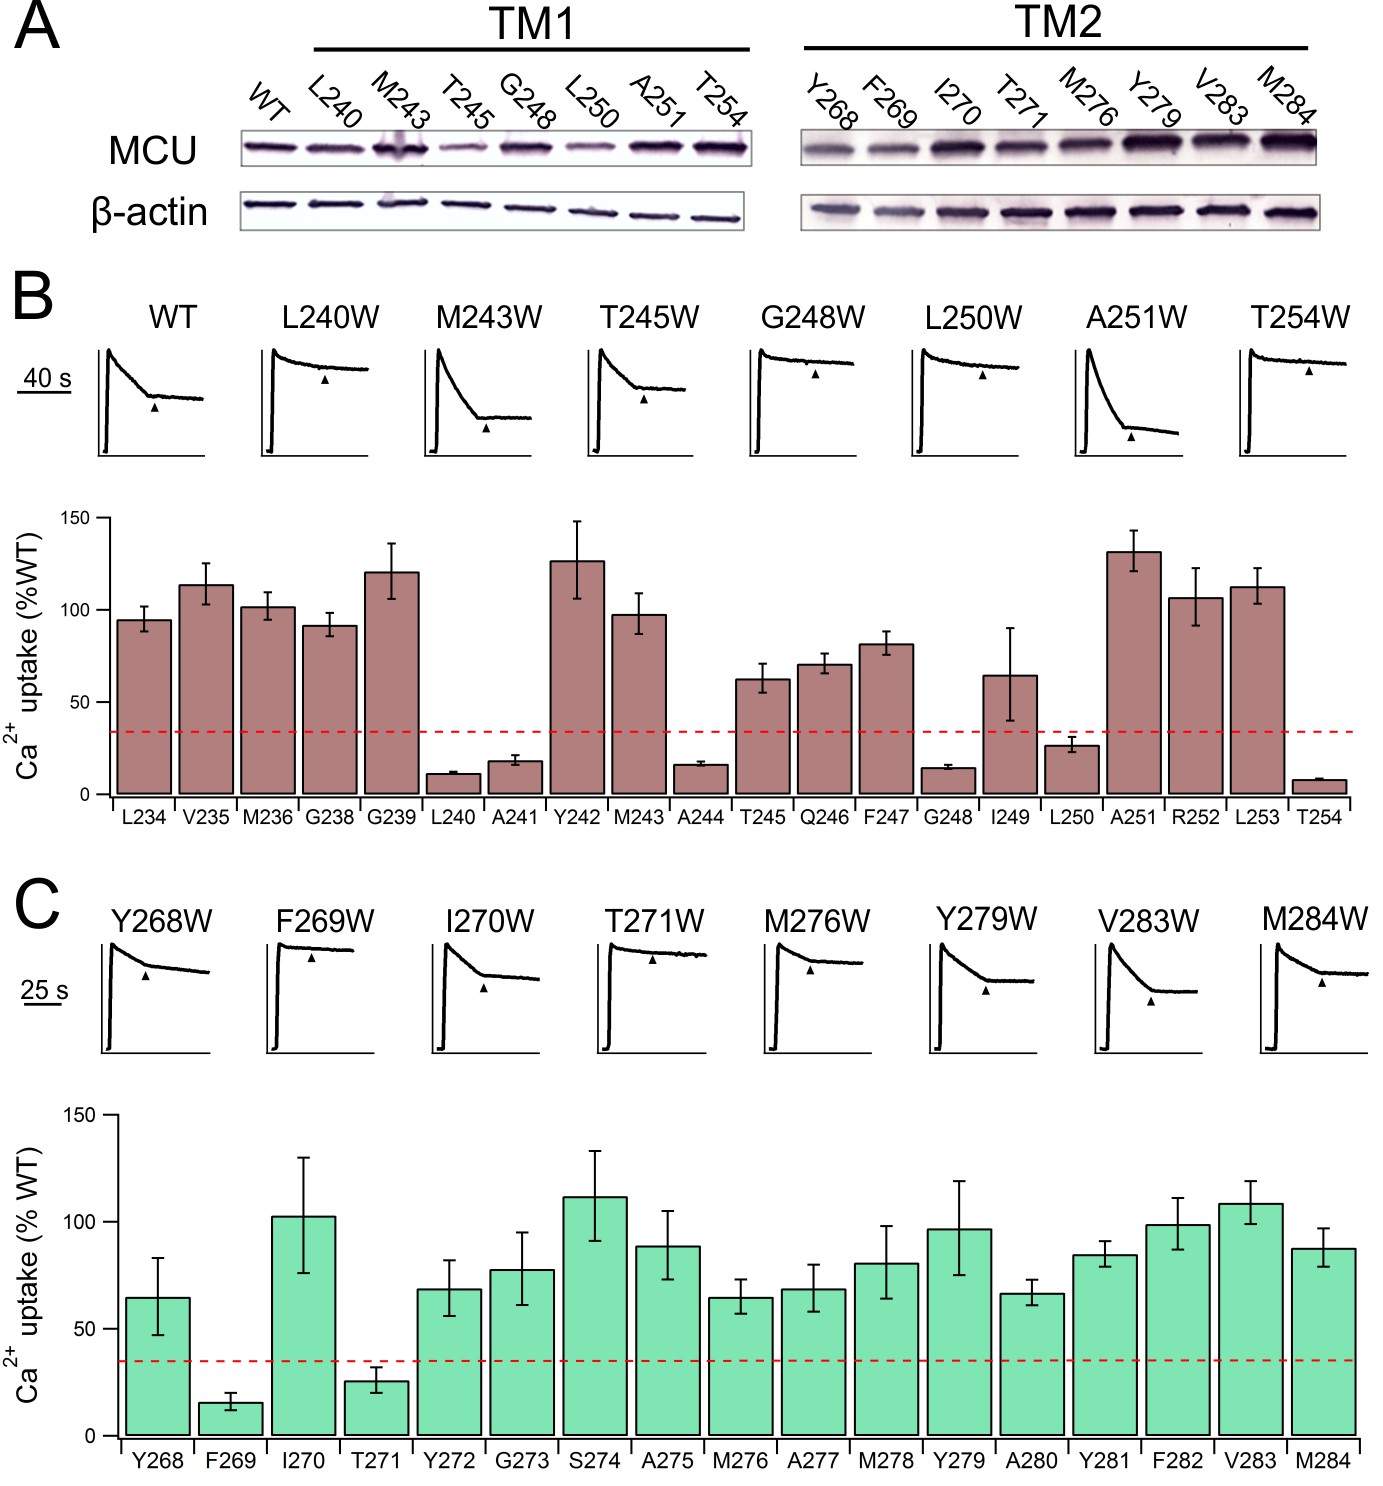
Functional impact of mutations in MCU’s TM helices.
(A) Expression of selected MCU mutants. (B–C) The effect of mutations in MCU’s TMH1 (B) or TMH2 (C) on Ca2+ flux via the uniporter. Dashed red line: 30% WT activity.
Figure 4—figure supplement 2
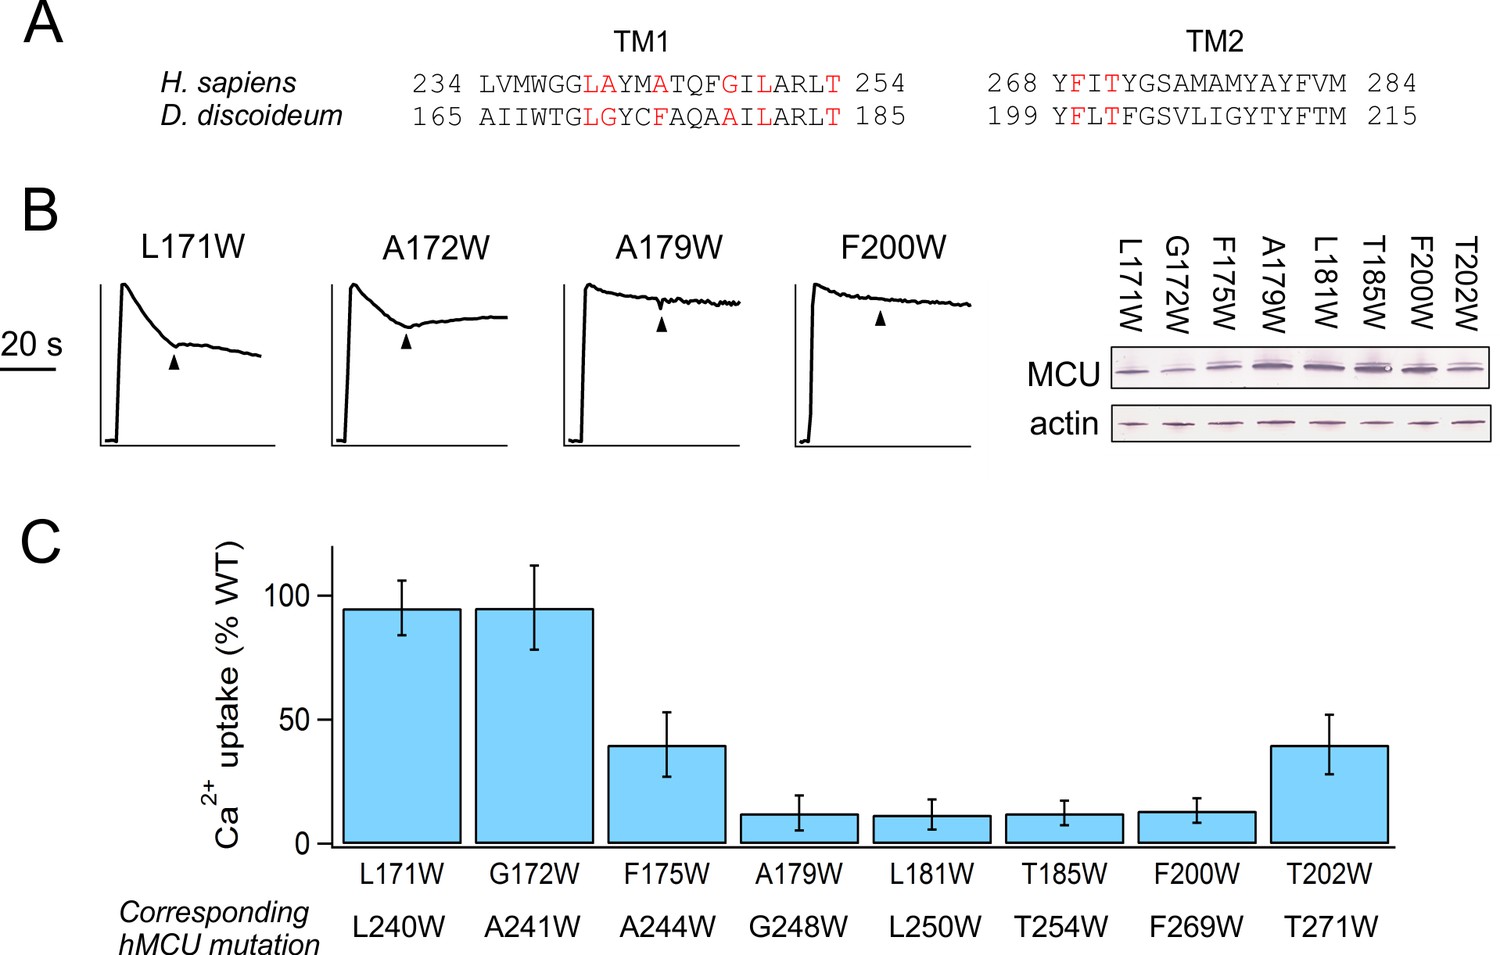
Trp mutations in D. discoideum MCU.
(A) Sequence alignment of TMH1 and TMH2 of human and D. discoideum MCU homologues. Red indicates residues selected for Trp substitution. (B) Characterization of D. discoideum MCU mutants. Left: Ca2+ flux in ME-KO cells. Right: expression of the mutants. (C) The activity of Trp mutants compared with WT D. discoideum MCU.
Figure 4—figure supplement 3
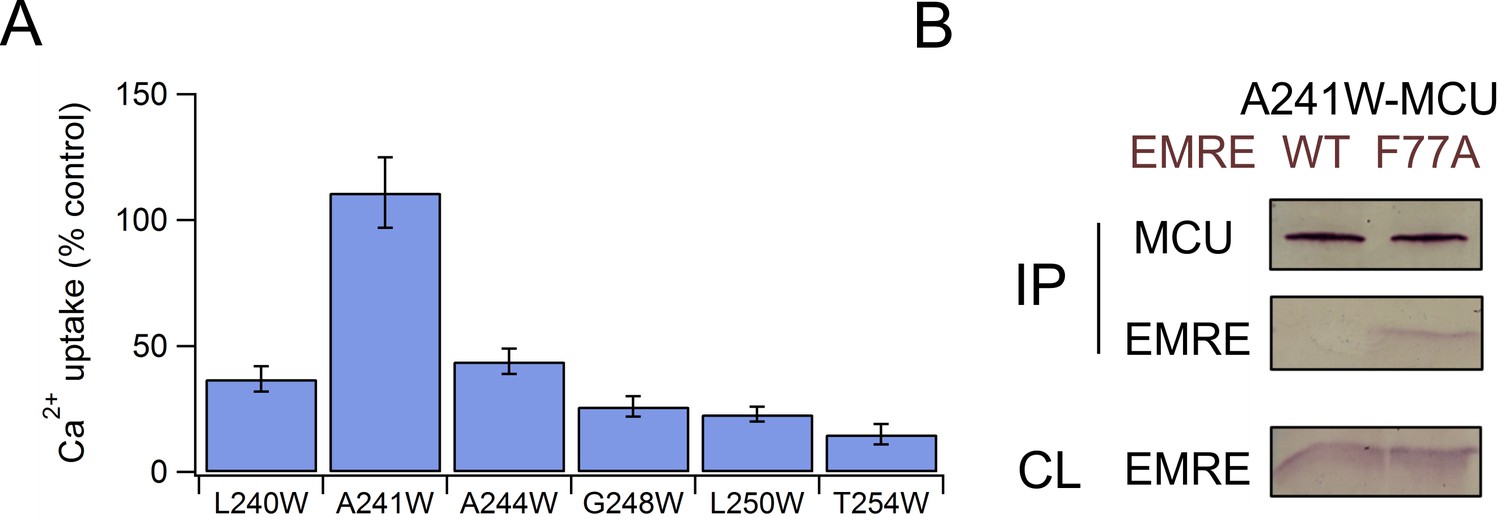
Uniporter formation by F77A EMRE and MCU mutants.
(A) Uniporter activity in EMRE-KO cells expressing F77A EMRE and MCU mutants as indicated. Activity is normalized to that produced by WT MCU and WT EMRE. (B) Co-IP test of complex formation by A241W MCU and WT- or F77A-EMRE.
Figure 5 with 1 supplement
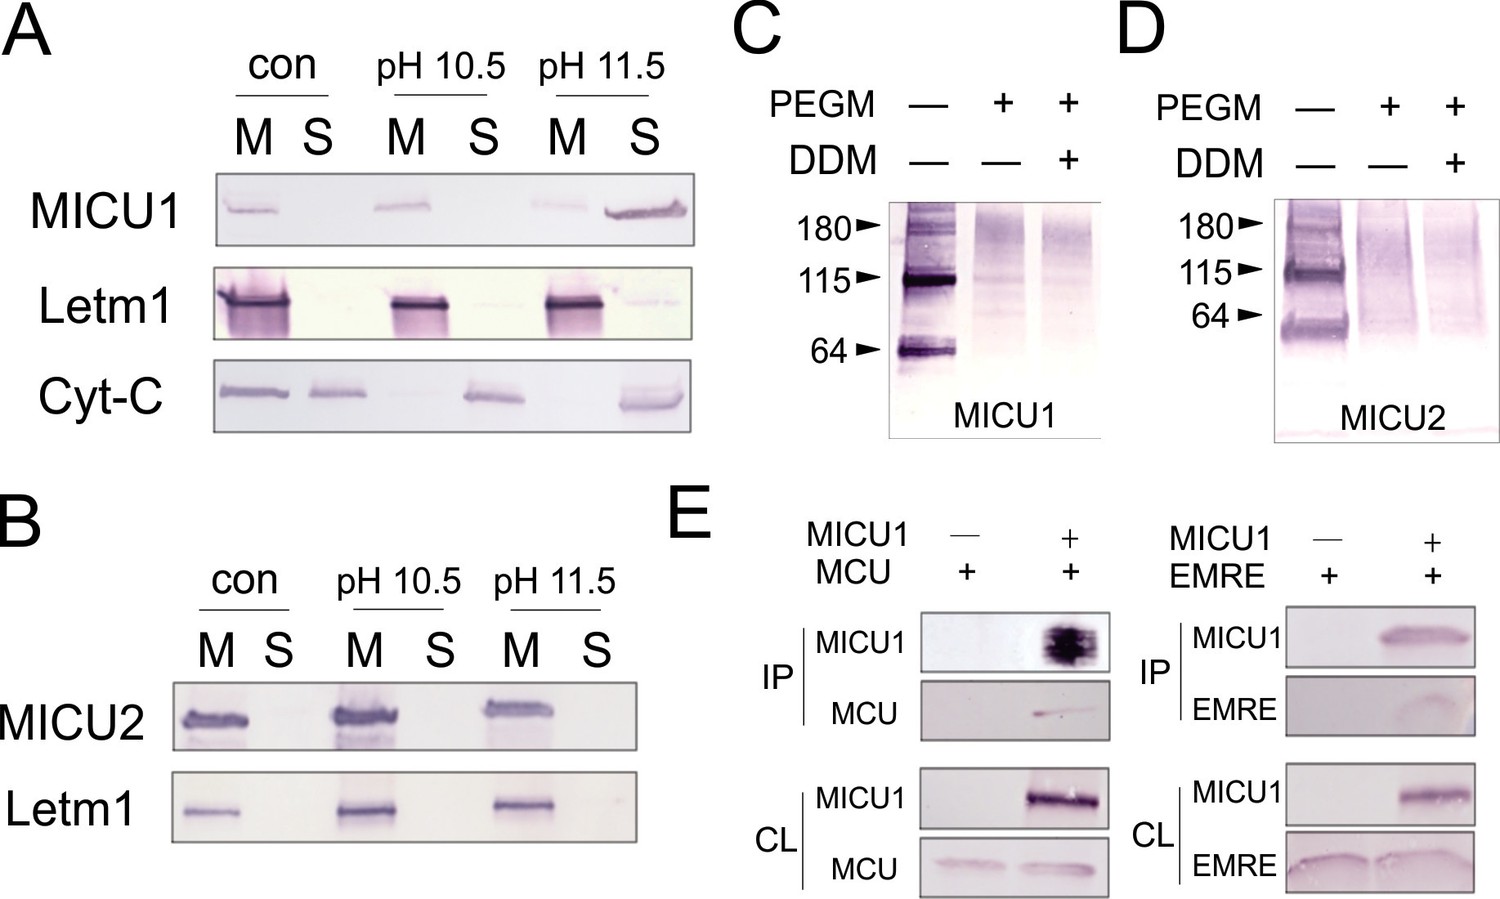
Localization of MICUs and interaction with the pore region.
(A–B) Carbonate extraction (pH 10.5 or 11.5) of MICU1 at 4°C (A) or MICU2 at room temperature (B) for 1 h, showing membrane pellet (M), proteins extracted into supernatant (S), and control (con) with mitoplasts treated at pH 7.0. (C– D) PEGM modification of MICU1 or MICU2. Both MICUs are detected at monomer (~64 kDa) or dimer (~115 kDa) positions. (E) Co-IP experiments using immobilized Flag-tagged MICU1 to pull down MCU or EMRE. For all experiments shown in this figure, MICU1 and MICU2 were Flag- and V5-tagged, respectively, and were detected using corresponding Flag and V5 antibodies. See also Figure 5—figure supplement 1.
Figure 5—figure supplement 1
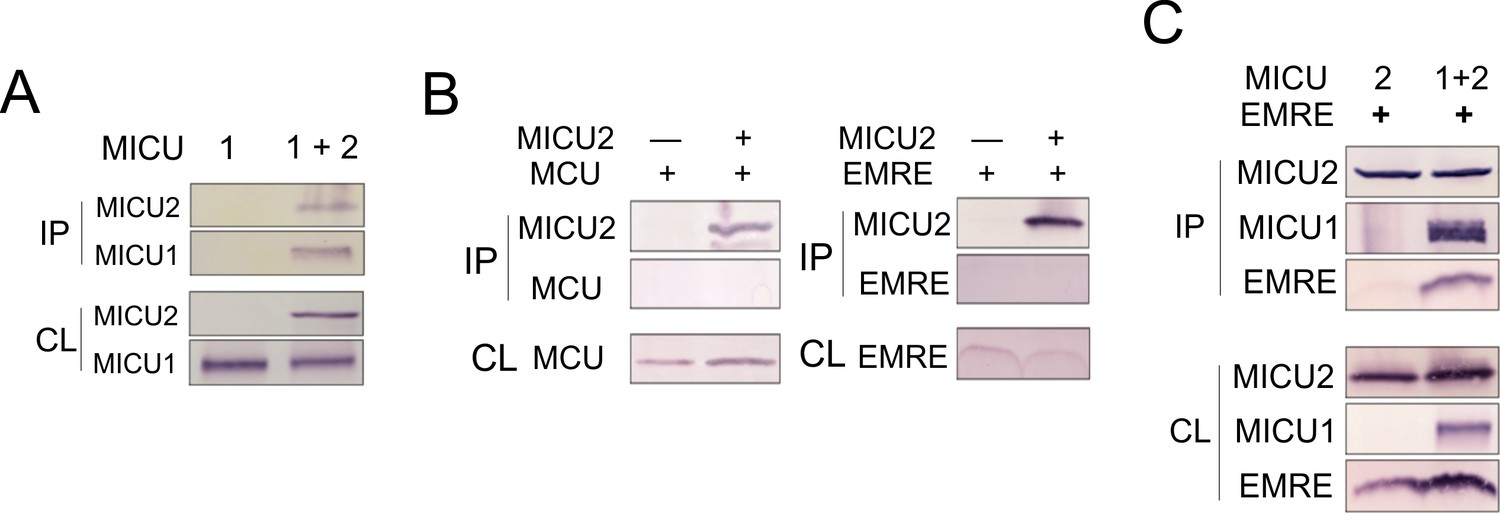
MICU2 interaction with other subunits in the uniporter complex.
(A) Co-IP experiment showing complex formation of MICU1 and MICU2. MICU2 was used as bait. (B) Co-IP experiments using immobilized MICU2 to pull down MCU or EMRE. (C) Immobilized MICU2 was used to pull down EMRE with MICU1 also expressed. For all Co-IP experiments, ME-KO cells were used, and proteins being expressed are indicated at the upper panel above the Western results. MICU1 and MICU2 were Flag and V5 tagged, respectively, and were detected with corresponding antibodies. IP: elution. CL: cell lysate.
Figure 6 with 1 supplement
Functional importance of the MICU1-EMRE interaction.
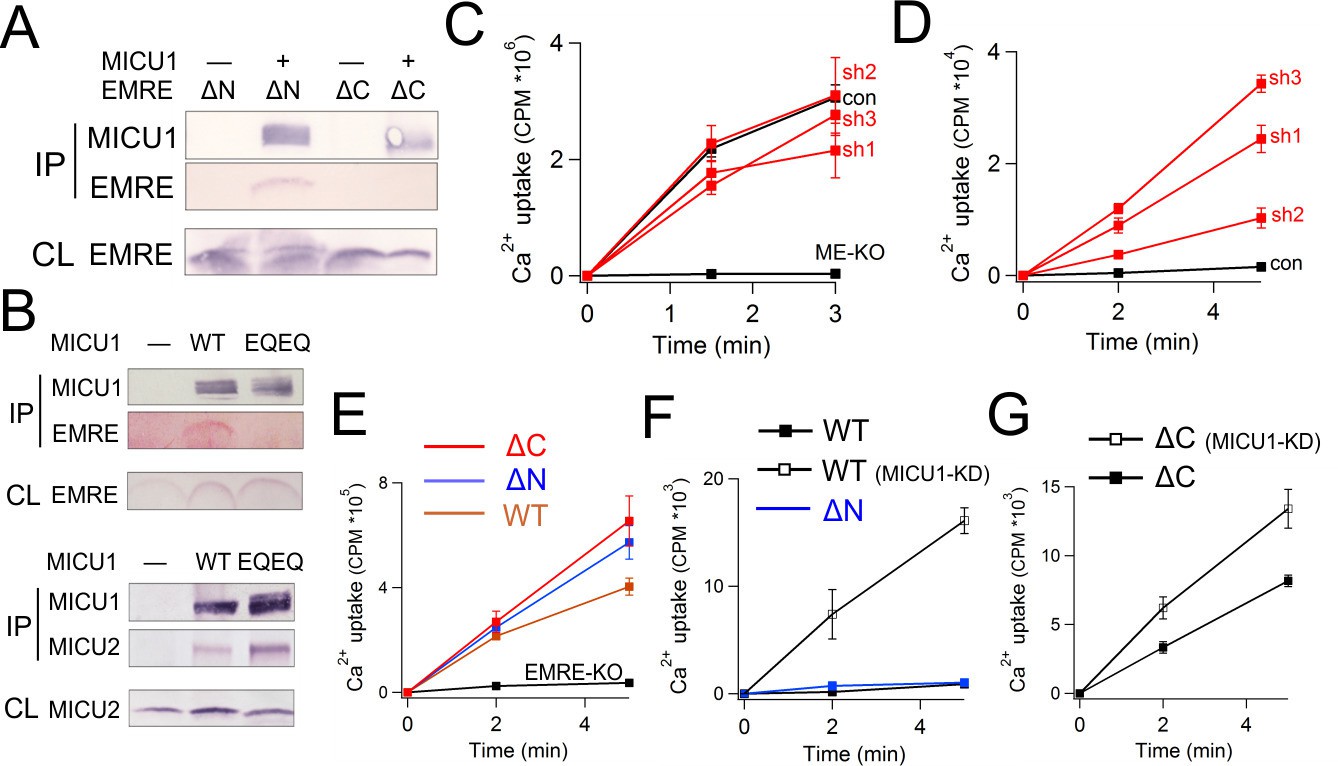
(A–B) Co-IP experiments with WT- or EQEQ-MICU1 (Flag-tagged) used to pull down WT or mutant EMRE proteins in ME-KO cells. MICU1 was detected using anti-Flag, MICU2 by anti-V5, and ΔN- or ΔC-EMRE by anti-C8. (C–D) The effect of MICU1 knockdown on mitochondrial Ca2+ uptake in WT HEK 293 cells at high (C) or low (D) Ca2+ conditions. Con: cells with no MICU KD. sh1-3 indicates three stable cell lines expressing distinct shRNAs against MICU1 mRNA. (E) Mitochondrial Ca2+ uptake (30 µM Ca2+) using untransfected EMRE-KO cells, or cells expressing WT-, ΔN-, or ΔC-EMRE as indicated. (F–G) Ca2+ flux (0.5 µM Ca2+) via MCU complexed with WT- or ΔN-EMRE (F), or ΔC-EMRE (G) in the presence or absence of stable MICU1 KD by shRNA2. Data shown in C–G represent mean ± s.e.m. of 3–4 independent measurements. See also Figure 6—figure supplement 1.
Figure 6—figure supplement 1
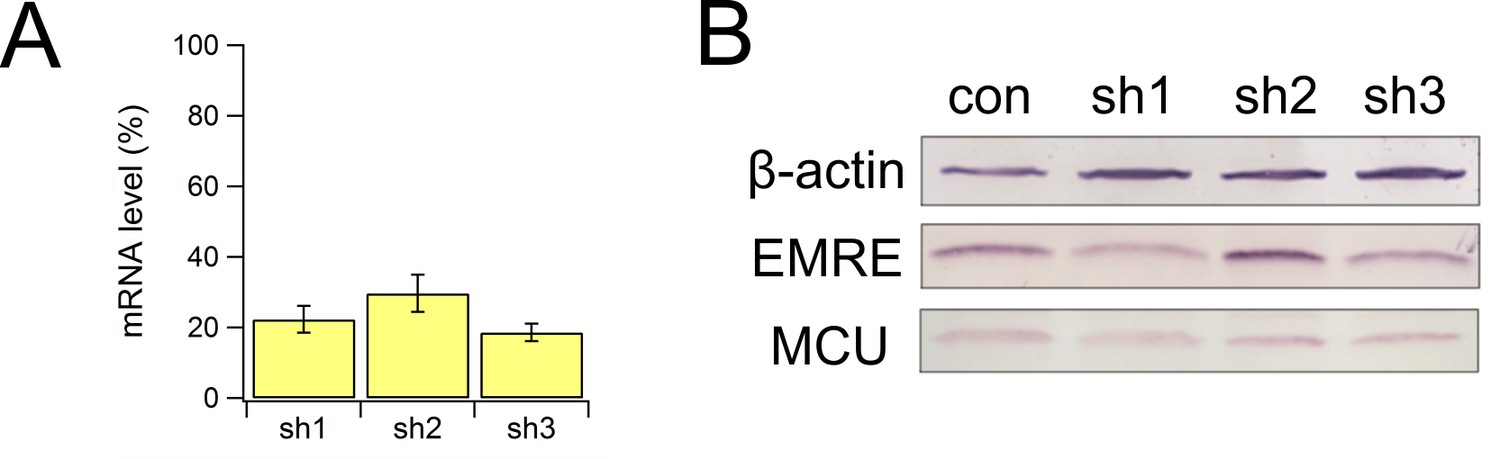
Biochemical characterization of MICU1 knockdown cells.
(A) the mRNA level of MICU1 in MICU1 knockdown cells compared with WT control, as determined by qPCR. (B) MCU and EMRE expression in these cells.
Figure 7
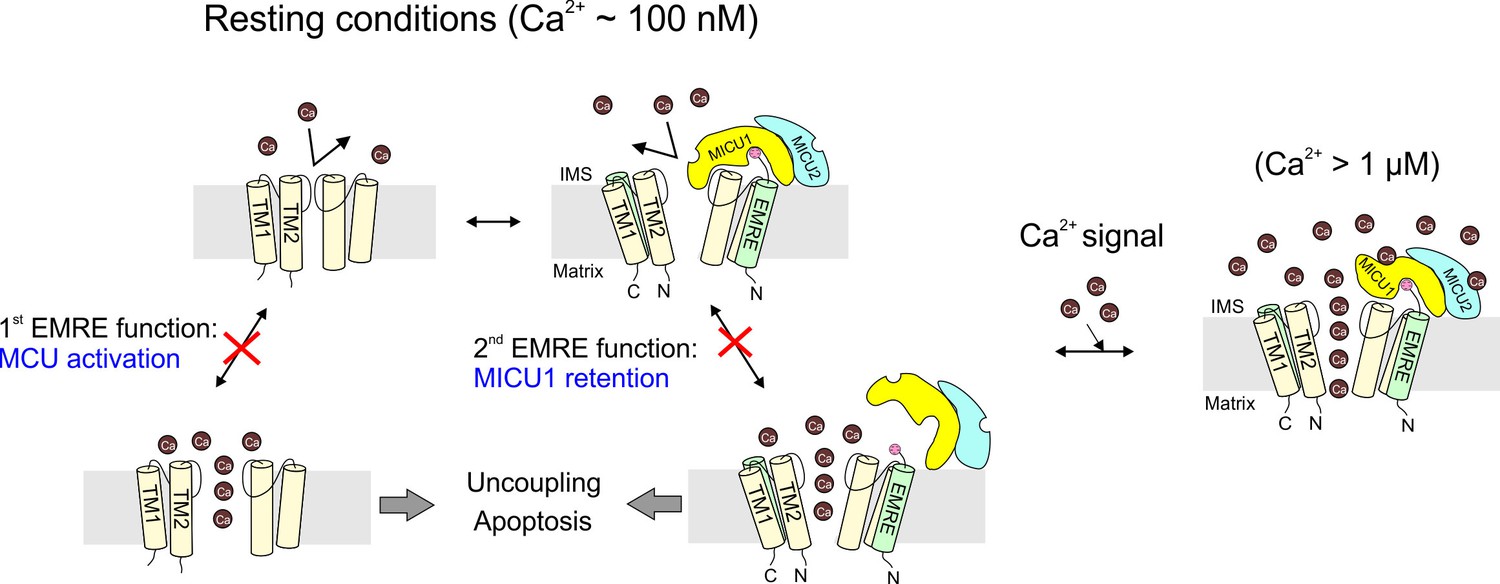
The physiological role of EMRE.
Cartoon summarizing main findings here, illustrating how the two functions of EMRE, MCU activation and MICU1 retention, together prevent Ca2+ leakage through the uniporter complex in resting cellular conditions.
Additional files
-
Supplementary file 1
Supplementary experimental procedure.
- https://doi.org/10.7554/eLife.15545.017
Download links
A two-part list of links to download the article, or parts of the article, in various formats.
Downloads (link to download the article as PDF)
Open citations (links to open the citations from this article in various online reference manager services)
Cite this article (links to download the citations from this article in formats compatible with various reference manager tools)
Dual functions of a small regulatory subunit in the mitochondrial calcium uniporter complex
eLife 5:e15545.
https://doi.org/10.7554/eLife.15545


