Small molecule proteostasis regulators that reprogram the ER to reduce extracellular protein aggregation
- The Scripps Research Institute, United States
- Howard Hughes Medical Institute, University of California, United States
- Translational Research Institute, United States
- Proteostasis Therapeutics Inc, United States
- The Scripps Research Institute Molecular Screening Center, United States
Figures
Figure 1 with 1 supplement
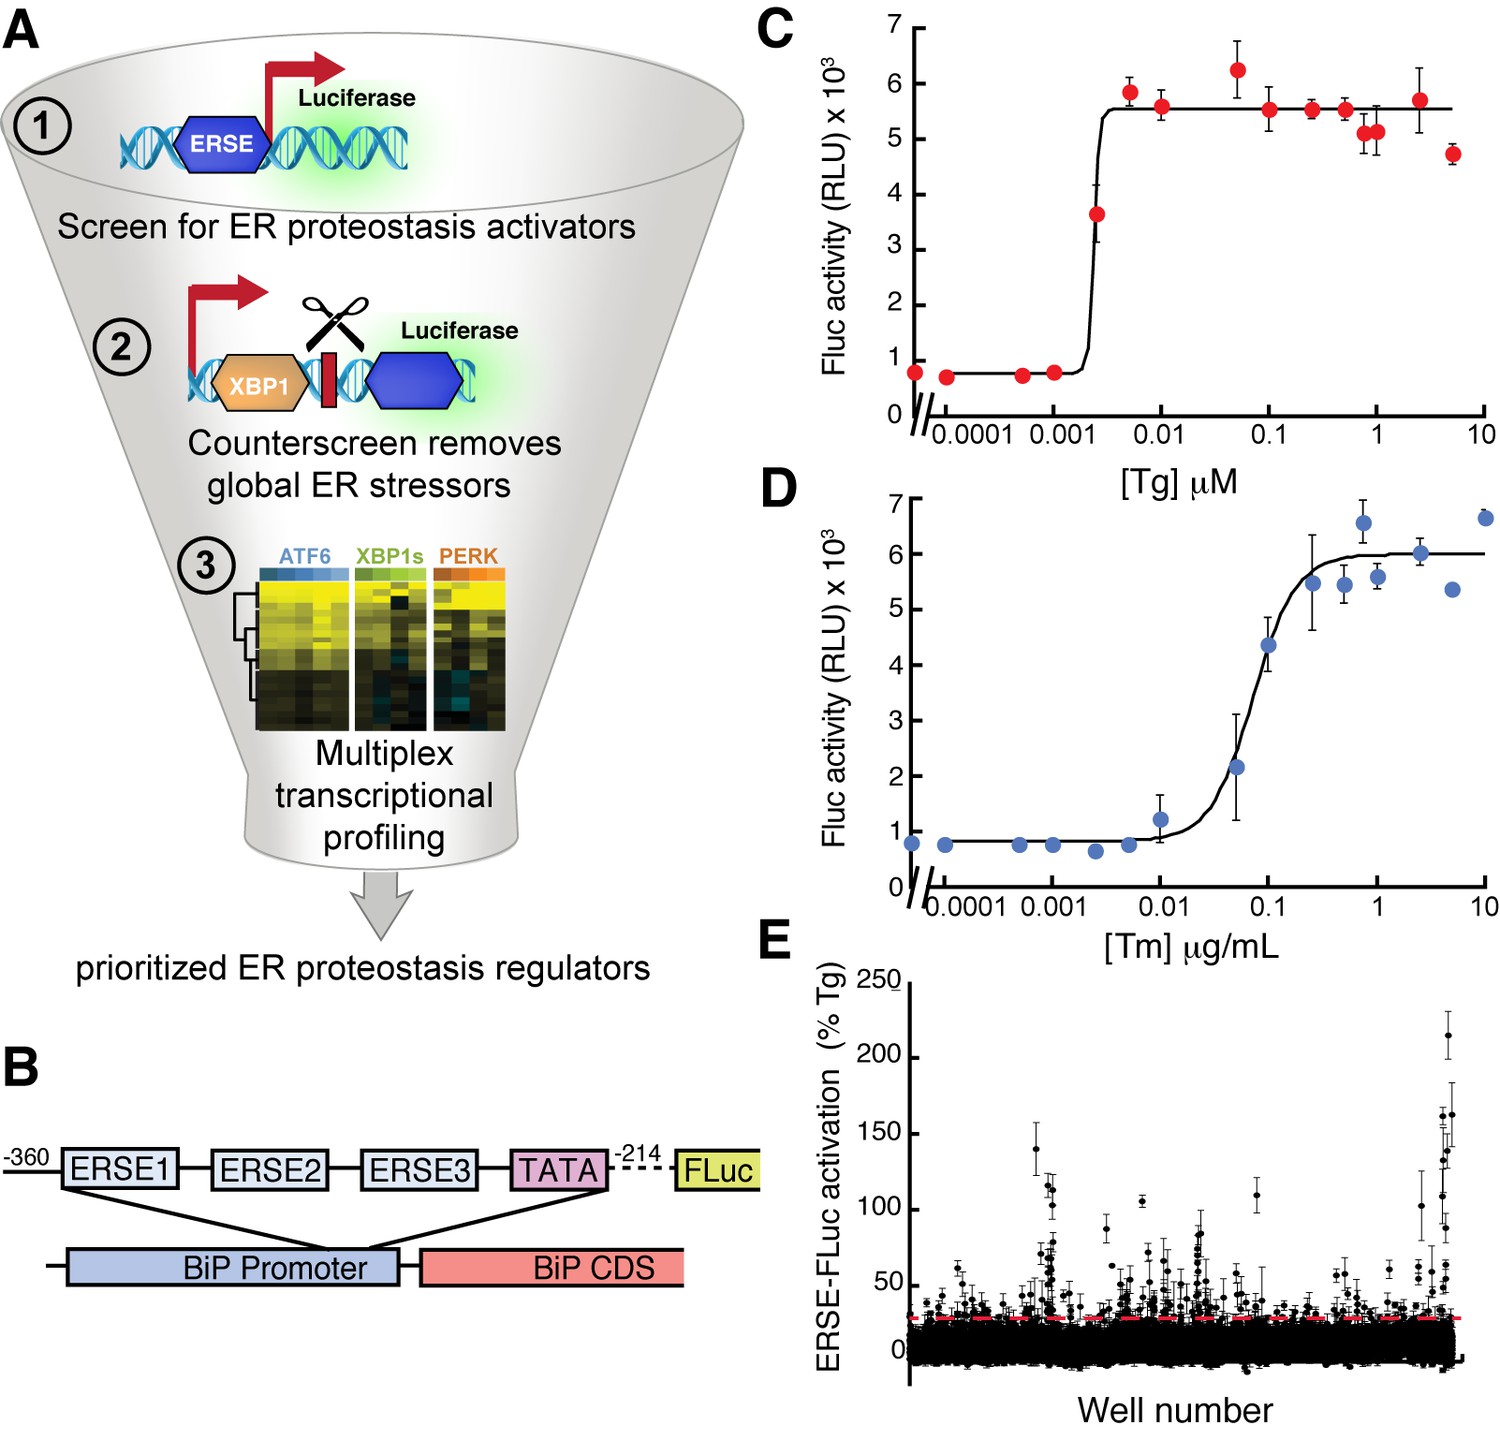
High-throughput screen to identify small molecule ER proteostasis regulators.
(A) Illustration showing the three-tiered screening strategy implemented to identify small molecules that preferentially activate the ATF6 transcriptional program. (B) Schematic of the ERSE-firefly luciferase (FLuc) reporter used in our HTS approach. (C) Activation of FLuc luminescence in HEK293T-Rex cells stably expressing ERSE-FLuc treated with the indicated concentrations of thapsigargin (Tg) for 18 hr. Error bars represent standard deviation for n = 3 replicates. (D) Activation of FLuc luminescence in HEK293T-Rex cells stably expressing ERSE-FLuc treated with the indicated concentrations of tunicamycin (Tm) for 18 hr. Error bars represent standard deviation for n = 3 replicates. (E) Plot showing ERSE-FLuc activation in HEK293T-Rex cells stably expressing ERSE-FLuc treated with the 13,748 small molecule ER proteostasis activators identified in the primary screen (6.8 µM; 18 hr). Luminescence is shown as % signal relative to Tg treatment (500 nM; 18 hr). Error bars show standard deviation for n = 3 replicates. The dashed red line shows 25.1% Tg activity.
Figure 1—figure supplement 1
Selectivity of the ERSE-FLuc reporter for the ATF6 UPR arm and highly represented chemical substructures in the top 281 ER proteostasis regulators.
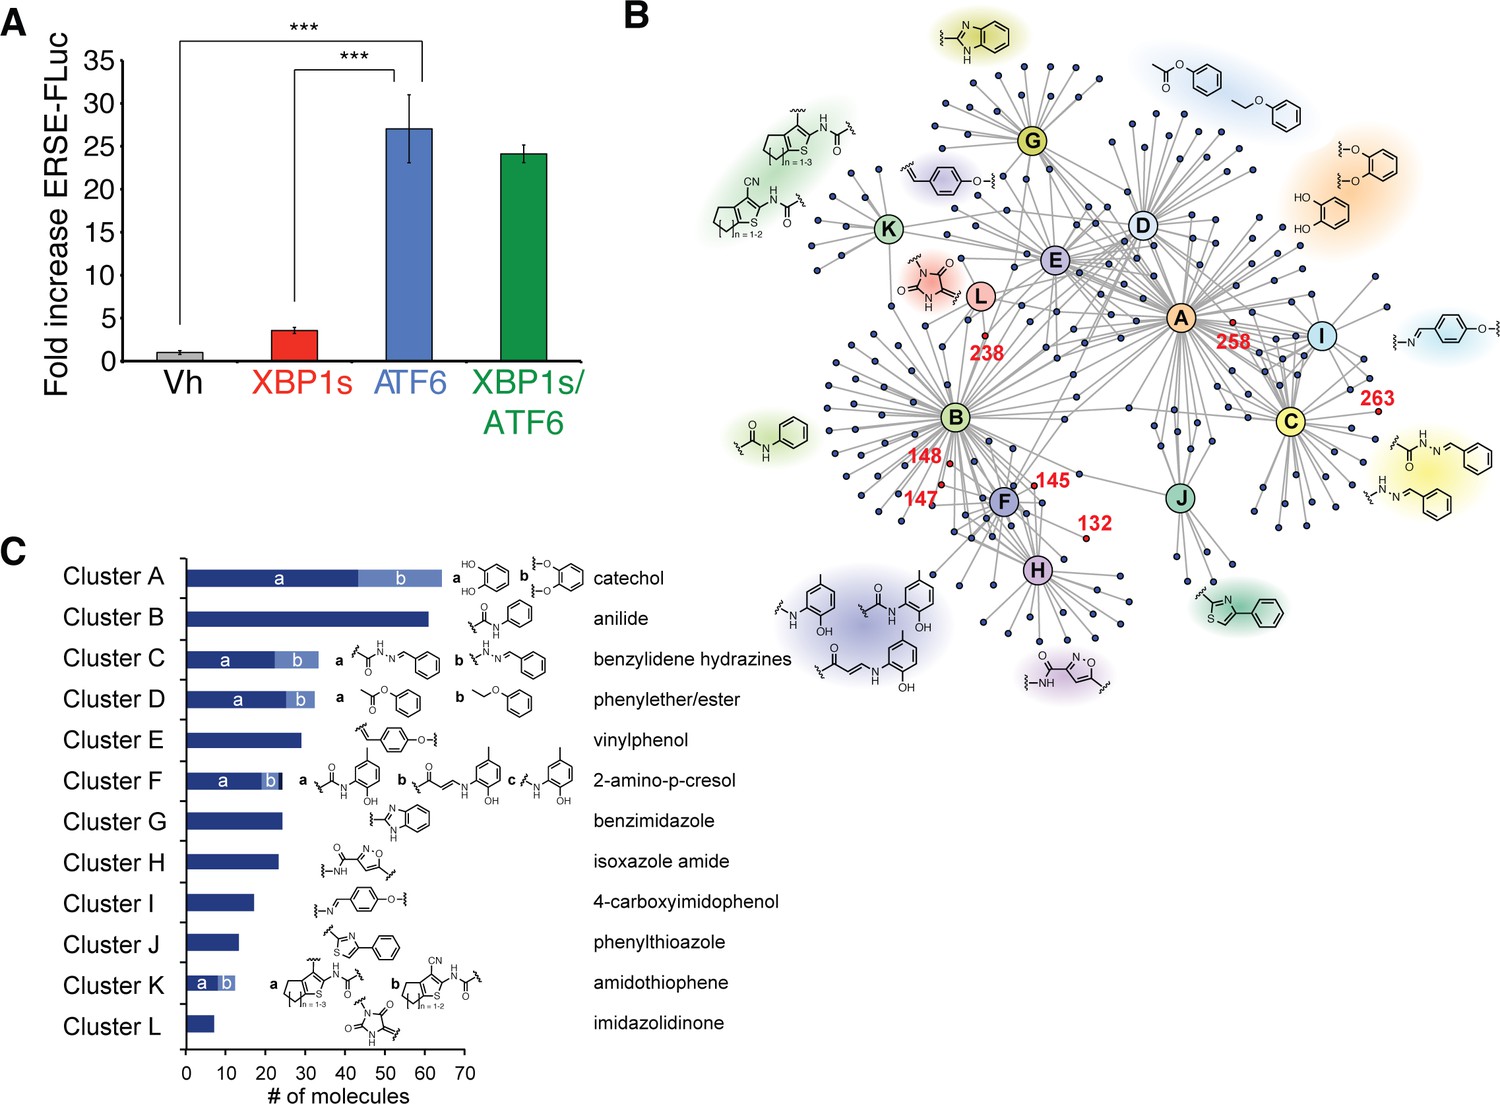
(A) Activation of ERSE-FLuc in HEK293DAX cells stably expressing trimethoprim (TMP)-regulated DHFR-ATF6 and doxycycline (dox) inducible XBP1s. Dox (1 µM; 12 h) was added to selectively activate XBP1s (red) and TMP (10 µM; 12 h) was added to activate DHFR-ATF6 (blue), or both were added to activate both XBP1s and ATF6 (green). Error bars show standard error for n = 3. ***p<0.001. (B) Network plot depicting the 12 overrepresented structural moieties (A-K) identified by performing a hierarchical maximum common substructure search of the top 281 small molecule ER proteostasis regulators. The 8 prioritized small molecule ER proteostasis regulators are shown in red. (C) Bar graph showing the prevalence of the 12 most represented chemical moieties identified in the top 281 ER proteostasis regulators. JKlustor was used for clustering and diversity analysis of these molecules, JChem 6.2.2, 2014, ChemAxon (http://www.chemaxon.com). A hierarchical maximum common substructure search of the top 281 small molecule ER proteostasis regulators was carried out using LibraryMCS within JKlustor. A substructure search of the 12 most represented moieties (including derivatives indicated by small letters “a” and “b” was then carried out in the 281 compound set to account for the presence of multiple moieties within the same compound. See the network plot in B for visualization of compounds containing multiple highly represented moieties.
Figure 2 with 1 supplement
Counterscreening and transcriptional profiling identifies preferential activators of the ATF6 transcriptional program.
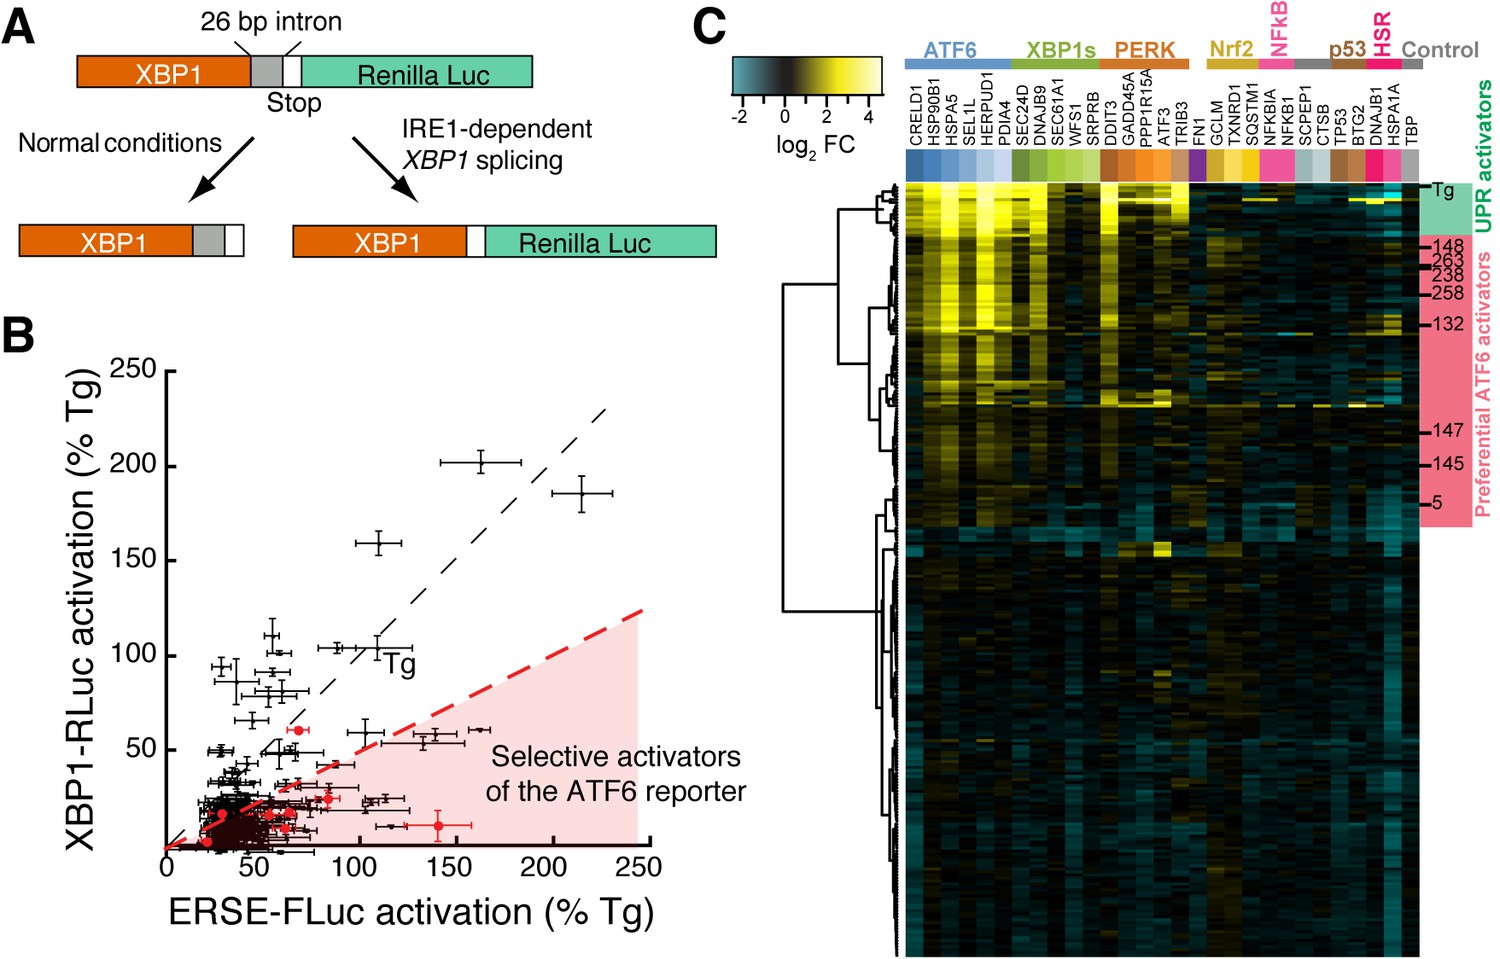
(A) Schematic of the XBP1-RLuc splicing reporter used to monitor activation of the IRE1/XBP1s arm of the UPR in HEK293T-Rex cells treated with small molecule ER proteostasis regulators. (B) Plot of ERSE-FLuc activation and XBP1-RLuc activation for the top 281 small molecule ER proteostasis regulators (6.8 µM; 18 hr) in HEK293T-Rex cells stably expressing ERSE-FLuc or XBP1-RLuc. Activation for each axis is shown as the percent signal relative to Tg treatment (500 nM; 18 hr). Prioritized ER proteostasis regulators described in Table 1 are shown in red. Error bars show standard deviation for n = 3. (C) Heat map of multiplex gene expression (MGE) profiling for the top 281 ER proteostasis regulator compounds. HEK293T-Rex cells were incubated with 10 μM of each proteostasis regulator for 6 hr, then cells were lysed and MGE profiling was performed. Genes probed constitute transcriptional targets preferentially induced by the ATF6, XBP1s or PERK arms of the UPR or other stress-responsive signaling pathways, as indicated. Heat map is shown with compounds clustered according to their activity. The green section represents global ER stressors while the pink sections represent molecules that preferentially activate the ATF6 transcriptional program. Prioritized ER proteostasis regulators identified in Table 1 are highlighted.
-
Figure 2—source data 1
Excel spreadsheet showing the structure, % activation ERSE-FLuc, and % activation XBP1-RLuc for the top 281 compounds identified through primary HTS screening and confirmation screening.
These data were used to prepare Figure 2B.
- https://doi.org/10.7554/eLife.15550.006
-
Figure 2—source data 2
Excel spreadsheet showing the Multiplex Gene Expression (MGE) expression data used to prepare Figure 2C and Figure 2—figure supplement 1C.
- https://doi.org/10.7554/eLife.15550.007
Figure 2—figure supplement 1

XBP1-RLuc reporter dose response and Tg-normalized MGE profiling for 281 top ER proteostasis regulators.
(A) Activation of Renilla luciferase (RLuc) luminescence in HEK293T-Rex cells stably expressing XBP1-RLuc treated with the indicated concentration of thapsigargin (Tg) for 18 hr. Error bars represent standard deviation for n = 3 replicates. The Z’ score is for [Tg] = 500 nM. (B) Activation of RLuc luminescence in HEK293T-Rex cells stably expressing XBP1-RLuc treated with the indicated concentration of tunicamycin (Tm) for 18 hr. Error bars represent standard deviation for n = 3 replicates. (C) Heat map of normalized gene expression from MGE profiling experiment shown in Figure 2C. The expression of the ATF6 (blue), XBP1s (green) and PERK (orange) target genes induced by the addition of the small molecule ER proteostasis regulators were normalized to the induction observed upon addition of Tg prior to plotting. The resulting heat map is shown with compounds clustered according to their activity. Molecules highlighted with green on the right are global UPR activators as they robustly induce genes regulated by the three arms of the UPR. Alternatively, molecules highlighted in pink preferentially activate ATF6.
Figure 3 with 2 supplements
Small molecule ER proteostasis regulators preferentially activate the ATF6 transcriptional program.
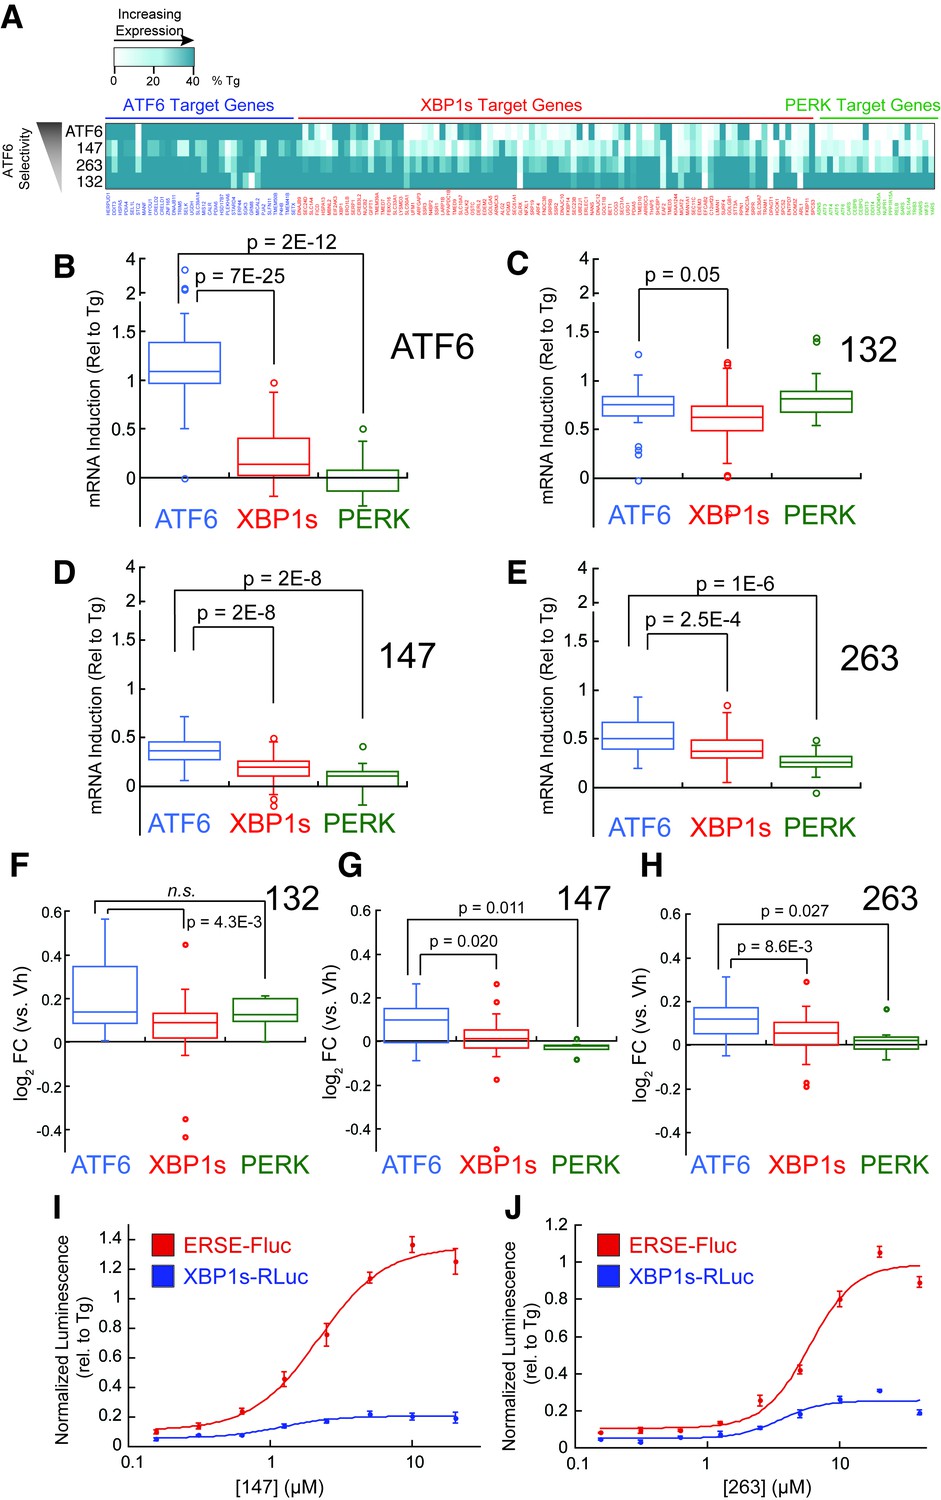
(A) Heat map showing the upregulation of ATF6 (blue), XBP1s (red) or PERK (green) target genes in the mRNA-Seq analysis of HEK293T-Rex cells treated with Tg (1 µM), 132 (10 µM), 147 (10 µM) or 263 (10 µM). Genes used in this analysis were selected from published reports indicating their selectivity for ATF6, XBP1s or PERK (Lu et al., 2004; Shoulders et al., 2013). The induction of each gene was normalized to the respective induction observed with the global UPR activator Tg and reported as % Tg induction. The expression of these target genes in the mRNA-Seq analysis of TMP-dependent DHFR-ATF6 activation in HEK293DAX cells is also shown. The data used to prepare this heat map is included in Figure 3—source data 1. (B–E) Box plots showing the relative activation of ATF6, XBP1s, and PERK genesets in HEK293DAX cells following TMP-dependent DHFR-ATF6 activation (B), or HEK293T-Rex cells treated with 132 (C), 147 (D) or 263 (E) from the data shown in Figure 3A. Differences in activation of the ATF6 geneset relative to the XBP1s or PERK genesets were confirmed by one-way ANOVA and the p-values of unpaired t-tests are shown. (F–H) Box plots comparing the average fold change at the protein levels of ATF6, XBP1s and PERK target sets in HEK293T-Rex cells treated with 10 µM 132 (F), 147 (G), or 263 (H) for 16 hr as observed in the proteomics analysis. The protein sets used here are the same as the genesets for the analysis of the RNA-Seq data (A–E). Differences in activation of the ATF6 target protein set relative to the XBP1s or PERK target protein sets were confirmed by one-way ANOVA and the p-values of unpaired t-tests are shown. The data used to prepare these graphs can be found in Figure 3—source data 1. (I–J) Plot showing the relative activation of the ERSE-FLuc (blue) and XBP1-RLuc (red) reporters in HEK293T-Rex cells treated with the indicated concentration of 147 (I) or 263 (J) for 15 hr. Error bars represent standard error for n = 3 replicates.
-
Figure 3—source data 1
Excel spreadsheet containing the RNA-seq and proteomic geneset data used to prepare Figure 3A–H.
This spreadsheet contains 7 tabs including a Table of Contents, Geneset mRNA ATF6, Geneset mRNA XBP1s, Geneset mRNA PERK, Geneset proteomics ATF6, Geneset proteomics XBP1s, and Geneset proteomics PERK.
- https://doi.org/10.7554/eLife.15550.011
Figure 3—figure supplement 1
mRNA-Seq analysis shows that ER proteostasis regulators do not globally activate the Heat Shock Response (HSR) or oxidative stress response pathways.
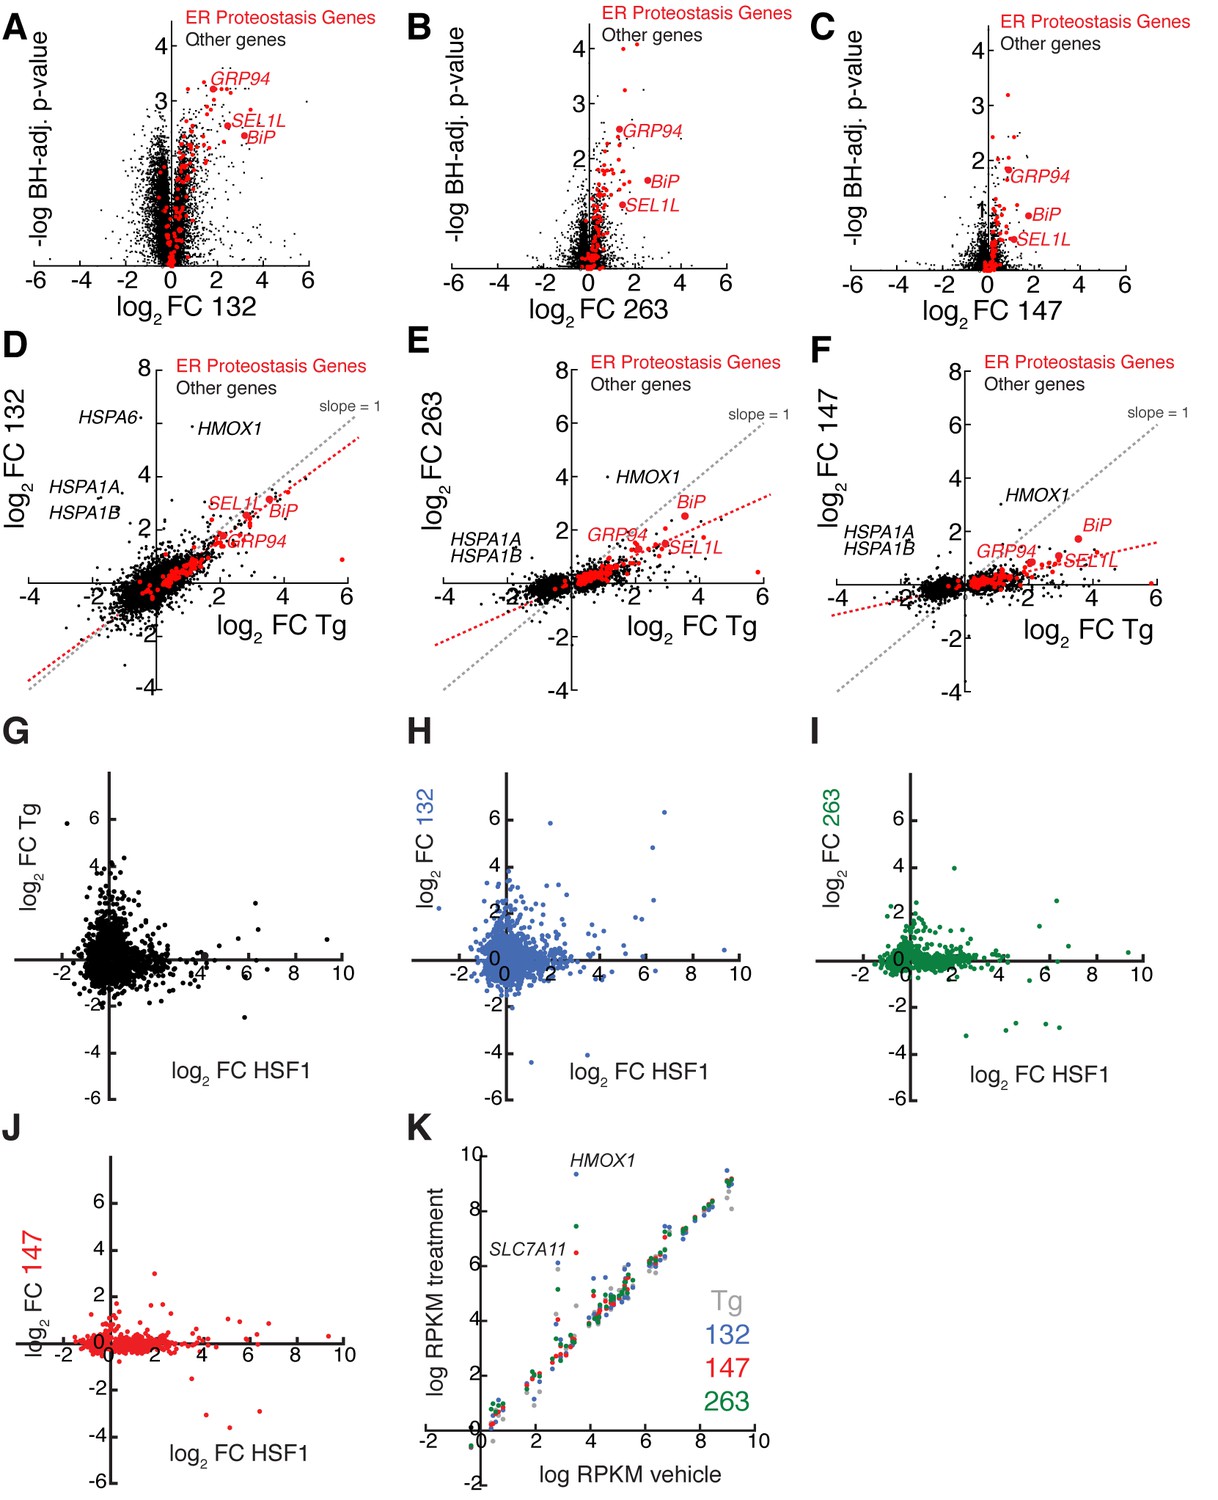
(A–C) Volcano plots showing log2 mRNA fold-change (FC, relative to vehicle-treated controls) versus -log10 Benjamini Hochberg (BH) adjusted p-value for mRNAs in HEK293T-Rex cells treated with small molecule ER proteostasis regulators 132 (A), 263 (B) or 147 (C) (all treated at 10 µM, 6 hr). The red symbols represent ER proteostasis factors as identified in the Source Data. The ATF6-regulated ER proteostasis genes BiP, GRP94, and SEL1L are highlighted. (D–F) Correlation of log2 mRNA fold change (FC) with Tg (1 µM; 6 hr; relative to vehicle-treated control) versus log2 mRNA FC with small molecule ER proteostasis regulators 132 (D), 263 (E) or 147 (F) in HEK293T-Rex cells (treated as indicated above). All genes displaying a significant change (BH adjusted p-value < 0.1) for Tg-treatment or treatment with small molecule ER proteostasis regulators are shown. The red symbols represent ER proteostasis factors, as identified in the Source Data. The gray dashed line reflects levels of gene induction observed following Tg-induced ER stress (slope = 1). The red dashed line corresponds to a least squares linear regression that reflects the induction of ER proteostasis gene induction observed following treatment with the indicated small molecule ER proteostasis regulator. Treatment with 132 (D) shows a clear correlation with Tg treatment indicating global UPR activation, while 263 (E) and 147 (F) do not globally increase transcription of Tg-regulated genes and show lower levels of select ER proteostasis gene induction. The ATF6-regulated ER proteostasis genes BiP, GRP94, and SEL1L are highlighted. G–J. Plot showing the log2 transcript fold change with Shield-1-dependent FKBP-HSF1 activation in HEK293T-Rex cells stably expressing FKBP-HSF1 (mRNA-seq analysis) (Ryno et al., 2014) versus log2 mRNA fold change with Tg (G) or small molecule ER proteostasis regulators 132 (H), 263 (I), or 147 (J) in HEK293T-Rex cells. The FKBP-HSF1 fusion protein is activated by the addition of the pharmacologic chaperone Shield-1, which stabilizes the active FKBP-HSF1 protein and promotes HSF1 transcriptional activity (Ryno et al., 2014). All gene expression data used in this analysis are included in the Source Data. Only genes whose expression is significantly altered (FDR < 0.1) by FKBP-HSF1 activation in HEK293T-Rex cells are shown. (K) Plot comparing the expression of oxidative stress target genes in HEK293T-Rex cells treated with vehicle or Tg (1 µM; grey), 132 (10 µM; blue), 147 (10 µM; red) or 263 (10 µM; green). The data are presented as log reads per kilobase million (RPKM) of vehicle versus log RPKM for the indicated treatment using the data from our mRNA-seq analysis. Genes that fall on the diagonal are not induced by small molecule treatment. Oxidative stress genes were selected from the SABIOsciences Oxidative Stress PCR Array.
-
Figure 3—figure supplement 1—source data 1
Excel spreadsheet describing the RNA-seq data used to prepare Figure 3—figure supplement 1A–K.
This spreadsheet contains 4 tabs including a Table of Contents, RNA-seq FC Tg 132 147 263 ATF6, HSF1 genes, and oxidative stress genes.
- https://doi.org/10.7554/eLife.15550.013
Figure 3—figure supplement 2
ER proteostasis regulators induce ATF6 targets at the protein level and time-dependence of ATF6 and XBP1s target activation.
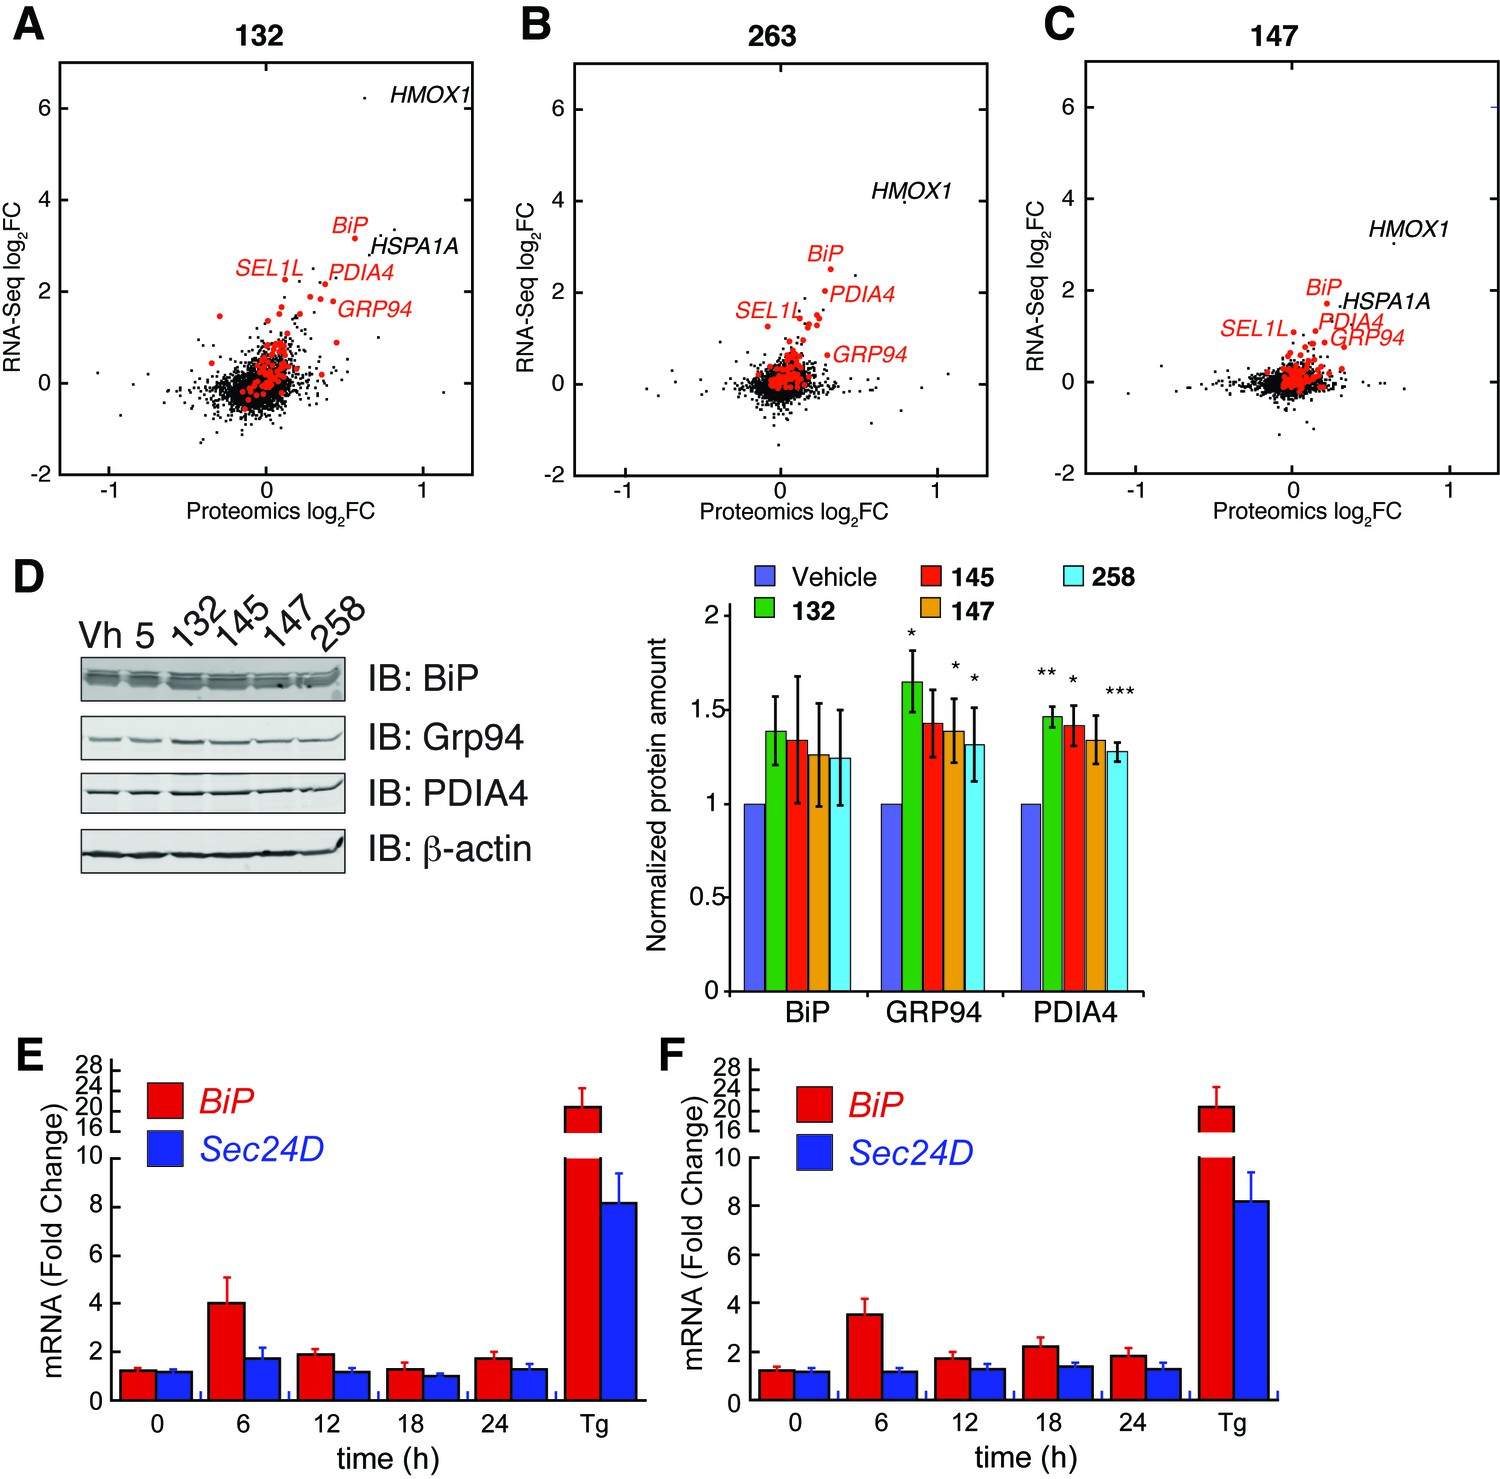
(A–C) Correlation between mRNA fold changes (FC) and protein fold changes for treatment of HEK293T-Rex cells with compounds 132 (A), 263 (B), and 147 (C). mRNA changes were measured by RNA-Seq after 10 µM compound treatment for 6 hr. Protein changes were measured by Tandem-Mass-Tag-based quantitative proteomics after 10 µM compound treatment for 16 hr. ER proteostasis genes are marked in red and select ATF6 targets are labeled. (D) Representative immunoblot and quantification of select proteins regulated by the ATF6 transcriptional program assessed by quantitative Western blot. HEK293T-Rex cells were treated with ER proteostasis regulators (10 µM) for 16 hr and whole cell lysates were separated by SDS-PAGE and immunoblotting was carried out using antibodies against the indicated proteins. Quantification was performed on an Odyssey Licor. Error bars represent standard error for n = 3 replicates. *p<0.05; **p<0.01; ***p<0.001 (E–F) Time course of induction of BiP (a gene regulated by the ATF6 transcriptional program) and SEC24D (a gene regulated by the XBP1s transcriptional program) mRNA as measured by qPCR in HEK293T cells treated for the indicated times with 10 µM of 263 (E) or 147 (F). Error bars represent the standard error for n > 3 biological replicates.
-
Figure 3—figure supplement 2—source data 2
Excel spreadsheet describing the whole cell proteomic data used to prepare Figure 3—figure supplement 2A–C.
RNA-seq data for genes identified by proteomics is also shown. This spreadsheet contains 4 tabs including a Table of Contents, 132 Proteomics RNA-Seq, 263 Proteomics RNA-seq, and 147 Proteomics RNA-seq.
- https://doi.org/10.7554/eLife.15550.015
Figure 4 with 1 supplement
ER proteostasis regulators depend on endogenous ATF6 activation.
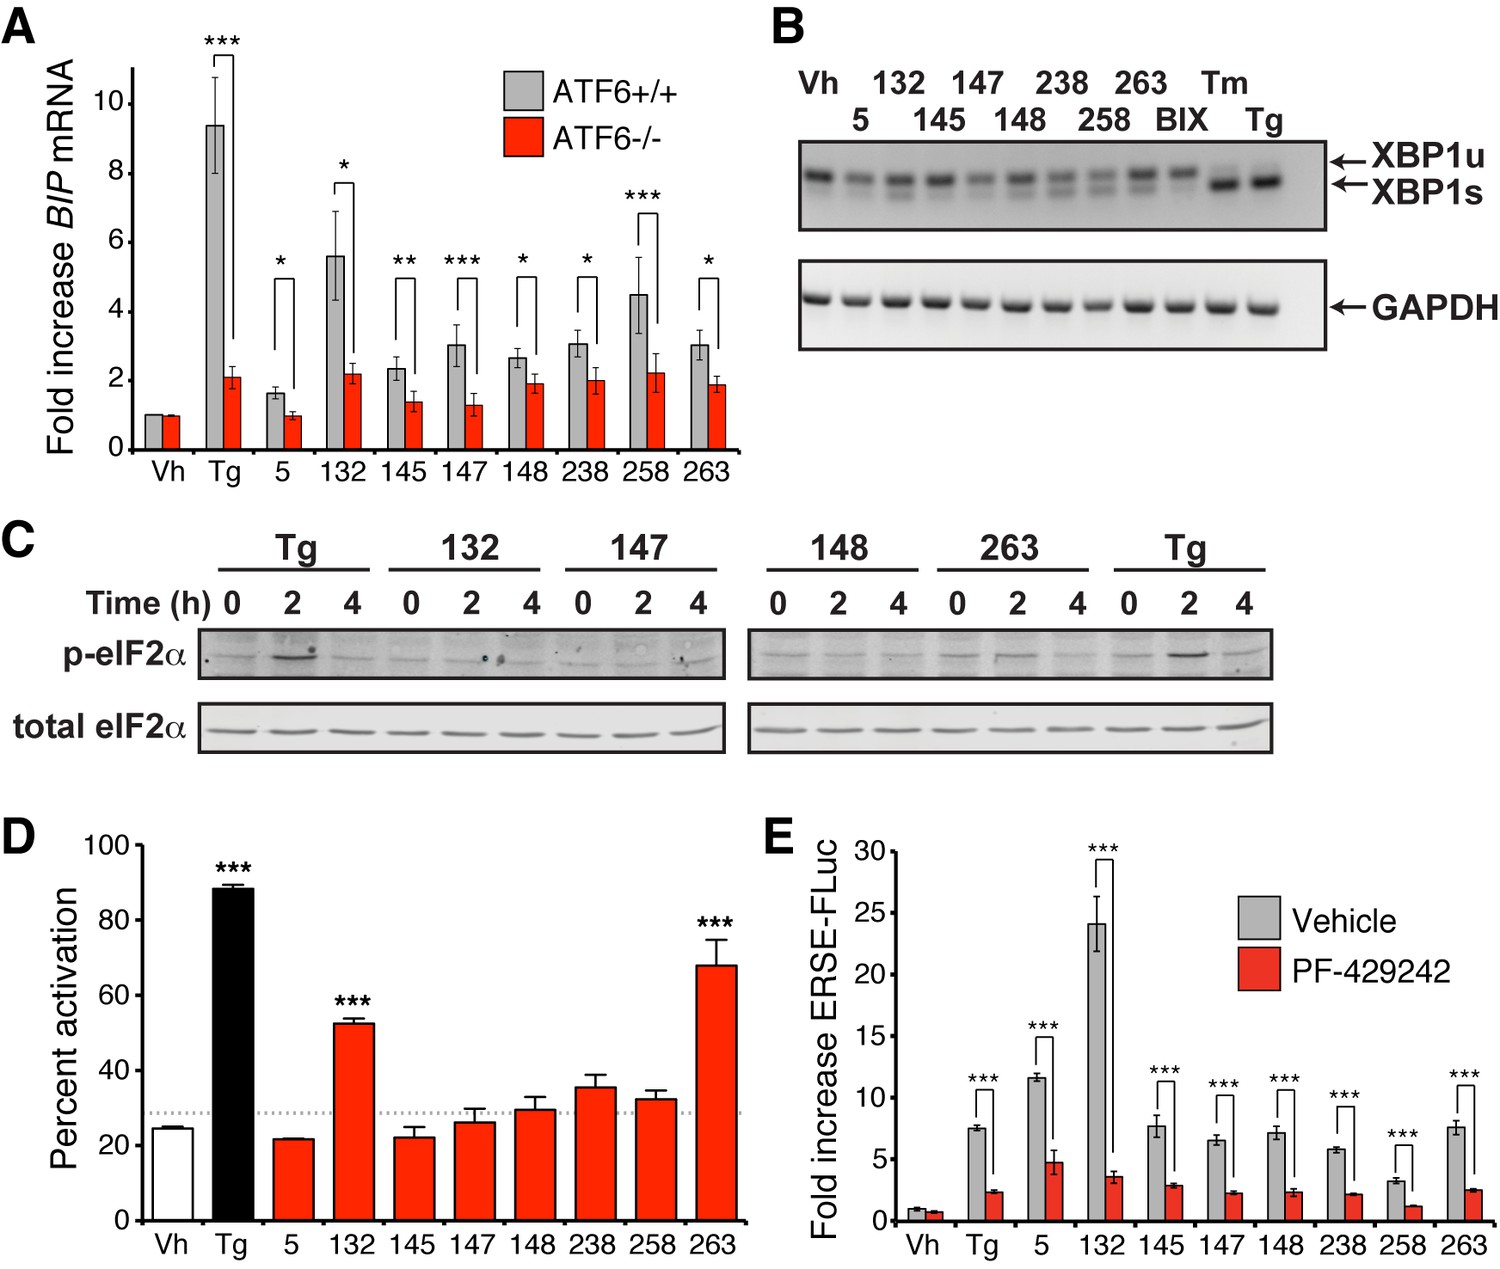
(A) BIP mRNA measured by qPCR in ATF6+/+ and ATF6-/- MEFs treated with the indicated small molecule ER proteostasis regulators (10 µM; 6 hr). Error bars show standard error for n > 3. *p<0.05; **p<0.01; ***p<0.001. (B) Gel showing XBP1 splicing in HEK293T cells measured by RT-PCR. RNA was extracted from cells treated with global ER stressors Tg (500 nM) or tunicamycin (Tm; 1 µg/mL) or 10 µM of the indicated small molecule ER proteostasis regulator for 3 hr. The small molecule BIX is included as a control. After generation of cDNA, primers flanking the XBP1 splicing site were used to amplify the longer unspliced (XBP1u) or 26-nt shorter spliced (XBP1s) segment. (C) Immunoblot showing eIF2α phosphorylation in HEK293T cells treated with Tg (500 nM) or 10 µM of the indicated small molecule ER proteostasis regulator for the indicated time. (D) Activation of ATF6 as measured by nuclear localization of GFP-ATF6. U2OS-GFP-ATF6 cells were treated with the top 8 small molecule ER proteostasis regulators (10 µM; 5 hr) or Tg (100 nM; 5 hr) and subcellular localization of GFP was assessed by confocal microscopy (representative images are shown in Figure 4—figure supplement 1A). The nuclear:ER ratio of GFP signal corresponding to activation of GFP-ATF6 was calculated by comparing vehicle to Tg treatment. Error bars show standard error for n = 3 replicates. Dotted line shows mean plus three standard deviations from vehicle treated controls (28.65%). ***p<0.001 using one way ANOVA followed by Tukey’s Multiple comparison test (compared to vehicle). (E) Plot showing ERSE-FLuc activation in HEK293T-Rex cells treated with the top 8 small molecule ER proteostasis regulators (10 µM; 18 hr) in the presence (red bars) or absence (grey bars) of the S1P inhibitor PF-429242 (10 µM; 18 hr). Cells treated with Tg (500 nM; 18 hr) are shown as a control. Error bars show standard error for n = 3. ***p<0.001.
Figure 4—figure supplement 1
Select ER proteostasis regulators show proteolytic processing and nuclear translocation of ATF6.
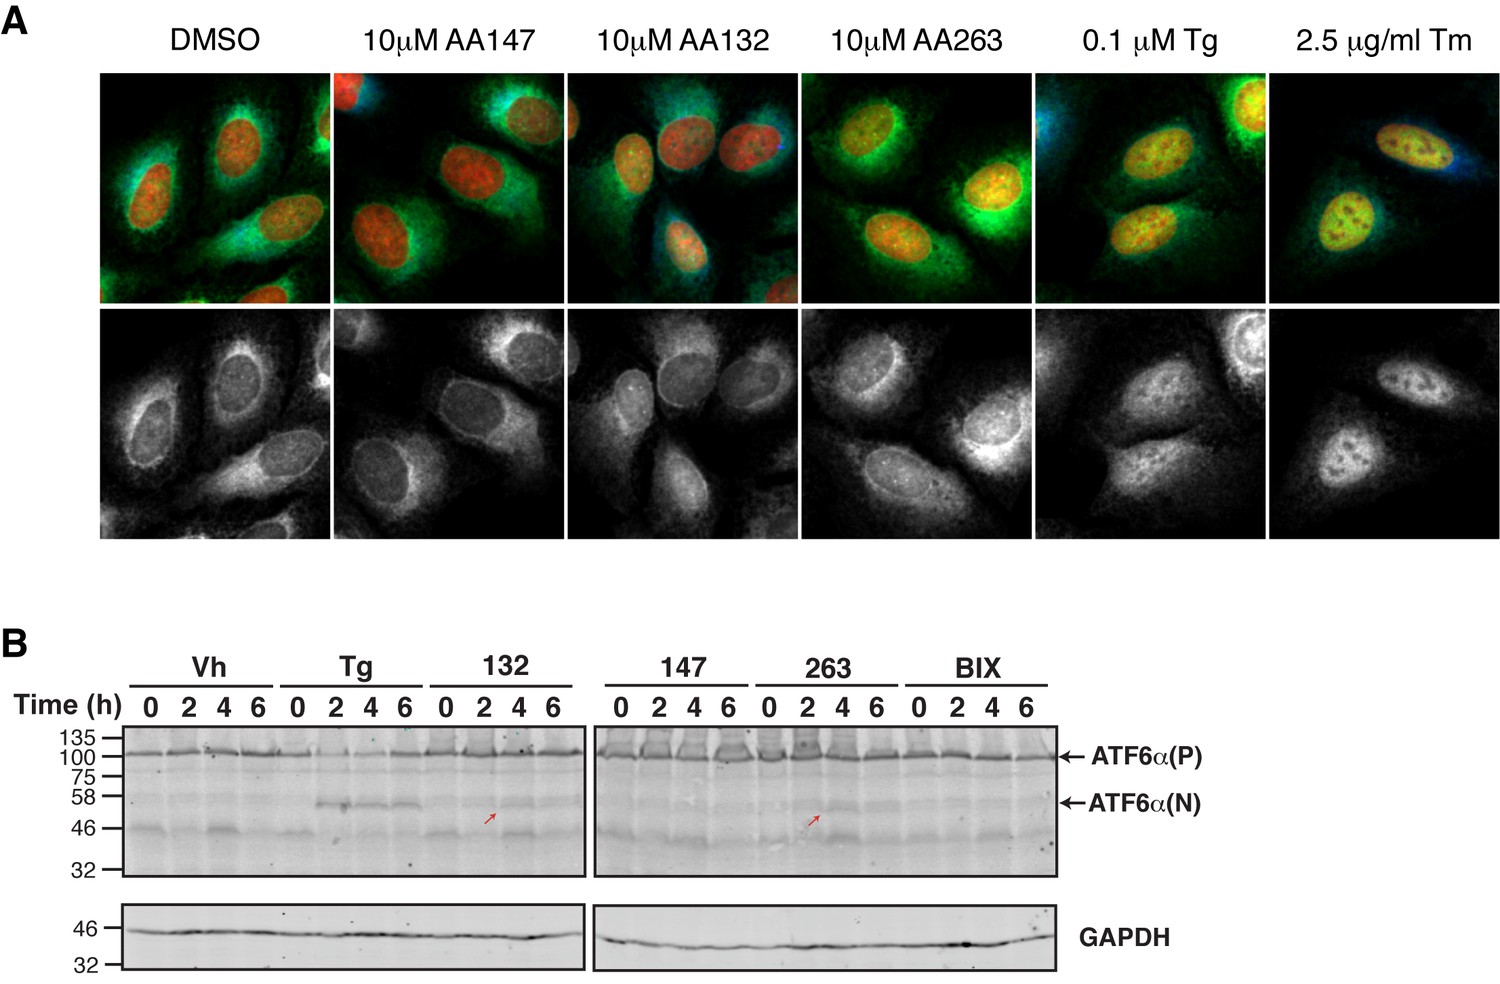
(A) Representative images of U2OS-GFP-ATF6 cells incubated with Tg (100 nM), Tm (2.5 µg/mL), or the indicated ER proteostasis regulators (10 μM) for 5 hr then imaged by confocal microscopy. GFP-ATF6 is shown in green in the upper merged images and in grayscale beneath. The ER is marked with GRP94 (blue) while nuclear DNA is marked with DAPI (red). Yellow in the merged image indicates translocation of GFP-ATF6 to the nucleus. Quantification of nuclear ATF6 localization from images such as these are shown in Figure 4D. (B) Immunoblot showing ATF6 processing from full-length (ATF6α(P)) to the cleaved ATF6α(N)) in HEK293T cells treated with Tg (500 nM) or 10 µM of the indicated small molecule ER proteostasis regulators for the indicated time. The small molecule BIX is included as a control. The red arrows show the active ATF6 transcription factor domain that results from S1P/S2P cleavage.
Figure 5 with 1 supplement

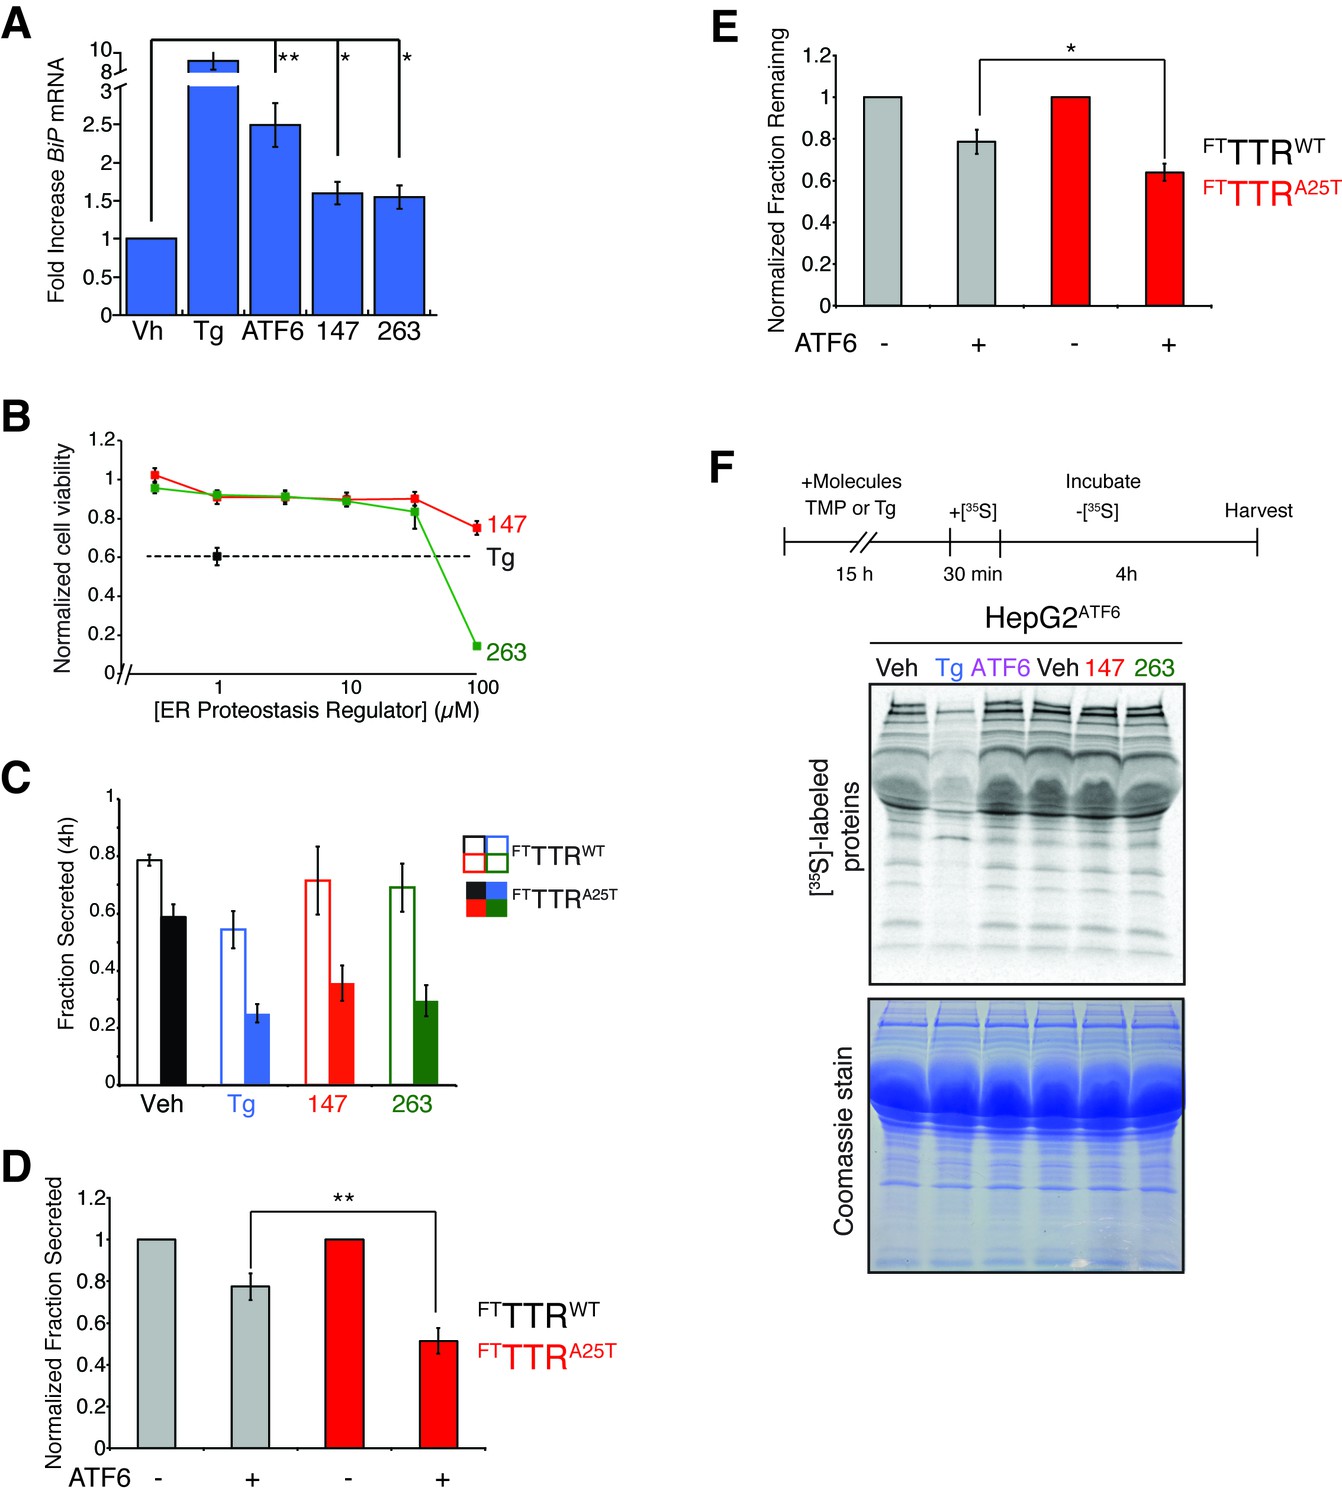
Small molecule ER proteostasis regulators reduce secretion of destabilized amyloidogenic FTTTRA25T from HepG2 cells.
(A) Representative autoradiogram of [35S]-labeled FTTTRWT or FTTTRA25T in the lysate (Lys) and media (Med) of HepG2ATF6 cells pretreated for 15 hr with 10 µM small molecule 147 or 263, or 1 µM Tg, incubated with [35S] for 30 min, and then incubated in fresh non-radioactive media for 0 or 4 hr. The experimental paradigm is shown above. (B) Quantification of the normalized fraction of FTTTRWT (open bars) or FTTTRA25T (colored bars) secreted following a 4 hr chase in HepG2ATF6 cells pretreated for 15 hr with Tg (1 µM; blue) or 10 µM small molecule 147 (red) or 263 (green). Fraction secreted was calculated using the equation: fraction secreted = [extracellular [35S]-TTR signal at t=4h / (extracellular [35S]-TTR signal at t=0h + intracellular [35S]-TTR signal at t=0h)]. Normalized fraction secreted was calculated relative to vehicle-treated controls using the equation: normalized fraction secreted = fraction secreted treatment / fraction secreted vehicle. Representative autoradiograms are shown in Figure 5A. Raw fraction secreted is shown in Figure 5—figure supplement 1C. Error bars show standard error for n = 4 replicates; *p<0.05, ***p<0.001. (C) Quantification of the normalized fraction of FTTTRWT (open bars) or FTTTRA25T (colored bars) remaining (lysate + media) following a 4 hr chase in HepG2ATF6 cells pretreated for 15 hr with Tg (1 µM; blue) or 10 µM small molecule 147 (red) or 263 (green). Fraction remaining was calculated using the equation: [(extracellular [35S]-TTR signal at t=4h + intracellular [35S]-TTR signal at t=4h) / (extracellular [35S]-TTR signal at t=0h + intracellular [35S]-TTR signal at t=0h)]. Normalized fraction remaining was calculated relative to vehicle-treated controls using the equation: normalized fraction remaining = fraction remaining treatment / fraction remaining vehicle. Representative autoradiograms are shown in Figure 5A. Error bars show standard error for n = 4 replicates; *p<0.05, **p<0.01, ***p<0.001. (D) Quantification for normalized total [35S]-labeled proteins secreted from HepG2ATF6 cells following 15 hr pretreatment with 1 µM Tg (blue), TMP (10 µM)-dependent DHFR-ATF6 activation (purple), or 10 µM small molecule ER proteostasis regulators 147 (red) or 263 (green). The experimental protocol and a representative autoradiogram for this experiment is shown in Figure 5—figure supplement 1F. The recovery of [35S] labeled proteins is normalized to the vehicle-treated control. Error bars show standard error for n = 4 replicates. ***indicates p<0.001.
Figure 5—figure supplement 1
ER proteostasis regulators reduce secretion of destabilized amyloidogenic TTRA25T from HepG2 cells.
(A) Plot showing the fold increase of BiP mRNA in HepG2ATF6 cells treated with Tg (1 µM), TMP (activates DHFR-ATF6; 10 µM) or 10 µM of the indicated small molecule ER proteostasis regulators. Error bars show standard error for n = 3. *p<0.05, **p<0.01. (B) Toxicity from 48 hr incubation of HepG2ATF6 cells with Tg (1 µM) or small molecules 147 or 263 at the indicated concentration as read by CellTiter-Glo. Error bars represent standard error from n = 6 replicates. (C) Quantification of the fraction FTTTRWT (open bars) or FTTTRA25T (colored bars) secreted following a 4 hr chase in HepG2ATF6 cells pretreated for 15 hr with Tg (1 µM; blue) or 10 µM small molecule 147 (red) or 263 (green). Fraction secreted was calculated using the equation: fraction secreted = [extracellular [35S]-TTR signal at t / (extracellular [35S]-TTR signal at t=0 + intracellular [35S]-TTR signal at t=0)]. Representative autoradiograms are shown in Figure 5A. Error bars show standard error for n = 4 replicates. (D) Quantification of normalized fraction secreted of FTTTRWT (grey) or FTTTRA25T (red) from HepG2ATF6 cells following 15 hr pretreatment with TMP (10 µM; activates DHFR-ATF6). Fraction secreted was calculated using the equation: fraction secreted = [extracellular [35S]-TTR signal at t / (extracellular [35S]-TTR signal at t=0 + intracellular [35S]-TTR signal at t=0)]. Normalized fraction secreted was calculated relative to vehicle-treated controls using the equation: normalized fraction secreted = fraction secreted treatment / fraction secreted vehicle. Error bars show standard error for n = 9. **p<0.01. (E) Quantification of normalized fraction remaining of FTTTRWT (grey) or FTTTRA25T (red) from HepG2ATF6 cells following 15 hr pretreatment with TMP (10 µM; activates DHFR-ATF6). Fraction remaining was calculated using the equation: [(extracellular [35S]-TTR signal at t + intracellular [35S]-TTR signal at t) / (extracellular [35S]-TTR signal at t=0 + intracellular [35S]-TTR signal at t=0)]. Normalized fraction remaining was calculated relative to vehicle-treated controls using the equation: normalized fraction remaining = fraction remaining treatment / fraction remaining vehicle. Error bars show standard error for n = 9. *p<0.05. (F) Representative autoradiogram and Coomassie images of total [35S]-labeled protein secreted from HepG2ATF6 cells following 15 hr pretreatment with 1 µM Tg, TMP (10 µM)-dependent DHFR-ATF6 activation, or 10 µM small molecule ER proteostasis regulators 147 or 263. The experimental protocol used for this experiment is shown above. Quantification of this experiment is shown in Figure 5D.
Figure 6 with 1 supplement
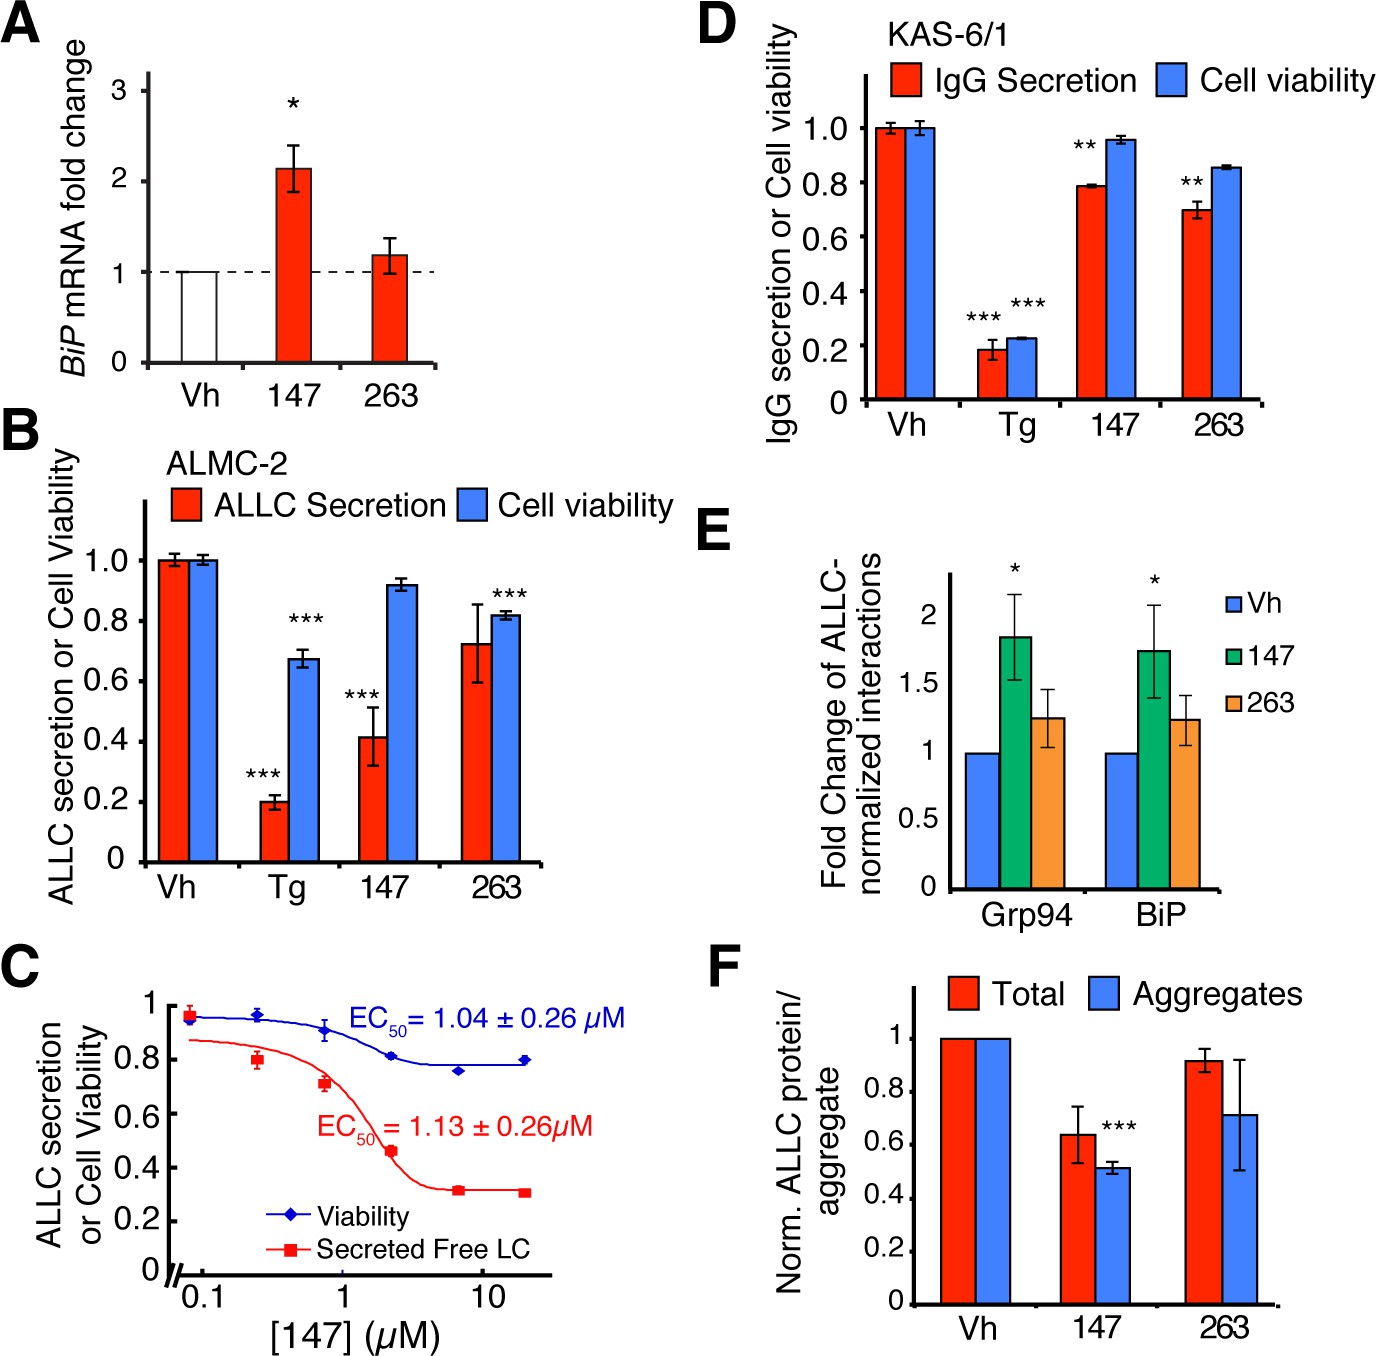
Small molecule ER proteostasis regulators reduce secretion of destabilized, amyloidogenic immunoglobulin light chains from AL patient-derived plasma cells.
(A) qPCR analysis of BiP expression in ALMC-2 cells treated for 6 hr with 10 µM of the indicated small molecule ER proteostasis regulators. Error bars show standard error for n = 3 replicates. *p< 0.05. (B) Graph showing relative media levels of ALLC measured by ELISA (red) and cellular viability (blue) of ALMC-2 cells pretreated with 10 µM of the indicated small molecule ER proteostasis regulators. Cells treated with 500 nM Tg are shown as a control. Error bars show standard error for n > 6 replicates. ***p<0.001. (C) Dose response curves of reduction in ALLC secretion from ALMC-2 cells after 147 treatment. ALMC-2 cells were pretreated for 15 hr, and subsequently the media was exchanged and conditioned on the cells for 2 hr. Secreted ALLC concentration was measured by ELISA using an antibody directed against free λ LC (red). Cell viability was measured by CellTiter-Glo (blue). Error bars represent standard error for n = 3 replicates. Data was fit to four parameter logistic functions to calculate EC50 values. (D) Graph showing relative media levels of IgG measured by ELISA (red) and cellular viability (blue) of KAS-6/1 cells treated with 10 µM of the indicated small molecule ER proteostasis regulators. Cells treated with 500 nM Tg are shown as a control. Error bars show standard error for n = 3 replicates. **p<0.01, ***p<0.001. (E) Quantification of ALLC immunopurifications from ALMC-2 cells after treatment with the indicated ER proteostasis regulator (10 µM; 16 h) and in situ cross-linking. The relative recovery of GRP94 and BiP in each sample normalized to the recovered ALLC is shown. A representative immunoblot is shown in Figure 6—figure supplement 1D. Error bars show standard error for n = 4 replicates. *p<0.05. (F) Quantification of ALLC aggregates in conditioned media prepared on ALMC-2 cells pretreated with the indicated ER proteostasis regulator (10 µM; 16 hr). After pretreatment, media were exchanged and the volume adjusted to account for decreases in cell viability with several compounds. After conditioning for 8 hr, the media were collected and then heated to 55°C for 8 hr to induce ALLC aggregation. Quantification of the total (red) and aggregate (blue) ALLC amounts are shown. Error bars show standard error for n > 3 replicates. *p<0.05, **p<0.01, ***p<0.001. Blue Native (BN) PAGE/Immunblots of the conditioned media are shown in Figure 6—figure supplement 1H. Quantification of ALLC aggregates in conditioned media pretreated with additional ER proteostasis regulator compounds is shown in Figure 6—figure supplement 1I.
Figure 6—figure supplement 1
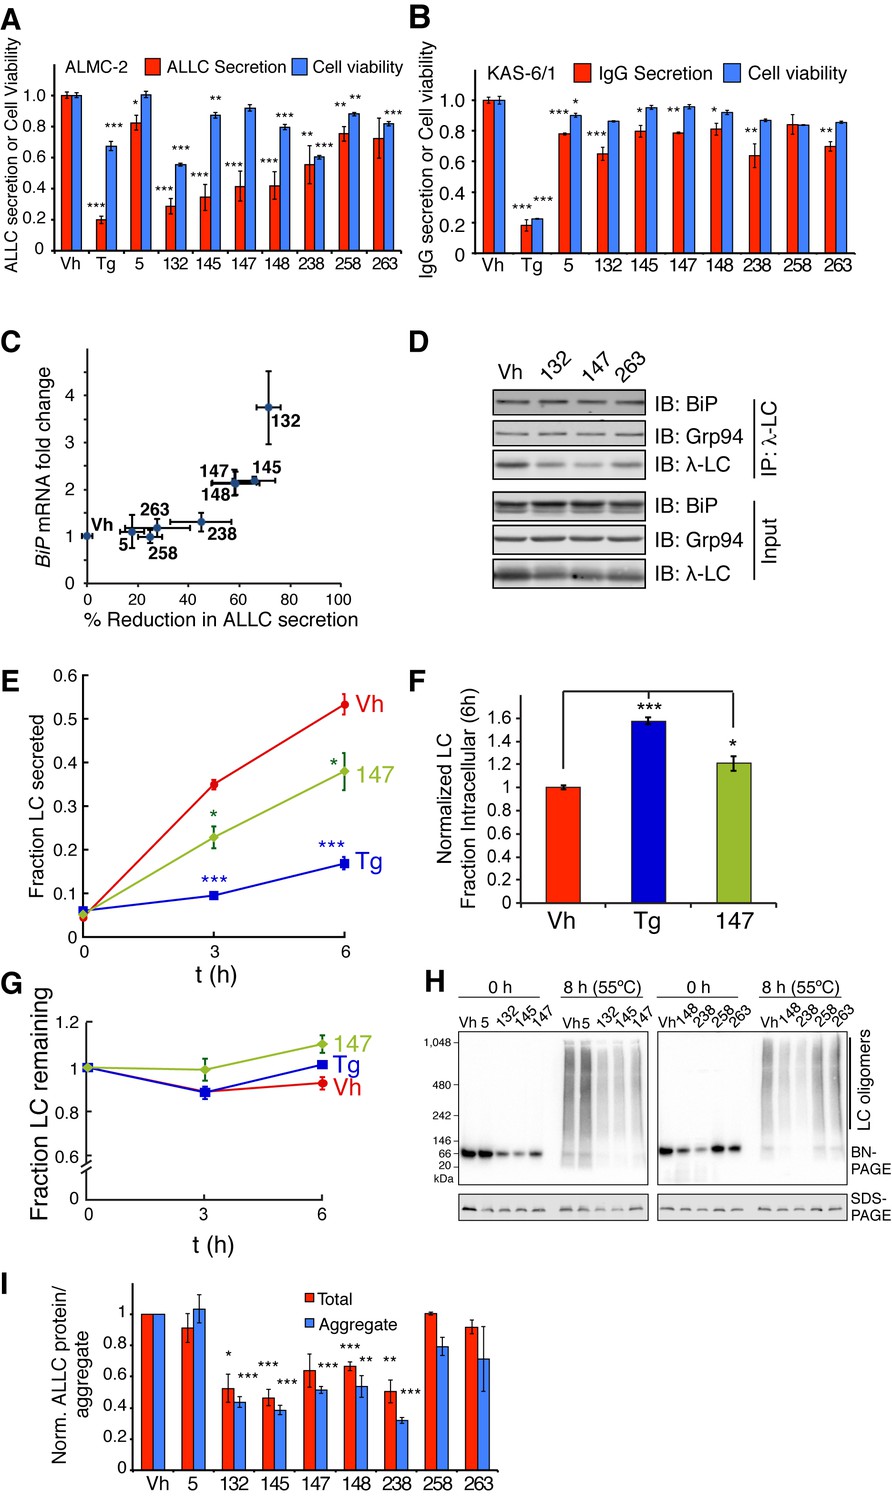
ER proteostasis regulators reduce secretion and extracellular aggregation of a destabilized, amyloidogenic light chain from AL patient-derived plasma cells.
(A) Graph showing relative media levels of ALLC measured by ELISA (red) and cellular viability (blue) of ALMC-2 cells pretreated with 10 µM of the indicated small molecule ER proteostasis regulators. Results from treatment with Tg, 147 and 263 (Figure 6B) are shown for comparison. Cells treated with 500 nM Tg are shown as a control. Error bars show standard error for n > 6 replicates. *p<0.05, **p<0.01, ***p<0.001. (B) Graph showing relative media levels of IgG measured by ELISA (red) and cellular viability (blue) of KAS-6/1 cells treated with 10 µM of the indicated small molecule ER proteostasis regulators. Results from treatment with Tg, 147 and 263 (Figure 6D) are shown for comparison Cells treated with 500 nM Tg are shown as a control. Error bars show standard error for n = 3 replicates. *p<0.05, **p<0.01, ***p<0.001. (C) Plot comparing the reduction in ALLC secretion from ALMC-2 cells to BiP induction in the same cells. The data plotted here are taken directly from Figure 6A as well as respective measurements with additional prioritized ER proteostasis regulators (Table 1). (D) Representative immunoblots of the ALLC co-immunopurifications from ALMC-2 cells after treatment with the indicated ER proteostasis regulator (10 µM; 16 hr) and in situ cross-linking. Quantification is performed in Figure 6E. (E) Plot showing the fraction secretion of ALLC from ALMC-2 cells during a cycloheximide (CHX) chase. Cells were treated for 15 hr with 500 nM Tg or 10 µM 147, followed by media exchange and addition of 50 µg/mL CHX to inhibit new protein translation. ALLC concentrations in the lysate and media were quantified by ELISA at 0, 3 or 6 hr after CHX addition. Fraction secreted was calculated as [ALLC]media, t/([ALLC]media,t = 0 + [ALLC]lysate, t = 0). Error bars represent standard error from n = 3 replicates. *p<0.05, ***p< 0.001. (F) Plot showing the normalized intracellular fraction of ALLC at 6 hr after the CHX in the experiment described in (E). The intracellular fraction (6 h) was calculated as [ALLC]lysate, t = 6h /([ALLC]media,t = 0 + [ALLC]lysate, t = 0) and then normalized to the Vh treatment. Error bars represent standard error from n = 3 replicates. *p<0.05, ***p<0.001. (G) Plot showing the fraction ALLC remaining from the cycloheximide chase experiment described in (E). Fraction remaining was calculated as ([ALLC]lysate, t + [ALLC]media, t)/([ALLC]media,t = 0 + [ALLC]lysate, t = 0). Error bars represent standard error from n = 3 replicates. (H) Blue Native (BN)-PAGE/Immunoblot of conditioned media prepared on ALMC-2 cells pretreated with the indicated ER proteostasis regulator (10 µM; 16 hr). After pretreatment, media were exchanged and the volume adjusted to account for decreases in cell viability with several compounds. After conditioning for 8 hr, the media were collected and then heated to 55 ºC for 8 hr to induce ALLC aggregation. An SDS-PAGE/immunoblot of the same samples is shown as a control. (I) Quantification of the total (red) and aggregate (blue) ALLC amounts in the immunoblots as shown in Figure 6—figure supplement 1H. Results from treatment with 147 and 263 (Figure 6F) are shown for comparison. Error bars show standard error for n > 3 replicates. *p< 0.05, **p<0.01, ***p<0.001.
Tables
Table 1
Prioritized ER proteostasis regulators.
| Name | Structure | MW | Polar Surface Area | AlogP | Structural moieties (Figure 1—figure supplement 1B–C) | % ERSE-FLuc activation* | % XBP1-RLuc activation* | Promiscuity** |
|---|---|---|---|---|---|---|---|---|
5 | 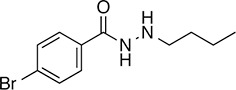 | 271.2 | 41.13 | 2.62 | - | 60.9 ± 6.0 | 9.1 ± 0.7 | 1 out of 31 |
| 132 | 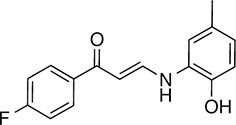 | 283.3 | 58.56 | 3.27 | F | 140.1 ± 17.4 | 10.3 ± 7.9 | 2 out of 32 |
| 145 | 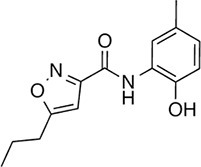 | 260.3 | 75.36 | 3.01 | F, H | 83.4 ± 6.3 | 24.5 ± 4.7 | 1 out of 31 |
| 147 | 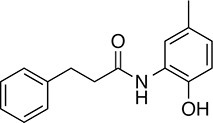 | 255.3 | 49.33 | 3.35 | B, F | 63.2 ± 0.6 | 17.5 ± 1.9 | 1 out of 32 |
| 148 | 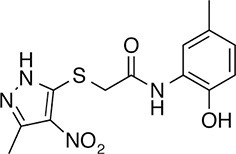 | 322.3 | 149.12 | 2.00 | B, F | 52.5 ± 14.3 | 16.6 ± 2.4 | 3 out of 31 |
| 238 | 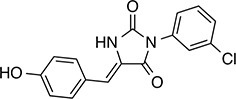 | 314.7 | 69.64 | 2.94 | B, L | 68.2 ± 5.7 | 61.1 ± 0.1.5 | 2 out of 31 |
| 258 | 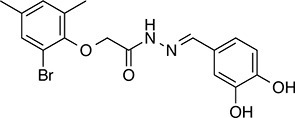 | 393.2 | 91.15 | 3.76 | C, D | 28.6 ± 6.1 | 32.6 ± 1.0 | 1 out of 31 |
| 263 |  | 257.2 | 90.44 | 3.10 | C | 20.7 ± 2.3 | 2.4 ± 1.0 | 1 out of 31 |
-
*% Tg activation from triplicate confirmation screen at 6.8 μM
-
** Number of screening assays in which the compound was found active
Additional files
-
Supplementary file 1
Excel spreadsheet describing the parameters defining the High Throughput primary screen to identify small molecule ER proteostasis regulators.
- https://doi.org/10.7554/eLife.15550.022
-
Supplementary file 2
Excel spreadsheet describing the toxicity of our top 8 small molecule ER proteostasis regulators in HEK293T-Rex cells.
- https://doi.org/10.7554/eLife.15550.023
-
Supplementary file 3
Excel spreadsheet describing the structure, source, and purity for the compounds used in this manuscript.
- https://doi.org/10.7554/eLife.15550.024
Download links
A two-part list of links to download the article, or parts of the article, in various formats.
Downloads (link to download the article as PDF)
Open citations (links to open the citations from this article in various online reference manager services)
Cite this article (links to download the citations from this article in formats compatible with various reference manager tools)
Small molecule proteostasis regulators that reprogram the ER to reduce extracellular protein aggregation
eLife 5:e15550.
https://doi.org/10.7554/eLife.15550


