Two-way communication between SecY and SecA suggests a Brownian ratchet mechanism for protein translocation
- University of Bristol, United Kingdom
- University of Leeds, United Kingdom
Figures
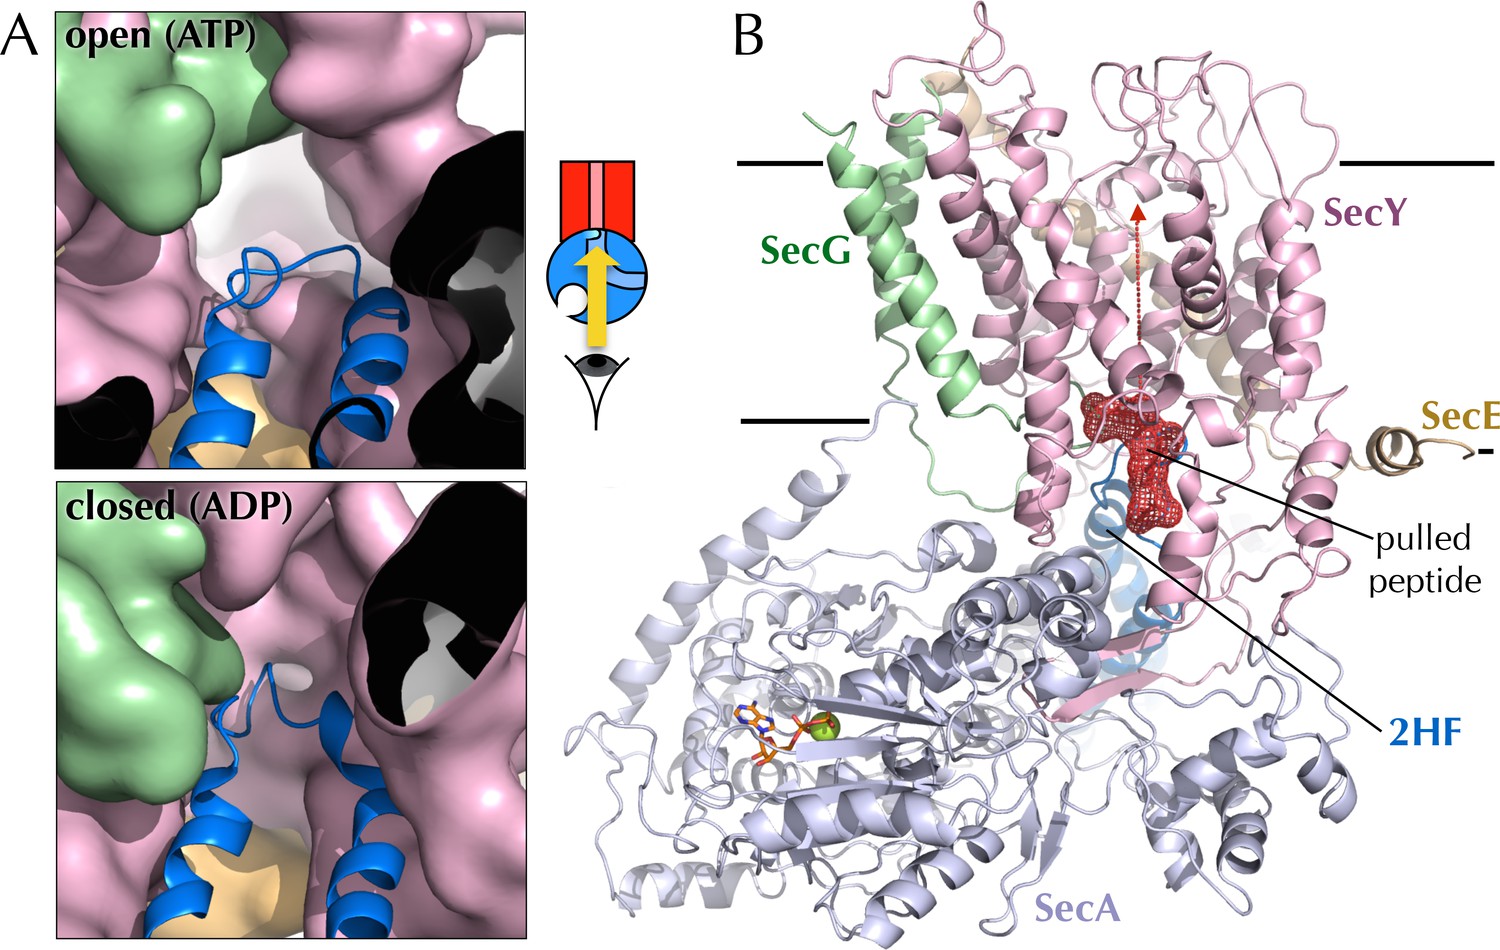
Figure 1

Structures of SecYEG.
(A) Surface representations of SecYEβ from M. janaschii; PDB code 1RHZ (Van den Berg et al., 2004) viewed from the side (left) and periplasm (top right). TMs 1–5 of SecY are shown in pink and TMs 6–10 in grey, with the LG helices (TMs 2, 3 and 7) highlighted as cartoons in the side view. SecE is shown in orange, SecG/β in green and the plug (helix 2a) as red ribbons. Also shown (bottom right) is a cartoon closeup of the central channel of SecYEβ (from the periplasm) with the plug removed and the six residues comprising the pore ring shown as turquoise sticks. TMs 2 and 7 of SecY are highlighted in magenta and black, respectively. (B) As in panel A but the structure of SecYEG-SecA from Thermotoga maritima, PDB code 3DIN (Zimmer et al., 2008). SecA is shown in pale blue, with the 2HF highlighted bright blue, NBD1 in white, NBD2 blue and a region of SecA unique to thermophilic organisms in yellow. A schematic of the SecYEG-SecA complex is also shown (centre-left of figure), with SecYEG in red, SecA in blue and the key domains marked. This scheme is used as a reference throughout the paper.
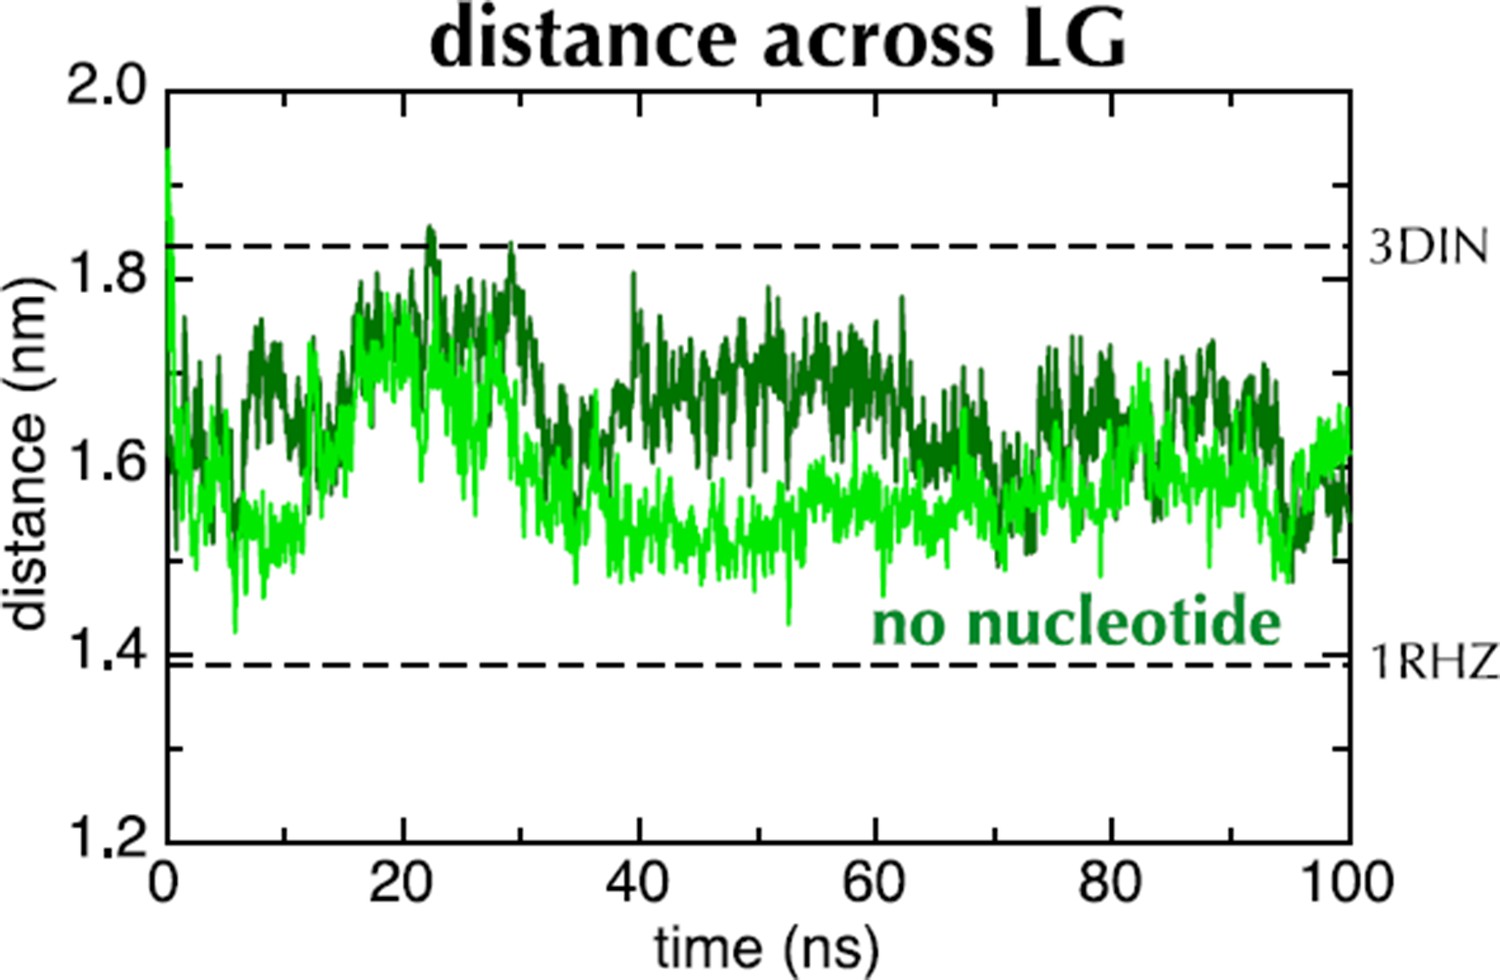
Figure 2 with 2 supplements
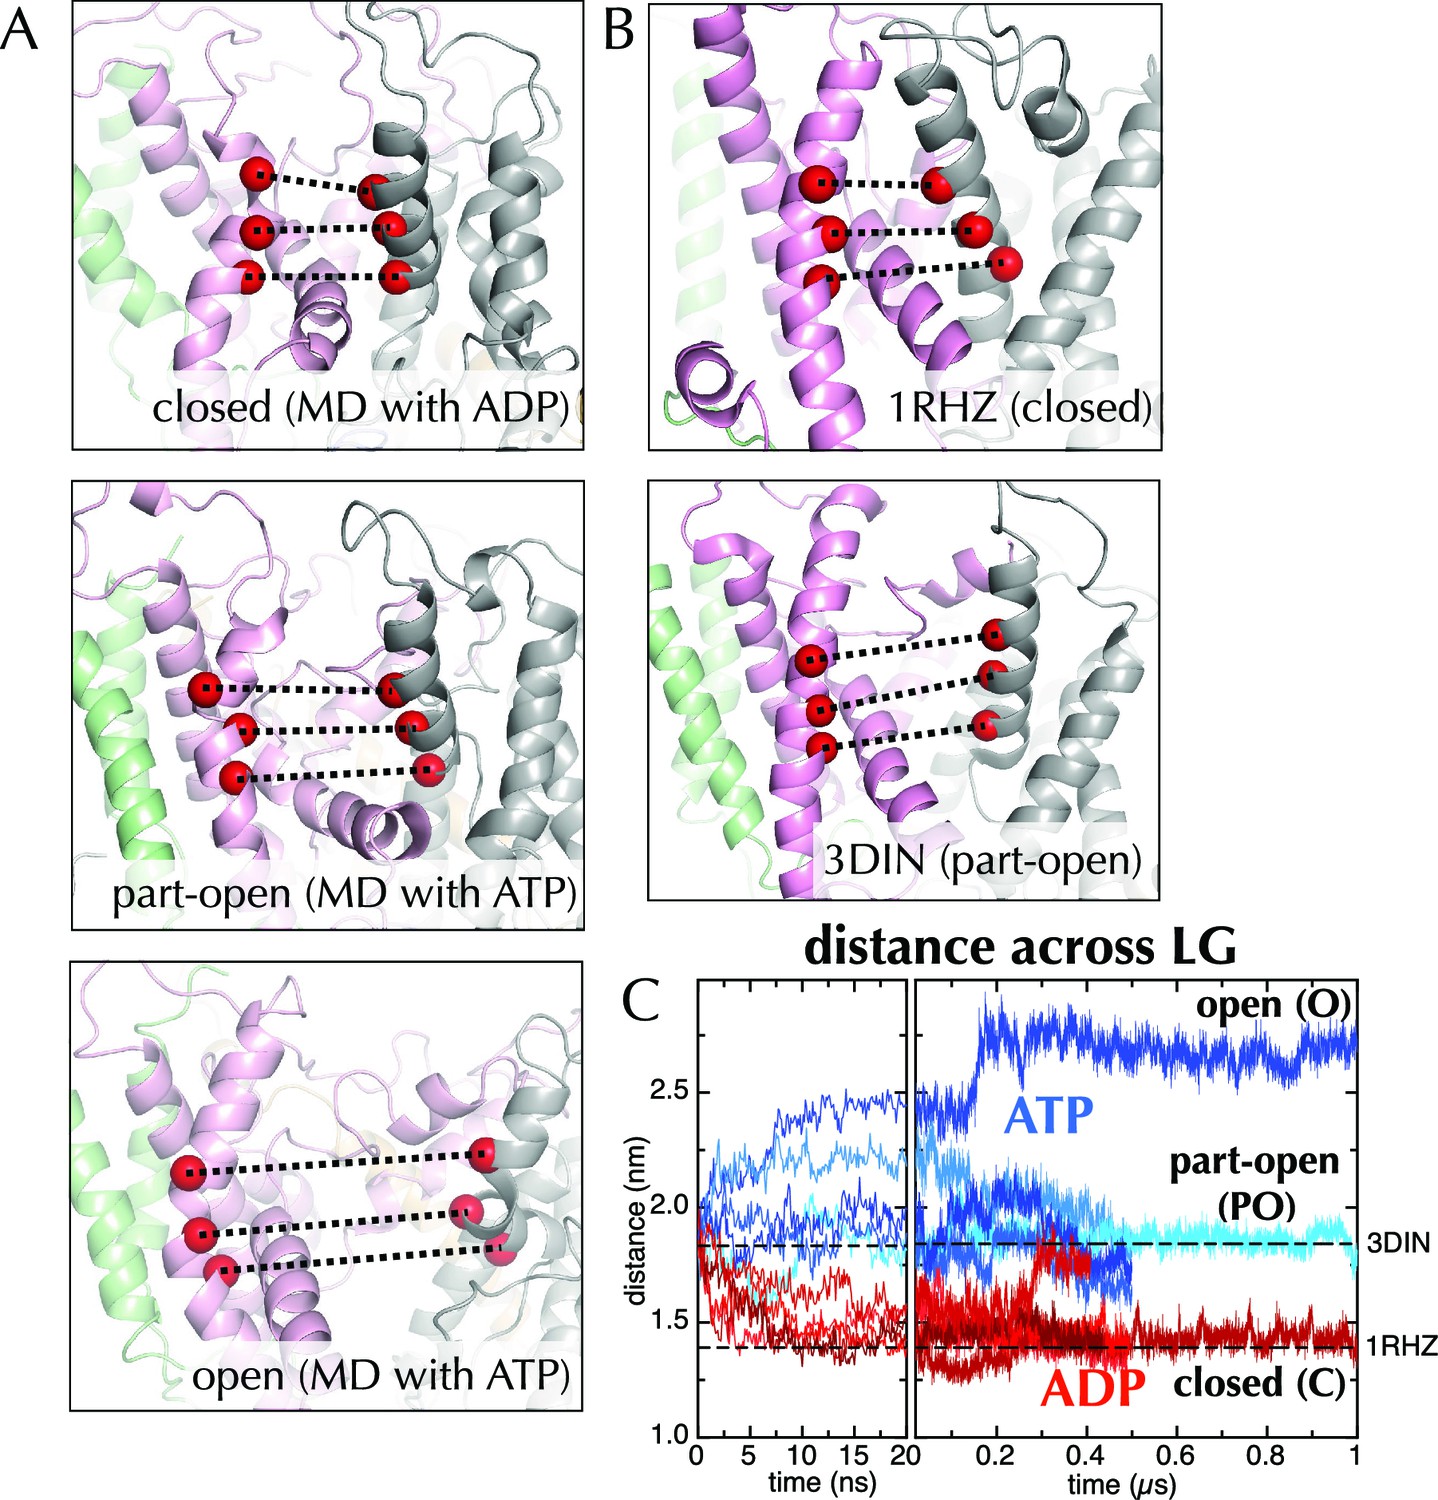
Molecular dynamics reveals nucleotide-dependent changes in the lateral gate of SecY.
(A) 1 µs snapshots of the closed (top; after MD with ADP), part-open (middle, ATP) and open (bottom, ATP) forms of SecYEG, viewed side-on into the LG. TMs 1–5 of SecY are shown in pink, TMs 6–10 in grey, and SecG in green. Three residue pairs across the LG are shown (red spheres; residues 124/275, 127/278 and 130/282 in T. maritima numbering), with the distances between them drawn out as dotted black lines. Note that in the OPLS-AA force field, ATP and AMPPNP are essentially indistinguishable. (B) As in panel A, but showing the closed LG of SecYEβ (M. janaschii; PDB code 1RHZ (van den Berg et al., 2004); top) and the part-open LG of SecYEG-SecA (T. maritima, PDB code 3DIN (Zimmer et al., 2008); bottom). (C) Average distances between the residue pairs in panel B across all 10 MD simulations, with the initial 20 ns expanded for clarity. The input (3DIN) and the resting translocon (1RHZ) distances are also indicated. ATP simulations are shown in blue and ADP simulations in red, with representative open (O), part open (PO) and closed (C) trajectories indicated.
Figure 2—figure supplement 1
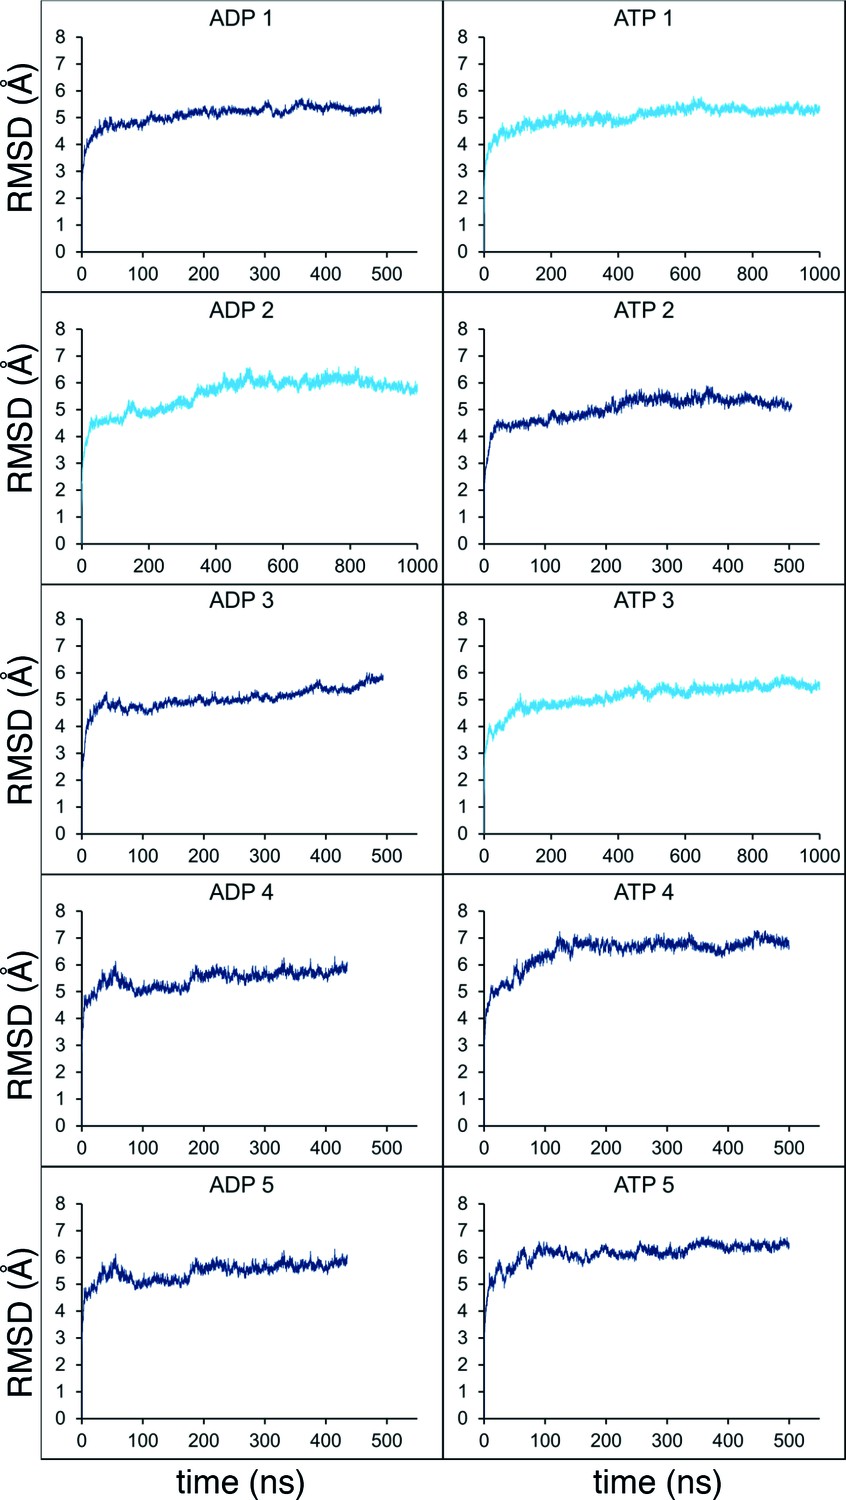
Molecular dynamics stability.
Stability analyses of the MD simulations, measuring the root-mean-squared-deviation (RMSD) of the protein Cα atoms across the trajectory. Shown are the analyses for all 10 simulations from Figure 2C (5 x ADP and 5 x ATP), with the shorter simulations in dark blue, and those extended to 1 µs in light blue.
Figure 2—figure supplement 2
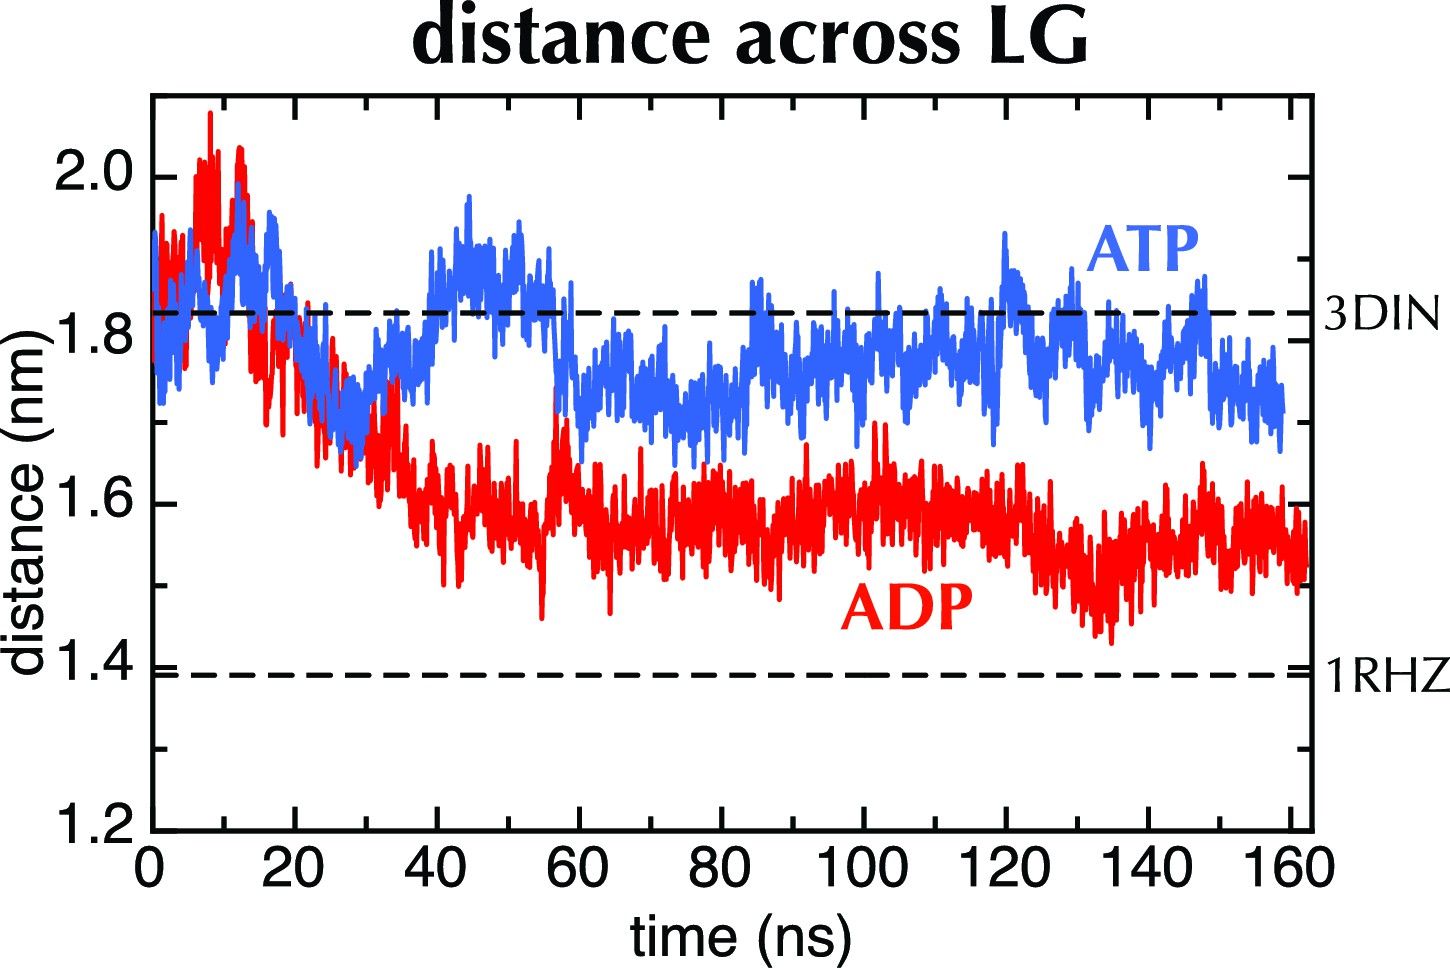
MD with Amber force field.
Distance across the LG as a function of time for ATP (blue) and ADP (red) as in Figure 2C, but carried out with a different force field (Amber ff99SB-ILDN). As with OPLS-AA, ADP leads to closure of the LG, while with ATP it remains in a part open conformation.
Figure 3
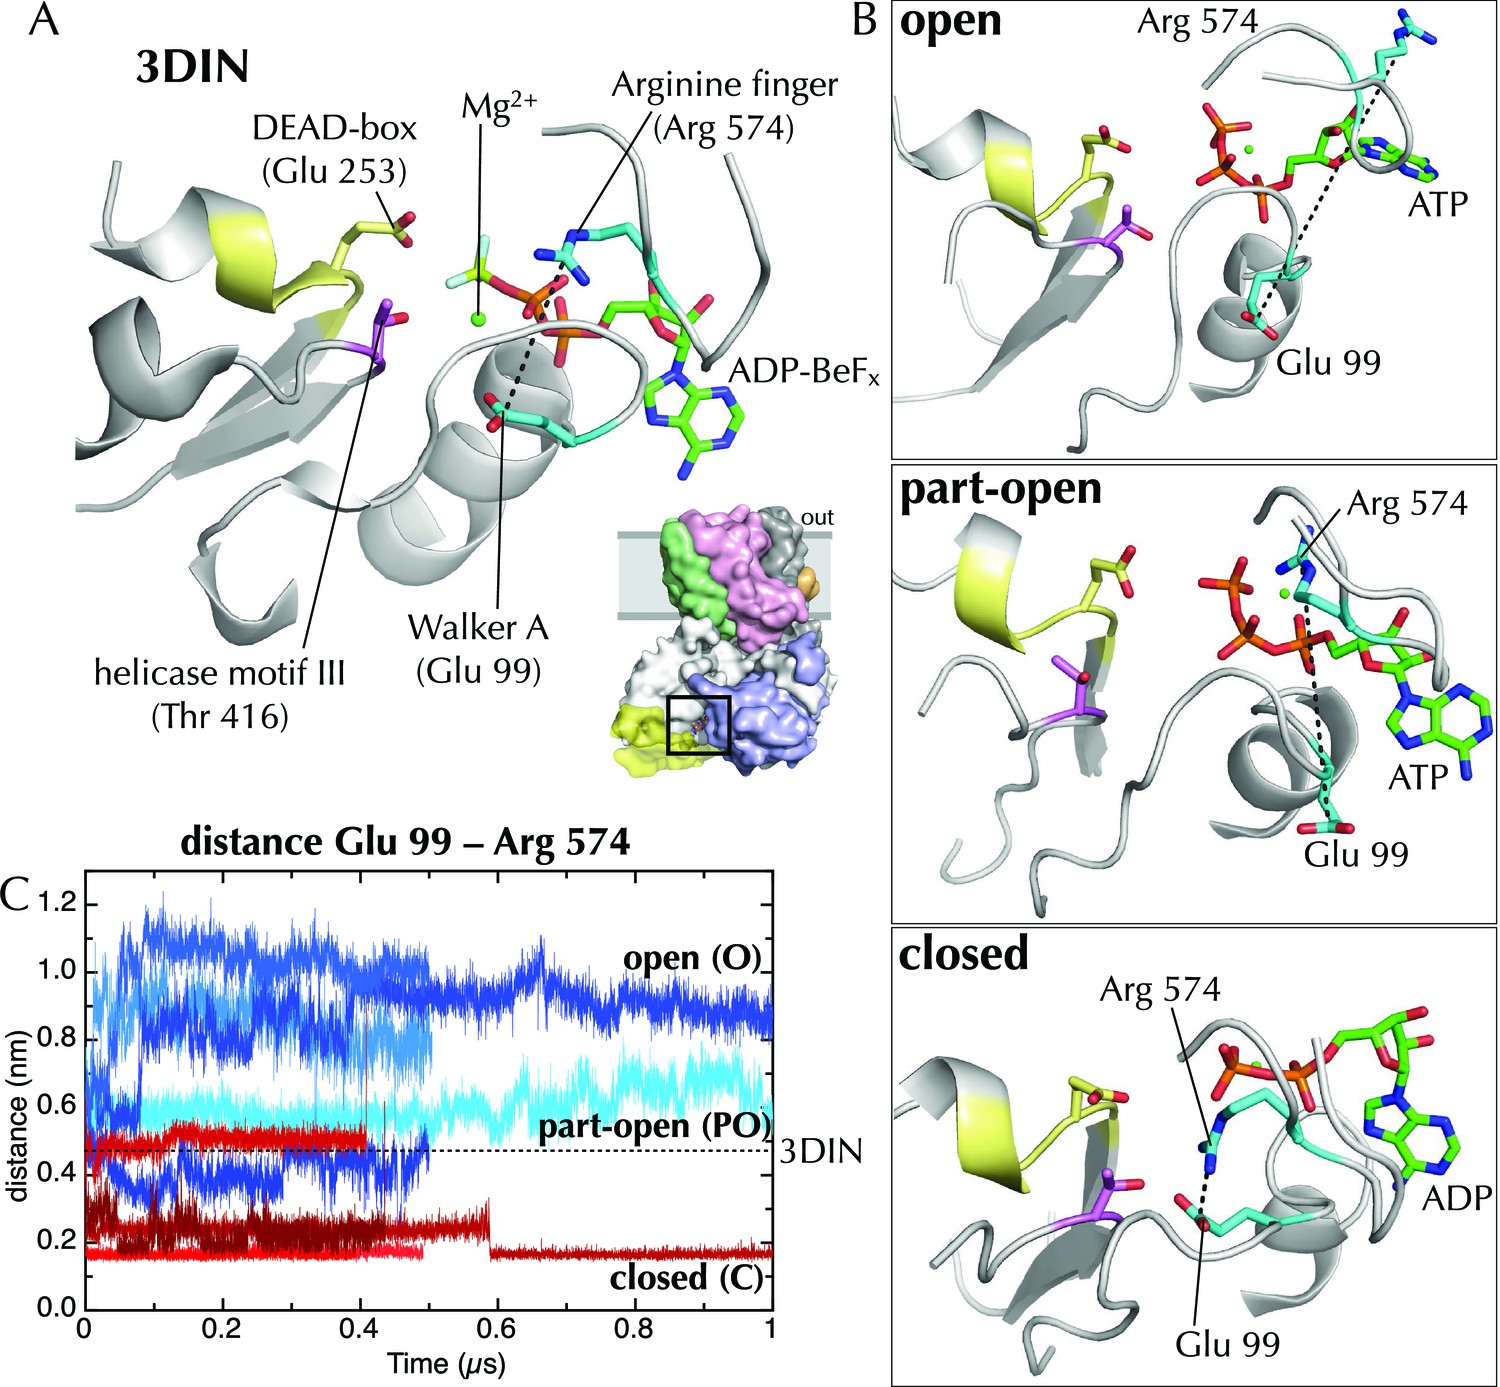
Effects of ATP and ADP on the nucleotide binding site.
(A) Closeup of the NBS of SecA in the T. maritima SecYEG-SecA structure (3DIN; [Zimmer et al., 2008]).The ADP-BeFx moiety is shown as sticks (carbon green, nitrogen blue, oxygen red, phosphorus orange, beryllium lime and fluorine pale blue), and key helicase loops are shown as white cartoons. Conserved helicase features are shown as coloured sticks and numbered as in T. maritima: Glu99 of Walker A (helicase motif Ia); Glu253 of Walker B (DEAD box of helicase motif II); Thr416 of helicase motif III; and Arg574 (‘arginine finger’) of helicase motif VI. A black dotted line marks the distance between Arg574 and Glu99. (B) The same view as in panel A, but for post-microsecond simulation snapshots in the open, part-open and closed simulations. Of note are Arg574 and Glu99, which remain distant in the open and part-open simulations (ATP), but come close enough to form a salt bridge in the closed simulation (ADP). In helicases, this conserved arginine finger on motif VI has been shown to couple ATPase activity with substrate binding (Hall et al., 1998), underlining its importance in SecA. After the Arg574 to Glu99 salt bridge has formed in the ADP simulations, the Walker A motif is bought into contact with a conserved threonine (Thr416) in helicase motif III, which in the helicase family has been shown to use ATP binding to create an RNA binding site (Banroques et al., 2010). This threonine communicates directly with the SecA DEAD box—providing a likely route forsignal transmission of ATP hydrolysis away from the NBS towards the polypeptide binding sites. (C) Minimum distance analysis between residues Glu99 and Arg574 of SecA across the simulation data confirms that a Glu99-Arg574 interaction is formed in 4/5 of the ADP simulations, whereas it is absent in all 5 ATP simulations. Interestingly, the ADP simulation that does not find this salt bridge is the same simulation in which the SecY LG samples the part-open state (Figure 2C). Thus, it appears that nucleotide dependent formation and breaking of the Glu99-Arg574 salt bridge is involved in the coupling process leading ultimately to the respective closure and opening of the channel.
Figure 4 with 2 supplements
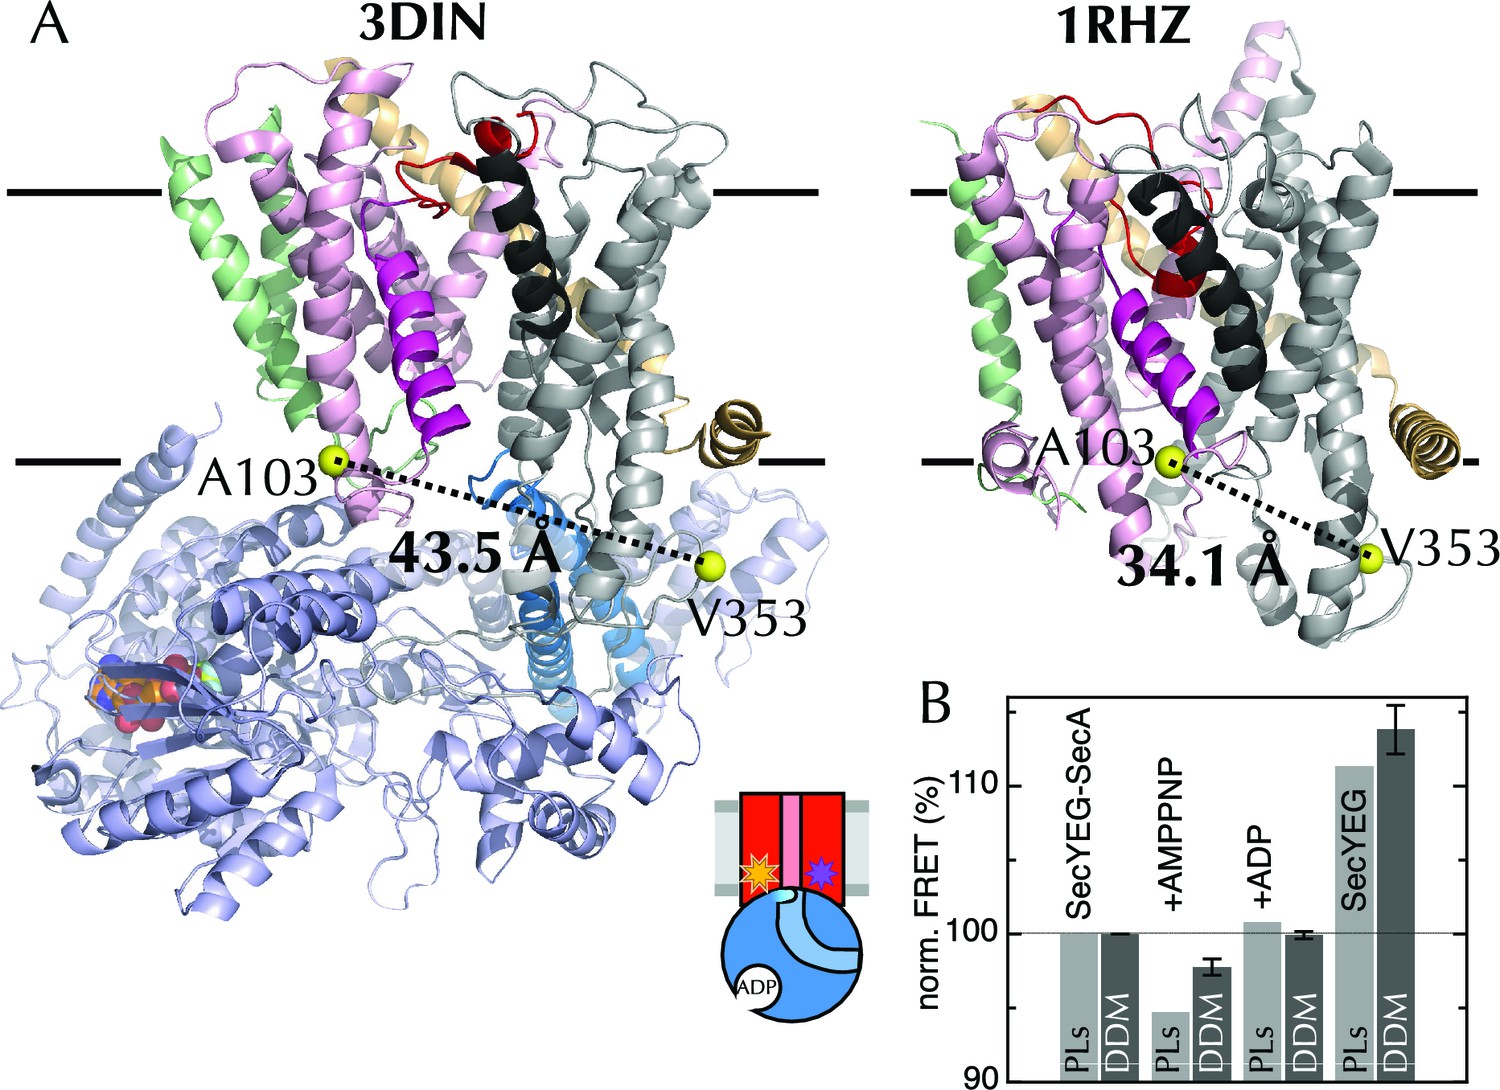
The extrinsic FRET pair of SecY**EG reports on the distance across the lateral gate.
(A) Structures of SecYEG-SecA from T. maritima (left; part-open; PDB code 3DIN [Zimmer et al., 2008]) and SecYEβ from M. jannaschii (right; closed; PDB code 1RHZ [Van den Berg et al., 2004]). TMs 1–5 of SecY are coloured pink (TM2 highlighted magenta), TMs 6–10 grey (TM7 highlighted black), SecE orange, SecG/β green and SecA pale blue (2HF highlighted in bright blue). Residues equivalent to A103 and V353 in E. coli (K103 and I342 in T. maritima; I94 and I356 in M. jannaschii) are shown as yellow spheres, with the distances between them (Cβ-Cβ) marked out: 43.5 Å in the open complex, and 34.1 Å in the closed complex. (B) FRET efficiencies of 100 nM SecY**EG in PLs (light grey) or DDM-solubilised (dark grey): with 1 µM SecA; with SecA and 1 mM AMPPNP; with SecA and 1 mM ADP; and alone. Data are normalised to SecYEG with SecA but without added nucleotide, and error bars represent the standard error from six repeats.
Figure 4—figure supplement 1
The extrinsic FRET pair of SecY**EG reports on the distance across the lateral gate.
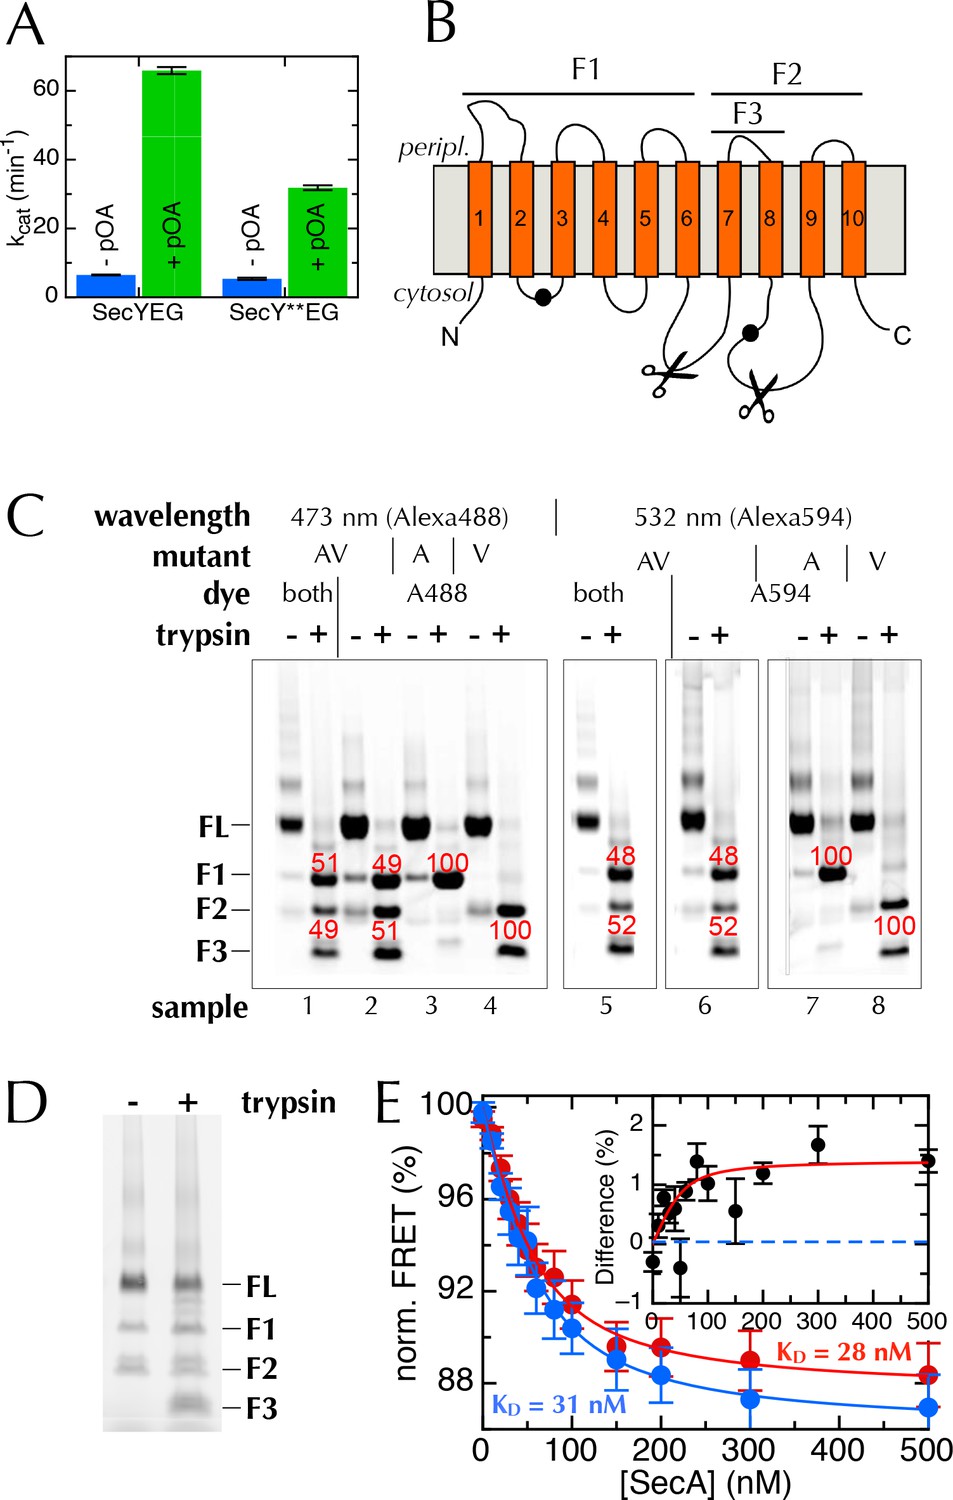
(A) ATPase assay on SecA in the presence of saturating amounts of SecYEG or SecY**EG PLs.Rates are shown both before and after addition of pre-protein (pOA) to 0.7 µM, and demonstrate that SecY**EG is active. (B) Schematic diagram of SecY, with the ten TMs shown, and the two labelling positions (A103 and V353) shown as black circles. The primary and secondary trypsin cleavage sites – between TMs 6–7 and TMs 8–9, respectively – are also marked out. Cleavage with trypsin yields one fragment of ~28 kDa containing the A103 position (F1), and another of ~21 kDa containing the V353 position (F2). F2 is partially cleaved to produce another 10 kDa fragment (F3), which also contains the V353 position. (C) Fluorescence visualisation of SDS-PAGE following trypsin cleavage of the two single mutants, SecYEGA103C (A) and SecYEGV353C (V), and the double mutant (AV) all conducted in DDM. Each pair of lanes shows SecYEG without (-) and with (+) trypsin treatment; in the absence of trypsin, fluorescent protein runs as a full length band (FL), while trypsin cleavage produces fragments F1–F3. Numbers in red show percentages of the total intensity for the bands in the lane. As expected, fluorophores on the A103 (A) position run in band F1 (samples 3 & 7), while fluorophores on V353 (V) are distributed between bands F2 and F3 (samples 4 & 8). Protein labelled with a single dye at both positions (samples 2 and 6) shows both positions labelled equally (samples 2 & 6). The SecY**EG mutant (samples 1 and 5) is labelled equally on both positions, with both dyes. Therefore, we can rule out an unexpected asymmetric dye loading on the two sites that would skew the FRET results. (D) Analysis of SecY**EG PLs by trypsin proteolysis, results shown without (-) and with (+) trypsin. Fluorescence quantification indicates that the band corresponding to full-length SecYEG accounts for 54% of the total signal in the '+' lane, once the lower molecular weight bands in the '-' lane are corrected for. This is equivalent to 46% outward facing SecYs: consistent, within error, with previous reports that show equal amounts of inward- and outward-facing SecYEG (Mao et al., 2013; Schulze et al., 2014). (E) Normalised FRET efficiencies of 50 nM SecY**EG in PLs in the presence of 500 µM ADP (red) or 500 µM AMPPNP (blue), as a function of SecA concentration. Data are fitted to a tight binding equation and show a difference in apparent FRET efficiency at saturation, but no measurable difference in affinity. Due to variability in protein preps, labelling efficiencies and reconstitutions, variation in the total magnitude of the signal was greater than the individual differences between ADP and AMPPNP. To account for this, we calculated the differences in FRET pairwise for each data set (inset). Error bars represent the standard error of mean (SEM) of five replicates, and the dotted blue line represents where the data would cluster if the ADP and AMPPNP titrations gave the same signal.
Figure 4—figure supplement 2
Interpreting ensemble FRET in PLs.
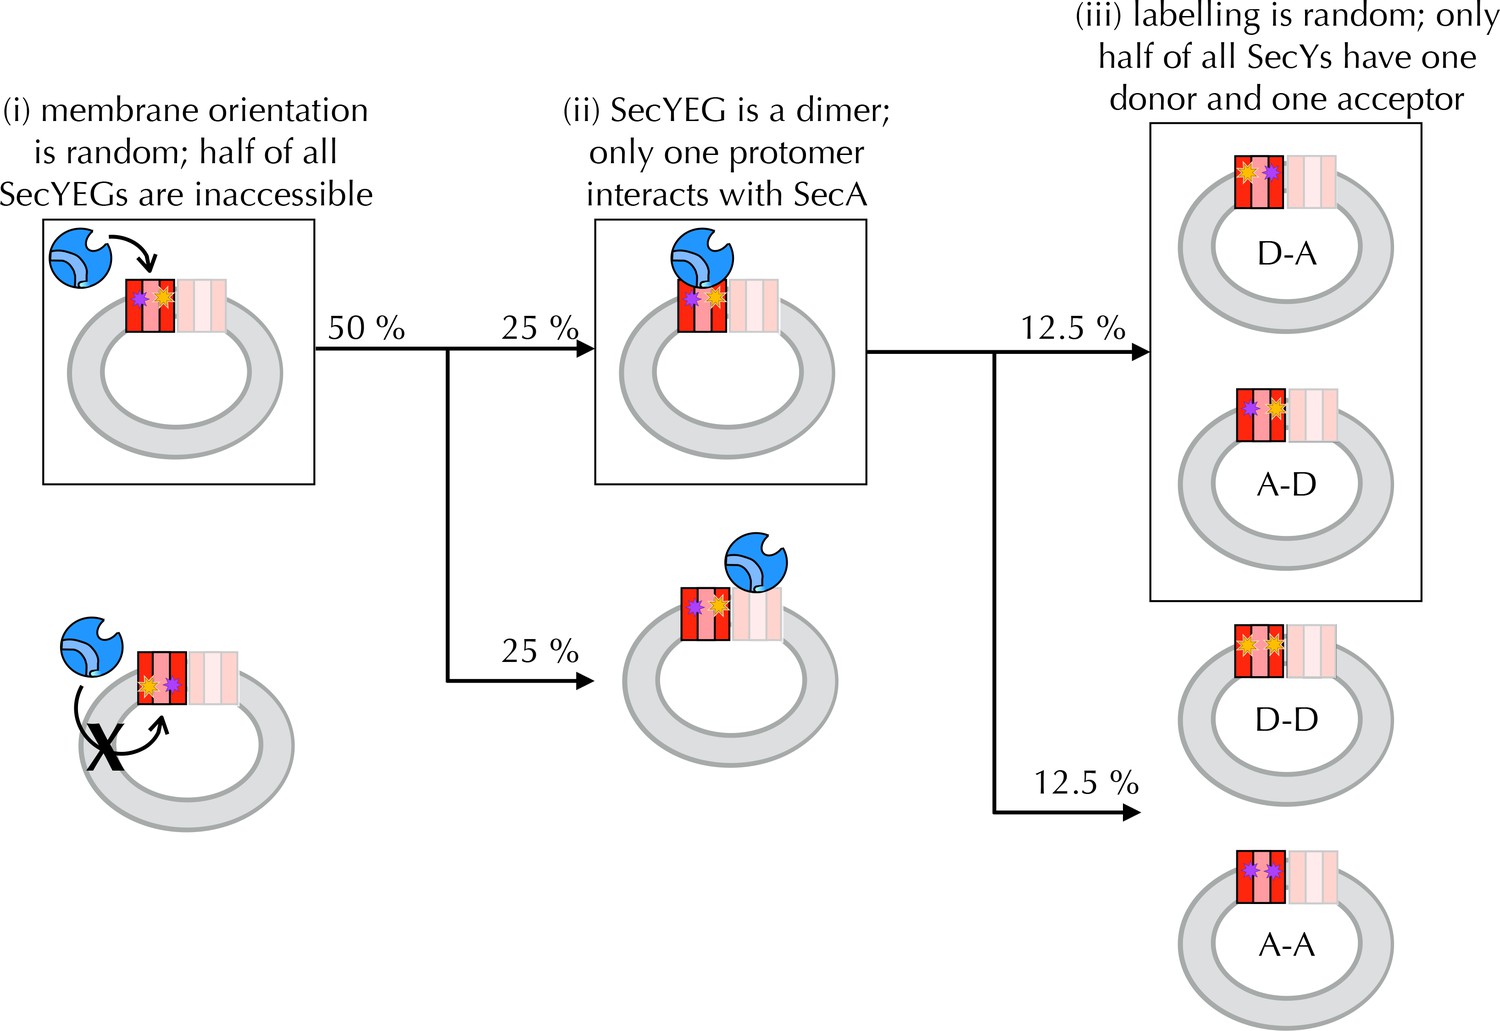
The FRET changes observed in Figure 4B are lower than would be expected from the structures of the open and closed channel (Figure 4A), given the known R0 of the dye pair (6 nm). Three factors are likely to cause this: (i) about half of all SecY**EG molecules will be facing inwards after reconstitution (Mao et al., 2013; Schulze et al., 2014) (Figure 4S1) and will thus be unavailable for contact with SecA; (ii) SecYEG forms a dimer in the membrane (Bessonneau et al., 2002; Breyton et al., 2002) and SecA engages only one channel for translocation (Osborne and Rapoport, 2007; Zimmer et al., 2008; Deville et al., 2011); and (iii) at most half of the SecYs will carry the donor-acceptor pair due to the random labelling – possibly fewer if labelling is incomplete. In total, therefore, only ~12.5% of all SecYEG molecules are expected to respond to the presence of translocation partners. Two of these three problems are obviated by using single molecule FRET: (ii) is solved by using high lipid to protein ratio (see Methods for details) and extruding the PLs to 100 nm, such that only a single copy of SecY is present in each PL (Deville et al., 2011); and (iii) is solved because only particles containing a single donor and a single acceptor are used for analysis (see Methods and Figure 5—figure supplement 1). Because we use intact PLs, problem (i) still remains even at the single molecule level. We account for this in the final reckoning (Figure 5H) by assuming that half the particles do not respond to SecA as they are inward-facing (Figure 4—figure supplement 1D) and behave as SecA with no additional binding partners. This was done simply by removing 50% of the 'alone' populations from each other condition, then multiplying the result by two to give 100%.
Figure 5 with 3 supplements

Communication from SecA to SecY: single molecule FRET analysis of lateral gate opening.
(A) Schematic diagram of proteo-liposomes (PLs) containing a single SecY**EG complex used for single molecule TIRF experiments. PLs extruded to 100 nm were immobilised on the surface of a glass-supported lipid bilayer via a biotin-streptavidin-biotin bridge. (B–G) TIRF FRET efficiency distributions of SecY**EG PLs imaged alone (B) or incubated at room temperature for 15–40 min with 40 nM SecA in the presence of (C) 1 mM AMPPNP; (D) 1 mM ADP; (E) 1 mM ATP and an ATP regenerating system or (F) 1 mM ATP, 200 nM pOA and an ATP regenerating system, as well as (G) with 1 µM SecA, 1 mM ATP, 700 nM pOA and an ATP regenerating system. Each data set shows the average and SEM from three independent experiments (number of FRET events n = 200 each). Grey boxes represent histogram frequencies; red, green and blue shaded areas show least-squared Gaussian fits to high, medium and low FRET efficiencies, respectively. The black curve represents the sum of the fitted Gaussian distributions. (H) Amplitudes of the three TIRF FRET Gaussian peaks in panels (B–G). To correct for the inward-facing SecYEG molecules in the PLs (Figure 4—figure supplement 1D), 50% of the 'Alone' populations were subtracted from each sample (uncorrected data shown in Figure 5—figure supplement 2B). Bar heights are the mean from three replicates, and error bars represent the SEM computed by ANOVA analysis (full data shown in Figure 5—figure supplement 2A).
Figure 5—figure supplement 1
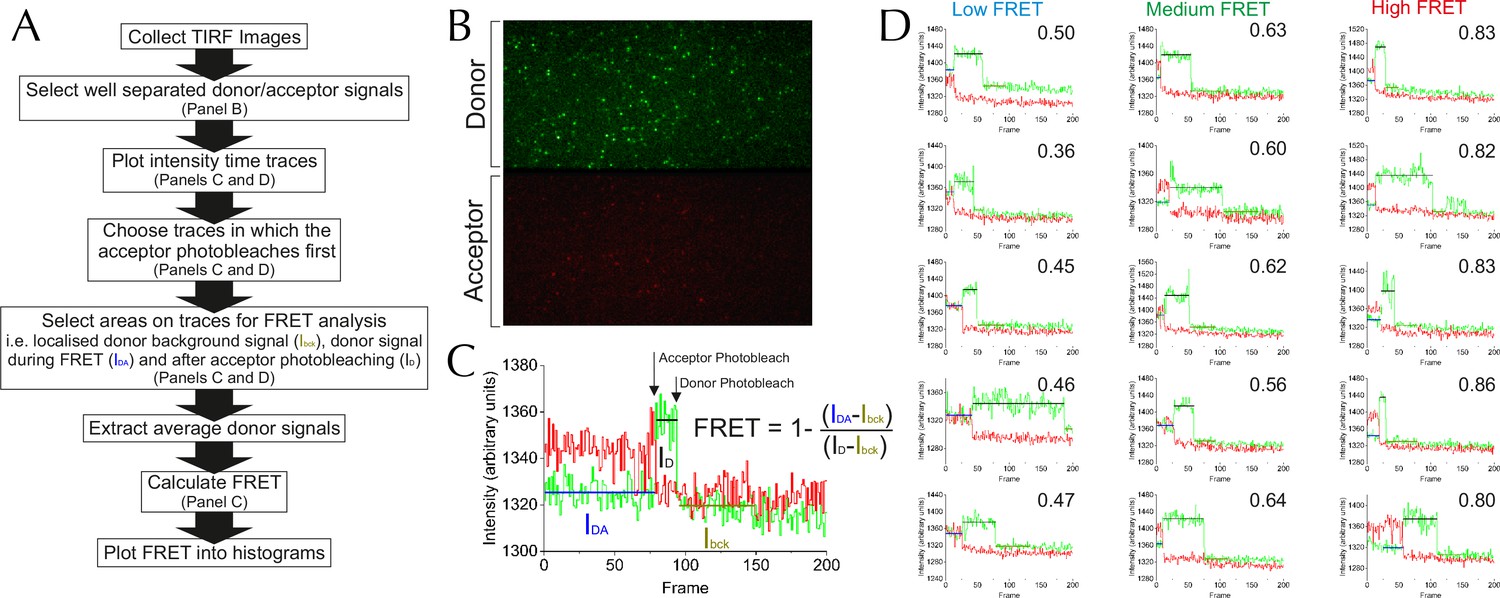
Methodology for TIRF analysis.
(A) A flow diagram describing the process of analysing single molecule TIRF videos to generate FRET efficiency data (an example frame is displayed in Figure 5—figure supplement 1B). (B) TIRF image of immobilised SecY**EG illuminated by a 488 nm evanescent field. The upper panel displays the donor emission from AF488 (green) and the lower panel AF594 acceptor emission (red) across the same area. (C) Example of a single molecule SecY**EG TIRF fluorescence time trace (repetition time 0.22 s per frame, exposure time 0.2 s) used to calculate FRET efficiency, following the intensity of the donor (green) and acceptor (red) dye pair as a function of time. For data analysis, only traces with sequential single-step acceptor and donor photobleaching were used. Donor signals during FRET (IDA), and alone (after acceptor photobleaching, ID) corrected for background (signal after donor photobleaching, Ibck) (right) were used to calculate FRET efficiencies according to the inset equation (Lakowicz, 2013). (D) Representative single molecule TIRF time traces of low, medium and high FRET efficiencies, labelled with their corresponding FRET efficiencies (calculated as in panel C).
Figure 5—figure supplement 2
Complete single molecule FRET data.
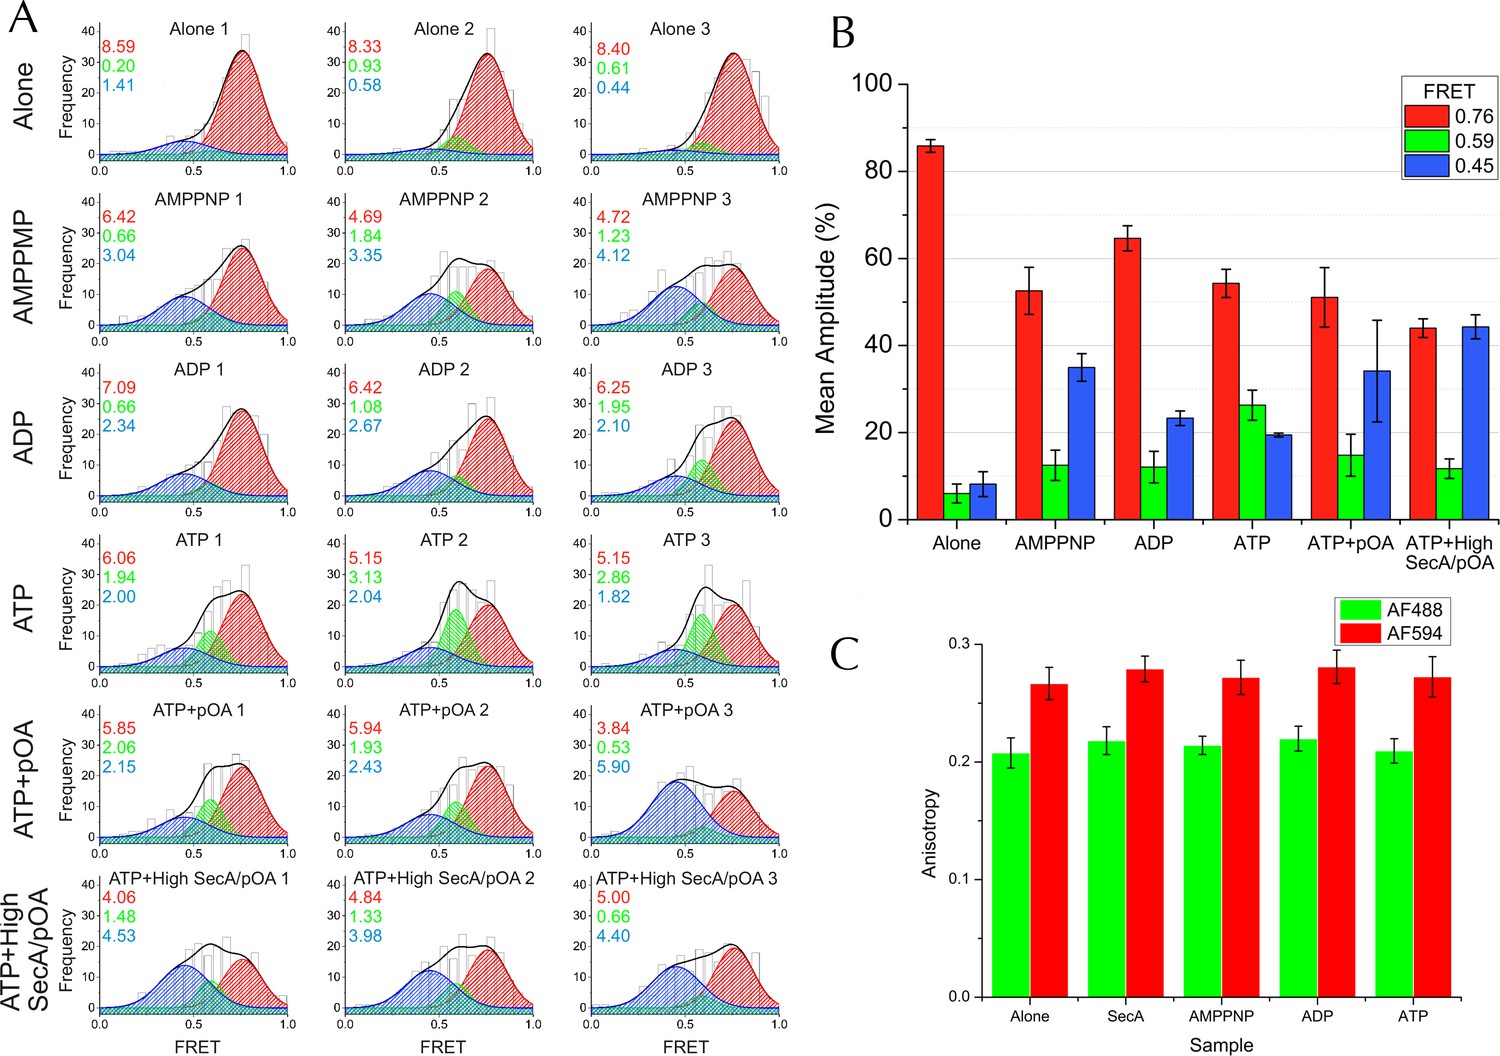
(A) TIRF FRET efficiency distribution of three independent repeats (n = 200 for each) for SecY**EG PLs imaged alone or incubated at room temperature for 15–40 min with 40 nM SecA and either 1 mM AMPPNP, 1 mM ADP, 1 mM ATP, or 1 mM ATP and 200 nM pOA (ATP+pOA), or with 1 μM SecA, 1 mM ATP and 700 nM pOA (ATP+High SecA/pOA). All samples with ATP also contained an ATP regenerating system (see Methods). Three Gaussian curves are required to describe all the data (see Figure 5—figure supplement 3A). To carry out the fitting, the parameters of the high FRET peak (position at E =0.76 and width of 0.24) were first estimated from a single Gaussian fit to the 'SecYEG alone' distributions. The complete data set was then fitted globally to three Gaussians, with the position and width of the high FRET peak fixed, and all other parameters (the amplitudes of all three peaks and the positions and widths of the remaining two peaks) were allowed to float. Next, the positions and widths of all three peaks were fixed while the amplitudes were unshared to allow variation between individual data sets. Finally, the positions and widths of the two lower FRET peaks were allowed to vary individually, along with all the amplitudes, to confirm that the model was not over-constrained. Black bars represent histogram frequencies; red Gaussians have a mean FRET of 0.76 (LG closed) with a width of 0.24; green Gaussians have a mean FRET of 0.59 (LG partially open) and width of 0.16; and blue Gaussians have a mean FRET of 0.45 (LG open) with a width of 0.31. Black curves represent the sum of the fitted Gaussian distributions. Amplitudes of the Gaussian fits are presented in the corresponding colour for LG FRET states in each plot. (B) Bar chart of amplitudes for the three FRET populations obtained by non-linear fitting, as in Figure 5H but prior to correction for inward-facing complexes. The averages and errors (SEM, standard error of mean) were obtained from the three independent data sets in panel A using one way ANOVA for each peak. (C) Fluorescence anisotropies for all the data sets. While calculating distances from FRET efficiencies may be affected by dye immobilisation and re-orientation, the observed anisotropies are constant between samples and indicate considerable dye mobility, thus permitting estimation of distance changes between states (Sharma et al., 2014). Note that no attempt was made to arrive at absolute distances between the dyes in each of the states, as this would require more rigorous consideration of dye attachment, movement and environment.
Figure 5—figure supplement 3
Three states are required to fit the smFRET data collected with ATP.
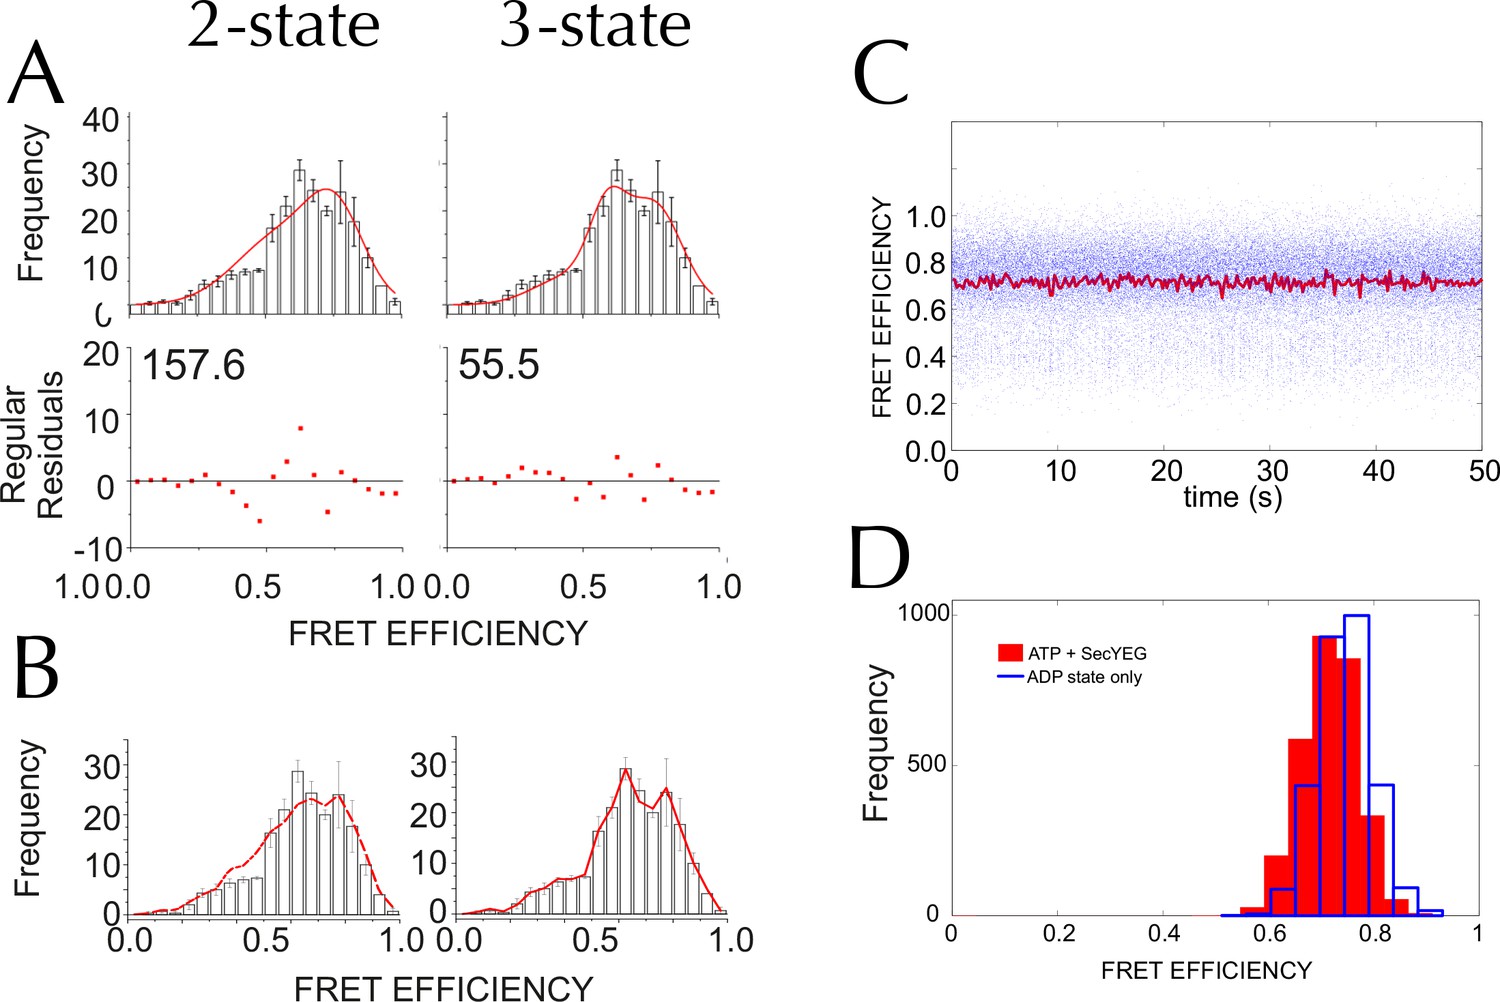
(A) Comparison of two- (left) and three- (right) Gaussian fits to the TIRF FRET frequency distributions for the data in the presence of SecA and ATP (Figure 5E). Data show the average of three repeats for each condition with standard error bars, and the best non-linear global fit (averaged from the three individual fits) is shown as a red line. Residual plots are shown beneath each fitted distribution, along with their corresponding residual sum of squares value, as a measure of the quality of fit. Fits were carried out with position and width of the high FRET peak determined for the 'Alone' sample, then fixed for the remaining samples. (B) The whole set of histograms was subjected to SVD analysis and two (left) or three (right) most significant components were selected to describe FRET histogram (in the presence of ATP). As with the global non-linear fitting, three components are required to describe the ‘ATP' data to within experimental error. (C) Interconversion between the closed and open states on a timescale faster than our TIRF data collection (0.2 s per frame) could, in principle, give rise to an apparent third FRET peak due purely to averaging. In order to evaluate whether the intermediate peak (E = 0.59) corresponds to a real, part open state, or results from averaging of 2 distinct states during ATP hydrolysis, we simulated two-state traces (with FRET efficiencies of 0.76 and 0.45) with interconversion between the two states. Given that ADP release is the rate-limiting step in SecA, we set the dwell time in the high FRET (ADP bound, closed) state to 1/kcat (measured previously [Robson et al., 2009]); while the dwell time in the low FRET (ATP bound, open) was set 1/kcleave, where kcleave is the rate of ATP hydrolysis per se (11.5 s-1, as determined previously [Robson et al., 2009]). 50 s of simulated FRET efficiency time trace for SecYEG-SecA complex + ATP (kcat = 0.27 s-1) are shown. Blue dots show the simulated raw data (with 1 ms time resolution), and the red line shows resulting simulated TIRF signal (averaged over 200 ms). (D) Histograms of FRET efficiency derived from the kinetic simulations, as in panel C (600 s total time for each). Two different conditions are shown: the ADP-bound closed state (blue, empty bars), and ATP turnover by SecYEG-SecA alone (red filled bars; as in panel C). The ADP-bound histogram is in good agreement with the experimental data (compare blue bars with Figure 5D). However, simulated ATP turnover does not recapitulate the experimental data (compare red bars with panel A): only a slight shift is seen of the high FRET peak, and no intermediate FRET feature appears. This suggests that in the case of slow ATP turnover, the intermediate FRET peak cannot be due to averaging and thus represents a genuine state.
Figure 6 with 3 supplements
Communication from SecY to SecA: lateral gate-dependent changes in the NBS of SecA.
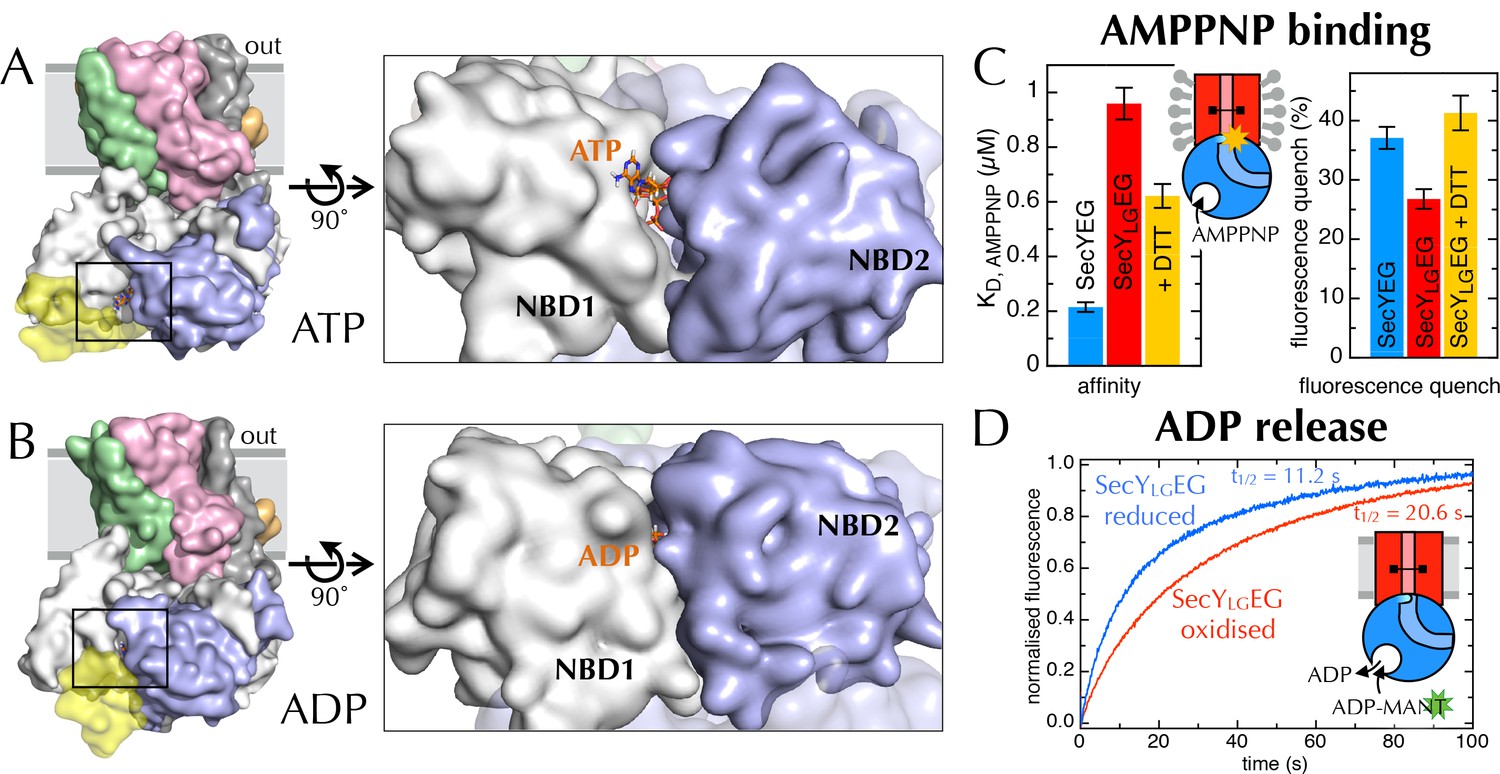
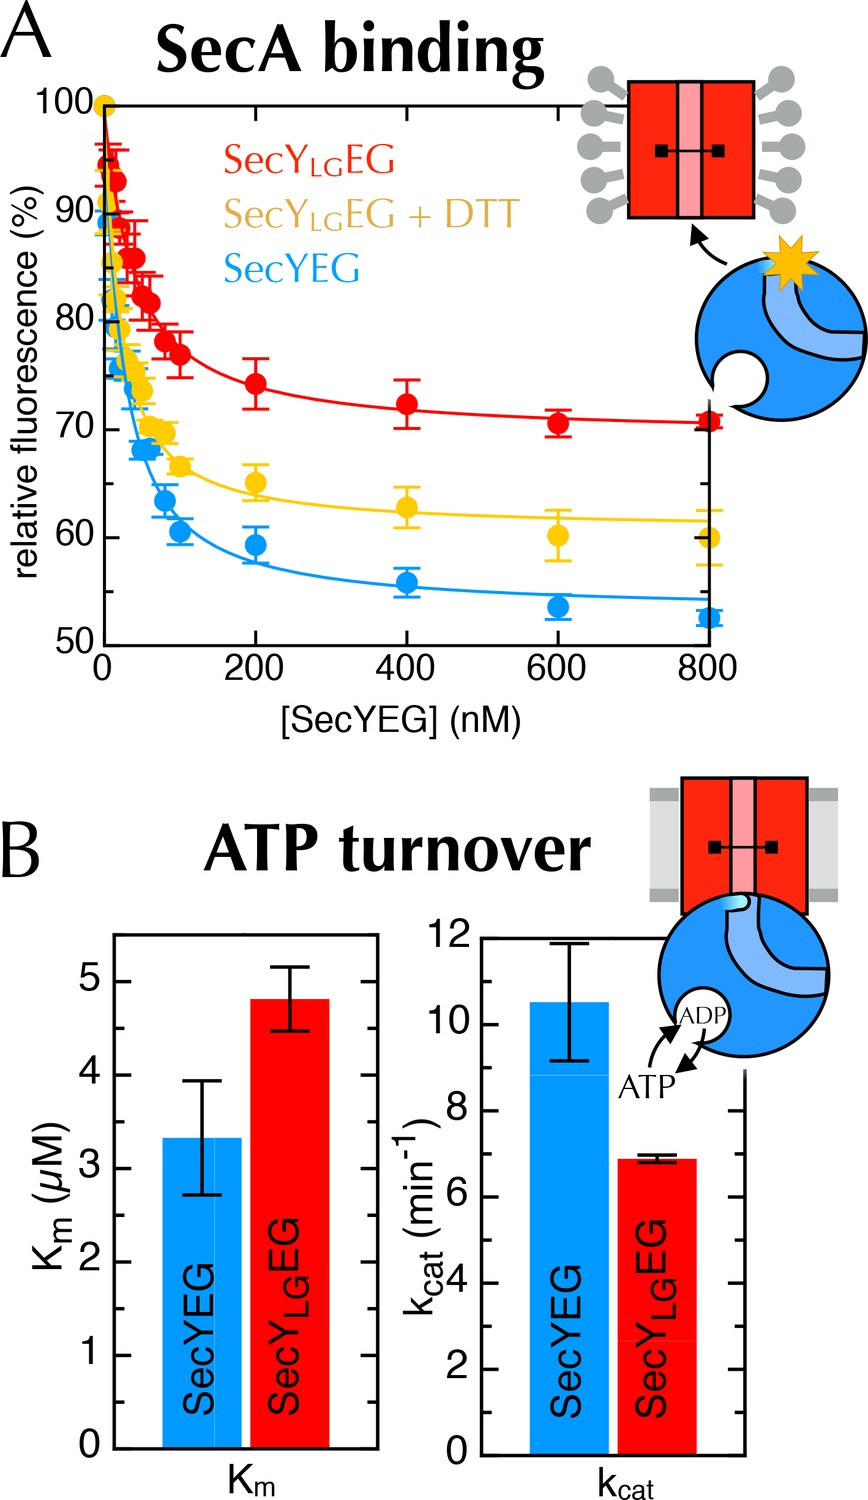
(A) Surface view of SecYEG-SecA after 1 µs MD with ATP. SecY is coloured pink, SecE orange, SecG green and SecA white, with NBD2 highlighted in blue, and the domain exclusively found in thermophilic organisms coloured yellow. ATP is shown as sticks and coloured orange, with nitrogens blue, oxygens red and hydrogens white. In the closeup of the NBS (right), the yellow loop on SecA is omitted for clarity. (B) Same as panel A, but after MD with ADP. (C) Affinity for AMPPNP (left) and maximum fluorescence quenching (right) for SecA* in the presence of SecYEG (blue), SecYLGEG (red), or SecYLGEG with 100 mM DTT (yellow). AMPPNP was titrated into 200 nM SecA* in the presence of saturating (1 µM) SecYEG and fitted to the tight binding equation (see methods); error bars represent the SEM of three repeats. Note that 100 mM DTT is enough to fully reduce the disulphide bond (Figure 6—figure supplement 2C), and restore the fluorescence amplitude; the incomplete restoration of AMPPNP affinity is therefore most likely an effect of the cysteine substitutions. Note also a minor reduction in the affinity of SecYLGEG for SecA in detergent (Figure 6—figure supplement 3A)—normally characteristic of the ADP-bound state (Deville et al., 2011). (D) Stopped flow fluorescence time courses of ADP release, after equilibrating 0.6 µM SecA and 1 mM ADP with either 2.4 µM SecYEG (blue) or SecYLGEG (red) in PLs. Time courses were measured by rapidly mixing with 25 µM MANT-ADP and following fluorescence with excitation at 296 nm and emission measured using a 399 nm longpass filter. Data were fitted to double exponentials and normalised to give a total amplitude of 1.
Figure 6—figure supplement 1
The nucleotide binding site in MD simulations.
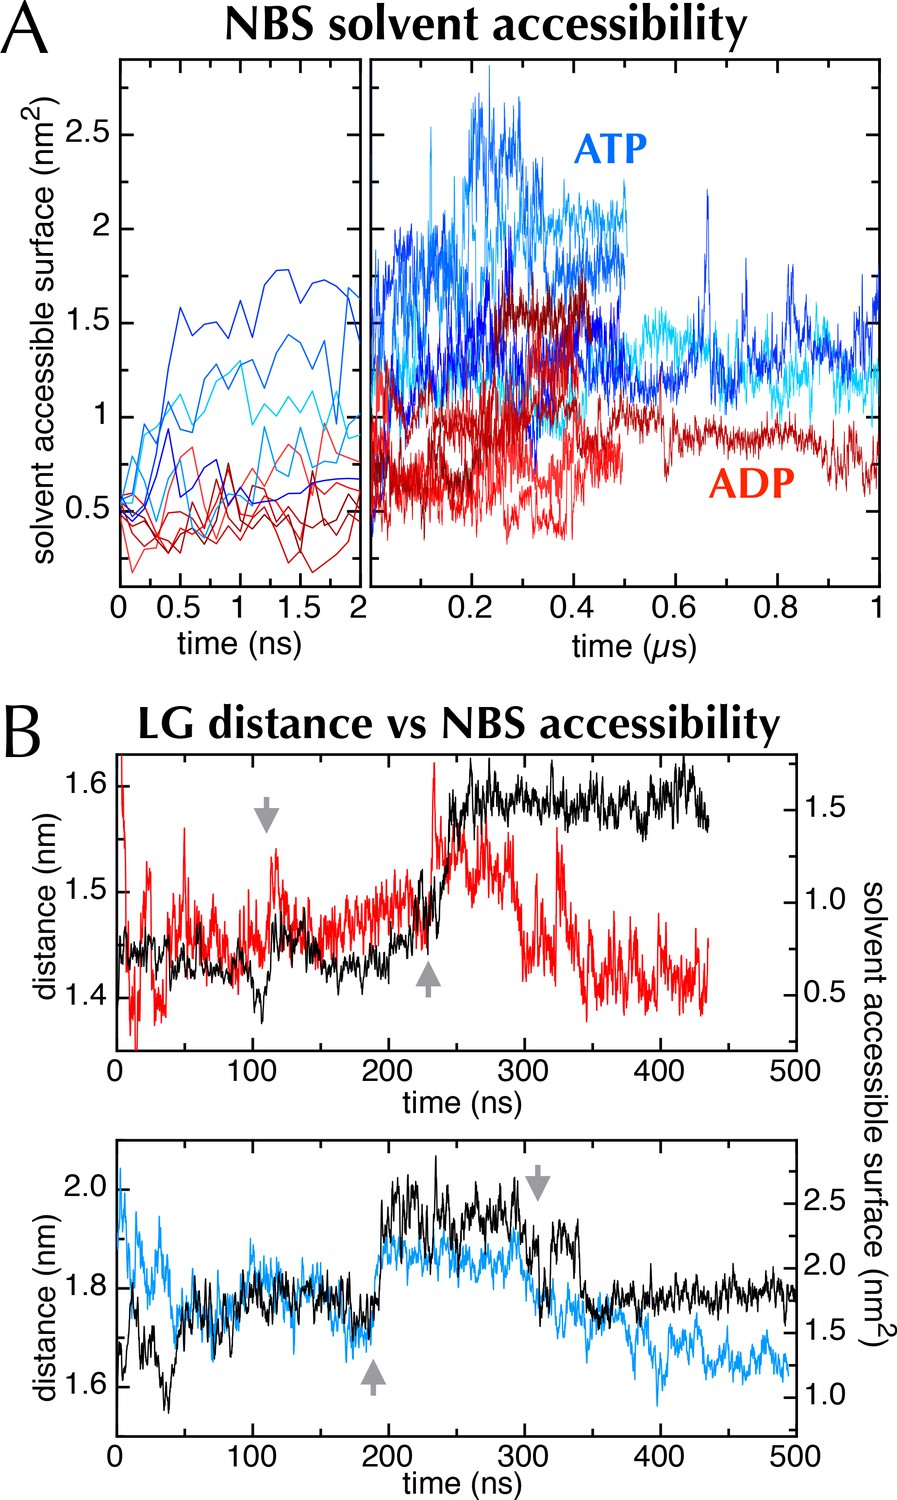
(A) Nucleotide solvent accessible surface (calculated with the GROMACS utility g_sas (Eisenberg and McLachlan, 1986) and adjusted for size of the nucleotide) as a function of simulation time for all 10 MD traces shown in Figure 2C. Some of the ATP and ADP samples diverge within the first ns; to show this, the first 2 ns of the plot is expanded. The ATP-containing samples generally occupy more open conformations, as shown in Figure 6A–B. (B) Comparison of distance across the SecY LG (red line for ADP (upper panel), blue line for ATP [lower panel]) with SecA nucleotide binding site solvent accessible surface (black lines [both panels]). Both MD simulations exhibit sudden changes in distance across the LG, which coincide with abrupt changes in the NBS (grey arrows), lending qualitative support to the idea that the two distal sites are communicating.
Figure 6—figure supplement 2
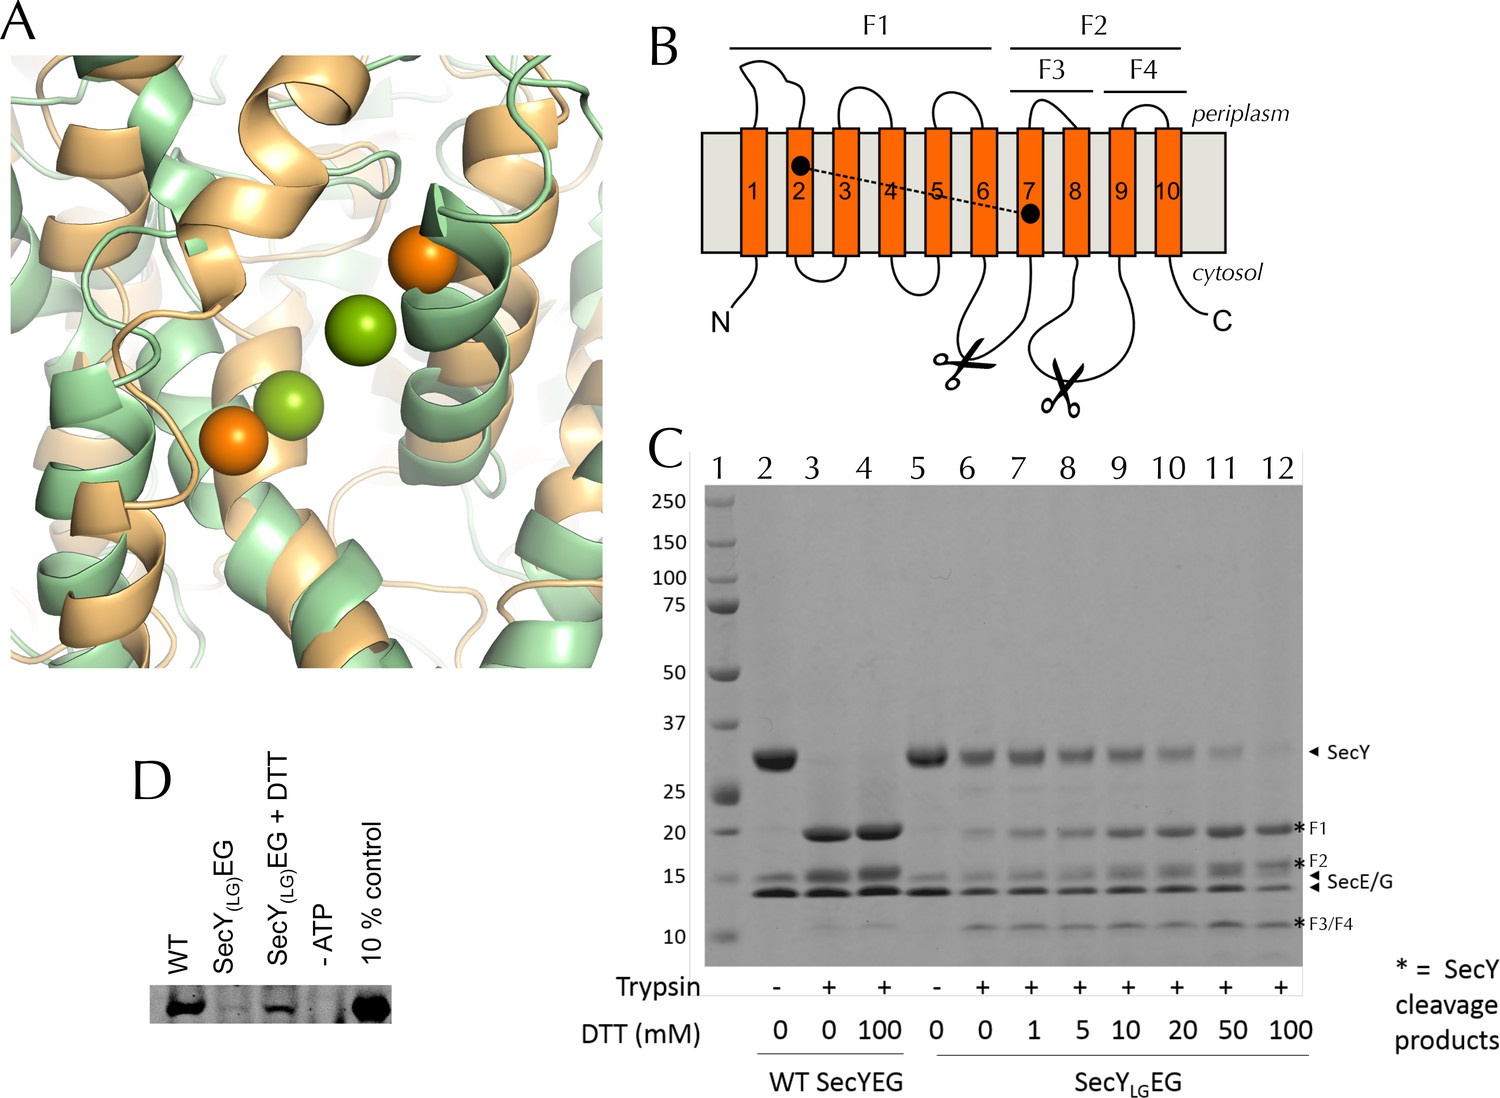
Validation of SecYLGEG
(A) Post-100 ns MD snapshots of the LG of uncrosslinked SecYLGEG-SecA with ADP (green) and ATP (orange). The γ-sulphur atom of each cysteine is shown as a sphere. The simulations demonstrate that the double cysteine mutation used to crosslink the LG of SecY does not prevent the nucleotide-dependent conformational changes observed in the wild-type complex (Figure 2C). (B) Schematic diagram of SecY, with the ten TMs labelled and the SecYLG crosslinking sites (S87C and F286C) shown as black circles. The primary and secondary trypsin cleavage sites – between TMs 6–7 and TMs 8–9, respectively – are also indicated. Cleavage with trypsin yields two major fragments (F1 and F2), with F2 partially cleaved again (into F3 and F4). Note that if a disulphide bond is formed (dashed line), F1/F2 and F1/F3 will not separate by non-reducing SDS-PAGE and will resemble full length SecY. (C) Coomassie stained SDS-PAGE of a trypsin proteolysis experiment, to test the degree of crosslinking of DDM-solubilised SecYLGEG. Full-length SecY runs at ~32 kDa, and the primary SecY trypsin fragments at ~19 and 15 kDa. The first lane (1) contains a molecular weight ladder. Other lanes, from left to right, contain: wild-type SecYEG, untreated (2); treated with 0.75 µg.ml-1 porcine trypsin (3); or treated with trypsin after incubation with 100 mM DTT (4). Lanes 5–12 contain SecYLGEG alone (5) or treated with trypsin following incubation with various concentrations of DTT as indicated in the panel. The full-length wild-type SecY is fully cleaved both with and without DTT. In contrast, the oxidised SecYLGEG (no DTT) digest resembles that of the intact (no trypsin) wild-type SecY, and is progressively more cleaved with increasing DTT concentration, until it is almost fully cleaved at 100 mM DTT. The results are consistent with essentially complete disulphide bond formation. Note that fragment F4 runs at ~12 kDa. As its cleavage site is unaffected by the disulphide, it is present in the same amount in all lanes that have been treated with trypsin. Note also that reconstitution into PLs occludes the trypsin cleavage site of inward-facing SecYs, so the degree of crosslinking for SecYLGEG cannot be determined in a lipid environment. (D) Representative blot showing translocation of pre-protein by SecYLGEG driven into the interior of PLs by SecA and ATP. Reaction lanes show a western blot of the protease-protected pOA after a 30 min translocation reaction. The -ATP lane is a negative control, using the same components but lacking ATP. The 10% lanes show the starting material, untreated with protease K (1/10th the amount loaded). As reported previously (du Plessis et al., 2009) the SecYLGEG mutant is severely compromised in translocation, but activity is partially restored by addition of DTT.
Figure 6—figure supplement 3
Additional data for the crosslinked SecYLGEG.
(A) Fluorescence of 10 nM SecA* upon titration with SecYEG (blue), SecYLGEG (red), or SecYLGEG pre-incubated with 100 mM DTT (yellow), in the presence of 1 mM AMPPNP and normalised to SecA* alone. Error bars represent the SEM from three repeats, and data were fitted to the tight binding equation, yielding KD = 23.5 ± 0.2 nM, Bmax = 47 ± 1% for SecYEG; KD = 41 ± 7 nM, Bmax = 31 ± 1% for SecYLGEG; and KD = 19 ± 3 nM, Bmax = 40 ± 1% for SecYLGEG + DTT. As can be seen, crosslinking the LG causes a minor (<2-fold) reduction in affinity for SecA, but a more striking difference in Bmax (as seen also in Figure 6C). (B) Steady-state ATPase kinetic parameters for SecA in the presence of SecYEG (blue) or SecYLGEG (red). Bar heights are average fits to the Michaelis-Menten equation for three repeats, and error bars represent the SEM. The raised Km and lowered kcat are consistent with both ATP binding and ADP release being compromised upon cross-linking the LG—i.e. closing of the NBS. This also supports the results shown in Figure 6C+D.
Figure 7 with 3 supplements
Involvement of the 2-helix finger in SecY <–> SecA communication.
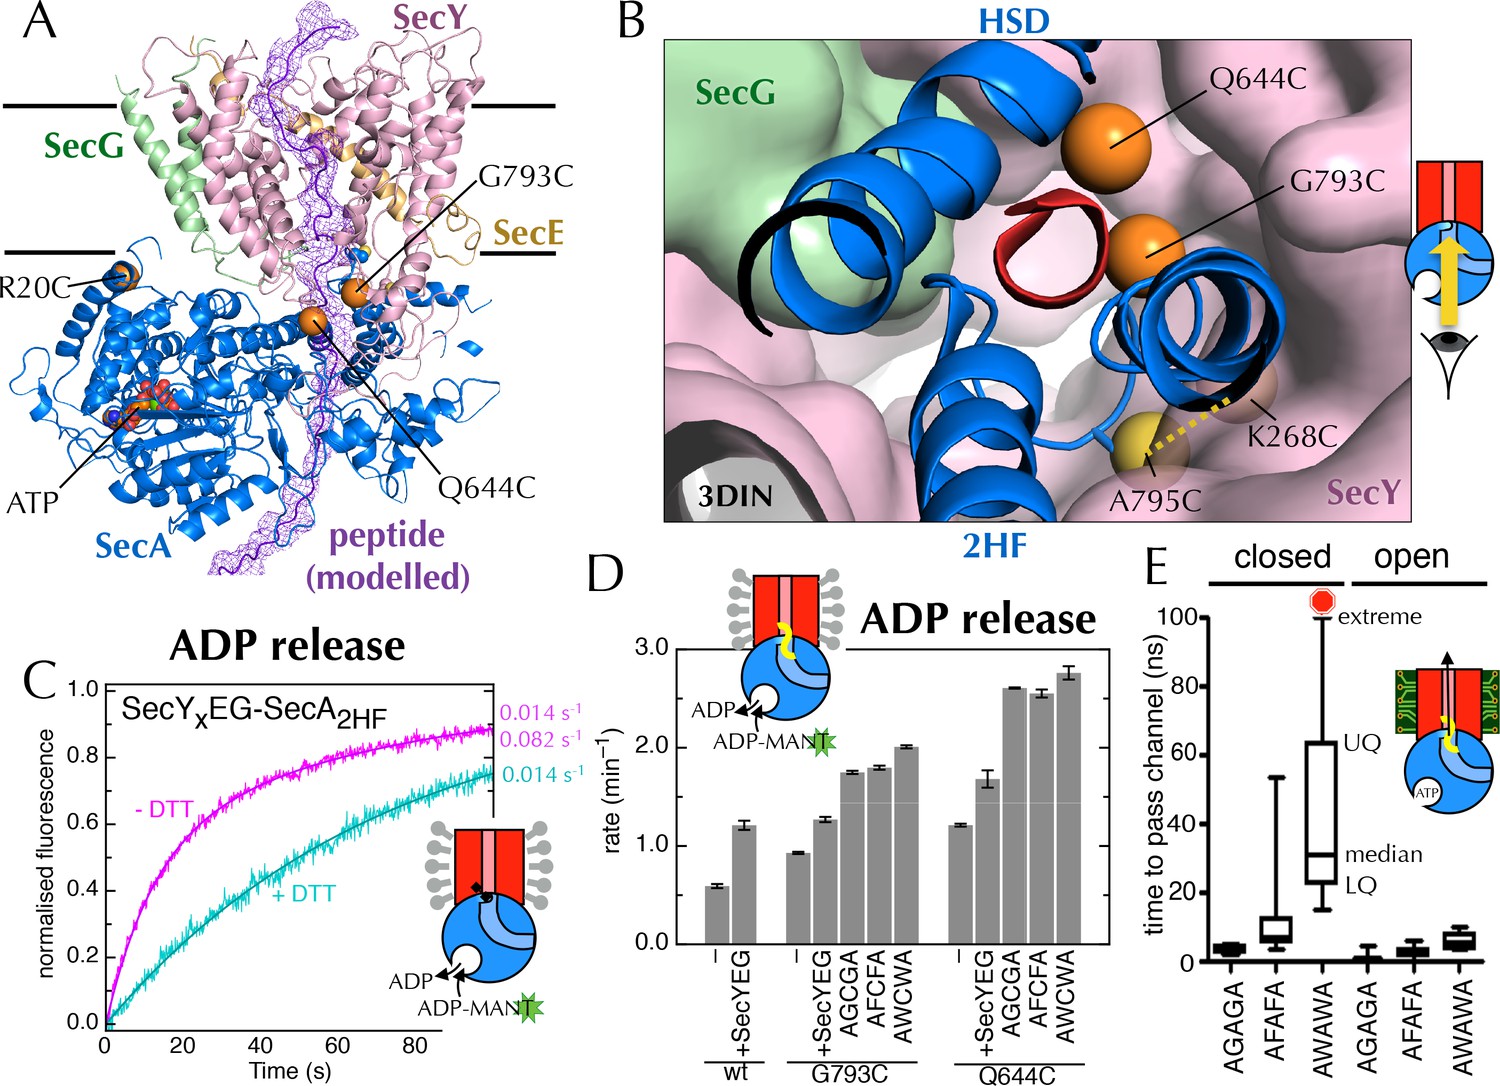
(A) Overview cartoon structure of the 1 µs open SecYEG-SecA complex with SecY in pink, SecE orange, SecG green and SecA blue. Residues 27–76 of E. coli pOA, shown as a purple ribbon with a mesh surface, have been modelled into a likely pathway through the channel, based on known crosslinking data through SecA (Bauer and Rapoport, 2009) and SecY (Cannon et al., 2005). The three peptide crosslinking sites on SecA (R20C, Q644C and G793C in E. coli numbering; K32C, T640C and S780C in T. maritima) are shown with the Sγ atoms as orange spheres. (B) Closeup structure of the SecY channel entrance with SecA bound (T. maritima, PDB code 3DIN [Zimmer et al., 2008]), looking into the channel from the cytosolic side and coloured as in panel A. SecY, SecE and SecG are shown as surfaces, while the 2HF and HSD (helical scaffold domain) of SecA are shown in cartoon representation. The SecA peptide cross-linking sites SecA644 and SecA793 in E. coli (respectively SecA640 and SecA780 in T. maritima) are indicated by orange spheres; while the ATPase-activating SecA-SecY cross-linking sites (Whitehouse et al., 2012) (residues SecA795/SecY268 in E. coli, SecA782/SecY264 in T. maritima) are yellow spheres. To give an impression of size a short α-helix (red) has been modelled into the channel opening. (C) Stopped flow fluorescence traces of ADP release by 0.6 µM SecYxEG-SecA2HF and 1 mM ADP without (magenta) or with (turquoise) 30 min pre-incubation with 100 mM DTT. Data were fitted to a double (magenta) or single (turquoise) exponential as described in methods. (D) ADP release rates determined by fluorescence stopped flow for wild-type SecA (wt), SecAG793C and SecAQ644C. Rates are shown for SecA alone; with an excess of SecYEG; and, where relevant, crosslinked to the peptides AGCGA, AFCFA or AWCWA (and in the presence of saturating SecYEG). Error bars represent the SEM from three independent experiments. Stopped flow traces are shown in Figure 7—figure supplement 2B. (E) Transit time for the peptides AGAGA, AFAFA or AWAWA through the closed (left) and open (right) SecY pore during constant force steered MD simulations. Each simulation was repeated ten times to produce the box plots. Two AWAWA peptides failed to cross the closed SecY channel within 100 ns (red octagon).
Figure 7—figure supplement 1

ATP turnover by crosslinked SecYxEG-SecA2HF.
Turnover of ATP by SecYEG-SecA (SecA in the presence of saturating SecYEG; grey) or SecYxEG-SecA2HF (magenta) in detergent solution. Error bars represent the SEM from three repeats.
Figure 7—figure supplement 2
Supporting data for the 2HF labelling.
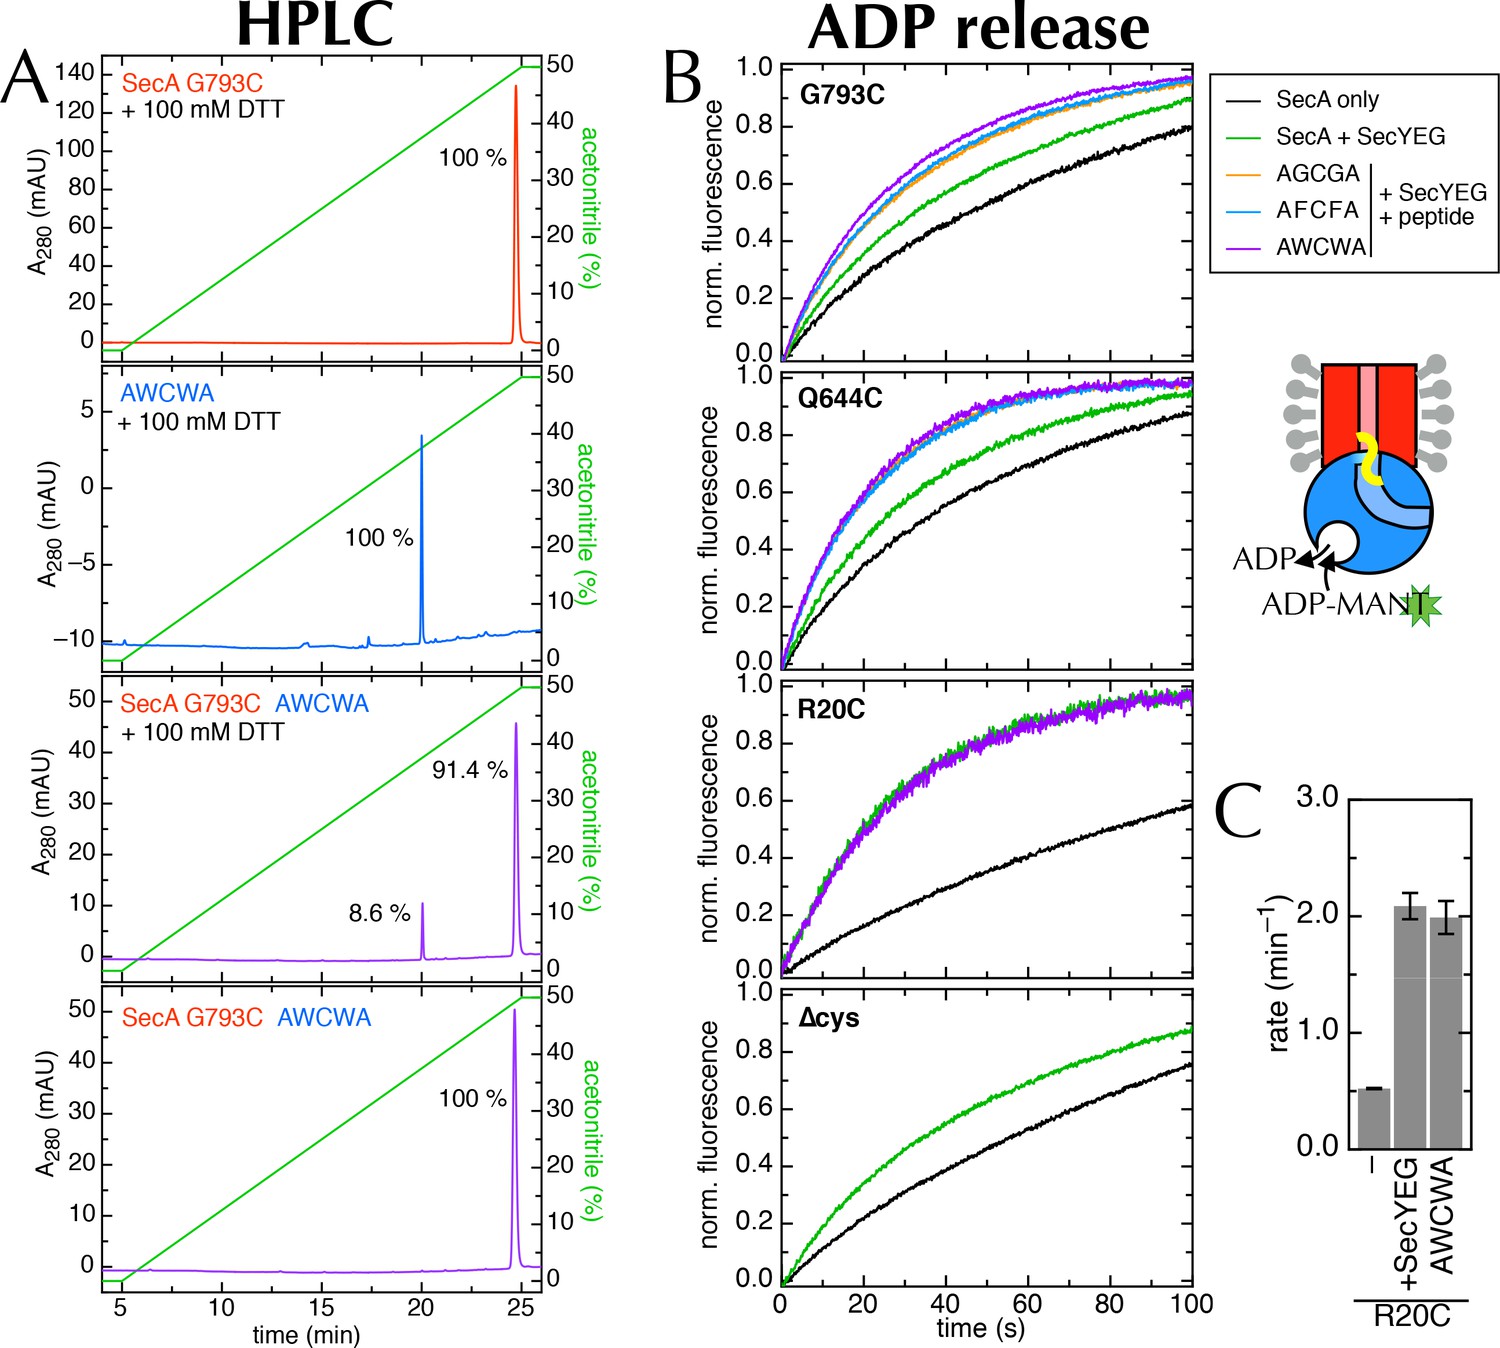
(A) HPLC traces of SecAG793C (Figure 7A), the peptide AWCWA, and SecAG793C crosslinked to AWCWA, either with or without 20 min pre-incubation 100 mM DTT to break the disulphide bond. HPLC with DTT confirms that AWCWA is present on the crosslinked protein, while HPLC without DTT confirms that they are indeed connected by a disulphide bond. Dividing the peak integrals by the extinction coefficients of the components (ε = 99,000 M-1.cm-1 for SecA, determined experimentally; and ε = 11,380 M-1.cm-1 for AWCWA, calculated) gives an estimated labelling efficiency of 82%. Note that incomplete reduction of the disulphide bond would lead us to underestimate this value. Because only the tryptophan-containing (AWCWA) peptide has an appreciable UV absorption signal, we were unable to quantify labelling with the other two peptides. However, as the peptide labelling experiments were performed in parallel, and AWCWA is the least soluble of the three, AGCGA and AFCFA are likely to have crosslinked with the same or better efficiencies. (B) Stopped flow time traces for the data shown in Figure 7D and panel C. For ease of comparison, data were fitted to a single exponential, then normalised to an amplitude of 1. Note that SecAR20C was not tested with AGCGA or AFCFA, and SecA∆cys was not tested with any peptide, as it has no cross-linking site. (C) Rates of ADP release for SecAR20C alone; with excess SecYEG; and crosslinked to the peptide AWCWA (and in the presence of excess SecYEG). For this position, which is not near the entrance to SecY (Figure 7A), the crosslinked peptide has no effect on the rate of ADP release.
Figure 7—figure supplement 3
Entrance to the protein channel of SecY
(A) Closeup of the SecY channel entrance after 1 µs MD in a representative open (ATP, above; O in Figure 2C) and closed (ADP, below, C in Figure 2C) conformations. SecYEG is shown as a surface with SecY in pink, SecE in orange and SecG in green, while the 2HF of SecA is shown as a blue cartoon. Note that LG closure favoured by ADP leads also to closure of the central protein channel. (B) Side-view of SecYEG-SecA with the pentapeptide AWAWA modelled at the interface between SecY and SecA. SecY, E, G and A are shown as pink, orange, green and pale blue cartoons, respectively. The 2HF is highlighted in bright blue, and the peptide is shown as red sticks overlaid with a red mesh. The direction of pulling in the steered MD experiments (Figure 7E) is indicated by a red dotted arrow.
Figure 8
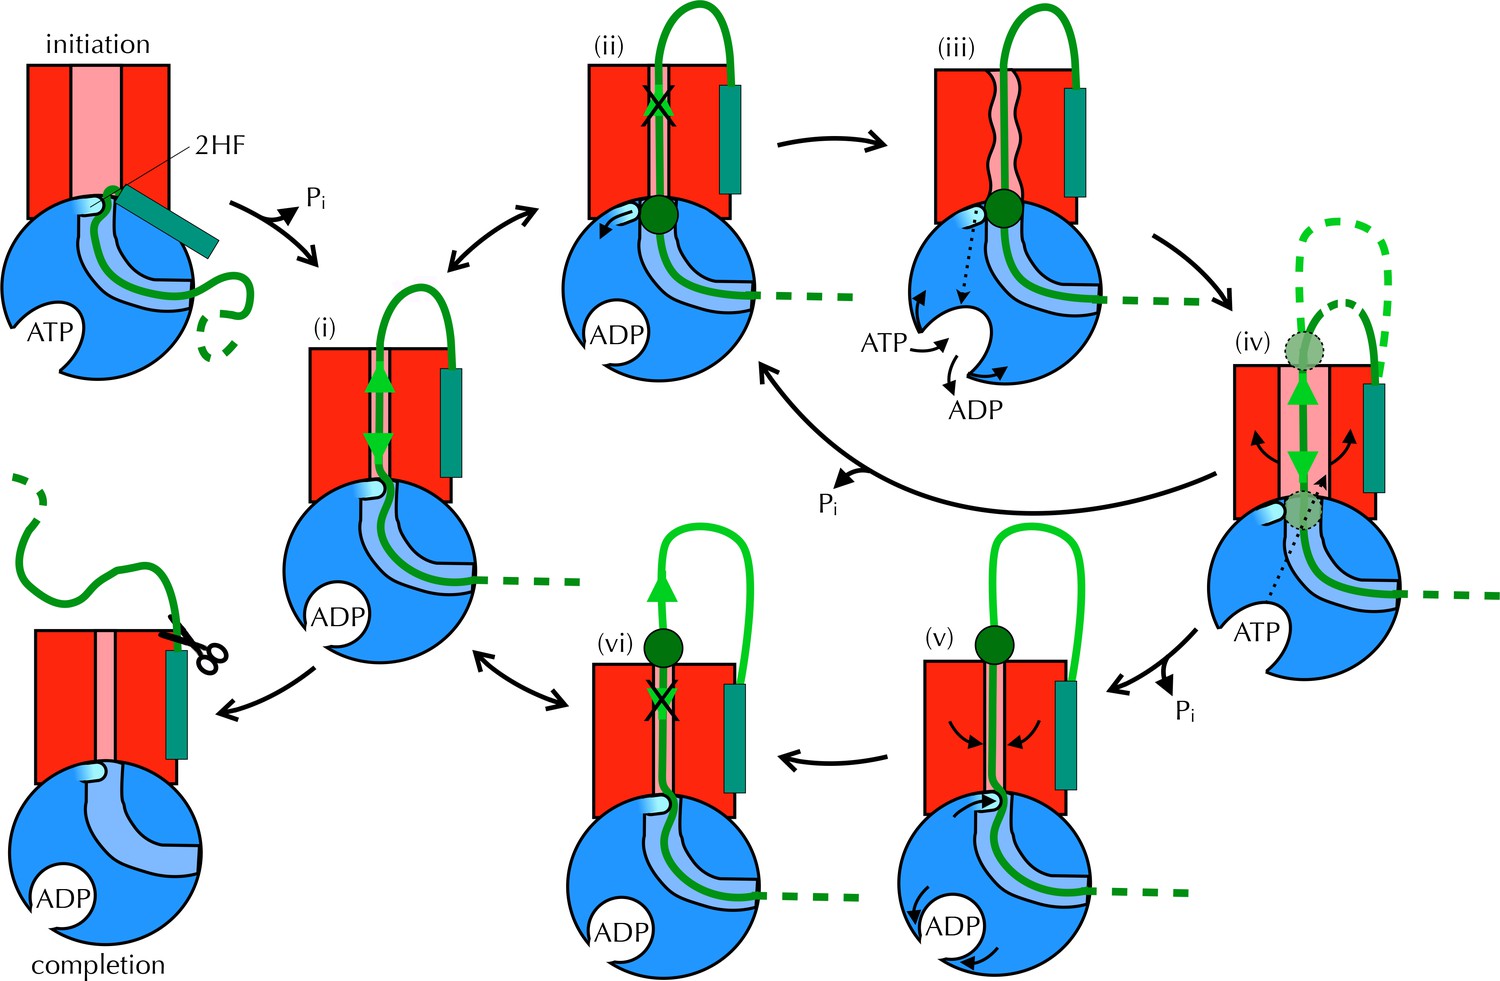
Proposed Brownian ratchet mechanism for translocation.
SecYEG is shown in red (LG in light red), SecA in blue (substrate channel in light blue and 2HF in cyan and indicated), and substrate in green (with signal sequence as a turquoise rectangle). The initiation process (top left) involves conformational changes that prime the SecY-complex and intercalate the pre-protein (Hizlan et al., 2012; Corey et al., 2016). Subsequently, the substrate is free to diffuse backwards or forwards (i) until it reaches a block (green circle) at the entrance (ii) or exit (vi) to the channel. A block at the entrance triggers nucleotide exchange (iii), which leads to opening of the LG (iv). The wider channel permits diffusion of the blocked region of substrate within the pore, until ATP hydrolysis recloses the channel, trapping the block either outside (v) or inside (ii) the membrane. This cycle produces a net forwards driving force because blocks at the channel exit (vi) do not trigger nucleotide exchange and channel opening; the substrate is therefore ratcheted in one direction. Once the entire chain emerges from the channel it can no longer diffuse backwards and cleavage of the signal sequence is all that remains (completion).
Author Response Image 1
Videos
Video 1
Proposed Brownian ratchet mechanism for translocation The proposed Brownian ratchet model for protein translocation, as presented in Figure 8.
Video produced by Nan Burston.
Download links
A two-part list of links to download the article, or parts of the article, in various formats.
Downloads (link to download the article as PDF)
Open citations (links to open the citations from this article in various online reference manager services)
Cite this article (links to download the citations from this article in formats compatible with various reference manager tools)
Two-way communication between SecY and SecA suggests a Brownian ratchet mechanism for protein translocation
eLife 5:e15598.
https://doi.org/10.7554/eLife.15598


