PtdInsP2 and PtdSer cooperate to trap synaptotagmin-1 to the plasma membrane in the presence of calcium
- Max Planck Institute for Biophysical Chemistry, Germany
- University of Virginia, United States
- Georg-August University Göttingen, Germany
Figures
Figure 1
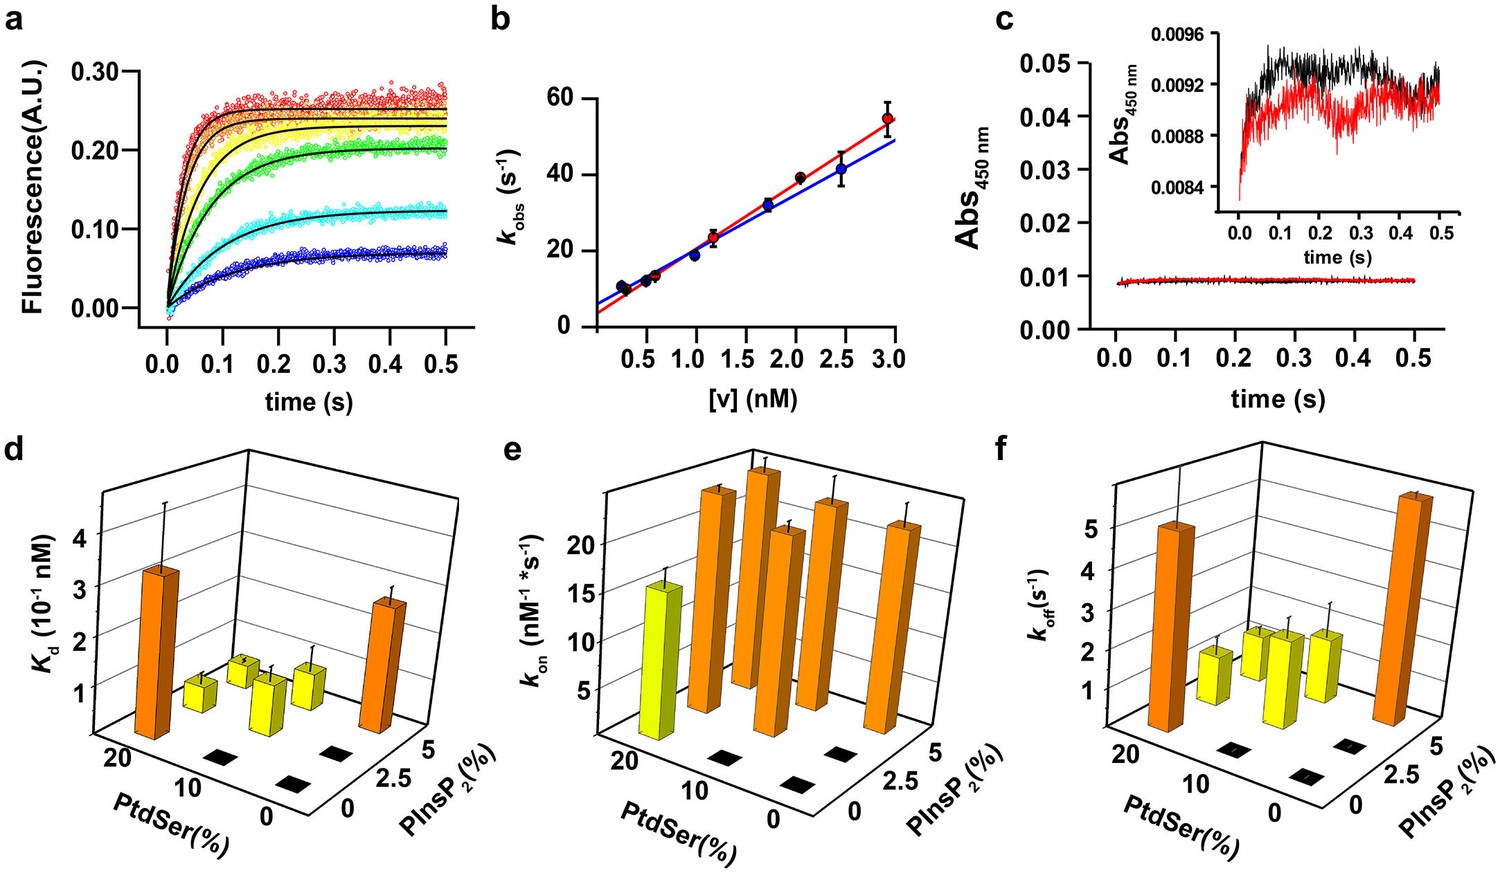
PtdIns(4,5)P2 and PtdSer act cooperatively in the membrane binding of the C2AB fragment.
(a) Representative time courses of dansyl emission for rapid mixing of 0.25 µM syt-1 C2AB fragment (final concentration) with increasing concentrations of large unilamellar vesicles (final liposome concentrations ranging between 0.3 nM and 3 nM) containing PtdChol:PtdSer (80:20, molar ratio), measured at 25°C. The apparent rate constant kobs was determined by fitting the traces to a monoexponential function (solid black lines). (b) The dependence of kobs on the vesicle concentration: data from two different sets of liposomes used for the stopped-flow experiment shown in (a). The non-zero y-intercept of the linear regression curve yields koff and the slope yields kon. (c) Representative absorbance time course (n = 2) for rapid mixing of C2AB fragment (0.25 µM, final concentration) and vesicles (~2.5 nM). Absorbance was monitored at 450 nm for vesicles containing PtdChol/PtdSer/PtdIns(4,5)P2 (75:20:5, molar ratio). No aggregation of vesicles was observed in our conditions, even when lipid mixtures with the highest affinity to C2AB fragment were used. (Inset) A scale-up of the traces showing that there is no vesicle aggregation in our conditions in concordance to the results of Vennekate et al. (2012). (d) Kd values, calculated as the ratio of koff/kon, (e) kon and (f) koff of C2AB fragment binding to liposomes containing different concentrations of PtdSer and PtdIns(4,5)P2. All values were calculated from stopped-flow experiments carried out by rapid mixing of C2AB fragment with vesicles containing different amounts of PtdSer and/or PtdIns(4,5)P2, and 100 µM free Ca2+ at 25°C (n = 5–10). Higher affinities (lower Kd) were observed in the presence of both PtdSer and PtdIns(4,5)P2, solely resulting from a decrease in koff. Columns with the same color indicate values that were not significantly different from each other. Black boxes indicate either lack of binding or low binding that was too noisy for a reliable quantitative analysis.
Figure 2
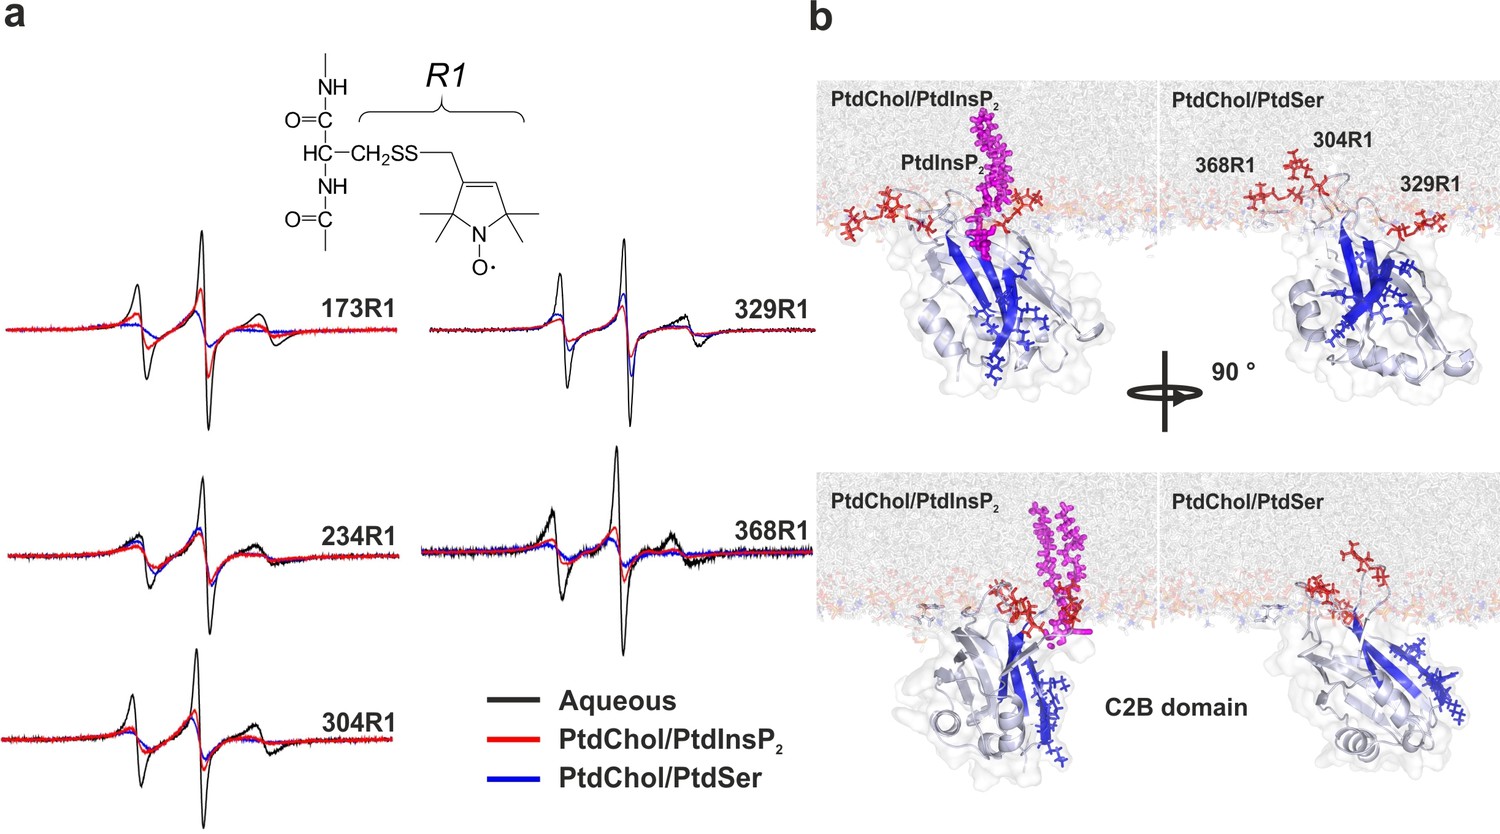
Orientation of the C2 domains bound to membranes containing either PtdSer or PtdIns(4,5)P2.
(a) EPR spectra from sites 173, 234, 304, 329 and 368 in solution or bound to bilayers containing PtdChol/PtdSer (80:20, molar ratio) or PtdChol/PtdInsP2 (95:5, molar ratio). The broader spectra reflect diminished amplitudes and rates of R1 label motion when the C2AB fragment is bound to vesicles containing PtdChol/PtdIns(4,5)P2 (95:5, molar ratio) or PtdChol/PtdSer (80:20, molar ratio) (n = 2–3). R1 is the spin-labeled side chain produced by derivatizing cysteine with the MTSL spin label. (b) Docking orientation of the C2B domain (PDB ID: 1K5W [Fernandez et al., 2001]) at the membrane interface, polybasic patch in blue. In this figure, the result from Xplor-NIH (Materials and methods) was aligned with a membrane simulation generated by CHARMM-GUI (Jo et al., 2008) for a bilayer with PtdChol:PtdInsP2 or PtdChol:PtdSer at a molar ratio of 97:3 or 80:20, respectively. PtdIns(4,5)P2 (pink sticks) was manually docked to the C2B domain. Blue sticks correspond to residues 321–326 and red sticks correspond to R1-labeled residues used in EPR experiments.
Figure 3 with 1 supplement
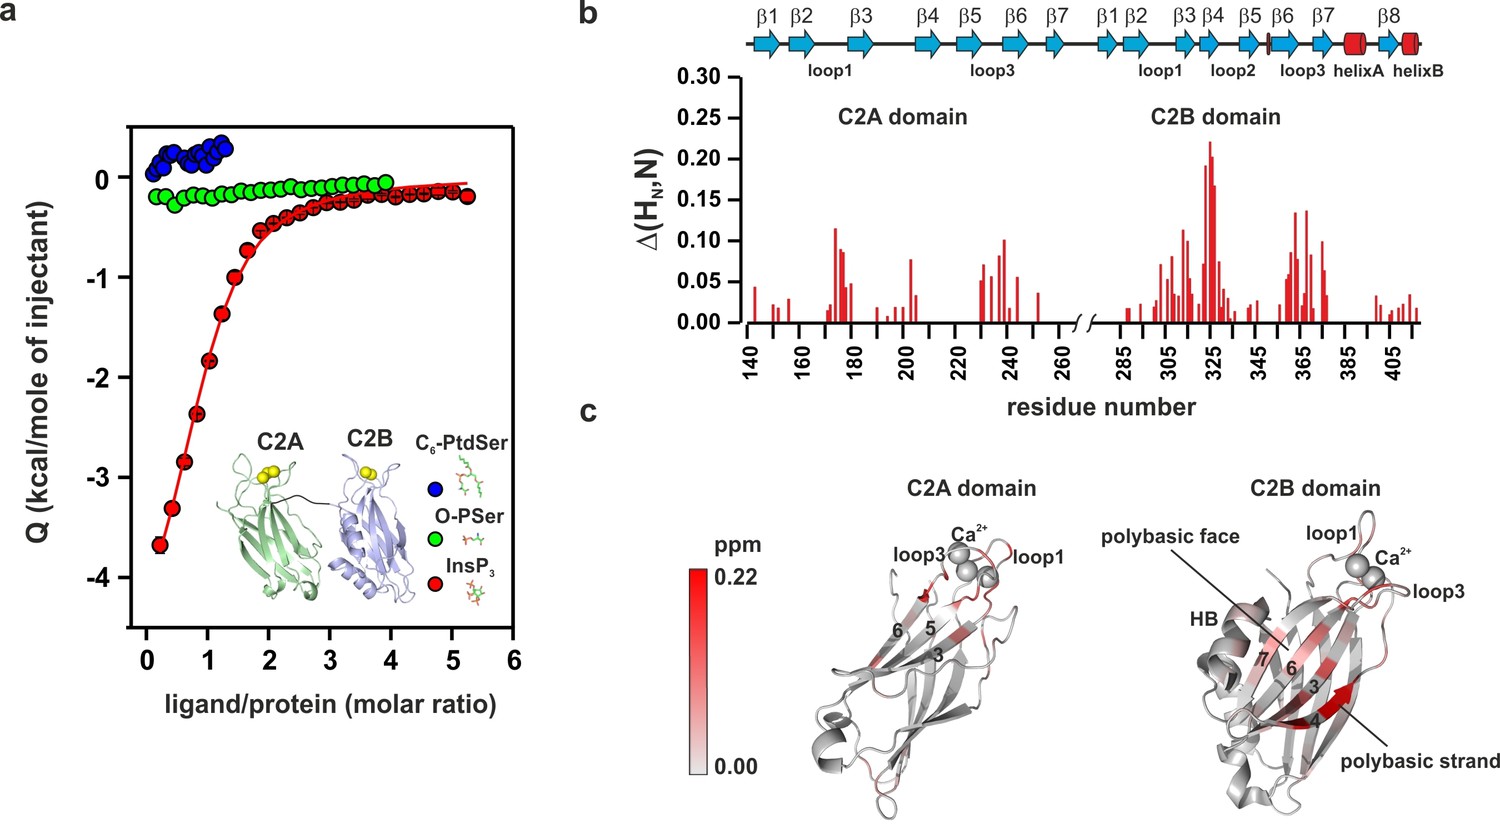
PtdIns(4,5)P2 binds preferentially to the polybasic patch of the C2B domain.
(a) Binding of the C2AB fragment to phospholipid head groups measured by isothermal titration calorimetry (ITC). Titration of ~50 µM C2AB fragment (50 mM HEPES, pH 7.4, 150 mM NaCl and 1 mM CaCl2) with InsP3 (inositol-1,4,5-triphosphate) (n = 3), O-phosphoserine (O-PSer) (n = 2) and 1,2-hexanoyl-sn-glycero-3-phospho-L-serine (C6-PtdSer) (n = 2), in the presence of saturating Ca2+ at 25°C. Only small heats were observed upon addition of C6-PtdSer and O-PSer, while InsP3 binds specifically (Kd = 14 ± 2 µM) with a stoichiometry of 1:1. (b) Averaged-weighted chemical shifts (△HN, N) in 15N-1H correlated HSQC NMR spectra of syt-1 in the presence of InsP3 and Ca2+. Chemical shift changes are widely distributed in the polybasic region of C2B domain. Small chemical shift are also seen in the calcium-binding loops of the C2B and C2A domains. Measurements were made under normal ionic strength (150 mM NaCl, 50 mM MES, pH = 6.3, and 3 mM Ca2+) at a frequency of 600 MHz for protons. (c) Chemical shifts are color coded and mapped onto the structures of C2B and C2A domains according to the color bar (n = 2–3).
Figure 3—figure supplement 1
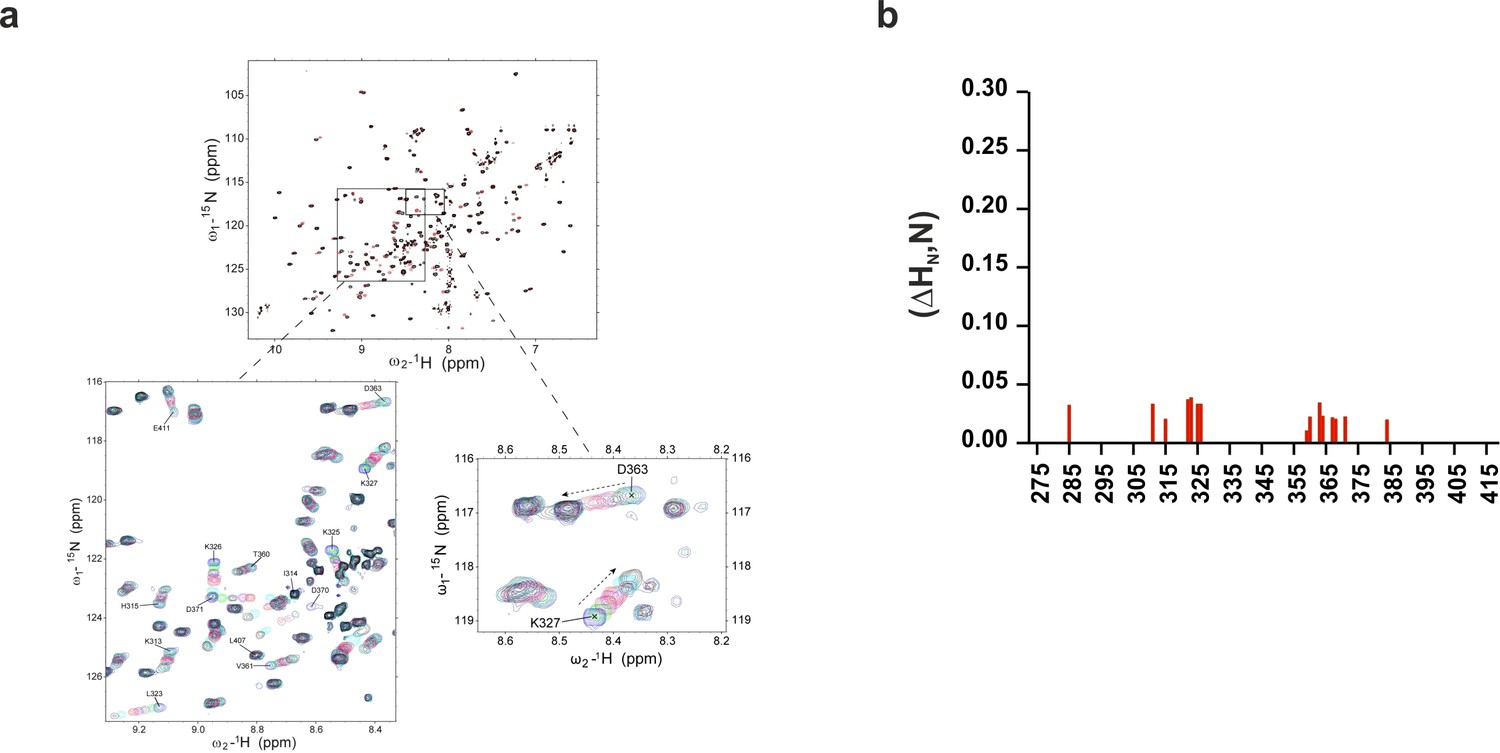
Chemical shift of 1H-15N HSQC of C2B domain in the presence of InsP3 or O-PSer.
(a) Chemical shifts of 1H-15N HSQC of C2AB fragment in the absence (black) and in the presence of 2 mM InsP3 (red). The expanded section of the HSQC spectrum shows chemical shift changes upon titration with different concentrations of InsP3 (0 mM, blue; 0.1 mM, green; 0.2 mM, maroon; 0.3 mM, purple; 0.5 mM, red; 1 mM, cyan and 2 mM, black). (b) Average weighted chemical shifts (△HN,N) in the presence of 7 mM O-phosphoserine. Measurements are made under normal ionic strength conditions (150 mM NaCl, 50 mM MES, pH = 6.3, and 3 mM Ca2+) at a frequency of 600 MHz for protons.
Figure 4 with 2 supplements
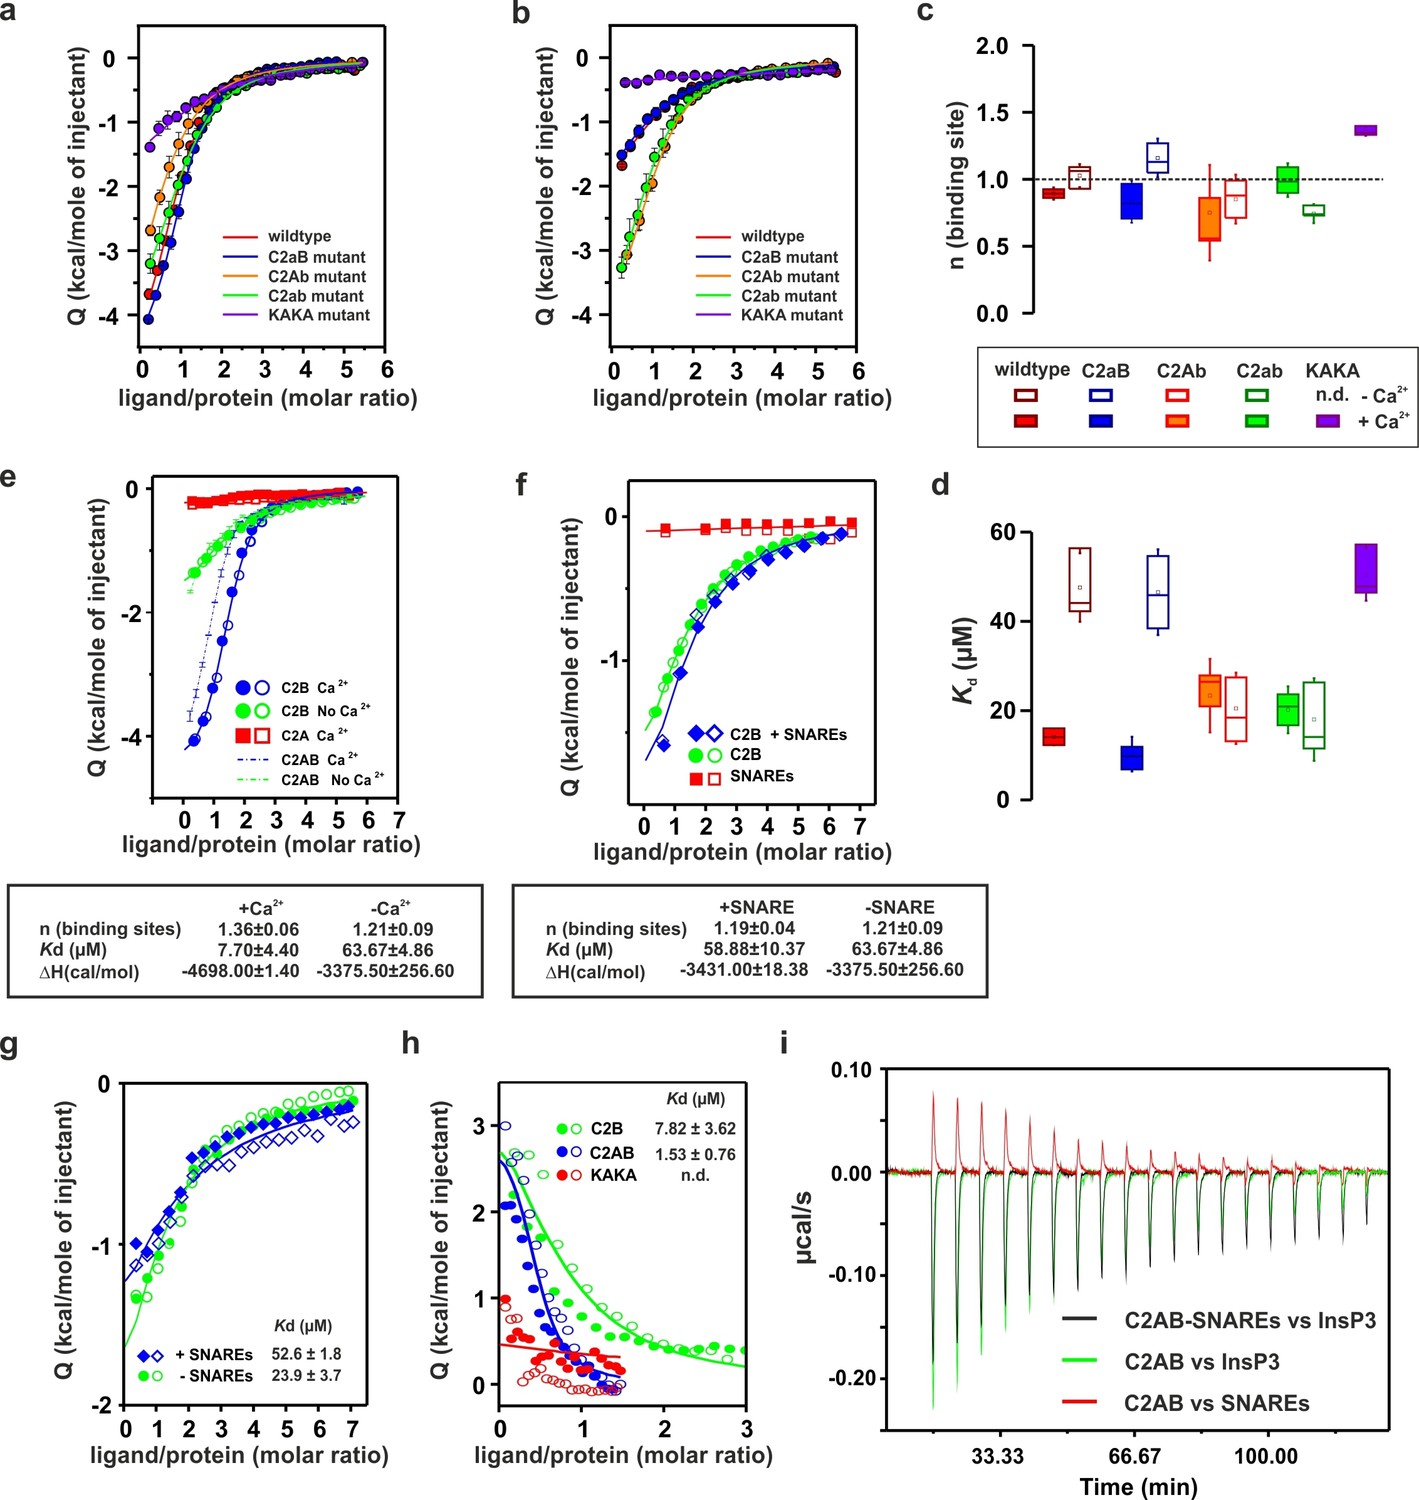
Ca2+ increases the affinity of PtdIns(4,5)P2 to the polybasic patch by means of shielding the negative charges of the Ca2+-binding site in the C2B domain.
(a,b) Representative ITC titrations (n = 3–6) of ~50 µM of the wild-type C2AB fragment, mutant proteins in which either one or both Ca2+ binding sites are mutated, and the KAKA mutant in which some of the charges in the polybasic patch are removed. Titrations were carried out with InsP3 as shown in Figure 3a in (a) the presence or (b) the absence of Ca2+. Lines represent the fitting of the different titrations. (c) Number of binding sites determined from the fits of the ITC experiments of the different C2 domains shown in (a) and (b). All C2 domains show one binding site for InsP3 in the presence or absence of Ca2+. In absence of Ca2+, binding of InsP3 to the KAKA mutant was completely abolished. (d) Dissociation constants (Kd) calculated from the experiments shown in (a) and (b). In the presence of Ca2+, only the KAKA mutant shows a significant decrease in the binding to InsP3. In the absence of Ca2+, mutations in the C2B Ca2+-binding site rescue the binding to InsP3, where as the KAKA mutant shows weak unspecific binding. (e) Titration of ~50 µM C2A domain (in the presence of Ca2+) and C2B domain (in the presence or absence of Ca2+) with InsP3 (n = 2) compared to that of the C2AB fragment in same conditions (see legend). The C2B domain is responsible for InsP3 binding to syt-1. (f) Titration of ~50 µM C2B domain–SNARE-complex (1:1, molar ratio) with InsP3 in the absence of Ca2+ (n = 2). The C2B domain binds preferentially to InsP3 in physiological conditions. (g) Titration of ~15 µM C2AB domain/SNARE-complex (1:1, molar ratio) with InsP3 in the absence of Ca2+ (n = 2). We set the number sites to one for the fitting due to the uncertainty resulting from the low concentrations used. (h) Titration of SNARE-complex ~15 µM with different syt-1 fragments in the absence of Ca2+ (n = 2). The Kd values from (g) and (h) should be interpreted with caution because the low concentration used for the titrations resulted in a high uncertainty on the fitting. (i) Representative raw data for titration from (g) and (h). Interestingly, titration of the C2AB–SNARE complex presented an endothermic profile, whereas titration of InsP3 presented an exothermic profile.
Figure 4—figure supplement 1
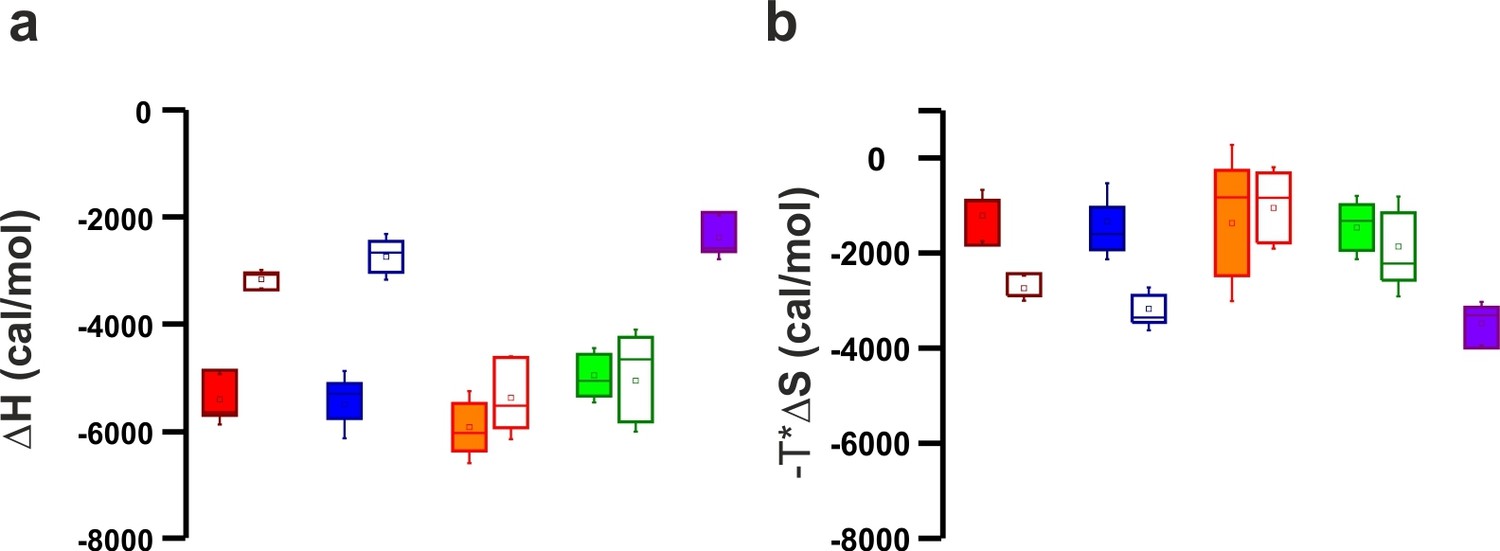
Thermodinamic binding parameters of the different C2AB fragments.
(a) Binding enthalpy (△H) and (b) entropy (-T*△S) for ITC titration in Figure 4a,b.
Figure 4—figure supplement 2
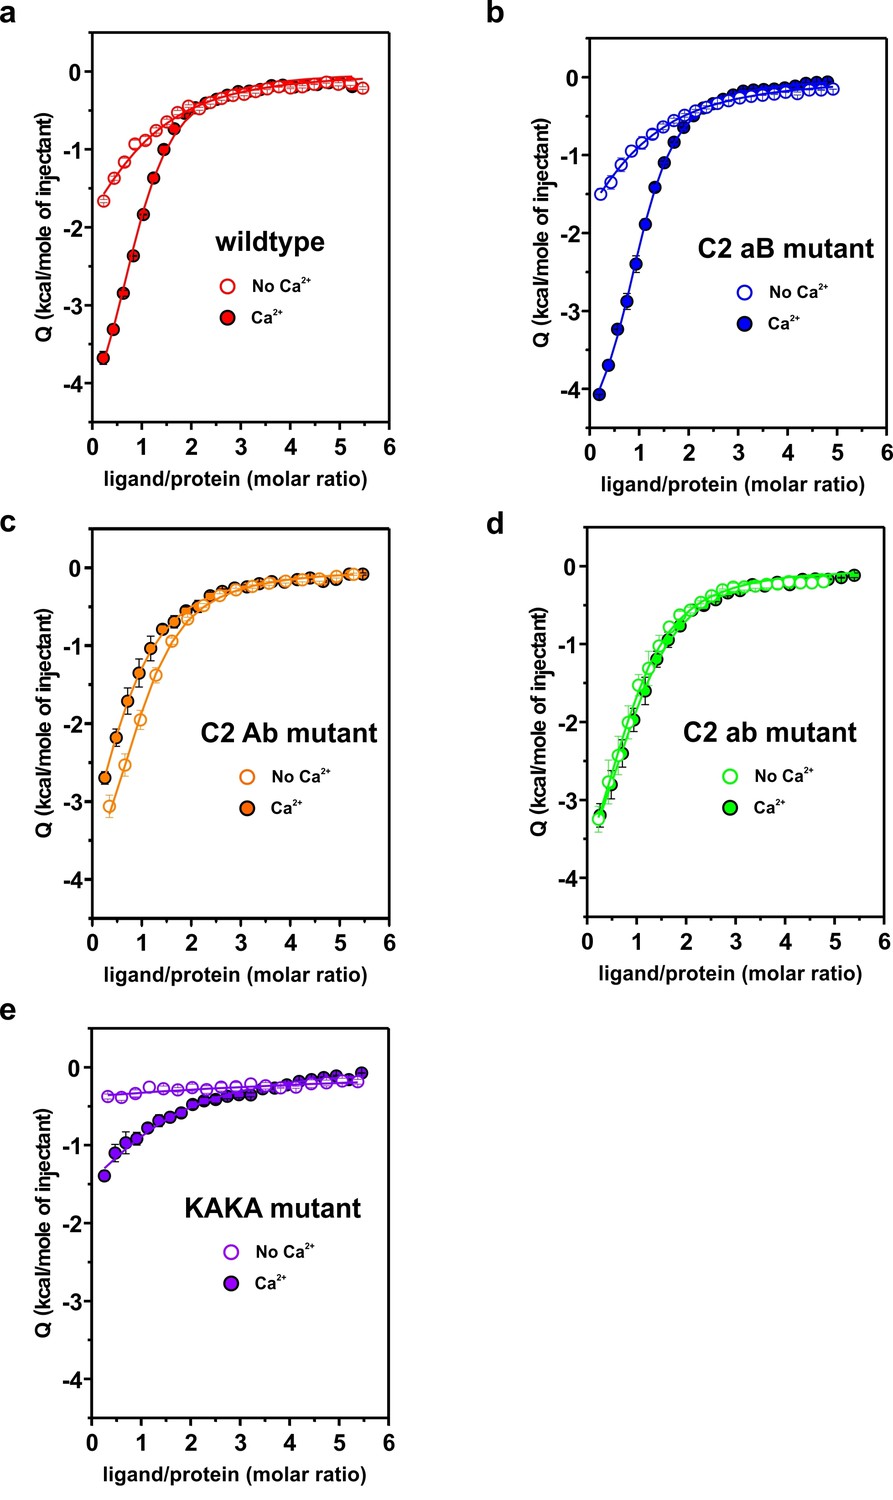
Representative titrations (n ≥ 3) of ~50 µM of the C2AB fragment used in Figure 4a,b in the presence or absence of Ca2+.
https://doi.org/10.7554/eLife.15886.010
Figure 5
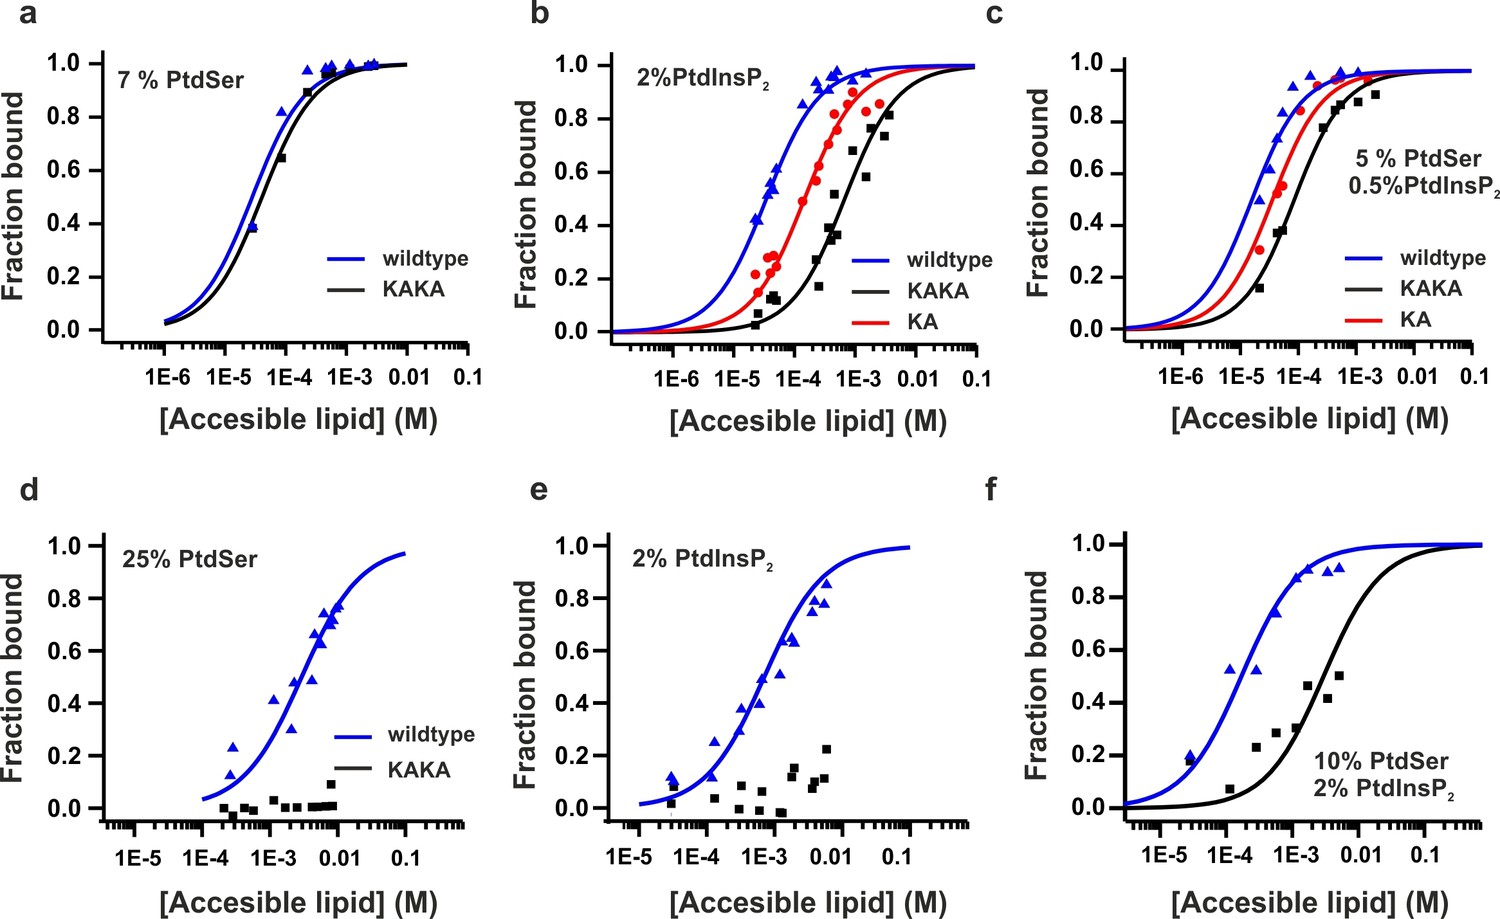
Equilibrium binding of the C2AB fragment and polybasic mutants to PtdChol, PtdSer and PtdIns(4,5)P2 bilayers.
(a,b,c) Ca2+-dependent and (d,e,f) Ca2+-independent partitioning of C2AB fragment into (a,d) PtdChol/PtdSer, (b,e) PtdChol/ PtdIns(4,5)P2 and (c,f) PtdChol/PtdSer/ PtdIns(4,5)P2 bilayers. (d,e) No binding of the KAKA mutant was observed in the presence of PtdSer or PtdIns(4,5)P2 alone in absence of calcium . At equivalent charge densities, removal of lysine residues within the polybasic face reduced the membrane affinity in vesicles containing PtdSer and PtdIns (4,5)P2 (c) more than it did in vesicles containing either (a) PtdSer or(b) PtdIns (4,5)P2 in the presence of calcium. The lines represent fits to the data using Eq [1] (Materials and methods). Reciprocal molar partition coefficients obtained from data are listed in Tables 2 and 3 (n = 2–3).
Figure 6 with 1 supplement
Ca2+ and phosphoinositides increase the membrane affinity of syt-1 by decreasing the dissociation rate of the syt-1–membrane complex.
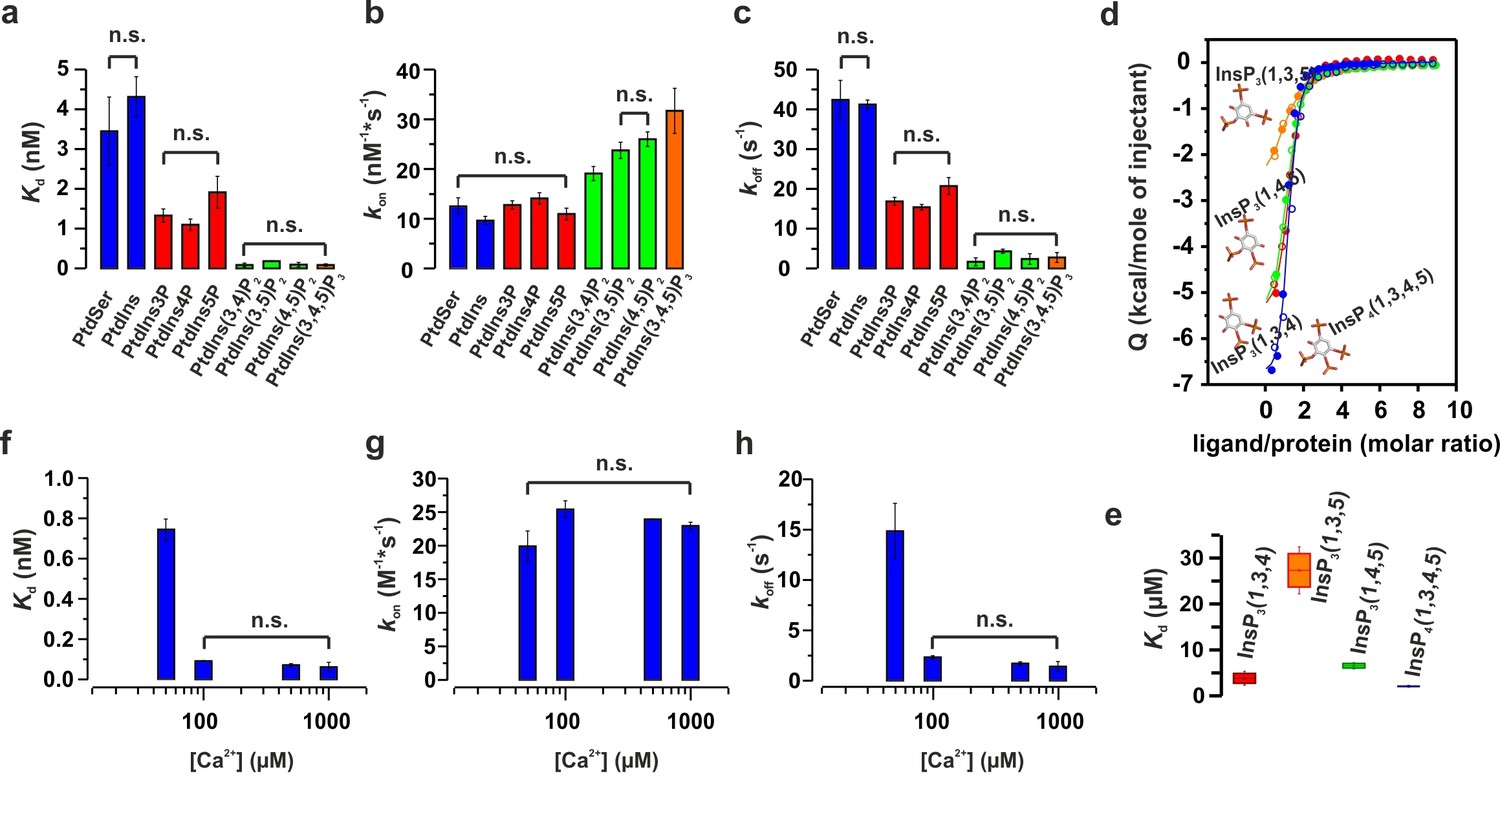
(a) Kd, (b) kon and (c) koff calculated from stopped-flow experiments carried out by rapid mixing, as in Figure 1, of C2AB fragment with vesicles containing PtdChol/PtdSer/PtdEth/Chol/PtdInsPX (55:11:22:11:1 molar ratio), where X = 0–3 phosphate groups, in 20 mM HEPES (pH 7.4), 150 mM KCl, 1 mM EGTA and 1.1 mM CaCl2 (100 µM free Ca2+) at 37°C (n = 5–10). An increased number of phospho groups of phosphoinositides increases the affinity by decreasing the dissociation rate (koff). A minor increase in kon was detected in the case of PtdInsP2–3. (d) Thermodynamic characterization of the binding of C2B domain to head groups of physiological phosphoinositides by ITC. Titration of ~50 µM C2B domain (50 mM HEPES (pH 7.4), 150 mM NaCl and 1 mM CaCl2) with main stereoisomers of InsP3–4 at 25°C (n = 2).(e) Dissociation constants (Kd) calculated for experiments from d. (f) Kd, (g) kon and (h) koff calculated from stopped-flow experiments carried out at different Ca2+concentrations with vesicles containing PtdChol/PtdSer/PtdEth/Chol/PtdIns(4,5)P2 (55:11:22:11:1 molar ratio) at 37°C (n = 5–10). Ca2+ decreases the rate of dissociation drastically (h) and thereby increases the affinity (f). No significant difference was observed for the rate of association (kon) (g).
Figure 6—figure supplement 1
ITC parameters of the C2B domain binding to different isomers of InsP3.
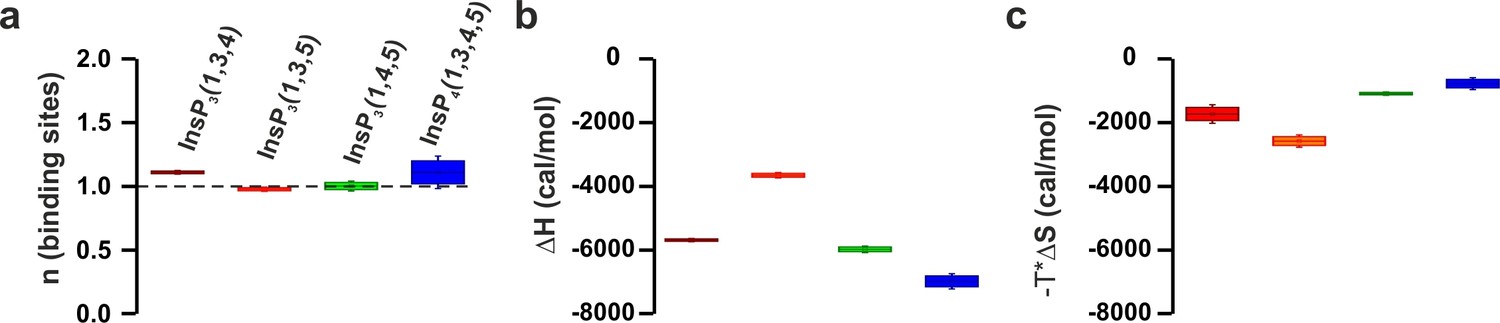
(a) Number of binding sites, (b) binding enthalpy (△H) and (c) entropy (-T*△S) for ITC titration in Figure 6d. Titration of ~50 µM C2B domain (in the presence of Ca2+) with different isomers of InsP3.
Figure 7
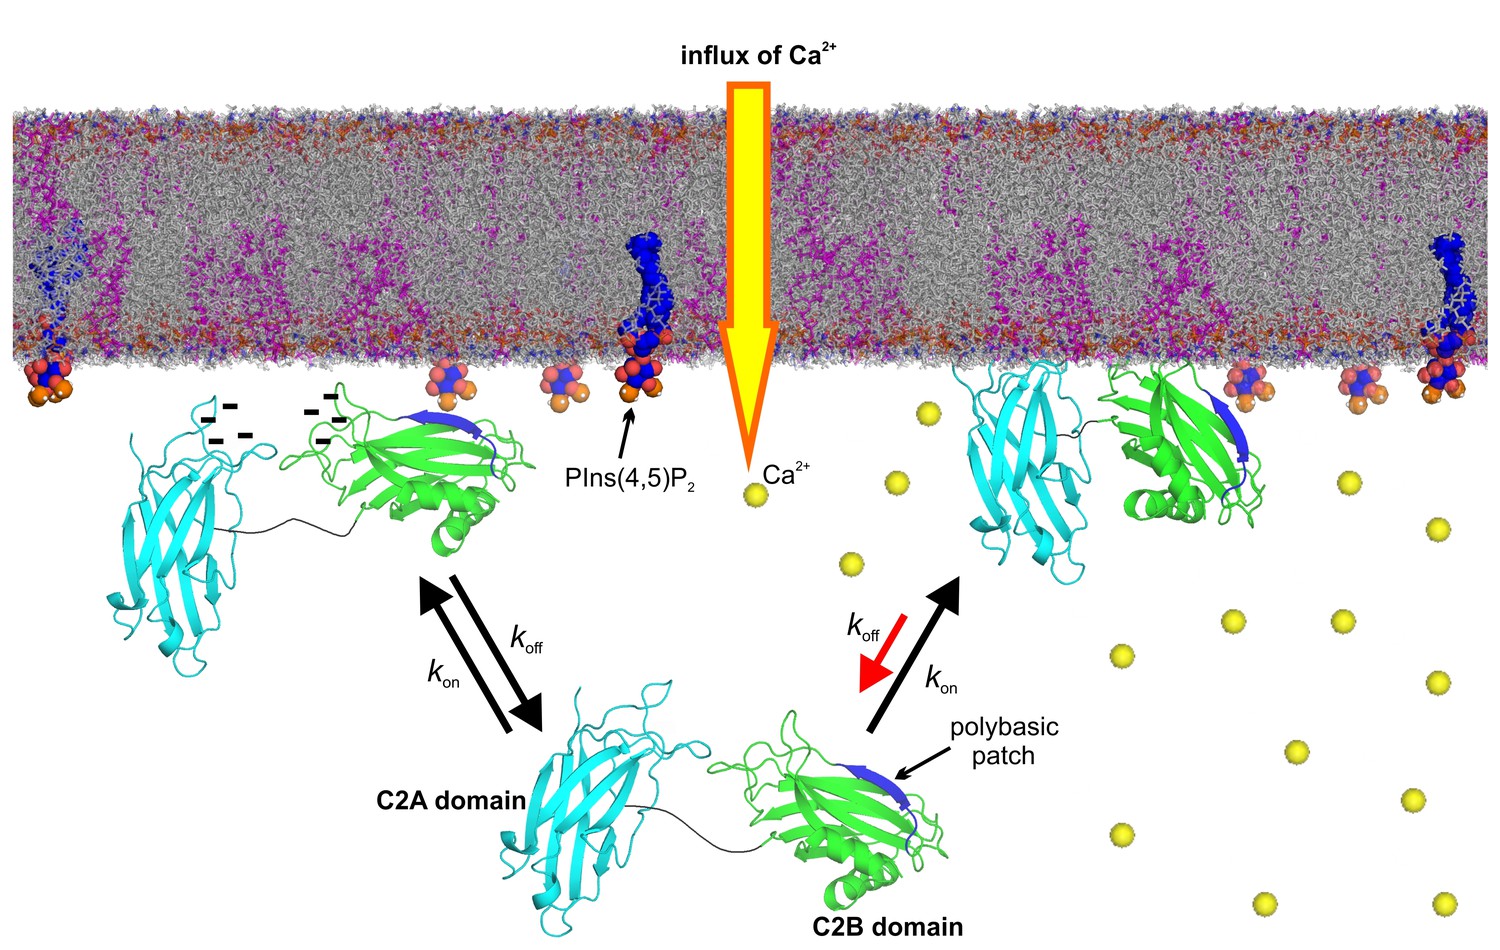
Model of the membrane-binding mechanism of syt-1.
In the absence of Ca2+, syt-1 is attached to the presynaptic membrane interface. Syt-1 binds to PtdIns(4,5)P2 through its C2B polybasic patch (Bai et al., 2004; Kuo et al., 2009) in transient encounters, but the negative charges of the Ca2+-binding pockets prevent penetration of the C2 domains into the presynaptic membrane because of the electrostatic repulsion between them, leading to a high rate of dissociation. Upon Ca2+ influx, Ca2+ binding neutralizes the negative charge of the Ca2+-binding sites. As a consequence, phosphatidylserine completes the sphere of coordination of Ca2+ and allows the insertion of the hydrophobic residues at the tips of the C2 domains. Simultaneously, the polybasic patch enhances its affinity to phosphoinositides, leading to deeper penetration of the C2B Ca2+-binding site into the bilayer. Together, these events decrease the rate of dissociation of syt-1 from the membrane and enhance its penetration into the core of the presynaptic membrane, which eventually leads to SNARE-mediated membrane fusion. Nuclear magnetic resonance structures of the C2A domain (PDB 1BYN [Shao et al., 1998]) and C2B domain (1K5W [Fernandez et al., 2001]) of syt-1 and a molecular dynamic membrane simulation were rendered using PyMOL Molecular Graphics System (Schrödinger,LLC, http://www.pymol.org). The membrane used in this illustration was generated using the Membrane Builder input generator module in CHARMM-GUI (Jo et al., 2008) for a bilayer with PtdChol:PhdSer:PtdEth:Chol:PtdInsP2 at a molar ratio of 55:11:22:11:1.
Tables
Table 1
Depth parameters and approximate positions of spin labels attached to the C2AB fragment.
| Mutant | Lipid composition | Depth parameter (Φ) | Approx. distance to phosphate plane (Å)* |
|---|---|---|---|
| M173R1 | 20% PtdSer | +1.20 ± 0.10 | +8.8 |
| 5% PtdIns(4,5)P2 | −0.01 ± 0.20 | +5.5 | |
| 10% PtdSer + 2.5% PtdIns(4,5)P2 | +0.66 ± 0.10 | +7.4 | |
| F234R1 | 20% PtdSer | −0.10 ± 0.10 | +5.2 |
| 5% PtdIns(4,5)P2 | −1.50 ± 0.03 | –0.6 | |
| 10% PtdSer + 2.5% PtdIns(4,5)P2 | +0.00 ± 0.10 | +5.5 | |
| V304R1 | 20% PtdSer | −0.39 ± 0.20 | +4.3 |
| 5% PtdIns(4,5)P2 | −1.30 ± 0.10 | +0.6 | |
| 10% PtdSer + 2.5% PtdIns(4,5)P2 | −0.23 ± 0.10 | +4.8 | |
| T329R1 | 20% PtdSer | −2.00 ± 0.14 | –5.4 |
| 5% PtdIns(4,5)P2 | −0.80 ± 0.14 | +2.8 | |
| 10% PtdSer + 2.5% PtdIns(4,5)P2 | −2.10 ± 0.12 | –7.3 | |
| G368R1 | 20% PtdSer | +0.60 ± 0.10 | +7.2 |
| 5% PtdIns(4,5)P2 | −0.64 ± 0.05 | +3.6 | |
| 10% PtdSer + 2.5% PtdIns(4,5)P2 | +0.18 ± 0.10 | +6.0 |
-
*Positive distances lie on the hydrocarbon side of a plane defined by the lipid phosphates; negative distances reside on the aqueous side. Distances were estimated using a calibration curve empirically determined as described previously (Herrick et al., 2006). Depth parameters are typically averages of two to four measurements and the error represents either standard deviations or errors propagated from the error in the measurement of ΔP½. These measurements were carried out at lipid concentrations high enough so that C2AB fragment is effectively completely membrane bound in the presence of 1 mM Ca2+.
Table 2
Reciprocal molar partition coefficients, K, for the Ca2+-dependent membrane affinity of syt-1 C2 domains.
| Lipid composition | Syt1-C2AB WT | Syt1-C2AB K326A | Syt1-C2AB K326A/K327A |
|---|---|---|---|
| 7 mol % PtdSer | 1.0 (±0.1) x 103 | 3.4 (±0.4) x 102 | |
| 2 mol % PtdIns (4,5)P2 | 2.2 (±0.2) x 104 | 5.1 (±0.5) x 103 | 1.1 (±0.1) x 103 |
| 5 mol % PtdSer + 0.5 mol % PtdIns(4,5)P2 | 5.0 (±0.7) x 104 | 2.2 (±0.3) x 104 | 1.0 (±0.1) x 104 |
-
Values of K are expressed in units of M-1. The errors represent the uncertainly obtained from the nonlinear regression used in fitting the data to K. The reciprocal of K corresponds to the accessible molar lipid concentration at which 50% of the protein is membrane bound (n = 2–3).
Table 3
Reciprocal molar partition coefficients, K, for the Ca2+-independent membrane affinity of syt1 C2 domains.
| Lipid composition | Syt1–C2AB WT | Syt1–C2AB K326A/K327A |
|---|---|---|
| 25 mol % PtdSer | 2.7 (±0.3) x 102 | not detected |
| 2 mol % PtdIns(4,5)P2 | 1.1 (±0.2) x 103 | not detected |
| 10 mol % PtdSer + 2 mol % PtdIns(4,5)P2 | 4.7 (±0.9) x 104 | 2.7 (±0.3) x 102 |
-
Values of K are expressed in units of M-1. The errors represent the uncertainly obtained from the nonlinear regression procedure used in fitting the data to K. The reciprocal of K corresponds to the accessible molar lipid concentration at which 50% of the protein is membrane bound (n = 2–3).
Download links
A two-part list of links to download the article, or parts of the article, in various formats.
Downloads (link to download the article as PDF)
Open citations (links to open the citations from this article in various online reference manager services)
Cite this article (links to download the citations from this article in formats compatible with various reference manager tools)
PtdInsP2 and PtdSer cooperate to trap synaptotagmin-1 to the plasma membrane in the presence of calcium
eLife 5:e15886.
https://doi.org/10.7554/eLife.15886


