Emergence and evolution of an interaction between intrinsically disordered proteins
- Uppsala University, Sweden
- University of Cambridge, United Kingdom
- Technische Universität München, Germany
- Stockholm University, Sweden
- Eidgenössische Technische Hochschule Zürich, Switzerland
Figures
Figure 1
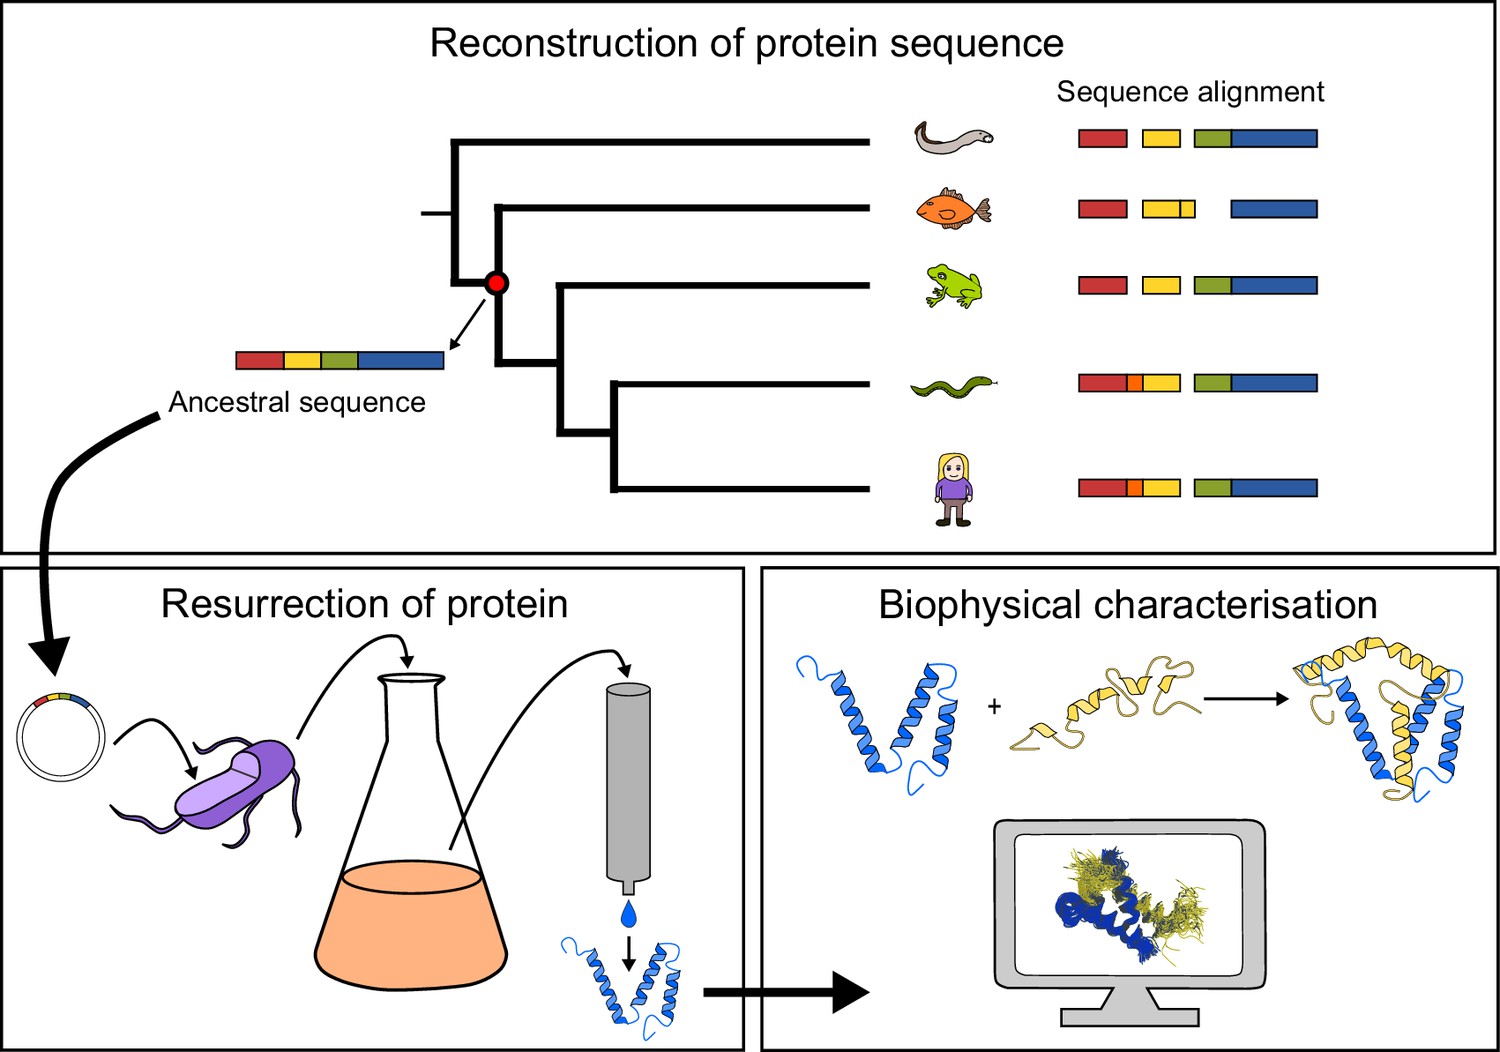
General approach to investigate the evolution of a protein-protein interaction involving intrinsically disordered domains.
Multiple sequence alignment forms the basis for the phylogeny, which is used to predict ancient variants of two interacting protein domains, CID and NCBD, respectively. The ancient variants are then resurrected by expression in Escherichia coli and purified to homogeneity. Finally, the resurrected as well as present-day variants of CID and NCBD are subjected to biophysical and computational characterization to assess the evolution of structure-function relationships.
Figure 2 with 4 supplements

Reconstruction of the evolution of the interacting NCBD and CID domains.
(A) Sequence alignments of extant and reconstructed ancient NCBD (top) and CID domains (bottom). The positions of helices are according to the NMR structure of the complex between extant CREBBP NCBD (blue) and NCOA3 CID (yellow). Free NCBD (protein data base code 2KKJ) and the CID/NCBD complex (1KBH) are NMR structures, whereas the picture of free CID is a hypothetical modified structure made from the NCOA1 CID/NCBD complex (2C52). The first residue in the NCBD alignment is referred to as position 2062 in the text and the first residue in the CID alignment as 1040. The color coding of the sequences reflects similarities in chemical properties of the amino acid side chains and is a guide for the eye to see patterns of conservation. (B) Schematic tree of life with selected animal groups depicting the evolution of the NCBD domain (blue) in both protostomes and deuterostomes and the CID domain (yellow) in the deuterostome lineage only. See Figure 2—figure supplements 1–4 for detailed alignments and trees.
-
Figure 2—source data 1
Probabilities of resurrected amino acid residues at the respective position (2062–2109) in the NCBD domain.
- https://doi.org/10.7554/eLife.16059.005
-
Figure 2—source data 2
Probabilities of resurrected amino acid residues at the respective position (1040–1081) in the CID domain.
The gap in Figure 2—figure supplement 4 created by one of the Takifugu rubripes sequences was removed in this table to make it easier to understand the numbering.
- https://doi.org/10.7554/eLife.16059.006
Figure 2—figure supplement 1
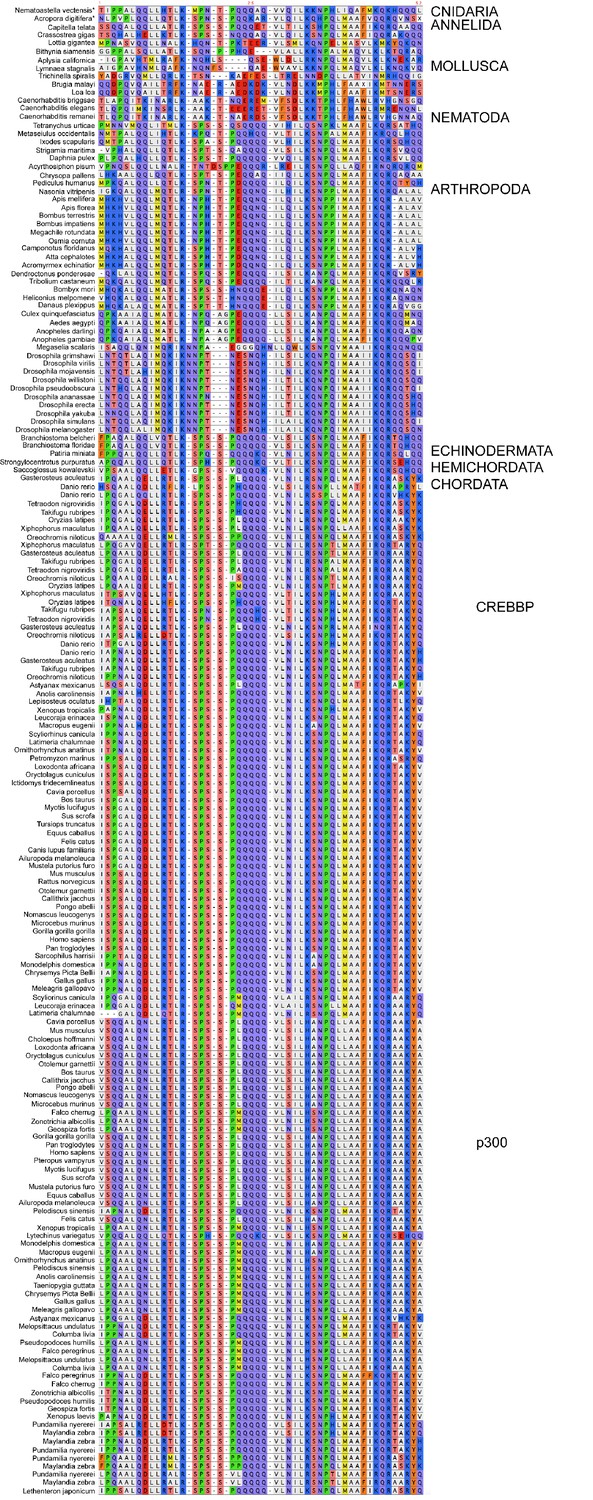
Sequence alignment of NCBD domains of CREBBP/p300 used in the phylogenetic reconstruction.
The whole CREBBP/p300 gene alignment was used to create the phylogenetic tree and then with the use of that tree the NCBD domain could be resurrected. The categories to the right should only be seen as guidelines to which group the individual species sequences belongs. Amino acids are colored based on chemical properties of the side chain according to eBioX standard. The tree in Figure 2—figure supplement 3 has the correct grouping information.
Figure 2—figure supplement 2
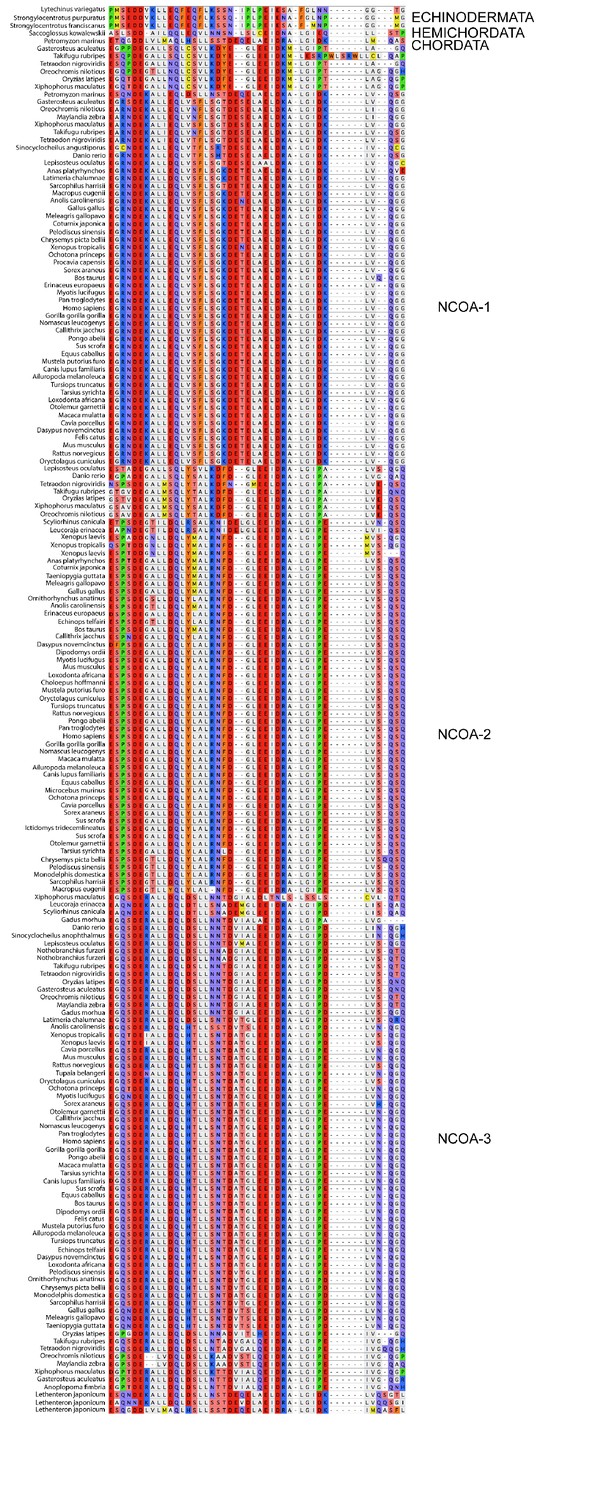
Sequence alignment of the CID domains of NCOA1-3 used in the phylogenetic reconstruction.
The whole NCOA1-3 gene alignment was used to create the phylogenetic tree and then with the use of that tree the CID domain could be resurrected. The categories to the right should only be seen as guidelines to which group the individual species sequences belongs. Amino acids are colored based on chemical properties of the side chain according to eBioX standard. The tree in Figure 2—figure supplement 4 has the correct grouping information.
Figure 2—figure supplement 3
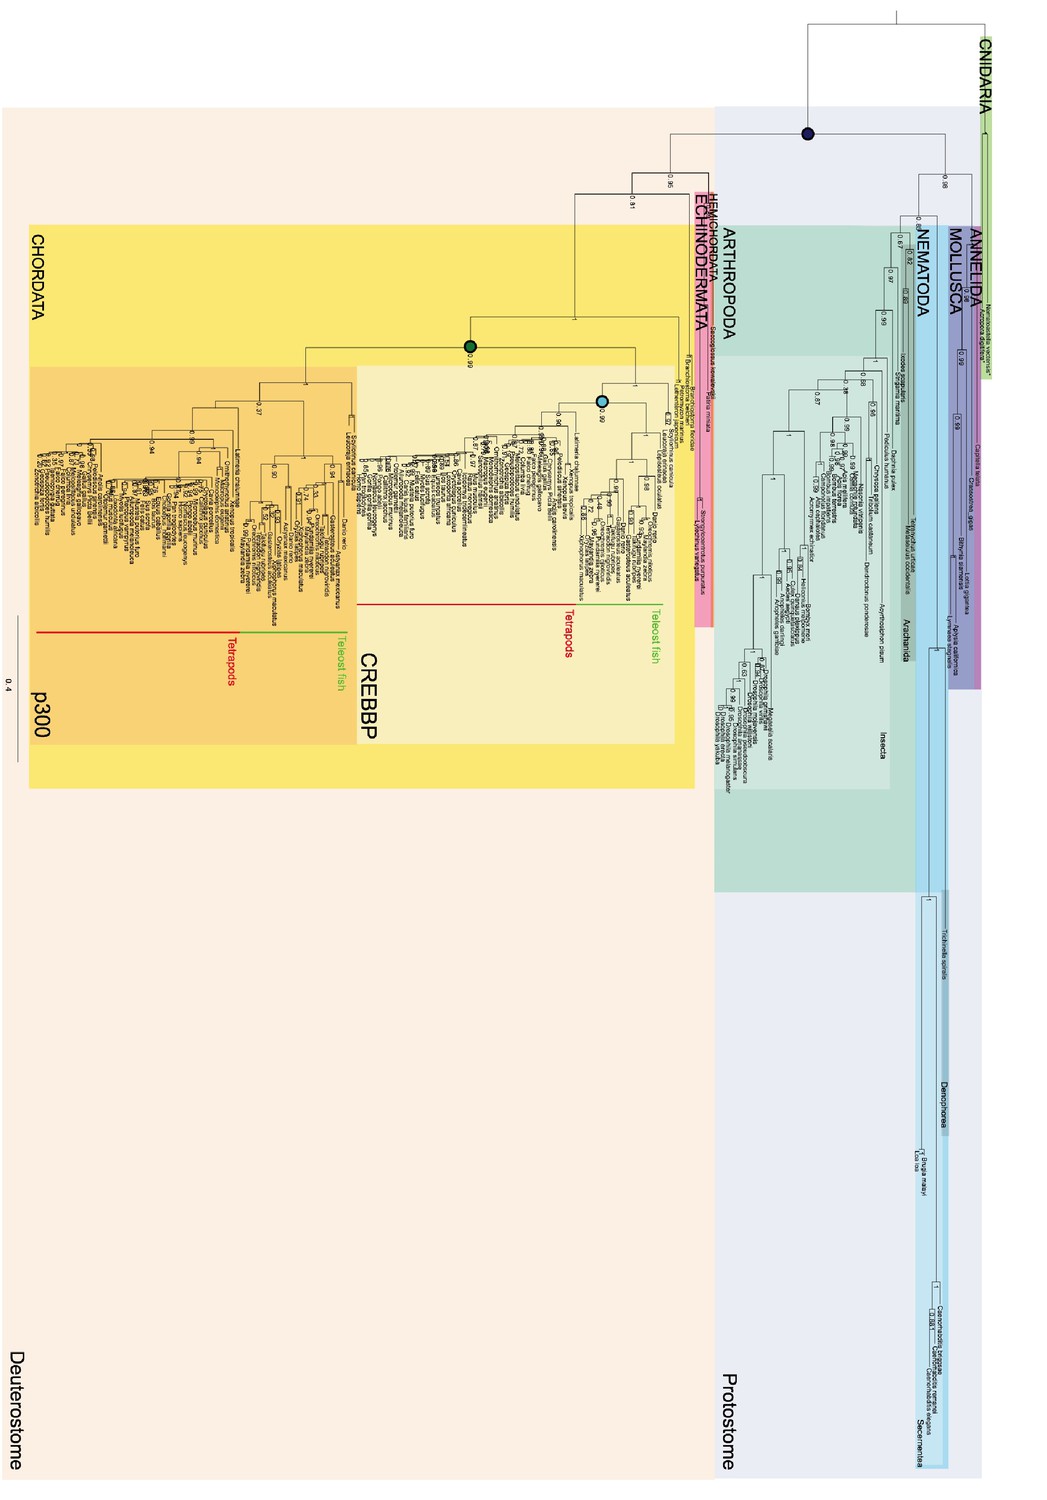
Phylogenetic tree of CREBBP/p300 proteins that contain the NCBD domain.
The tree follows what is generally accepted regarding species evolution and whole genome duplications. Cnidarian CREBBP/p300 contains the NCBD domain. Since these species are distantly related to the other animals in the tree Cnidarian CREBBP/p300 proteins are used as outgroup in the analysis. After the divergence of Cnidaria from other metazoans, deuterostomes and protostomes diverged from each other. The node between the deuterostomes and protostomes (marked with a dark blue circle) is the oldest time point that we resurrect. Protostomes contain groups such as insects and molluscs, while deuterostomes contain all vertebrates. At the beginning of vertebrate evolution two whole genome duplications occurred. Thus, at this point all vertebrate genes were duplicated twice resulting in four copies, but many were rapidly lost. For CREBBP/p300, two copies remained, namely CREBBP and p300. The node corresponding to the ancestral CREBBP/p300 protein is marked with a green circle and referred to as 1R/2R in the text, since we cannot distinguish these events for CREBBP/p300. The most recent node that we resurrect is the separation of Teleost fish CREBBP from Tetrapod CREBBP (marked with a light blue circle). A third round of whole genome duplications later occurred in the fish lineage (not indicated) resulting in the two variants CREBBP1 and CREBBP2. The indicated resurrected nodes correspond to the same nodes as in the simplified Figure 2 in the main text.
Figure 2—figure supplement 4
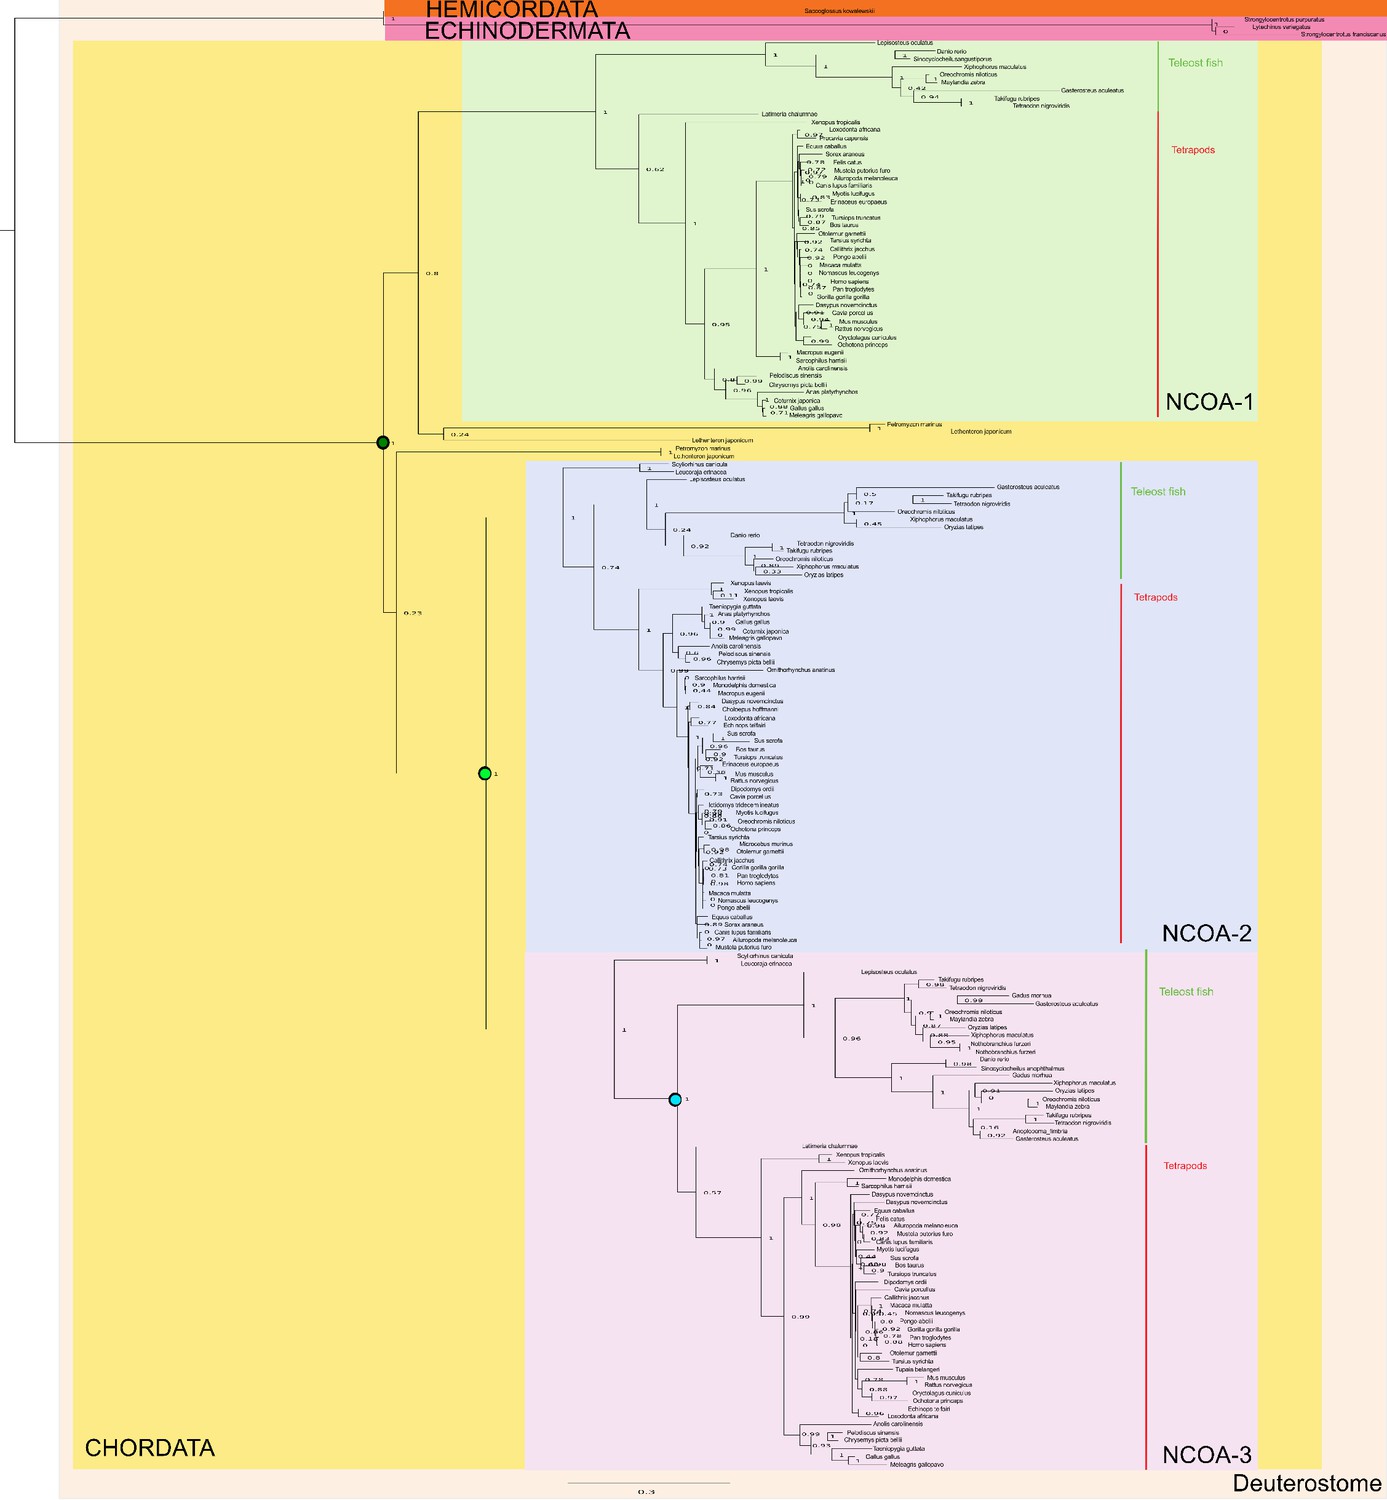
Phylogenetic tree of NCOA1-3 proteins that contain the CID domain.
The tree follows what is generally accepted regarding species evolution and whole genome duplications. The CID domain could be identified in Hemicordata and Echinodermata NCOA proteins, and since these species are more distantly related to the other animals in the tree they were used as outgroups in the analysis. After the divergence of these groups from the rest of the deuterostomes, the two vertebrate-specific whole genome duplications occurred. Our analysis suggests that the ancestral NCOA gene was first split into NCOA-1 and the ancestor of NCOA2 and 3, which were subsequently split into NCOA2 and NCOA3 in the second whole genome duplication. (The second copy of NCOA1 was lost from the genomes) The nodes are marked with a dark (1R) and light green circle (2R), respectively. The most recent node that we resurrected is the separation of Teleost fish NCOA3 from Tetrapod NCOA3 (marked with a light blue circle). A third round of whole genome duplications occurred later in the fish lineage (not marked) but the resulting NCOA proteins were not retained in the genome. The indicated resurrected nodes correspond to the same nodes as in the simplified Figure 2 in the main text.
Figure 3
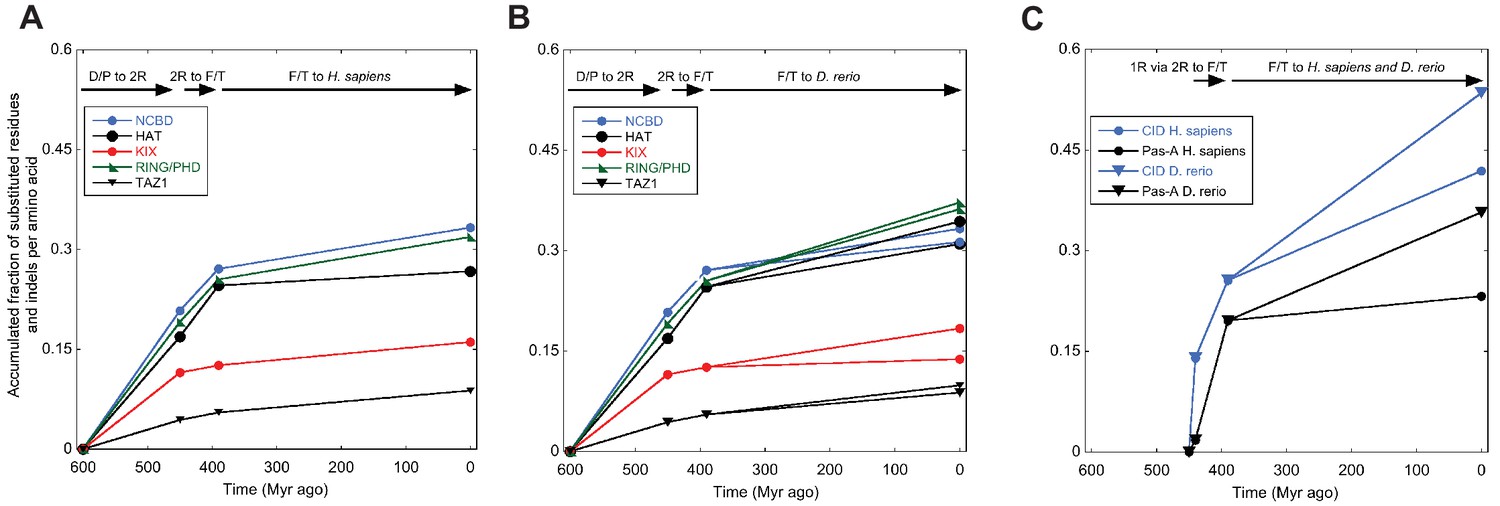
Amino acid substitutions in different domains in CREBBP/p300 and NCOA as a function of time.
The predicted ancient sequences for distinct domains in CREBBP/p300 (A and B) and NCOA (C) were used to calculate the number of substitutions and indels between each evolutionary node (Deuterostome/protostome, D/P; 1R; 2R; Fish/tetrapod, F/T; and present day) in a particular lineage (human and zebrafish CREBBP and human and zebrafish NCOA3, respectively). The alignment and trees used to resurrect HAT, KIX, RING/PHD and TAZ1 were the ones optimized for NCBD. Similarly, the alignment and trees used to resurrect Pas-A were the ones optimized for the CID domain. The number of substitutions plus indels were normalized against the number of amino acid residues in each domain and the accumulated fraction of sequence changes plotted versus historical time. Both 1R and 2R occurred around 450 million Myr ago and the distance between them in panel C (10 Myr) is arbitrary.
Figure 4
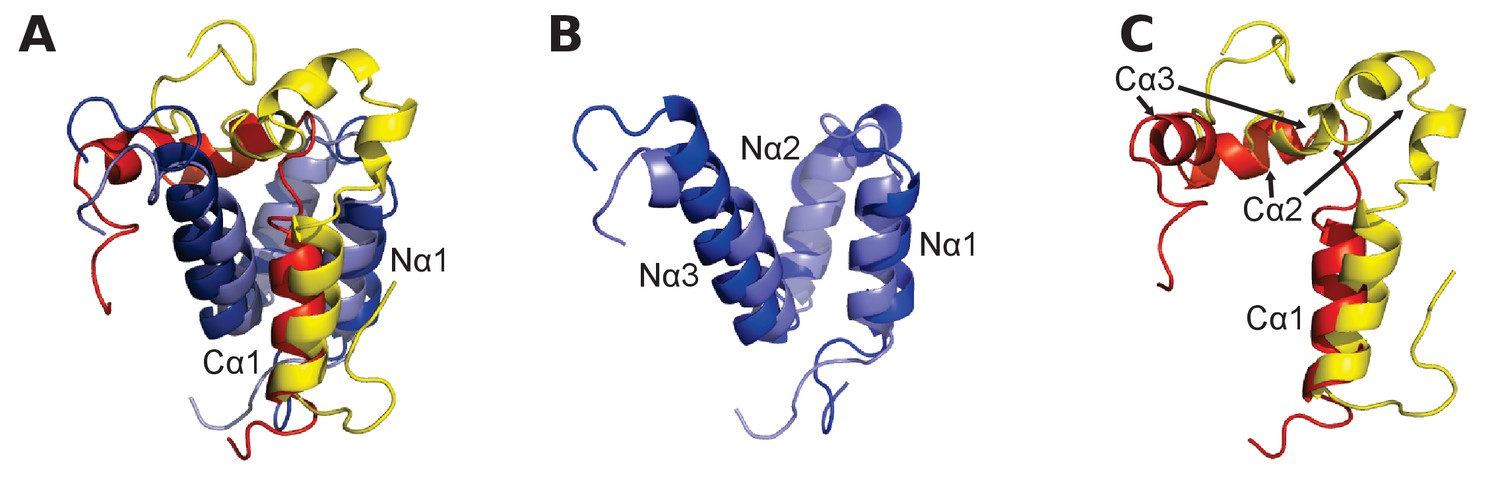
Structural alignment of two CID/NCBD complexes.
(A) Superimposition of the structures of two complexes solved by NMR: CREBBP NCBD (Light blue)-NCOA1 CID (Yellow) (2C52) and CREBBP NCBD (Dark blue)-NCOA3 CID (Red) (1KBH). The complexes contain a hydrophobic core formed by residues from the respective protein domain. (B) Superimposition of NCBD from the complexes shows that in particular Nα1 and Nα2 align very well. (C) Superimposition of the NCBD-bound conformations of NCOA1 CID and NCOA3 CID. Whereas Cα1 from both complexes align well, the C-terminal regions of the CID domains occupy different positions.
Figure 5

Biophysical characterization of ancient and extant CID and NCBD domains.
(A) Affinity of CID/NCBD complexes was measured by isothermal titration calorimetry (three examples are shown including the low-affinity D/P NCBD, 1R CID interaction). (B) The affinities (Kd values) were normalized against the interaction between extant human NCOA2 CID and p300 NCBD. The relative affinity for D/P NCBD, 1R CID was calculated using the average Kd values of all D/P NCBD variants (5 ± 2 µM). (C) Propensity for helix formation for ancient and extant CID domains as measured by circular dichroism at 222 nm upon addition of the helix stabilizer 1,1,1-trifluoroethanol. (D) Global stability of NCBD domains as measured by circular dichroism at 222 nm (reflecting the fraction folded NCBD) upon addition of the denaturant urea. Hsa, Homo sapiens; Dre, Danio rerio (zebrafish); Pme, Petromyzon marinus, (sea lamprey); Dmel, Drosophila melanogaster (fruit fly).
Figure 6
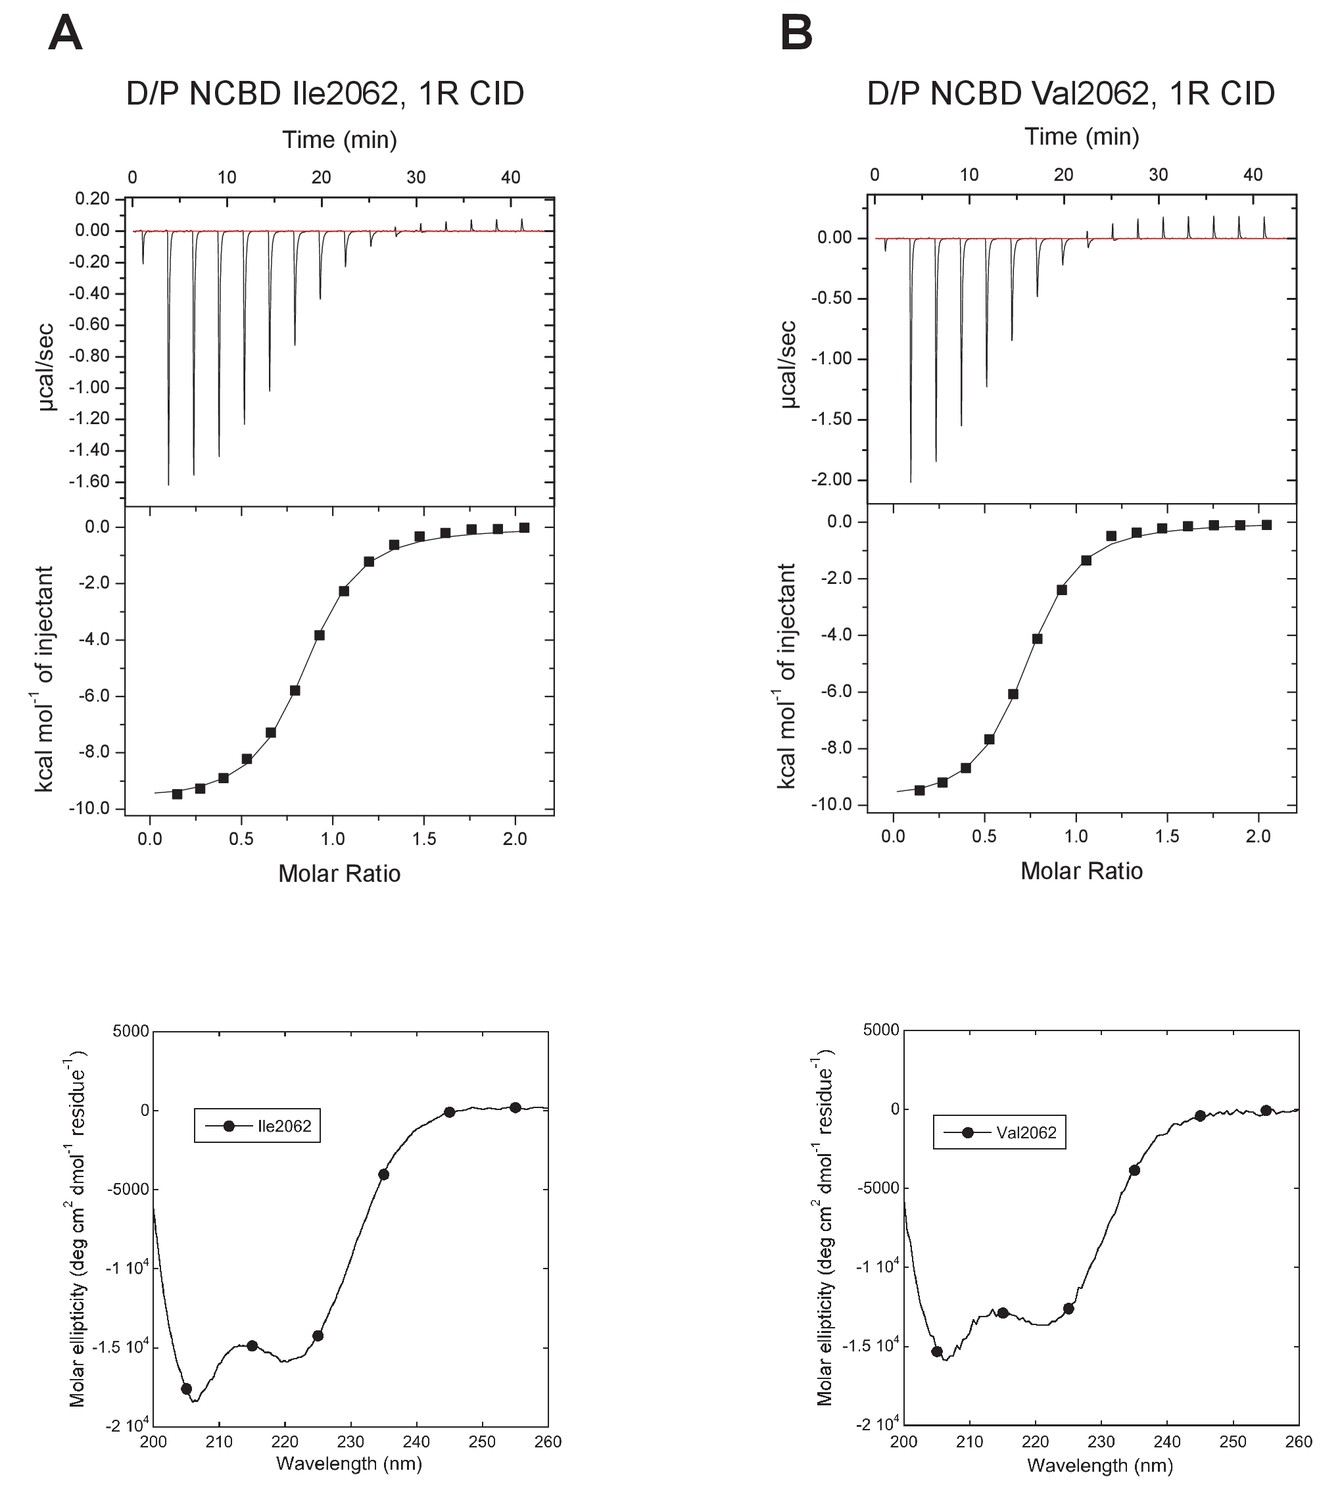
Characterization of alternative variants at position 2062 in D/P NCBD.
Isothermal titration calorimeter and circular dichroism experiments of D/P NCBD with (A) Ile and (B) Val at position 2062. See Figure 5A for Thr2062 and Table 1 for Kd values.
Figure 7

Far-UV Circular dichroism experiments.
(A–C) CD spectra of CID variants display a profile typical for disordered proteins. (D–E) CD spectra of NCBD variants show a qualitatively similar shape for all variants. (G–I) Thermal denaturations of NCBD variants show a similar apparent non-cooperative transition.
Figure 8
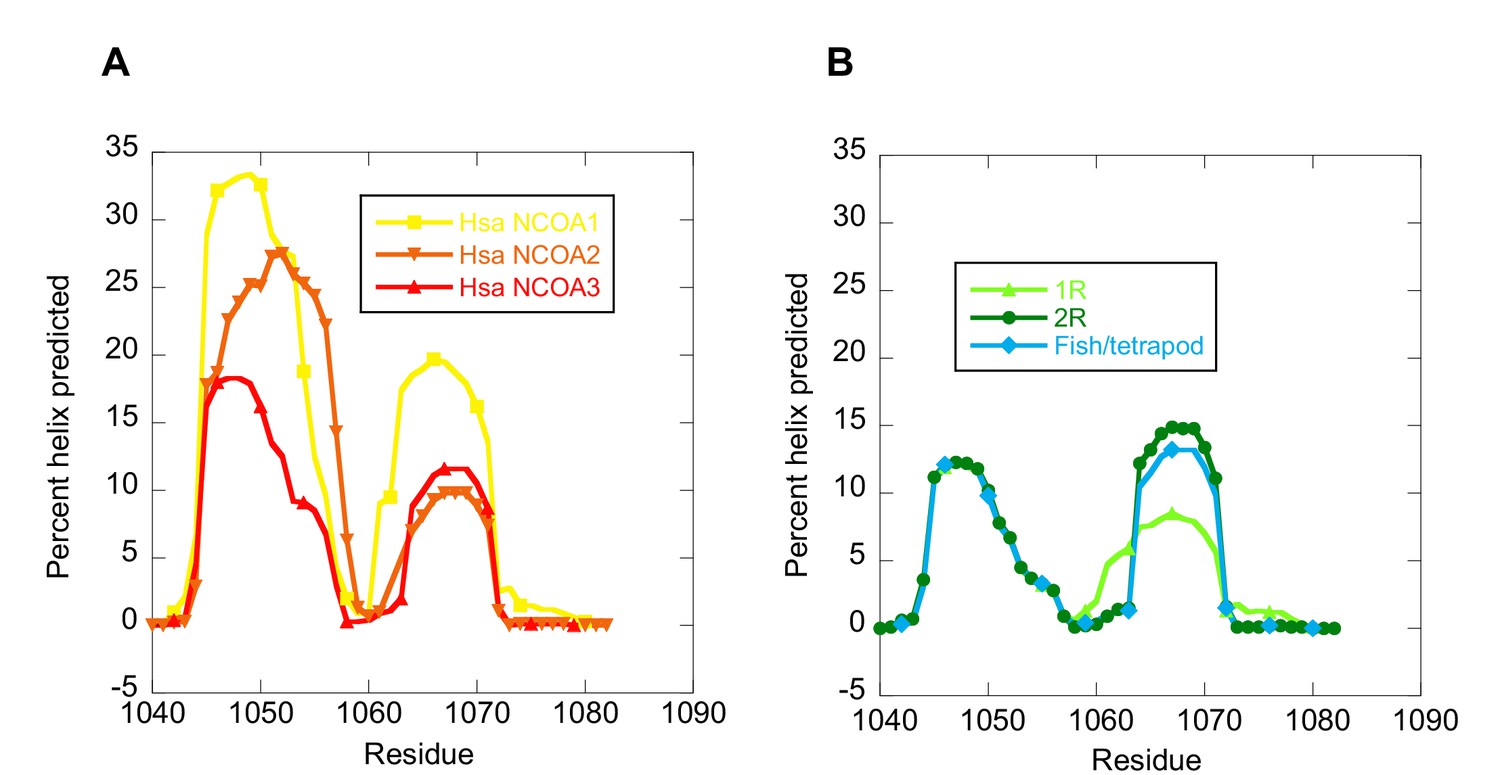
The helical propensity of CID variants as predicted by AGADIR.
(A) CID domains from extant human NCOA1, 2 and 3. (B) Ancestral CID domains: 1R, 2R and the fish/tetrapod ancestor.
Figure 9 with 1 supplement
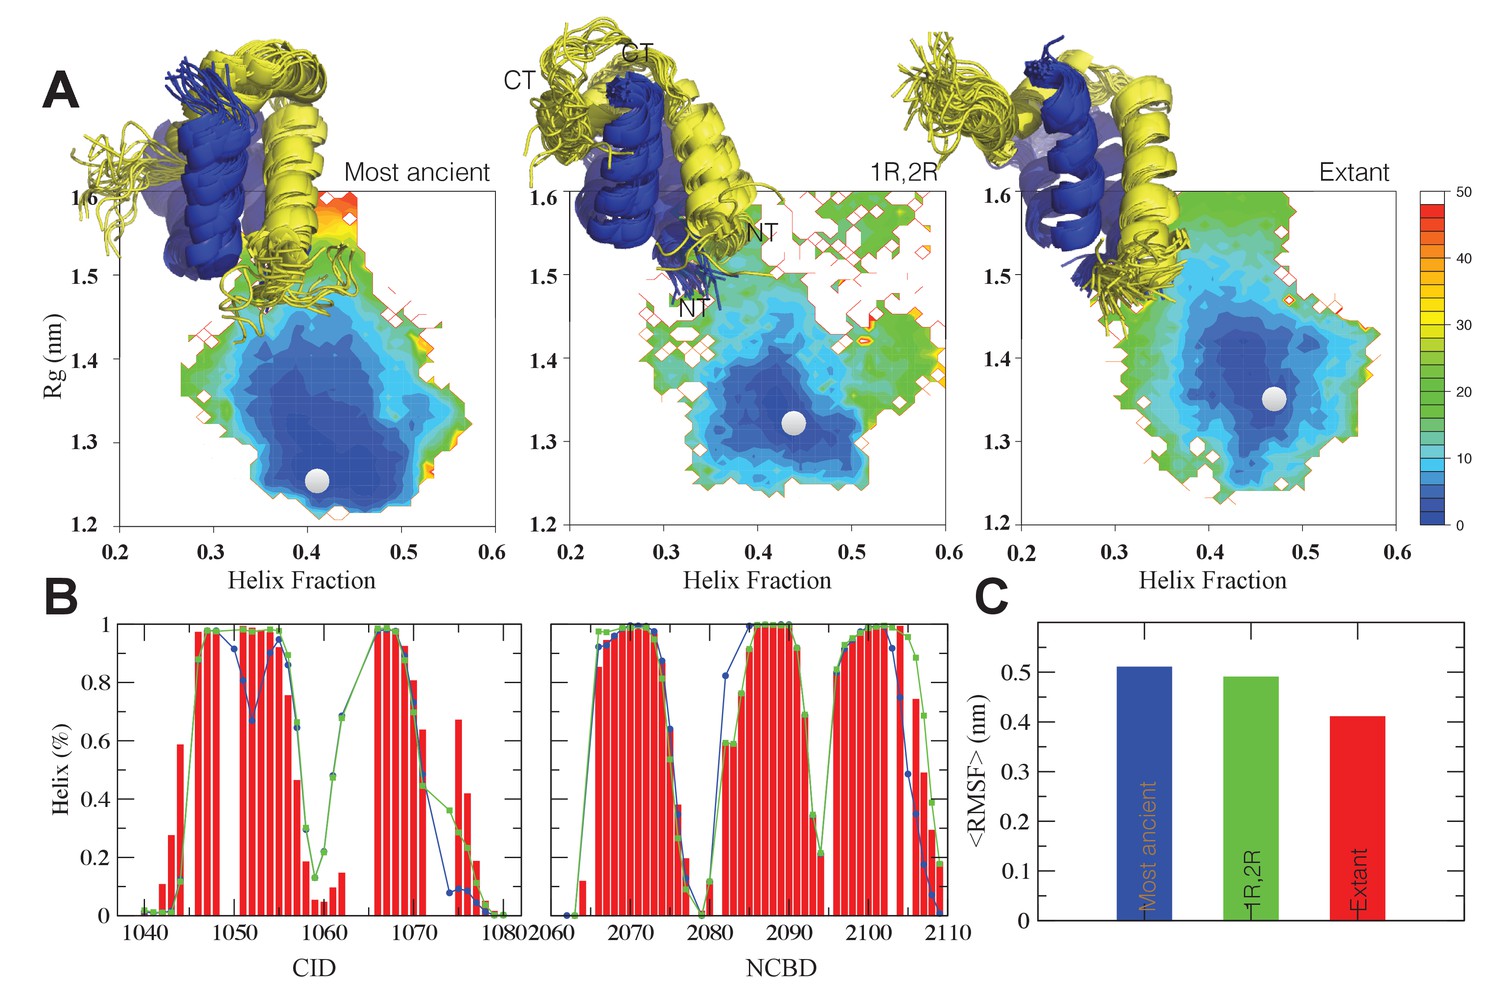
The CID/NCBD complex displays minor structural changes upon evolution.
(A) Free-energy surfaces (in kJ/mol) as a function of the fraction of helix content and the Rg, for the most ancient complex (D/P NCBD and 1R CID), the 1R/2R complex and one extant complex (human NCOA3 CID/CREBBP NCBD). For each free-energy surface, the position of the minimum and a set of representative structures are shown: CID in yellow and NCBD in blue. N- and C- termini (NT and CT, respectively) are labeled for the central ensemble. (B) Per residue helix population of the protein ensembles of the most ancient (blue circles), 1R/2R (green squares) and extant (red bars) variants as predicted by δ2D from the chemical shifts. (C) Average root-mean-square fluctuation for the three variants showing a weak correlation between historical age and conformational heterogeneity of the complex.
-
Figure 9—source data 1
Chemical shift data of CID/NCBD complexes used in the molecular dynamics simulations
- https://doi.org/10.7554/eLife.16059.021
Figure 9—figure supplement 1
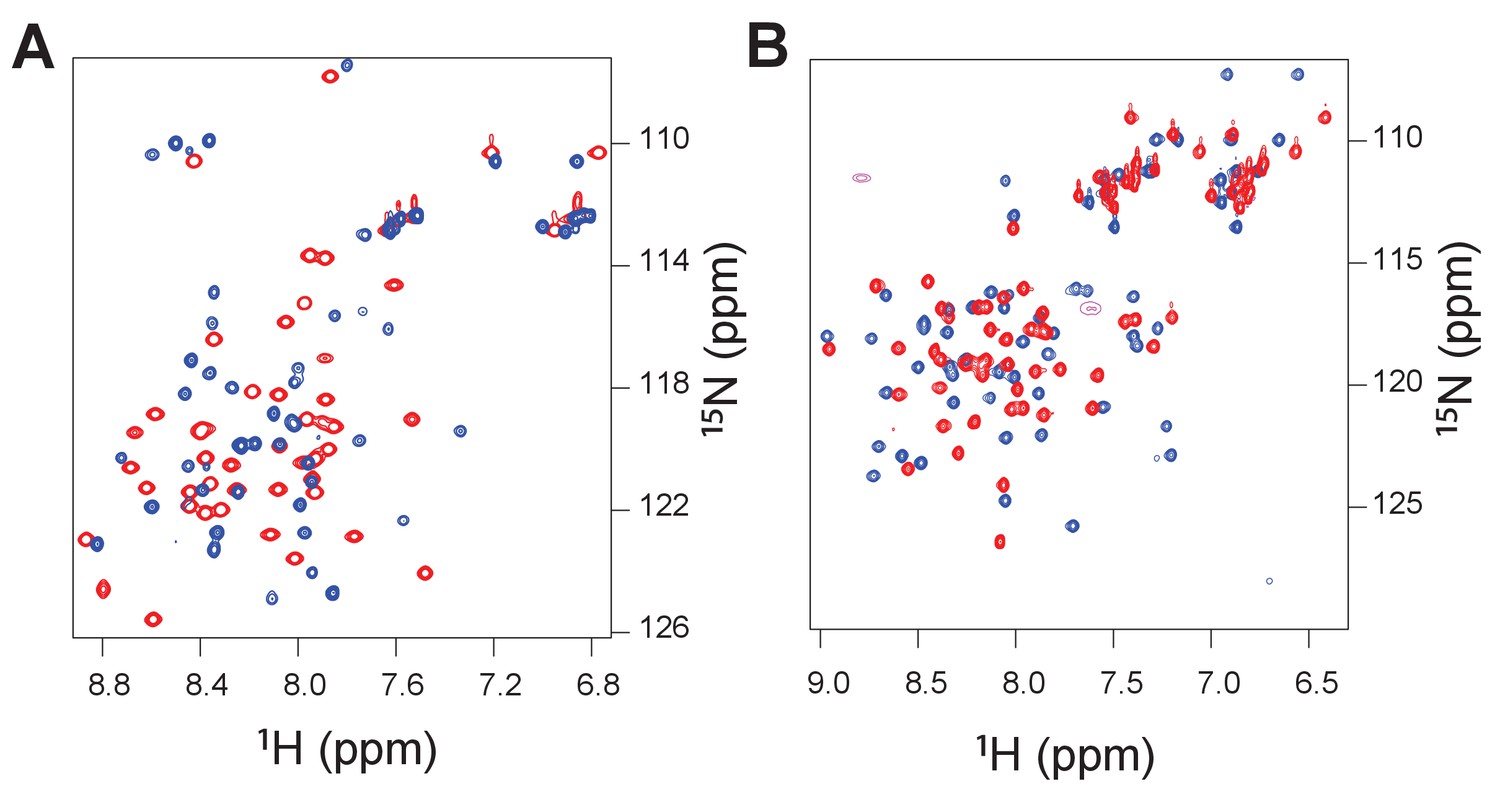
Heteronuclear single quantum correlation (1H/15N) spectra for the ancient complex between 1R CID and D/P NCBD (red peaks) and the extant complex between human NCOA3 CID and CREBBP NCBD (blue peaks).
The spectra were recorded such that either the CID domain was NMR active (panel A) or the NCBD was NMR active (panel B).
Figure 10
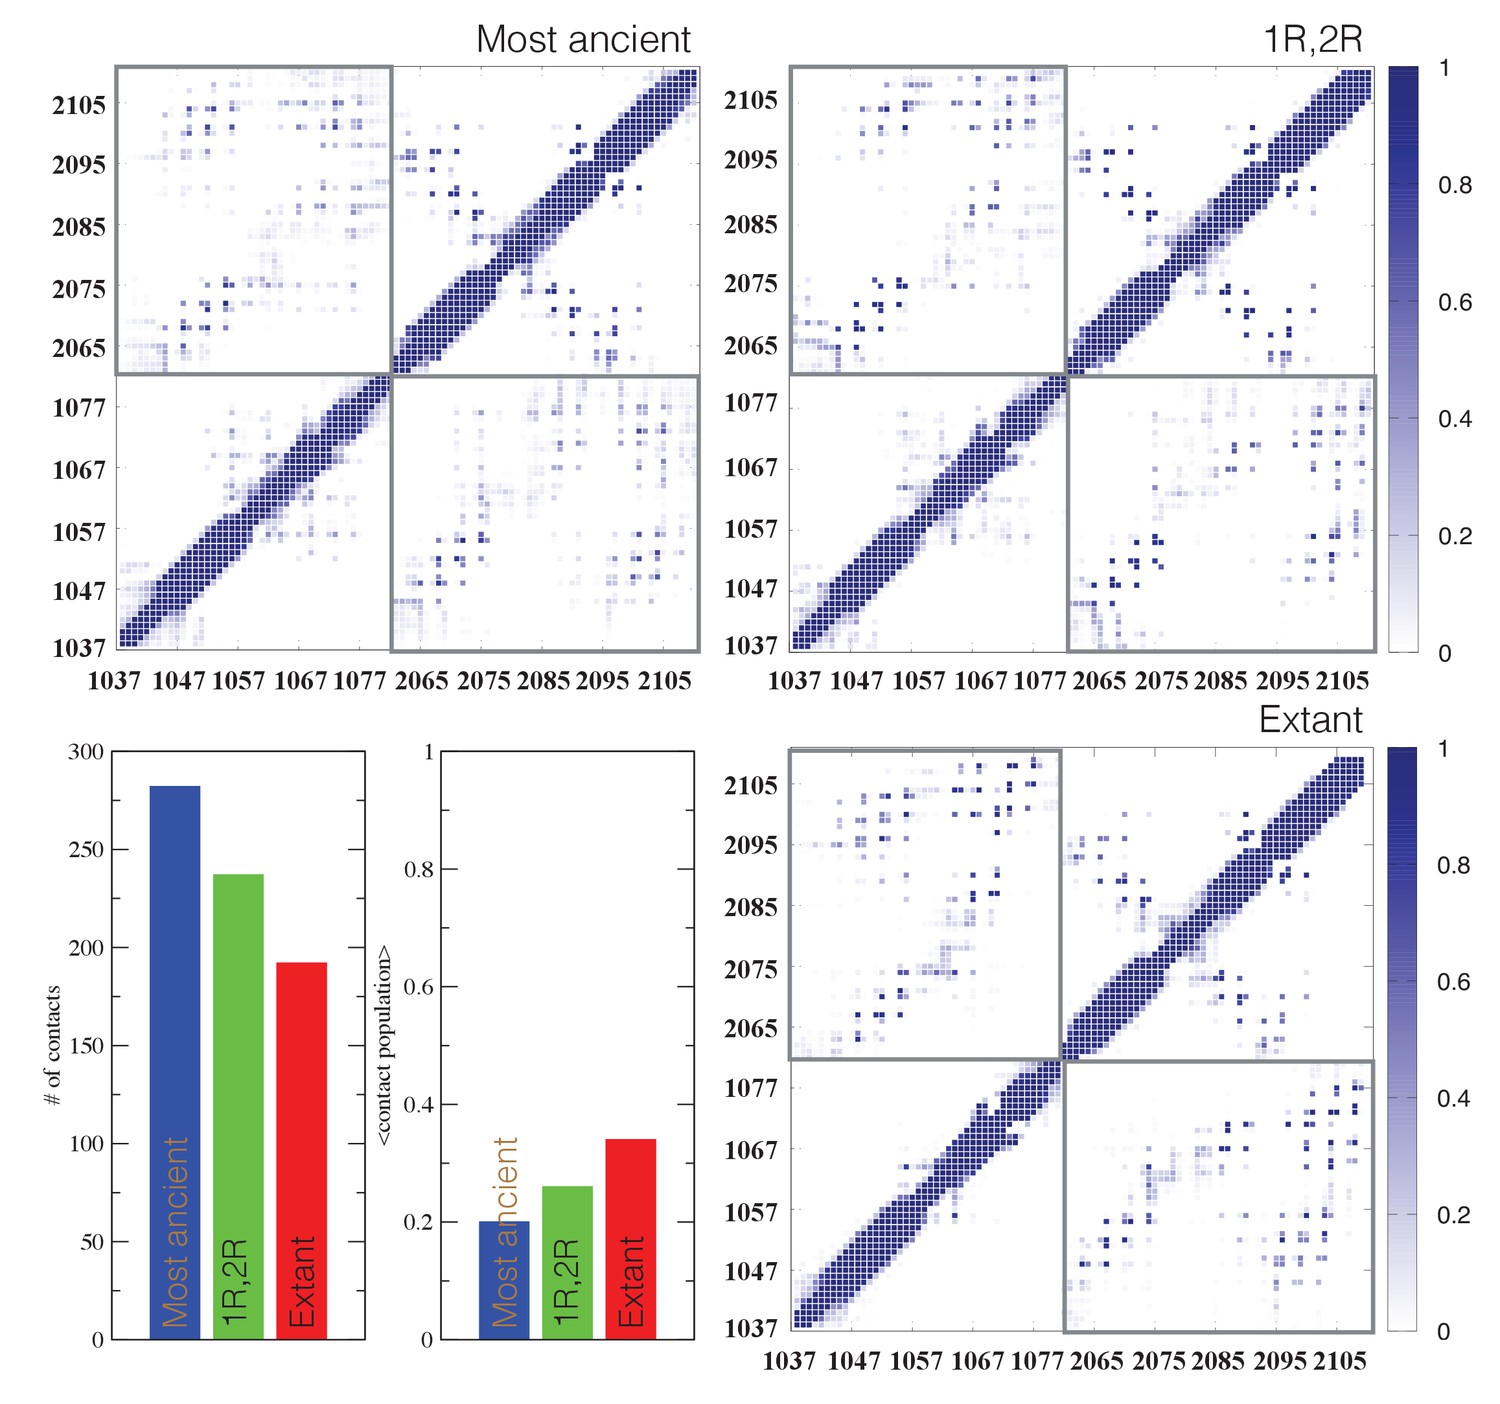
Contact analysis for ancient and extant CID/NCBD complexes.
The probability contact maps are shown for each pair of residues for (upper left) the most ancient complex (1R CID and D/P NCBD), (upper right) the 1R/2R complex and (lower right) the extant NCOA3 CID/CREBBP NCBD complex. Inter-domain contacts are framed by gray rectangles. Given two residues in a certain conformation, a contact is defined as a distance within 0.5 nm (excluding hydrogen atoms). Lower left panels: The total number of inter-domain contacts (left) and the inter-domain average contact formation (right) are reported as the number of residues with a contact populated more than 5% and the average over population for the same contacts, respectively.
Figure 11
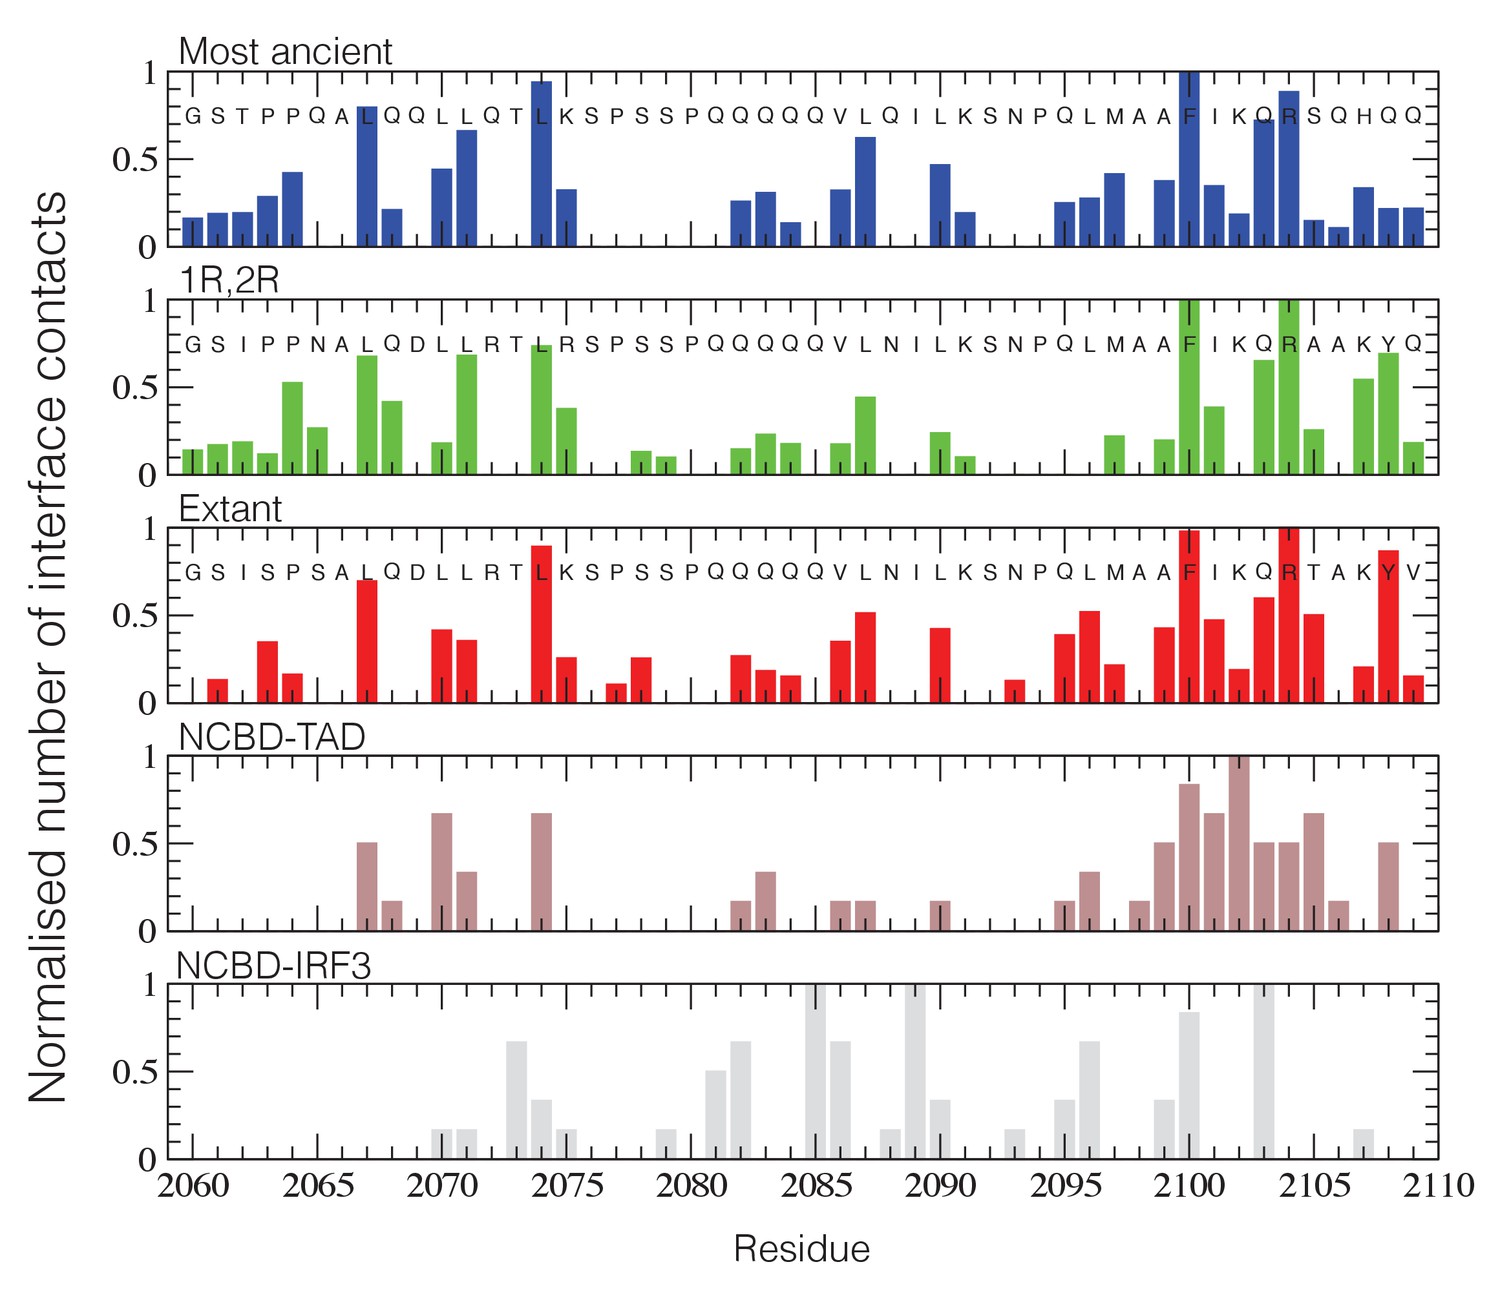
NCBD Interface contact analysis.
The normalized number of interface contacts per residue is calculated from the simulations of the three historical CID/NCBD complexes (upper three panels) and compared with two extant complexes formed by CREBBP NCBD and alternative protein ligands, p53TAD (pdb code 2L14) (Lee et al., 2010) and a binding domain from IRF-3 (pdb code 1ZOQ) (Qin et al., 2005), respectively. In the IRF-3 complex (bottom panel), NCBD adopts a distinct tertiary structure as compared to complexes with CID and p53. The Gly-Ser residues at the N-terminus of the NCBD sequences result from the expression construct used in the study.
Figure 12
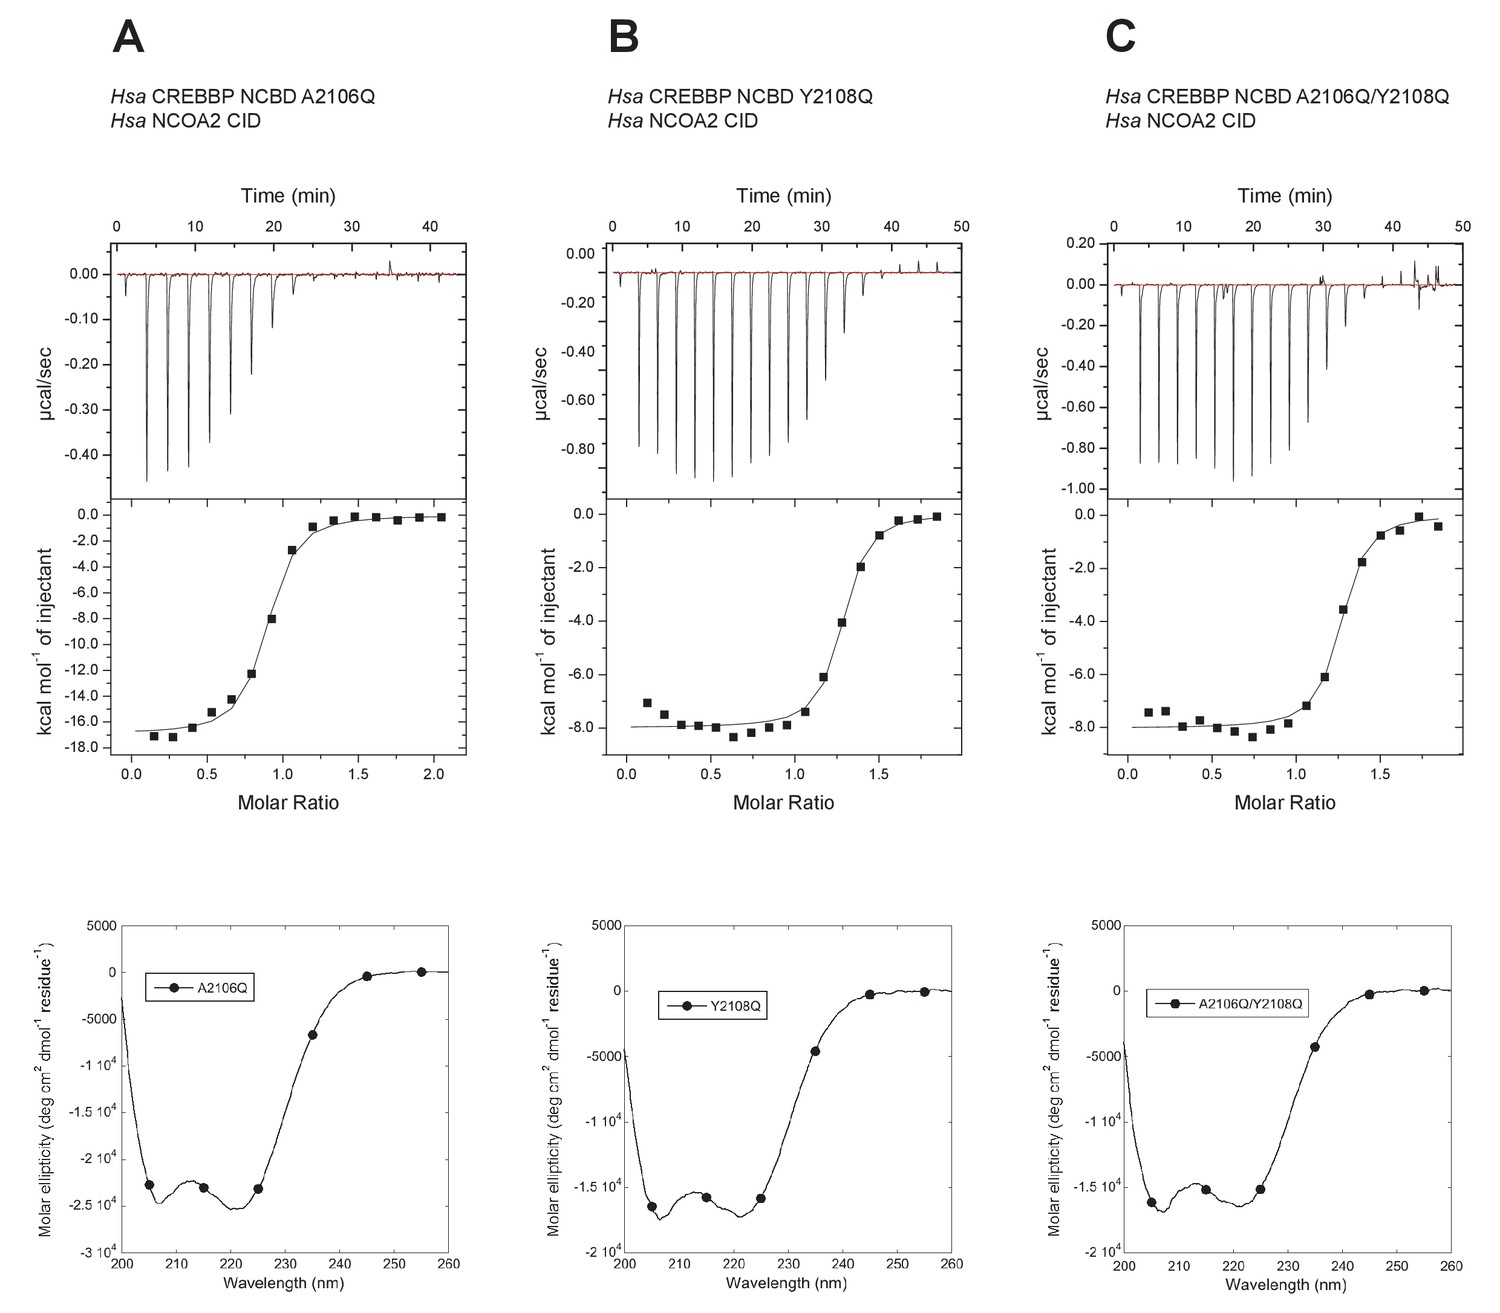
Isothermal titration calorimeter experiments between human NCOA2 CID and 'reverse mutants' in human CREBBP NCBD.
(A) A2106Q, (B) Y2108Q and (C) A2106Q/Y2108Q. Below are CD spectra of the respective NCBD variant.
Figure 13

Analysis of the convergence of the simulations.
Free-energy plots along the dRMSD collective variable for the second half of the simulations are shown for (A) the most ancient complex (1R CID and D/P NCBD), (B) the 1R/2R complex and (C) the extant NCOA3 CID/CREBBP NCBD complex. The solid black curve is the final free energy obtained by averaging over the second half of the simulations. Overall, all the simulations are converged within 3 kJ/mol.
Tables
Table 1
Equilibrium dissociation (Kd±standard error) values for the interaction between NCBD and CID variants as determined by ITC.
| Hsa NCOA1 CID (SRC1) | Hsa NCOA2 CID (TIF2) | Hsa NCOA3 CID (ACTR) | Fish/Tetrapod NCOA3 CID | 2R CID | 2R CID N1043S | 2R CID G1080S | 1R CID | 1R CID S1058N | 1R CID G1080S | 1R CID S1078Q | Hsa p53TAD | Hsa ETS-2 PNT | |
|---|---|---|---|---|---|---|---|---|---|---|---|---|---|
| Kd ( µM) | |||||||||||||
| Hsa CREBBP NCBD | 0.33 ± 0.039 | 0.13 ± 0.011 | 0.35 ± 0.031 | 0.65 ± 0.024 | 0.38 ± 0.020 | 84 ± 2.3 | 0.76 ± 0.071 | ||||||
| Hsa p300 NCBD | 0.18 ± 0.015 | 0.071 ± 0.010 | 0.11 ± 0.010 | 0.28 ± 0.012 | 0.22 ± 0.024 | 9.2 ± 2.2 | 1.5 ± 0.077 | ||||||
| Dre CREBBP NCBD | 0.29 ± 0.032 | 0.23 ± 0.013 | 0.63 ± 0.057 | 0.57 ± 0.025 | |||||||||
| Pma NCBD | 0.19 ± 0.023 | 0.044 ± 0.017 | 0.23 ± 0.030 | 1.0 ± 0.10 | |||||||||
| Dmel NCBD | 5.2 ± 0.20 | 22 ± 1.6 | 37 ± 2.8 | 4.1 ± 0.93 | 9.7 ± 1.6 | No detectable binding | |||||||
| Fish/Tetrapod CREBBP NCBD | 0.41 ± 0.040 | 52 ± 5.2 | 1.3 ± 0.083 | ||||||||||
| 1R/2R NCBD | 0.11 ± 0.042 | 0.045 ± 0.018 | 0.23 ± 0.040 | 0.28 ± 0.021 | 0.290 ± 0.035 | 0.33 ± 0.023 | 0.20 ± 0.016 | 0.22 ± 0.027 | 0.24 ± 0.024 | 0.25 ± 0.021 | 34 ± 4.0 nM | 0.85 ± 0.046 | |
| 1R/2R NCBD N2065S | 0.11 ± 0.020 | 0.15 ± 0.013 | 0.13 ± 0.012 | ||||||||||
| 1R/2R NCBD N2065S K2107R | 0.18 ± 0.021 | 0.160 ± 0.011 | 0.17 ± 0.023 | 0.13 ± 0.018 | |||||||||
| D/P NCBD | 1.5 ± 0.088 | 0.52 ± 0.032 | 5.0 ± 0.22 | 3.0 ± 0.13 | 3.9 ± 0.16 | 4.8 ± 0.20 | 5.5 ± 0.21 | 43 ± 3.9 | 1.4 ± 0.051 | ||||
| D/P NCBD T2062I | 2.0 ± 0.2 | ||||||||||||
| D/P NCBD T2062V | 2.2 ± 0.6 | ||||||||||||
| D/P NCBD P2063L | 7.7 ± 0.53 | ||||||||||||
| D/P NCBD Q2088H | 1.5 ± 0.080 | ||||||||||||
| D/P NCBD Q2088N | 2.2 ± 0.070 | ||||||||||||
| D/P NCBD H2107Q | 18 ± 1.2 | ||||||||||||
| Hsa CREBBP NCBD A2106Q | 0.10 ± 0.02 | ||||||||||||
| Hsa CREBBP NCBD Y2108Q | 0.21 ± 0.06 | ||||||||||||
| Hsa CREBBP NCBD A2106Q/Y2108Q | 0.22 ± 0.06 | ||||||||||||
Table 2
Equilibrium parameters for CD-monitored trifluoroethanol (TFE) induced helix formation of CID variants determined in 20 mM sodium phosphate, pH 7.4, 150 mM NaCl, at 25°C.
| CID variant | [TFE]50%* (%) | [TFE]50%† (%) | mD-N† (%−1) |
|---|---|---|---|
| 1R‡ | 8.5 ± 1.3 | 7.6 ± 2.3 | 0.15 ± 0.02 |
| 2R | 10.7 ± 0.9 | 12.0 ± 0.2 | 0.22 ± 0.01 |
| Fish/tetrapod NCOA3 | 9.9 ± 0.7 | 10.0 ± 0.6 | 0.17 ± 0.01 |
| Hsa NCOA1 | -§ | -§ | 0.15 ± 0.03 |
| Hsa NCOA2 | 9.5 ± 1.7 | -§ | 0.11 ± 0.02 |
| Hsa NCOA3 | 5.6 ± 1.5 | 6.5 ± 0.9 | 0.18 ± 0.01 |
-
*The mD-N value was shared among the datasets in the curve fitting; mD-N = 0.17 ± 0.01 %−1.
-
†Free fitting of both [TFE]50% and mD-N.
-
‡1R, the node around the time of the first whole genome duplication in the vertebrate lineage; 2R, the node around the time of the second whole genome duplication in the vertebrate lineage; Fish/tetrapod, the node where fish diverged from tetrapods; Hsa, Homo sapiens; Dre, Danio rerio (zebrafish); Pme, Petromyzon marinus, (sea lamprey); Dmel, Drosophila melanogaster (fruit fly).
-
§Not well determined in the curve fitting.
Table 3
Equilibrium parameters for CD-monitored urea denaturation of NCBD variants determined in 20 mM sodium phosphate, pH 7.4, 150 mM NaCl, 1 M TMAO at 10°C.
| NCBD variant | [Urea]50%* (M) | △GD-N* (kcal mol−1) | [Urea]50%† (M) | mD-N† (kcal mol−1) | △GD-N† (kcal mol−1) |
|---|---|---|---|---|---|
| D/P‡ | 2.4 ± 0.4 | 1.5 ± 0.3 | 2.2 ± 0.2 | 0.56 ± 0.04 | 1.2 ± 0.2 |
| D/P T2062I | 3.3 ± 0.3 | 2.0 ± 0.3 | 3.4 ± 0.1 | 0.70 ± 0.08 | 2.4 ± 0.3 |
| 1R/2R | 4.4 ± 0.3 | 2.7 ± 0.3 | 4.4 ± 0.1 | 0.67 ± 0.05 | 3.0 ± 0.3 |
| Fish/tetrapod CREBBP | 4.0 ± 0.3 | 2.5 ± 0.3 | 4.0 ± 0.1 | 0.62 ± 0.05 | 2.5 ± 0.2 |
| Hsa CREBBP | 3.8 ± 0.3 | 2.3 ± 0.3 | 3.7 ± 0.2 | 0.46 ± 0.09 | 1.7 ± 0.4 |
| Hsa p300 | 4.4 ± 0.3 | 2.7 ± 0.3 | 4.4 ± 0.3 | 0.66 ± 0.17 | 2.9 ± 0.8 |
| Dre CREBBP1§ | 3.4 ± 0.3 | 2.1 ± 0.3 | 2.2 ± 1.6 | 0.33 ± 0.16 | 0.7 ± 0.6 |
| Pma | 4.1 ± 0.2 | 2.5 ± 0.3 | 4.2 ± 0.6 | 0.50 ± 0.22 | 2.1 ± 1.0 |
| Dmel | 1.6 ± 0.5 | 1.0 ± 0.3 | 2.6 ± 0.4 | 1.2 ± 0.7 | 3.3 ± 1.9 |
-
*The mD-N value was shared among the datasets in the curve fitting; mD-N = 0.61 ± 0.05 kcal mol−1M−1.
-
†Free fitting of both [Urea]50% and mD-N
-
‡D/P, Deuterostome/protostome node; 1R/2R, the node(s) around the time of the two whole genome duplications in the vertebrate lineage; Fish/tetrapod, the node where fish diverged from tetrapods; Hsa, Homo sapiens; Dre, Danio rerio (zebrafish); Pme, Petromyzon marinus, (sea lamprey); Dmel, Drosophila melanogaster (fruit fly).
-
§The bony fish lineage experienced a third whole-genome duplication and has two variants of CREBBP NCBD.
Download links
A two-part list of links to download the article, or parts of the article, in various formats.
Downloads (link to download the article as PDF)
Open citations (links to open the citations from this article in various online reference manager services)
Cite this article (links to download the citations from this article in formats compatible with various reference manager tools)
Emergence and evolution of an interaction between intrinsically disordered proteins
eLife 6:e16059.
https://doi.org/10.7554/eLife.16059


