Dopaminergic neurons write and update memories with cell-type-specific rules
- Janelia Research Campus, Howard Hughes Medical Institute, United States
Figures
Figure 1 with 1 supplement
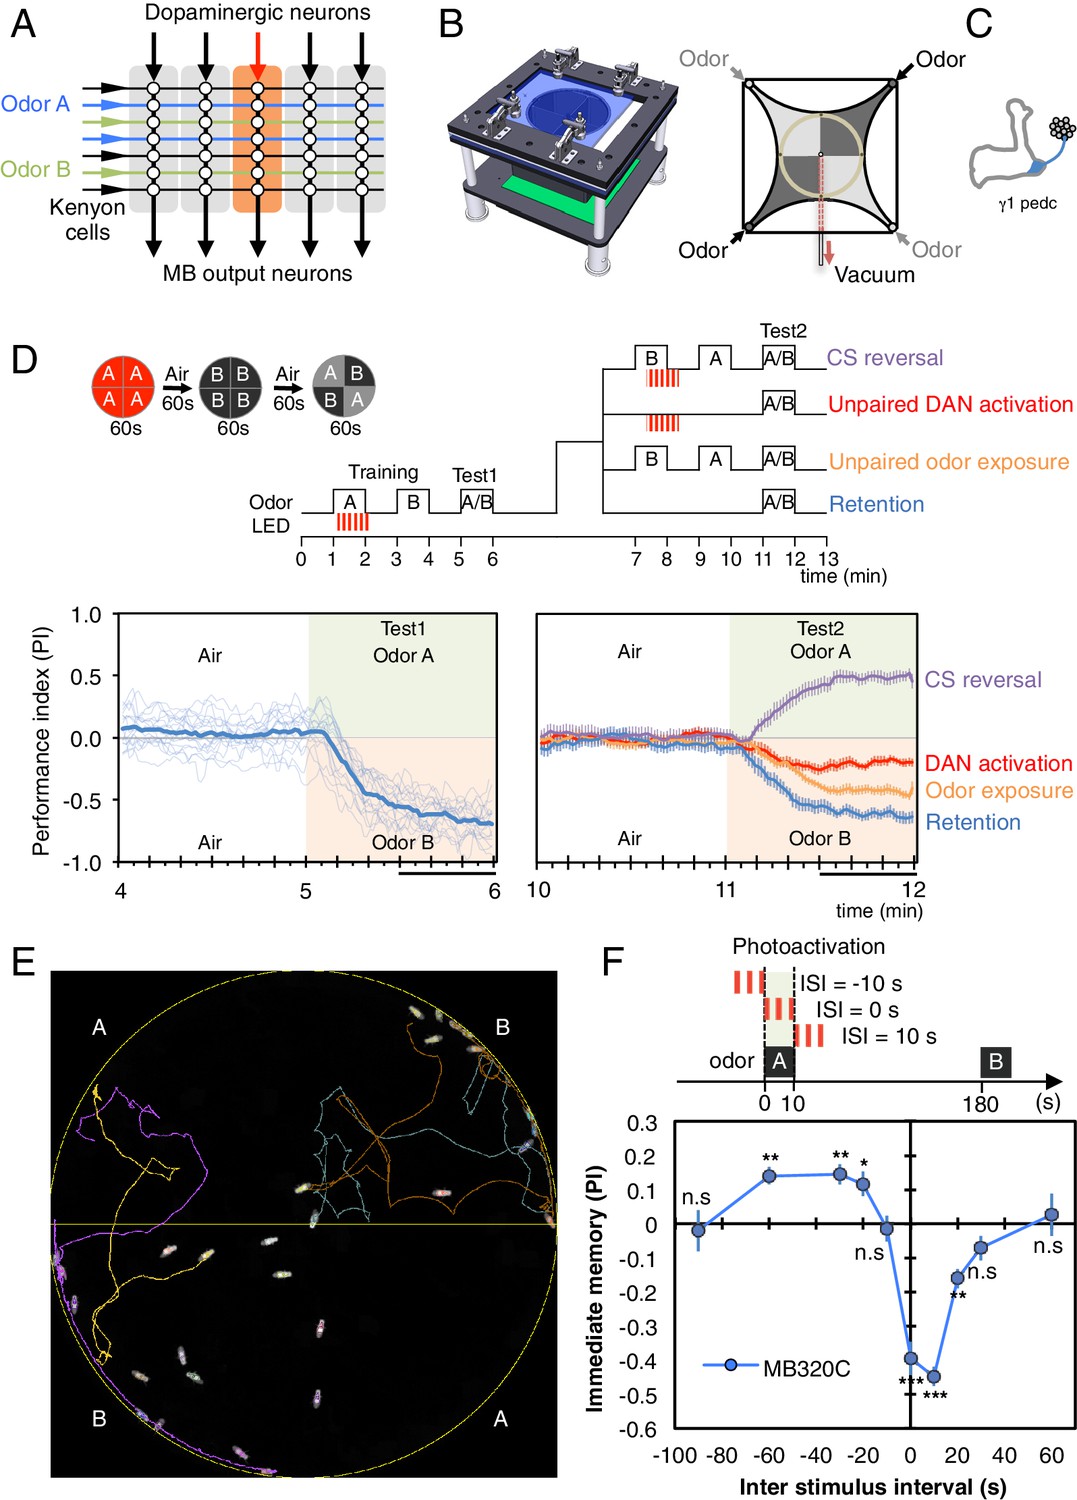
Learning rules in one MB compartment.
(A) Conceptual diagram of memory circuit organization. The parallel axonal fibers of the Kenyon cells represent odor stimuli, modulatory dopaminergic inputs induce plasticity at KC to MBON synapses in distinct compartments (represented by the shaded rectangles) along the length of these axons and MB output neurons from the compartments read out memory. See Aso et al. (2014a) for more details. (B) Left: Design of the optogenetic olfactory arena. See Figure 1—figure supplement 1 and Supplementary file 1 for details. Right: Diagram illustrating odor paths in the arena. Flies are confined in the circular arena at the center (3-mm high and 10-cm diameter). Video 1 illustrates the pattern of airflow. (C) Diagram of the expression pattern of the split-GAL4 line MB320C driving CsChrimson-mVenus (blue) in PPL1-γ1pedc; see Aso et al. (2014a) and www.janelia.org/split-gal4 for primary image data for this and other split-GAL4 lines. (D) Top: Training protocols. For odor delivery, valves were open for 60 s. For training, thirty 1 s pulses of red light (627 nm peak and 34.9 µW/mm2 at the position of the flies) were applied over 60 s starting 5 s after valve opening. Experiments were done reciprocally: In one group of flies, odor A and B were 3-octanol and 4-methylcyclohexanol, respectively, while in a second group of flies, the odors were reversed. All flies went through the same initial training and test protocol, and then the flies, without removal from the arena, went through one of the four diagramed training and test protocols. Bottom: Time course of the performance index (PI) during first test period (from 4–6 min of the experiment; left) and second test period (from 10–12 min of the experiment; right). The PI is defined as [(number of flies in the odor A quadrants) - (number of flies in odor B quadrants)]/(total number of flies). The average PI of reciprocal experiments is shown. The overall PI, which is reported in Figure 1F and Figures 2 and 3 was calculated by averaging the PIs from the final 30 s of each test period (indicated by the black horizontal line on the time axis). In the left panel, thin lines show individual reciprocal experiments and the thick line the mean of all experiments. In the right panel the mean with error bars representing the SEM are shown. Control genotypes did not show any significant memory in the same training protocols: (1) no driver control, pBDPGAL4 in attP2/20xUAS-CsChrimson in attP18 (PI = 0.07, SEM = 0.037, N = 14); and (2) no effector control, MB320C/w1118 (PI = −0.01, SEM = 0.031, N = 10). (E) A single frame of Video 2 showing the position of odor-conditioned flies at the end of the 1-min test period. Lines show trajectory of four flies. Video 2 shows the behavior of flies in the area for the full 1 min test period. (F) Inter-stimulus-interval (ISI) curve. A single training was done for each experiment. The relative timing of a 10 s delivery of odor A and a 10 s period in which three 1 s light pulse were delivered was varied. The diagram on top illustrates the cases of ISI = −10 s, 0 s and +10 s corresponding to the light pulses starting −10 s, 0 s, or +10 s after the initiation of odor delivery, respectively. The data points and error bars show the mean and SEM for MB320C/CsChrimson-mVenus. N = 10–14. Asterisk indicates significance from 0: *p<0.05; **p<0.01; ***p<0.001; n.s., not significant.
Figure 1—figure supplement 1
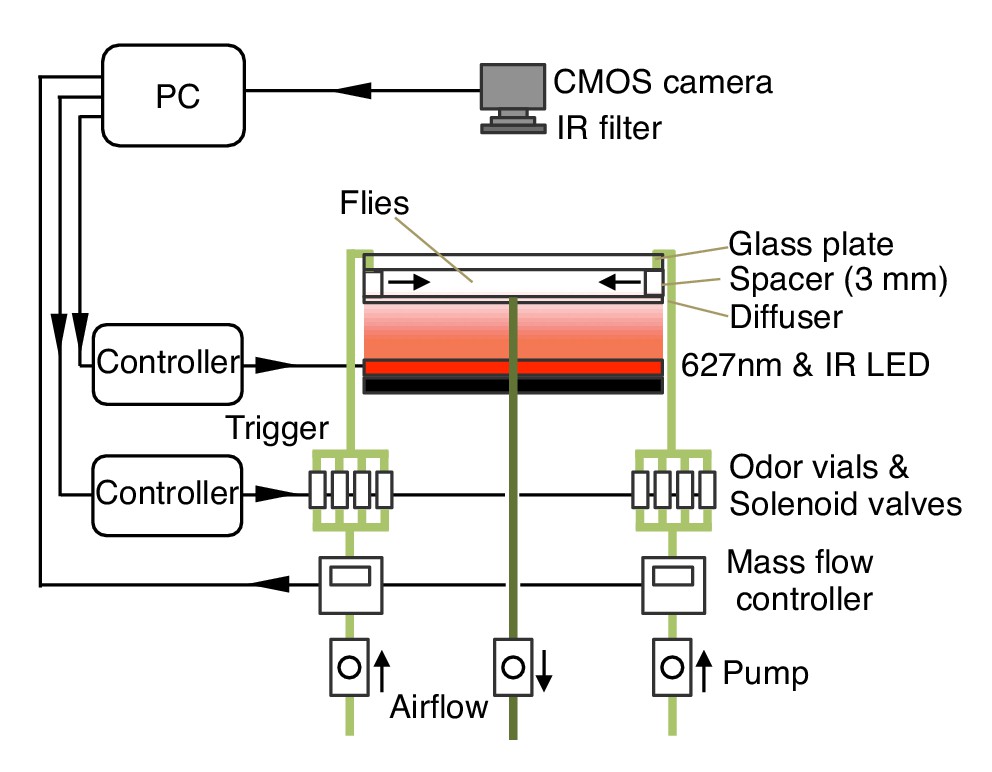
Diagram of the olfactory behavioral apparatus.
See Supplementary file 1 for details.
Figure 2 with 5 supplements
Rules for writing memory.
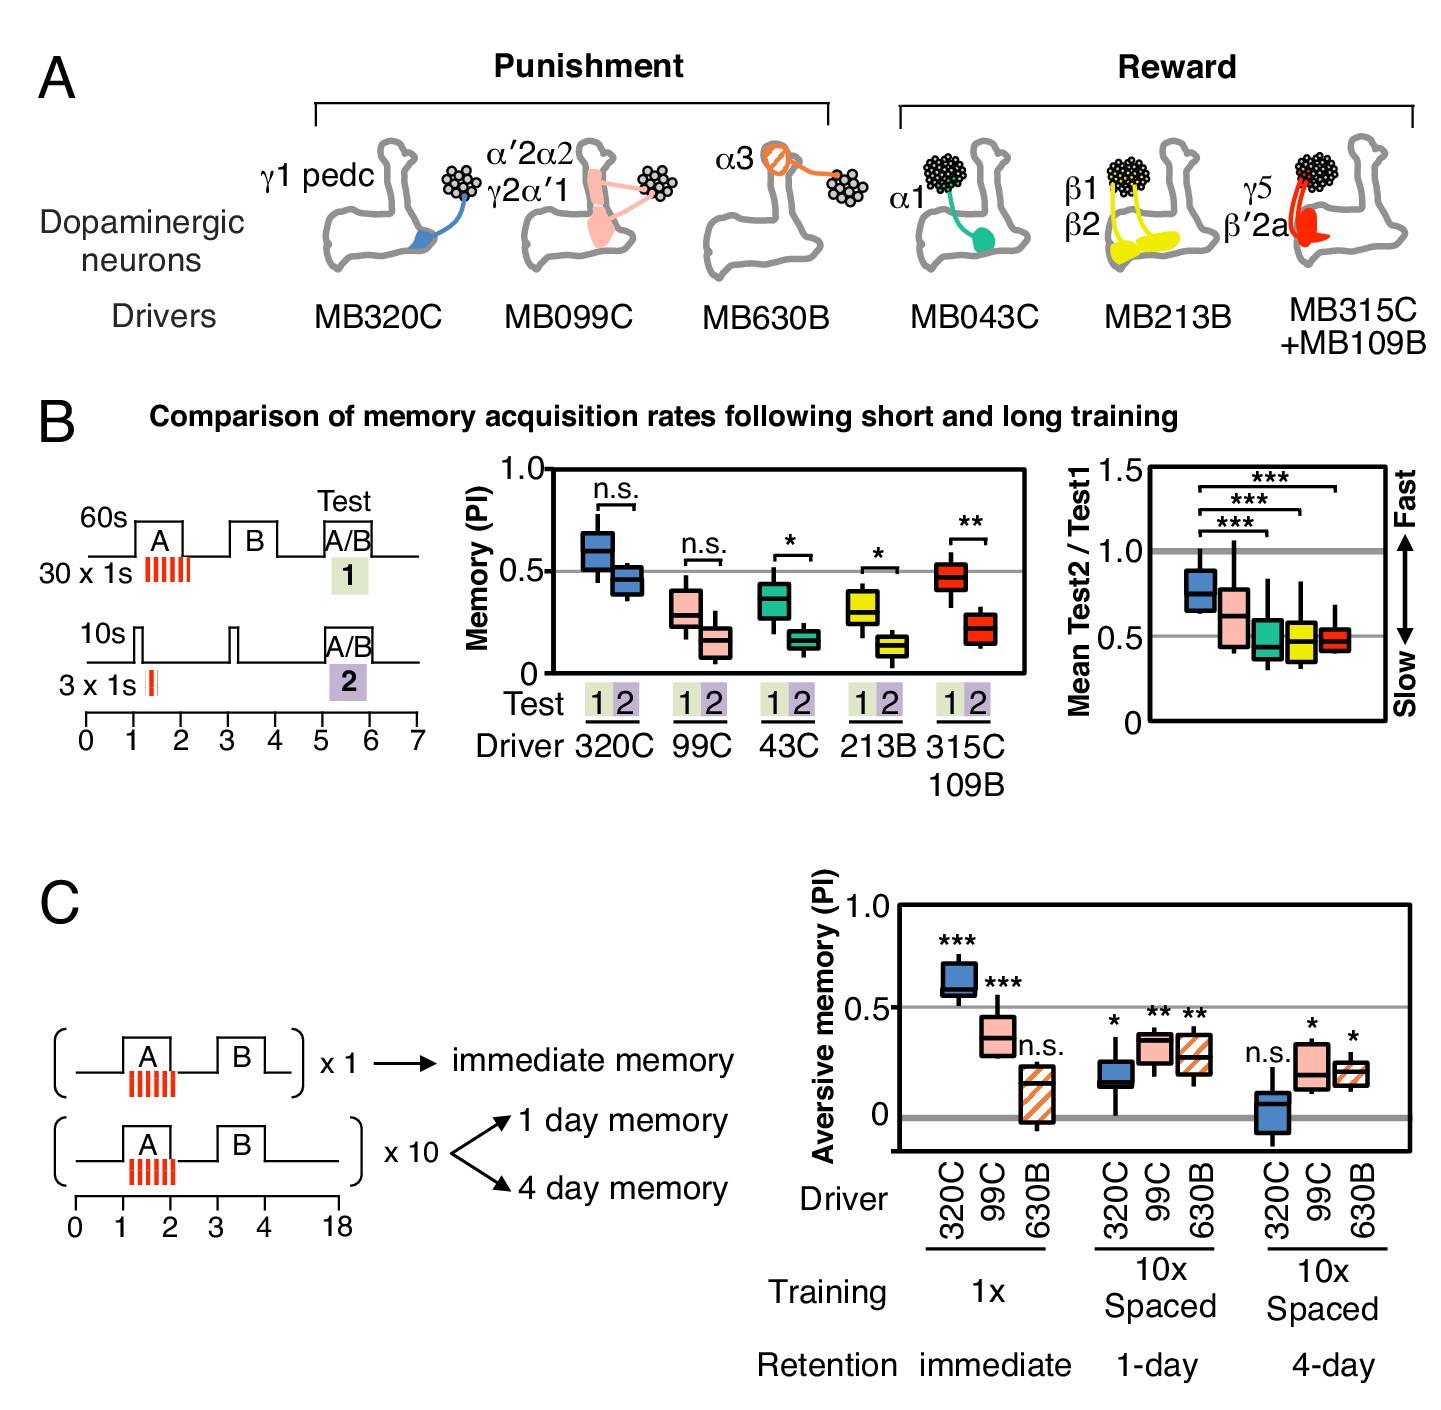
(A) Diagram of the DANs contained in split-GAL4 driver lines, which have been color-coded to facilitate comparison with the plots shown in the subsequent panels. Expression patterns of these drivers, including full confocal stacks, can be found at www.janelia.org/split-gal4. In all experiments, the drivers were crossed with 20xUAS-CsChrimson-mVenus in attP18. (B) Differential effect of training length among DANs. Left: Diagram of the experimental design. Immediate memories formed after paring a 60-s odor presentation with thirty 1-s CsChrimson-activating light pulses (Test 1) were compared with those obtained with a 10-s odor presentation paired with three 1-s light pulses (Test 2). Center: A 60-s training period resulted in significantly better memory performance compared with a 10-s training for MB043C, MB213B and MB315C+MB109B (data from ISI = 0 s for MB099C and ISI =+ 10 s for others drivers were used to provide maximum memory formation; see ISI curves in Figure 2—figure supplement 4). We also observed increased learning with 60-s versus 10-s training (PI of 0.72 versus 0.15) when using R58E02-GAL4 (Liu et al., 2012), a strong GAL4 driver expressed in ~90 PAM cluster DANs that includes all of the ~50 DANs that have expression in MB043C, MB213B and MB315C+MB109B. To facilitate comparison of PI magnitudes, the sign of the PI in this and subsequent panels was reversed for DANs that induced aversive memory (MB320C, MB099C and MB630B). The bottom and top of each box represents the first and third quartile, and the horizontal line dividing the box is the median. The whiskers represent the 10th and 90th percentiles. N = 8–16. Right: Comparison of the effect of training time on memory formation induced by activation of different DANs. Ratios of the mean PI obtained with short training and individual PIs obtained with long training are shown for each driver. Asterisk indicates significance of depicted pairs after comparing all pairs. (C) Comparison of learning after single and repetitive training using the three drivers MB320C, MB099C and MB630B. Either a single training with memory test after 1 min (immediate memory; left) or 10 trainings separated by 15 min resting intervals and then memory tests after 1 (middle) or 4 (right) days were used. Significant aversive 1-day memory was seen with all drivers, while 4-day memory was observed only with MB099C and MB630B. MB320C failed to show 4-day memory despite displaying the most robust immediate memory, while MB630B did not induce significant immediate memory. N = 8–12. Asterisk indicates significance of comparison of indicated pairs in B and from 0 in C: *p<0.05; **p<0.01; ***p<0.001.
Figure 2—figure supplement 1
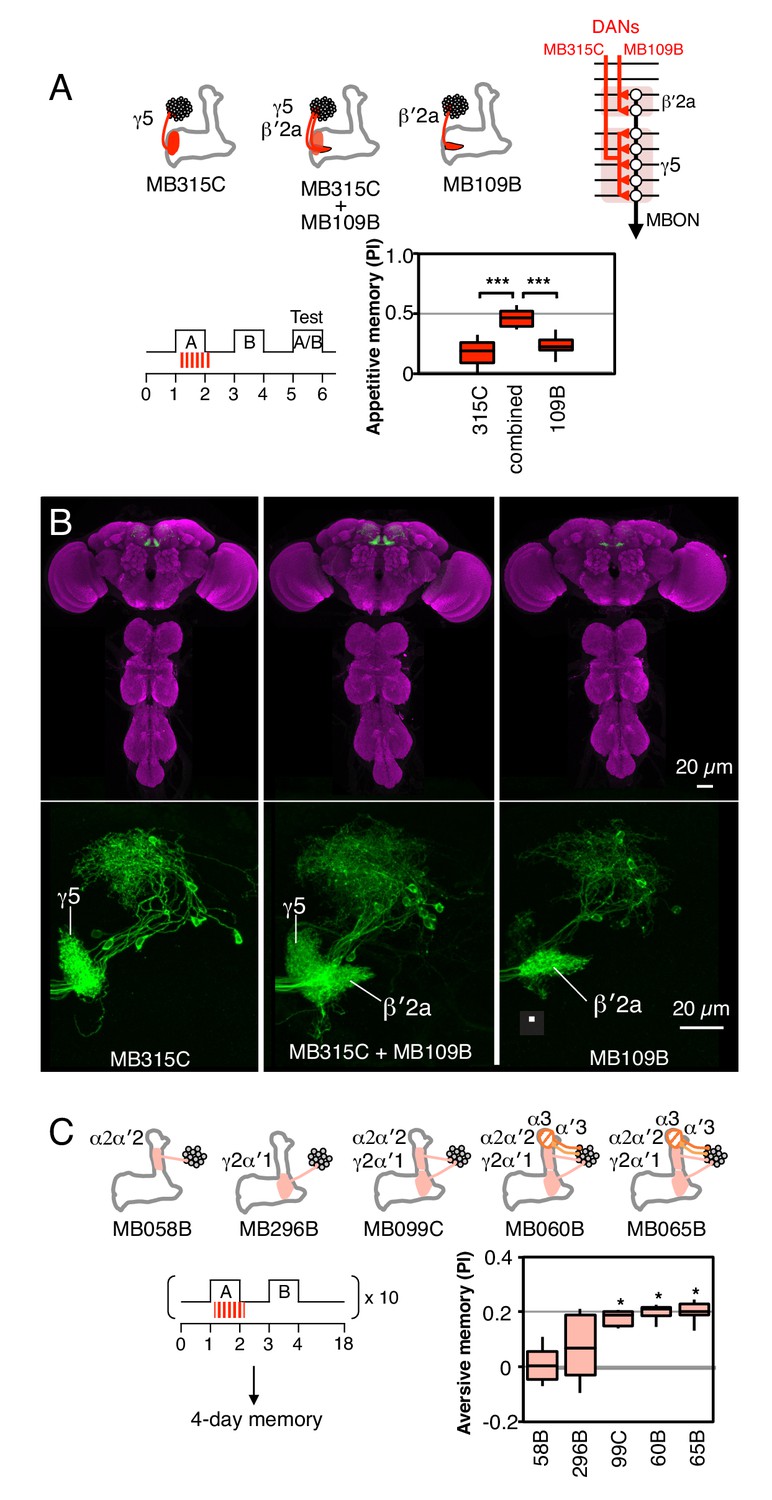
Combinatorial roles of DANs in memory formation.
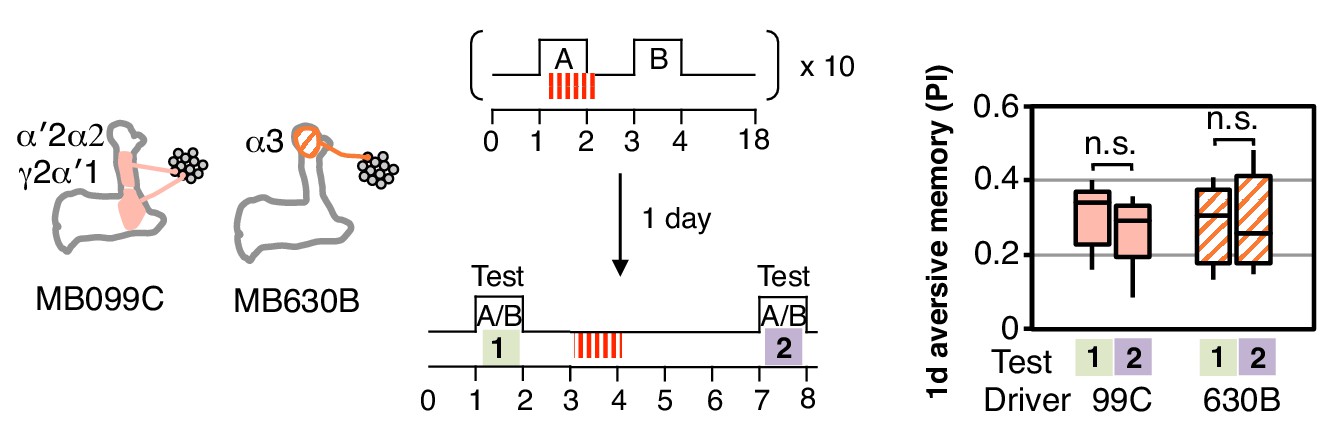
(A) Top: Diagram of the expression patterns of PAM-γ5 (MB315C) and PAM-β′2a (MB109B) as well as that obtained by combining them. As illustrated in the circuit diagram, each of these DANs innervates one of two compartments that are spanned by a common MBON. Bottom: Activating the combined drivers induced significantly higher appetitive memory than obtained by activating either driver alone. N = 12–16. (B) Top: Expression patterns of CsChrimson-mVenus (green) and the reference pattern of anti-Brp (magenta) in the brain and ventral nerve cord of the indicated split-GAL4 drivers. The expression pattern of the combined driver was nearly the simple sum of individual drivers MB109B and MB315C. Bottom: Higher magnification views of the region including the MB lobes in one brain hemisphere are shown without the reference anti-Brp pattern. (C) Training ten times with 15-min rest intervals (10x spaced training) resulted in significant 4-day aversive memory when using the three drivers, MB099C, MB060B and MB065B that express in the combination of the γ2, α′1, α′2 and α2 compartments (PPL1-γ2α′1 and PPL1-α′2α2). MB060B and MB065B also express in α3 and α′3 (PPL1-α3 and PPL1-α′3). Drivers expressing either in just α′2 plus α2 (MB058B) or just in γ2 plus α′1 (MB296B), failed to induce 4-day memory. N = 6–10. Asterisk indicates significance from 0: *p<0.05; ***p<0.001.
Figure 2—figure supplement 2
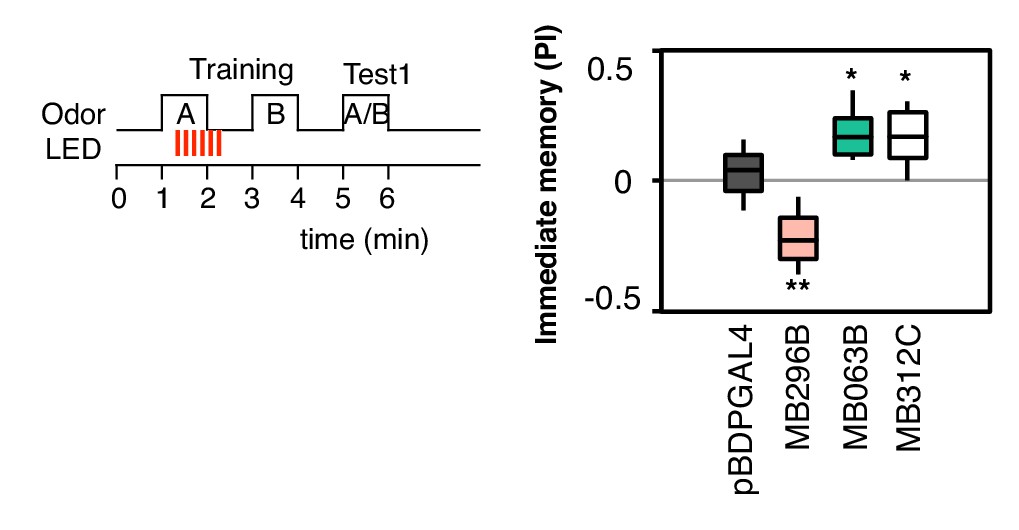
Additional drivers that induced weak, but significant, memory.
pBDPGAL4 is an enhancerless GAL4 driver used as a control. MB296B expresses in PPL1-γ2α′1, a subset of the expression pattern of MB099C, and MB063B expresses in PAM-β1, a subset of the expression pattern of MB213B (Aso et al. 2014a). These drivers show significant memory compared to the control genotype, but much weaker than the combination lines (MB099C and MB213B; see Figure 2B) used in our main experiments. MB312C (Aso et al. 2014a) expresses in a combination of PAM-γ4 and PAM-γ4 < γ1γ2. N = 16–20.
Figure 2—figure supplement 3

Controls for genetic background.
(A) Diagram of the key split-GAL4 lines used in this study. (B) MB320C, MB099C and MB630B were tested as heterozygotes with UAS-CsChrimson for their ability to form aversive memory with electric shock (twelve 1.25 s pulses of 60V delivered in a shock tube) as the US rather than optogenetic stimulation and then tested in our standard arena. Both immediate memory with a single training (n = 10–12) and 4-day memory (n = 8) with 10X spaced training were assessed. (C) Similarly, MB043C, MB213B and MB315+MB109B were tested for immediate (n = 10–12) and 1-day (n = 8) appetitive memory using sugar reward as the US. The results show that all lines show roughly similar levels of memory formation, indicating that the failure to form some types of memory by optogenetic stimulation of a specific DAN is unlikely to be due to differences in genetic background between lines.
Figure 2—figure supplement 4
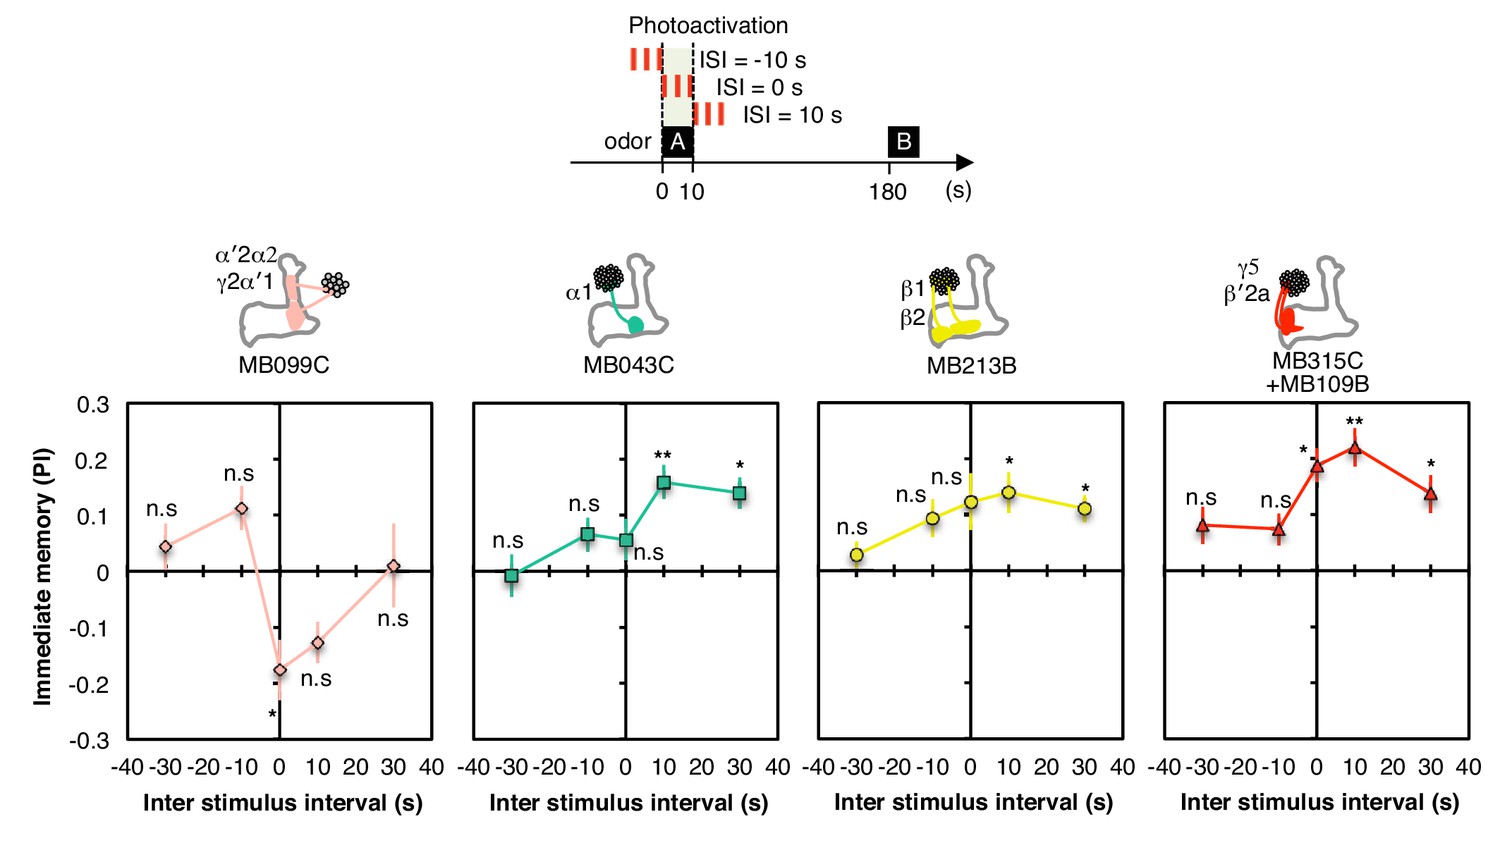
Inter stimulus interval curves.
Inter stimulus interval curves were measured as in Figure 1G. MB099C showed significant aversive memory only at ISI = 0 s; ISI = −10 s and +10 s were significant without correction for multiple comparisons. MB043C, MB213B and MB315C+MB109B all showed significant appetitive memory at ISI = +10 s and +30 s; MB315C+MB109B also showed significant appetitive memory at ISI = 0. Thus, for appetitive memory, the period when dopamine signaling resulted in the most robust memory formation was shifted slightly later relative to odor presentation; such a response profile might be an adaptation to the time required for converting ingested food to a nutritional reward signal. The lower PIs observed relative to those shown in Figure 3B presumably result from the need to use a 10-s (rather than a 60-s) training time in these experiments. N = 8–12.
Figure 2—figure supplement 5
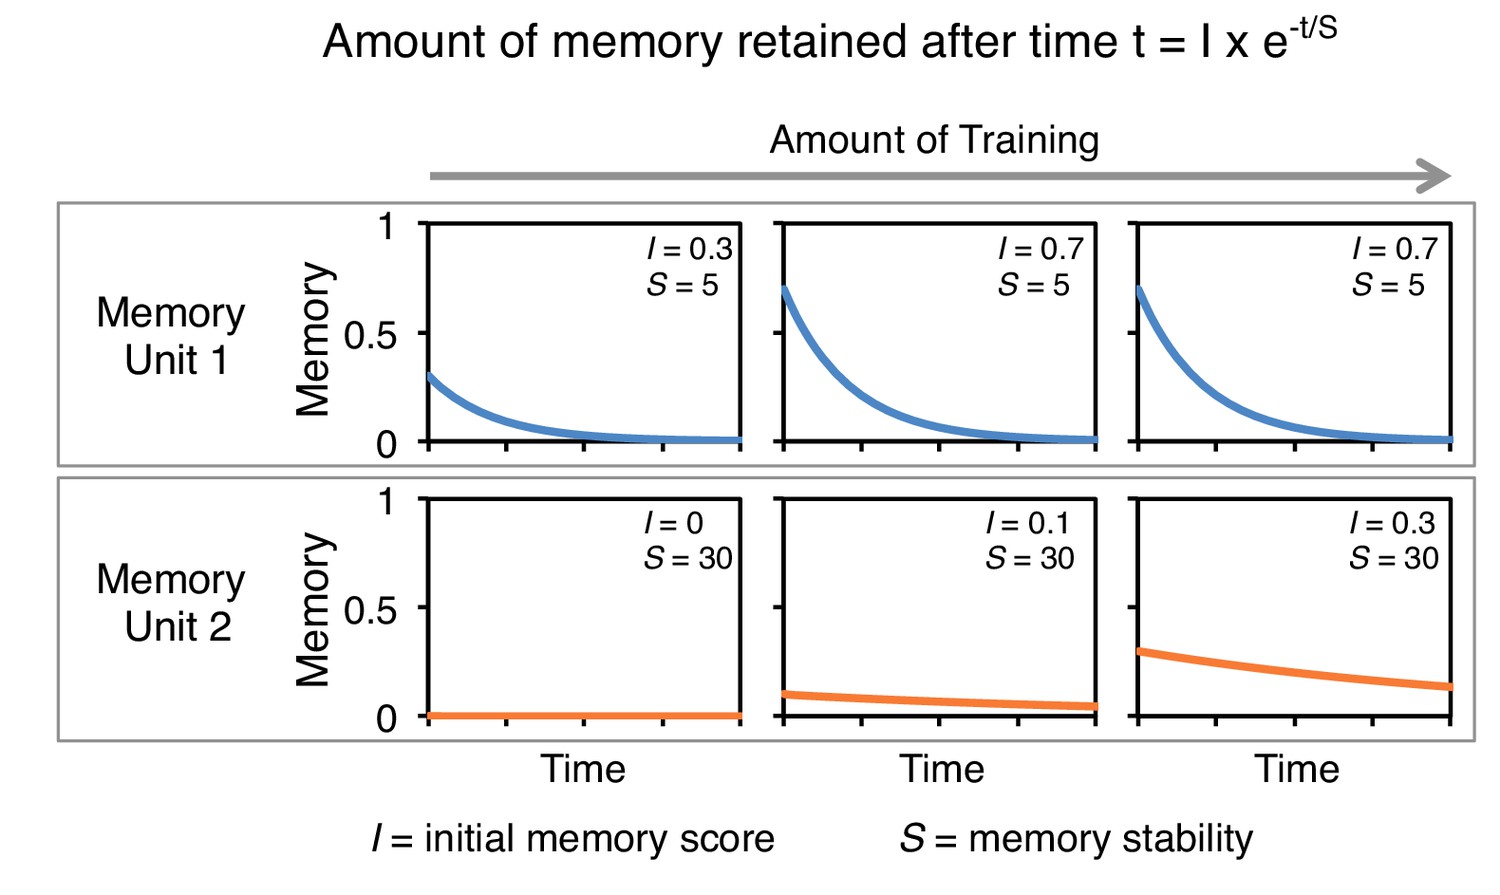
A conceptual model of memory dynamics in parallel memory units.
The top and bottom panels show hypothetical retention curves following three different extents of training in two memory units: memory unit one has a fast acquisition rate and fast decay dynamics (top) and memory unit 2 has a slow acquisition rate and slow decay dynamics. Memory retention at certain time t is a function of the initial magnitude of memory following training, I, and the memory stability, S (Ebbinghaus, 1885). Note that while the initial memory score (I) depends on the amount of training, memory stability (S) is constant in each memory unit and is not altered by the amount of training. Based on this and previous studies (Hige et al., 2015; Aso et al., 2012), we propose that to a first approximation individual MB compartments can be modeled as distinct memory units with different baseline acquisition rates and memory stabilities, which can be set independently. For aversive memory, we found memory stability and acquisition rate appear negatively correlated (Figure 2 and Figure 3B). However, stable appetitive memory can be induced by brief training (Figure 3B) (Yamagata et al., 2015; Huetteroth et al., 2015).
Figure 3 with 1 supplement

Rules for updating memory.
(A) Diagram of the DANs contained in split-GAL4 driver lines, which have been color-coded to facilitate comparison with the plots shown in the subsequent panels. In all experiments, the drivers were crossed with 20xUAS-CsChrimson-mVenus in attP18. (B) Memory decay after 1 d. Left: Flies were trained with a 60-s odor delivery during which thirty 1-s pulses of red light were given, and then tested either immediately (Test 1) or after 1 d (Test 2). Center: To facilitate comparison of PI magnitudes, the sign of the PI in this and subsequent panels was reversed for DANs that induced aversive memory (MB320C, MB099C and MB630B). The bottom and top of each box represents the first and third quartile, and the horizontal line dividing the box is the median. The whiskers represent the 10th and 90th percentiles. N = 8–18. Right: Comparison of memory retention times induced by activation of different DANs. Ratios of the mean PI measured at 1d and individual PIs immediately after training are shown for each driver. Asterisk indicates significance of depicted pairs after comparing all pairs. (C) Decrease in the conditioned response by unpaired odor exposure. After the first training and test (Test 1), flies were exposed to both odors without optogenetic DAN activation and then retested (Test 2). In panels C–E, Test 1 and Test 2 were performed on the same group of flies and thus the ratios of individual data points are plotted in the rightmost graphs. N = 10–18. (D) Decrease in the conditioned response by unpaired DAN activation. After first training and test (Test 1), flies were exposed to light to activate DANs (thirty 1-s pulses) without odor delivery, and then retested (Test 2). N = 10–17. (E) Flexibility to learn a new association. After first training and test (Test 1), flies were trained with the opposite pairing of odor and DAN activation and tested for their ability to learn the new pairing (Test 2). N = 10–16. For most DANs, the ability to learn the second association was not significantly impaired by the first training. The exception was MB043C, which expresses in the DAN innervating the α1 compartment. (F) Memory capacity. Flies were trained and tested with two pairs of odors. Odor A and B were pentyl acetate and 3-octanol, respectively. Odor C and D were ethyl lactate and 4-methylcyclohexanol, respectively. N = 8–12. For MB320C (compartments γ1 and pedc) only the most recently trained odor was retained, an effective memory capacity of one. For MB043C (α1 compartment), flies were able to remember both comparisons, demonstrating a memory capacity of at least two. Asterisk indicates significance: n.s. not significant, *p<0.05; **p<0.01; ***p<0.001.
Figure 3—figure supplement 1
One-day memory is resistant to unpaired DAN activation.
Unlike with immediate memory that was induced by a single training (Figure 3D), memory induced by spaced training with MB099C or MB630B and tested after 1 d does not show a significant reduction after DAN activation. N = 15.
Figure 4
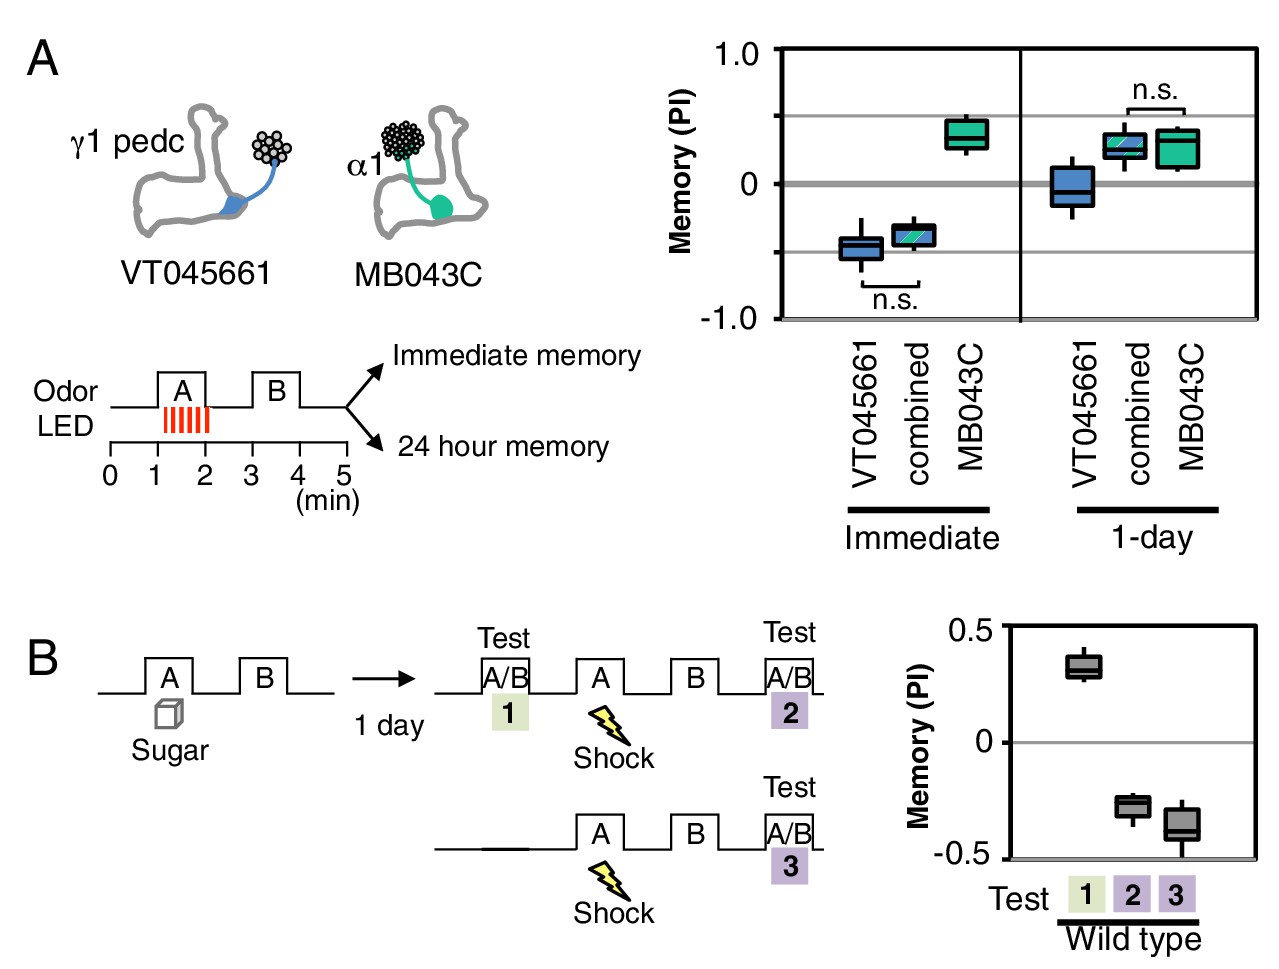
Processing of conflicting memories.
(A) Flies expressing CsChrimson in PPL1-γ1pedc (VT045661-LexA in JK22C x 13xLexAop2-CsChrimson-tdTomato in attP18), or in PAM-α1 (MB043C x 20xUAS-CsChrimson-mVenus in attP18), or in both PPL1-γ1pedc and PAM-α1 (by combining all four transgenes) were starved for 48 hr and then trained with a 60-s odor delivery during which thirty 1-s pulses of red light were given, and then tested either immediately or after 1 d. N = 8–12. (B) Wild type flies were starved for 48 hr and then trained using 2-min exposures to odor A with sucrose and then to odor B without sucrose and tested for odor preference after 1d (Test 1). Following the first memory test, flies were trained with a 1-min exposure of odor A (the odor previously paired with sugar) and electric shock (twelve 1.25 s pulses of 60V) in the olfactory arena and then with odor B without shock. Odor preference was measured immediately after the second training (Test 2). For comparison, wild type flies starved for same period were conditioned with electric shock and tested immediately (Test 3). N = 8.
Figure 5

Summary of distinct rules for learning and updating memory.
(A) Summary table of distinct learning rules induced by different DAN cell types. Criteria were qualitatively judged to be +, ++, +++ or n.d. (not determined) based on the data presented in Figures 2,3. (B) Diagram summarizing the feed forward network within the MB lobes (compartments shown as boxes) and the convergence of MBONs in common target zones in other brain areas (shown as ovals). These circuit motifs might provide a path through which memories distributed in different MB compartments might be integrated (Aso et al., 2014a). Not shown in this diagram are cases where MBONs target the dendrites of DANs, a circuit motif that is known to occur (Aso et al., 2014a; Ichinose et al., 2015) and could also promote communication between compartments.
Videos
Video 1
Separation of airflow in the four quadrants of arena.
Ammonium chloride smoke was introduced in two opposing quadrants allowing the borders of airflow in the circular arena to be seen. Valves opened at the beginning of the movie. After a ~2 s delay, smoke reached the peripheral of arena, a further ~3 s was required to fill the arena. At a flow rate of 400 mL/min, replacing the 23.5 mL of air in the arena takes ~3.5 s. Elapsed time after valve opening is shown in the upper right.
Video 2
Conditioned odor avoidance after training with PPL1-γ1pedc.
An example of conditioned odor avoidance behaviors after training using optogenetic activation of PPL1-γ1pedc. The movie shows the 1-min test period (corresponding to the 5 to 6 min time range in Figure 1D left). Colored lines follow the trajectories of four flies. Notice that flies approaching the borders between compartments readily cross into the B quadrants with the control odor, but avoid crossing into the A quadrants with the trained odor.
Additional files
-
Supplementary file 1
Design and parts list of the olfactory behavioral apparatus.
The first page shows a side view of the apparatus with a parts list. On the second page, a 3D model of the apparatus is shown which can be rotated and the visualization of each part can be individually turned on or off.
- https://doi.org/10.7554/eLife.16135.016
Download links
A two-part list of links to download the article, or parts of the article, in various formats.
Downloads (link to download the article as PDF)
Open citations (links to open the citations from this article in various online reference manager services)
Cite this article (links to download the citations from this article in formats compatible with various reference manager tools)
Dopaminergic neurons write and update memories with cell-type-specific rules
eLife 5:e16135.
https://doi.org/10.7554/eLife.16135


