Trisomy 21 consistently activates the interferon response
- University of Colorado School of Medicine, United States
- University of Colorado Boulder, United States
- Howard Hughes Medical Institute, United States
Figures
Figure 1 with 3 supplements
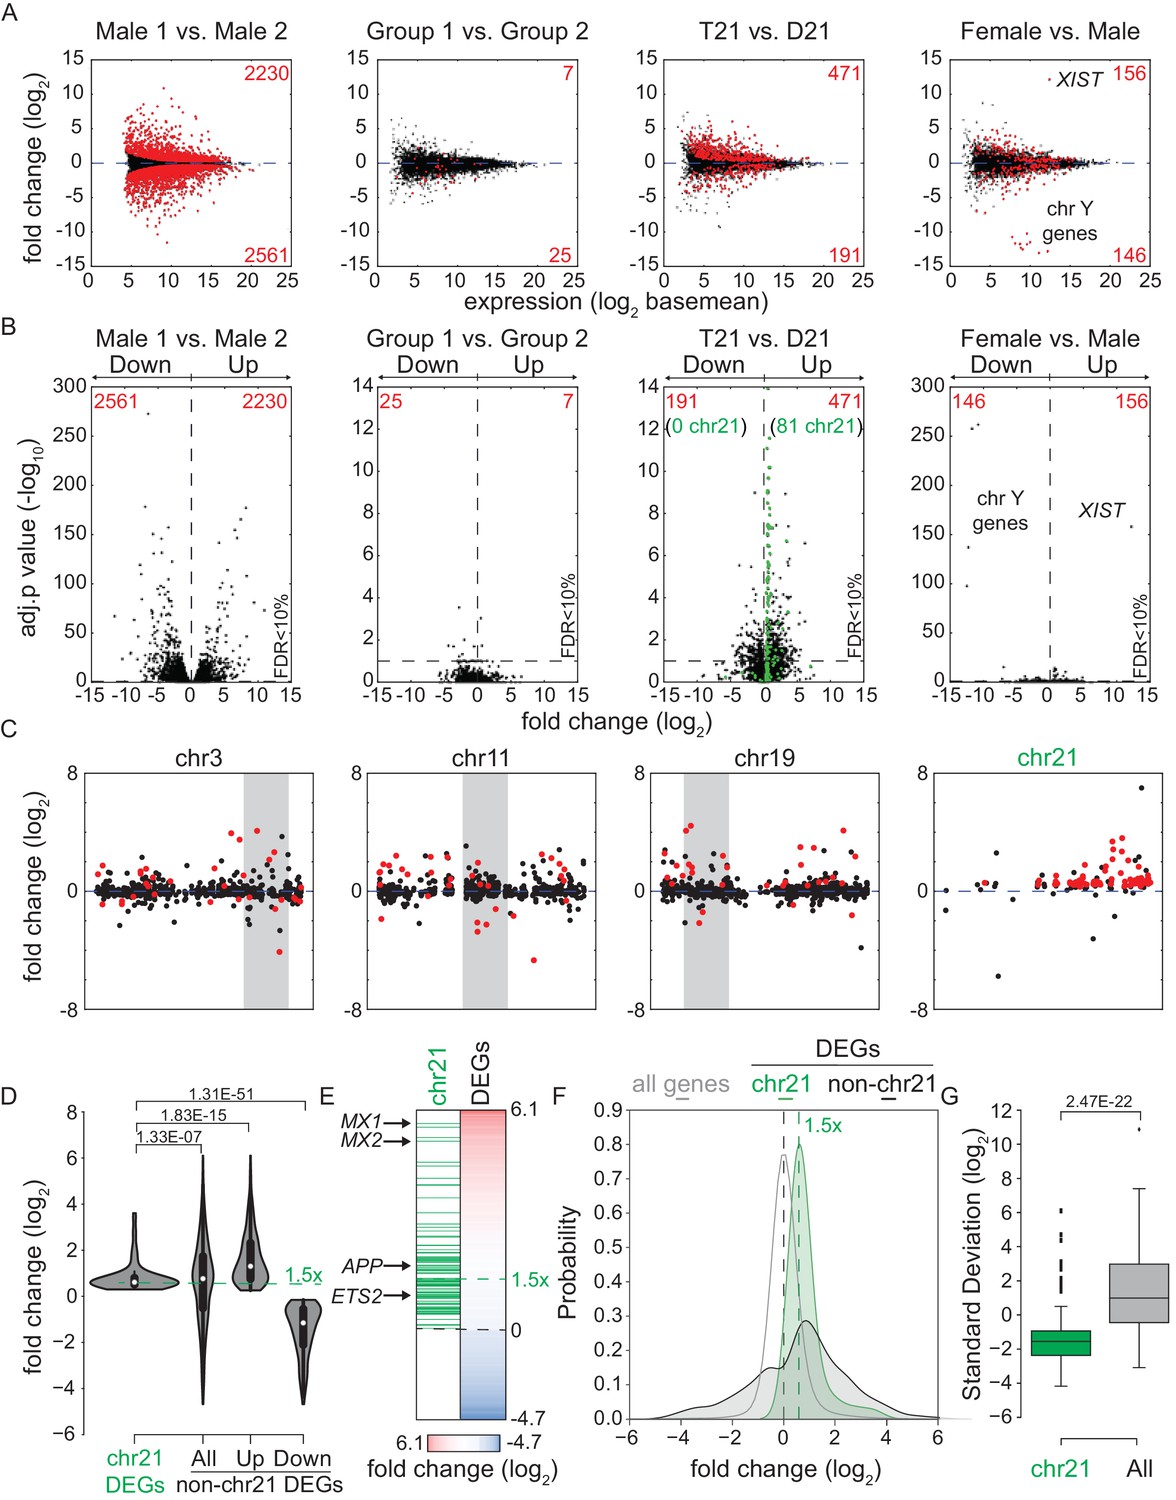
Transcriptome analysis identifies consistent changes in global gene expression between euploid (D21) and trisomy 21 (T21) fibroblasts.
(A) MA plots displaying the results of RNA-seq analysis for the indicated comparisons (see Figure 1—figure supplement 1A–C). Differentially expressed genes (DEGs), as defined by DEseq2 (FDR < 10%), are labeled in red. (B) Volcano plots of comparisons in A highlight changes in chr21 gene expression (green) consistent with increased gene dosage effects. (C) Manhattan plots displaying DEGs (red) and all genes (black) for individual chromosomes do not show obvious domains of contiguous upregulation or downregulation. Shaded areas highlight regions of overlapping upregulation and downregulation (see Figure 1—figure supplements 2A and 3). (D) Violin plots of chr21 and non-chr21 DEGs displaying the distribution of fold changes of DEGs in each category. p-values were calculated with the Kolmogorov-Smirnov test. (E) Heatmap of all significant DEGs showing clustering of chr21 DEGs (green) around 1.5 fold upregulation in T21 cells. (F) Kernel density estimate plot highlighting the probabilities of chr21 DEGs (green, green dashed line indicates median), non-chr21 DEGs (black, black dashed line indicates median), and all genes (gray), of having a given fold change. (G) Box and whisker plot of standard deviations of fold changes in DEGs for six pairwise comparisons of age- and gender-matched T21 versus D21 fibroblasts showing greater variation in fold change for non-chr21 DEGs. p-values were calculated with the Kolmogorov-Smirnov test.
Figure 1—figure supplement 1
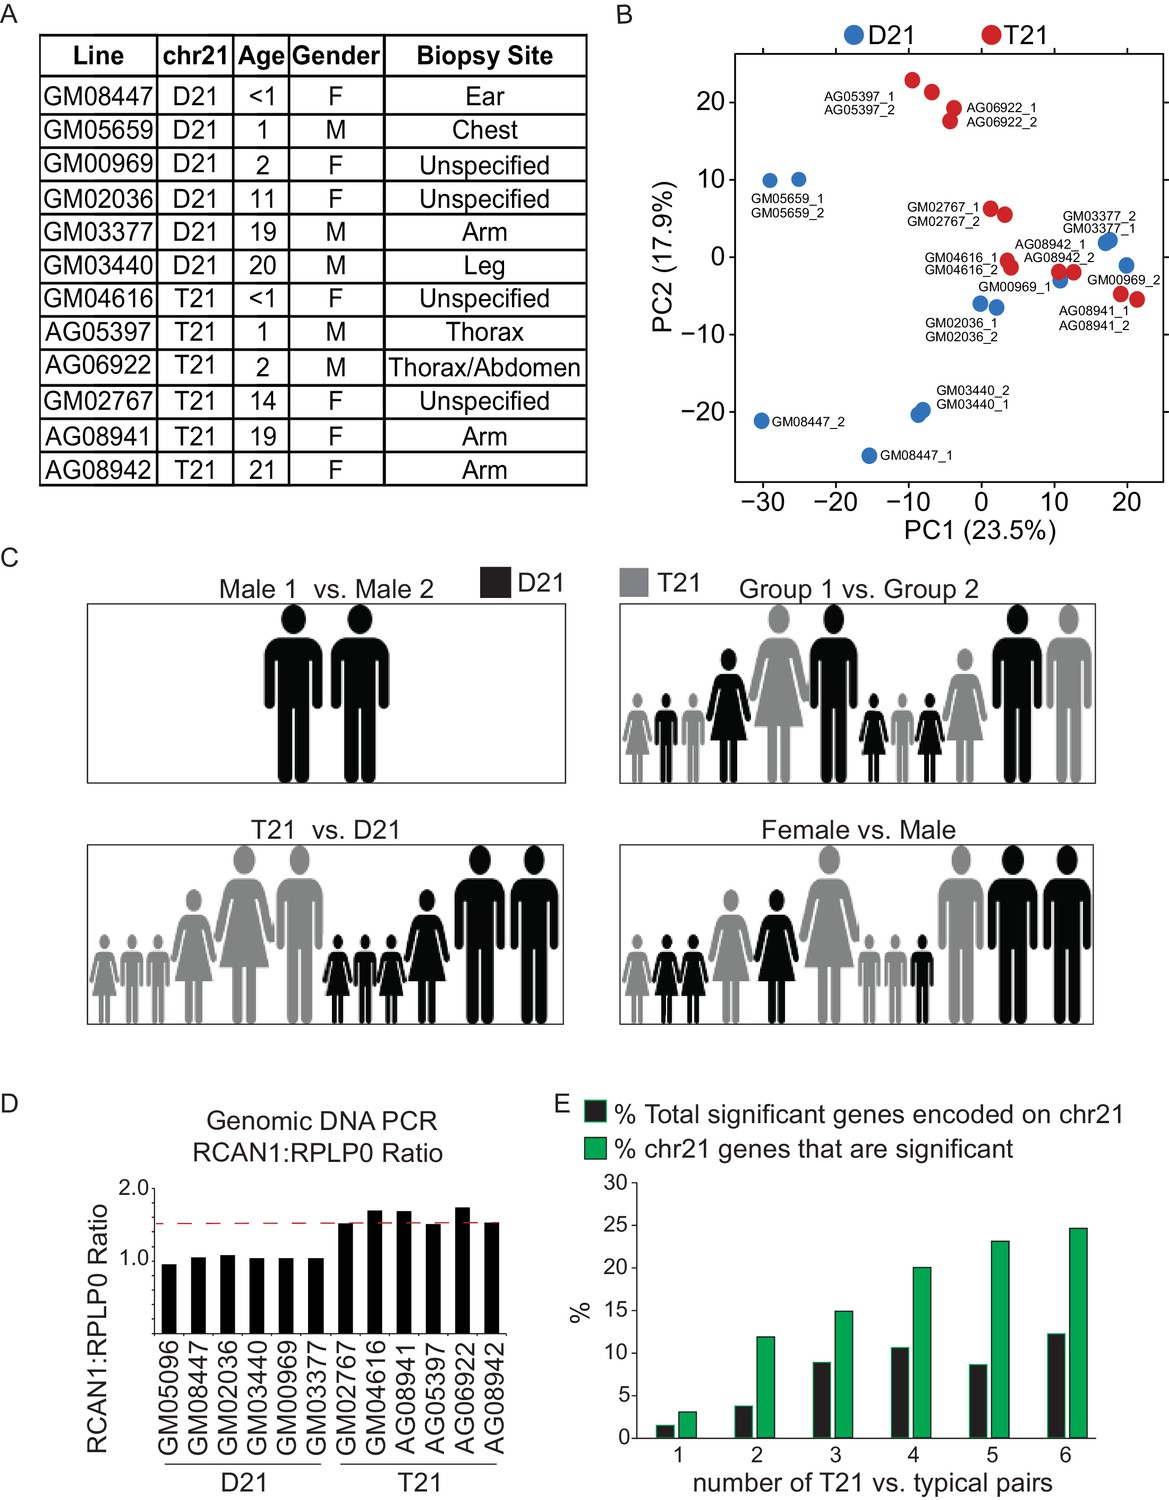
T21 and D21 fibroblast RNA-seq.
(A) Description of fibroblast cell lines used in this study. (B) Principal component analysis (PCA) of fibroblast RNA-seq samples demonstrates tight grouping of biological replicates. (C) Schematic of group comparisons. (D) PCR of genomic DNA for the RCAN1 gene encoded on chr21 confirms T21 status. RPLP0 is a control gene encoded on chr12. (E) Bar graph displaying how numbers of differentially expressed genes (DEGs) encoded on chr21 increase with sample size.
Figure 1—figure supplement 2
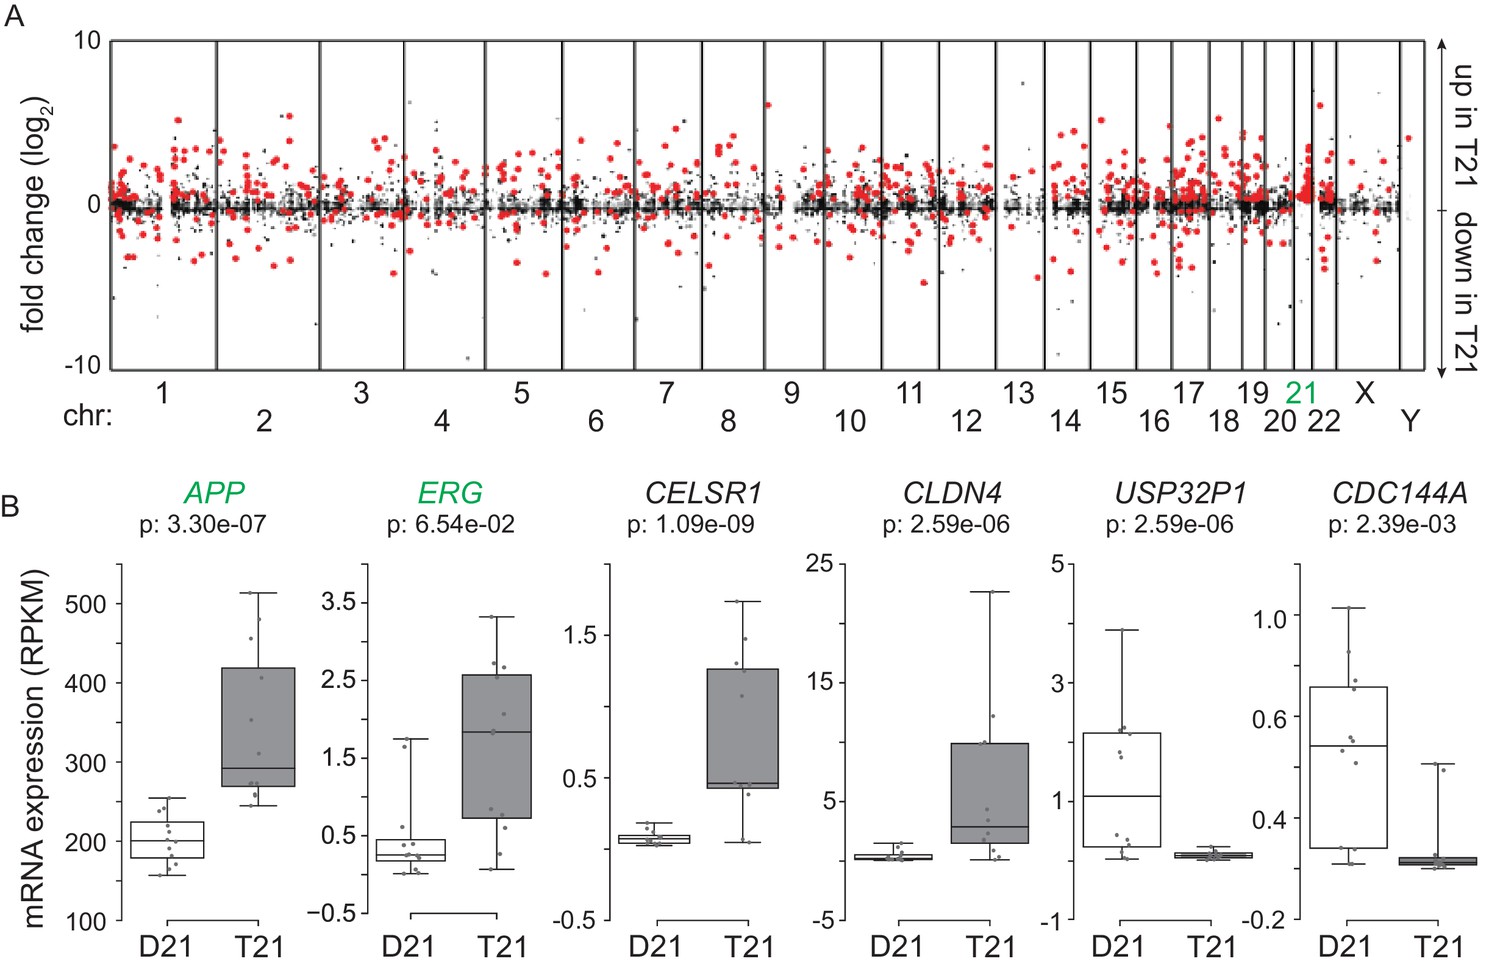
Amplification of changes in gene expression emanating from T21.
(A) Manhattan plot showing most DEGs (red) are not encoded on chr21. (B) Example box and whisker plots of chr21 (green) and non-chr21 (black) DEGs. mRNA expression values are displayed in reads per kilobase per million (RPKM). Benjamini-Hochberg adjusted p-values were calculated using DESeq2.
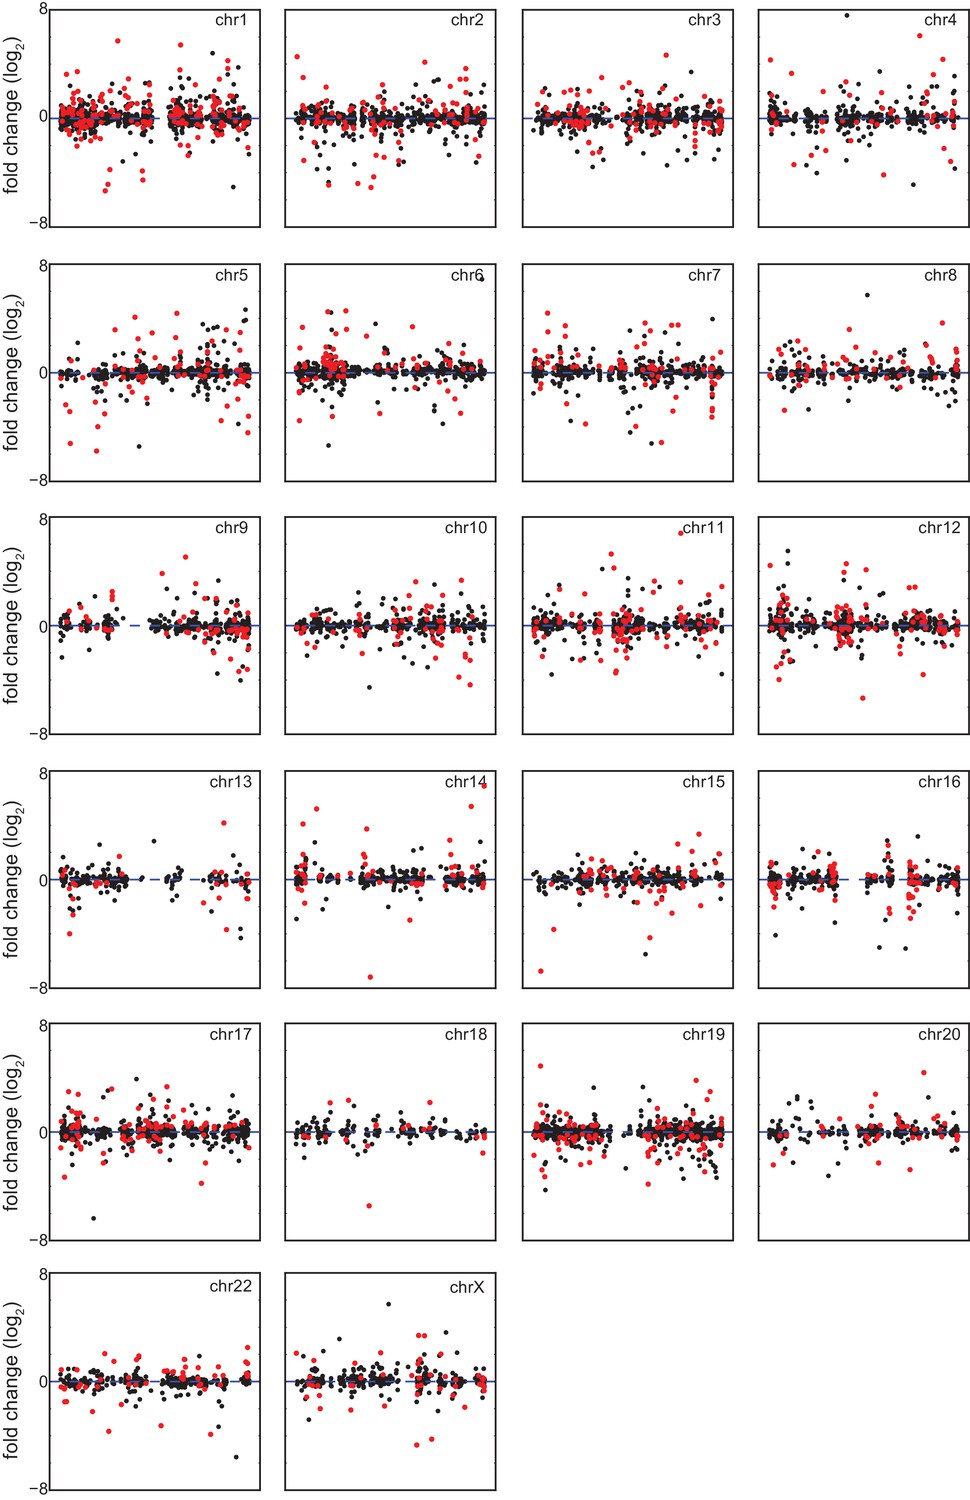
Figure 1—figure supplement 3

Differentially expressed genes in trisomy 21 fibroblasts are not organized into obvious chromatin domains.
Manhattan plots for individual chromosomes indicating differentially expressed genes in red.
Figure 2 with 1 supplement

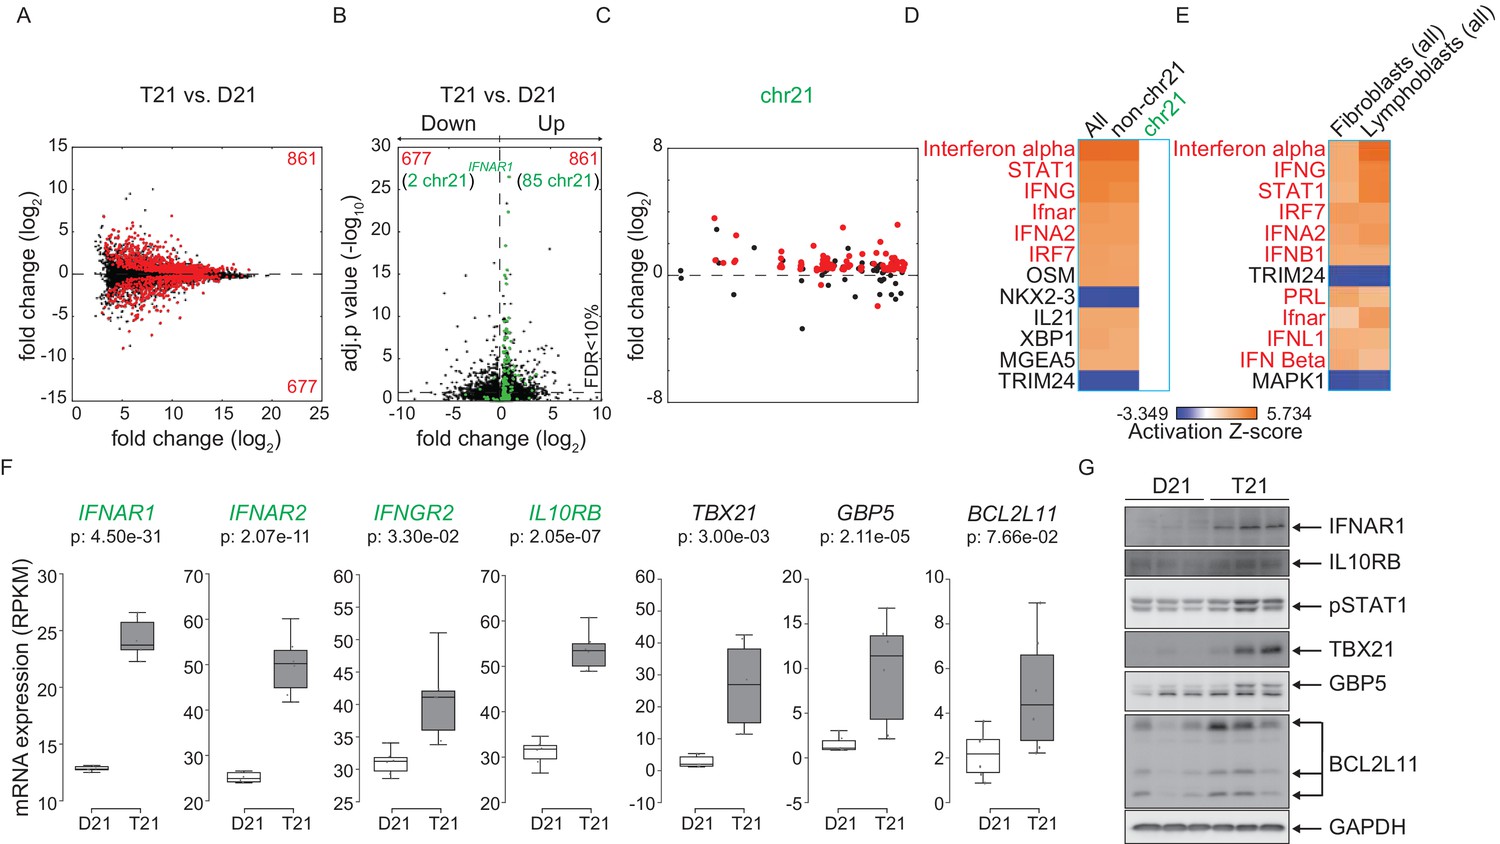
The interferon (IFN) transcriptional response is activated in trisomy 21 (T21) fibroblasts.
(A) Upstream regulator analysis of the T21-associated gene expression signature using Ingenuity Pathway Analysis (IPA) predicts numerous IFN-related factors as activated in T21 cells. (B) Representative results of the upstream regulator analysis for the Type I IFN ligand IFNA2. (C) Graphical summary of the observed deregulation of the IFN pathway in T21 fibroblasts, showing the six IFN receptor subunits, four of which are encoded on chr21 and significantly upregulated in T21 fibroblasts; the predicted upstream regulators (orange), including the Type I, II, and III IFN ligands, as well as the IFN-activated transcription factors (IRFs and STATs); and select examples of Interferon Stimulated Genes (ISGs) upregulated in T21 fibroblasts, either encoded on chr21 (green) or elsewhere in the genome (gray). (D) Box and whisker plots showing RNA expression for the six IFN receptor subunits and select ISGs. chr21-encoded genes are highlighted in green. mRNA expression values are displayed in reads per kilobase per million (RPKM). Benjamini-Hochberg adjusted p-values were calculated using DESeq2. (E) Western blot analysis confirming upregulation of IFN receptors, STAT1 phosphorylation, and ISGs, in T21 fibroblasts. (F) Box and whisker plots showing protein expression of select IFN-related genes as measured by SOMAscan assay. chr21-encoded genes are highlighted in green. Protein expression values are displayed in relative fluorescence units (RFU). Adjusted p-values were calculated using the Empirical Bayes method in QPROT.
Figure 2—figure supplement 1
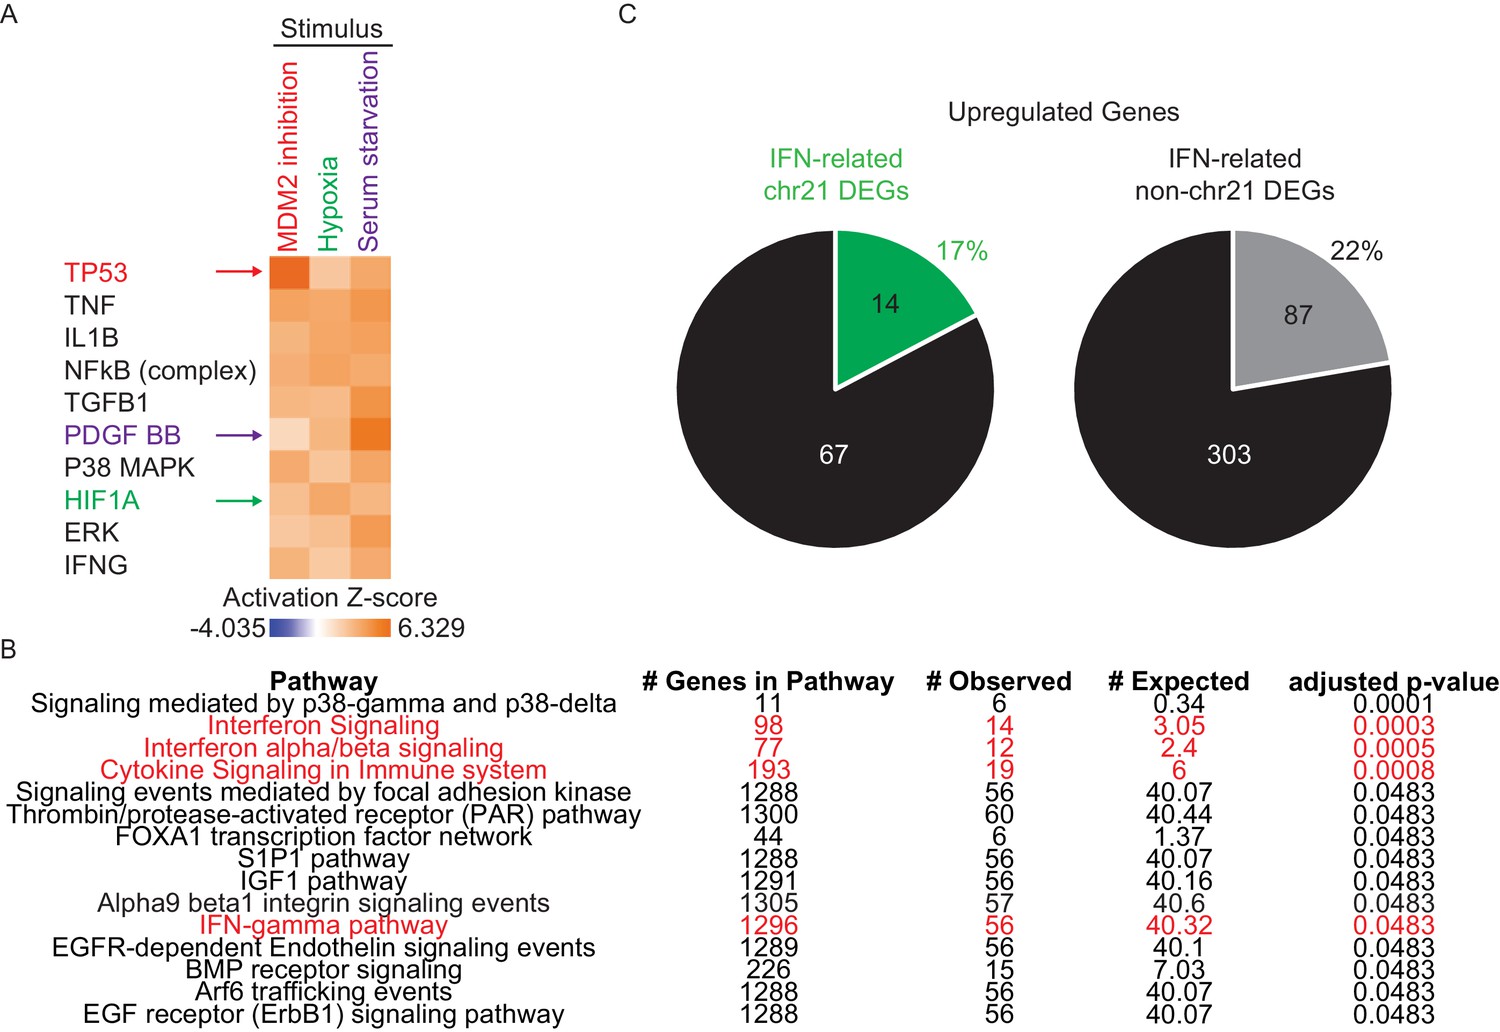
Network analysis confirms IFN activation signature in T21 cells.
(A) IPA upstream regulator analysis of genes activated upon MDM2 inhibition with Nutlin-3, hypoxia (1% O2), and serum stimulation in HCT116 colorectal cancer cells correctly identifies the transcription factor p53, the transcription factor HIF1A, and the growth factor PDGF, as the key upstream regulators in each scenario. (B) Top 15 deregulated pathways in T21 cells identified by Pathway Commons Analysis in WebGestalt. IFN-related pathways are highlighted in red. (C) Pie charts showing the percentage of chr21 and non-chr21 upregulated genes in the interferon pathway.
Figure 3
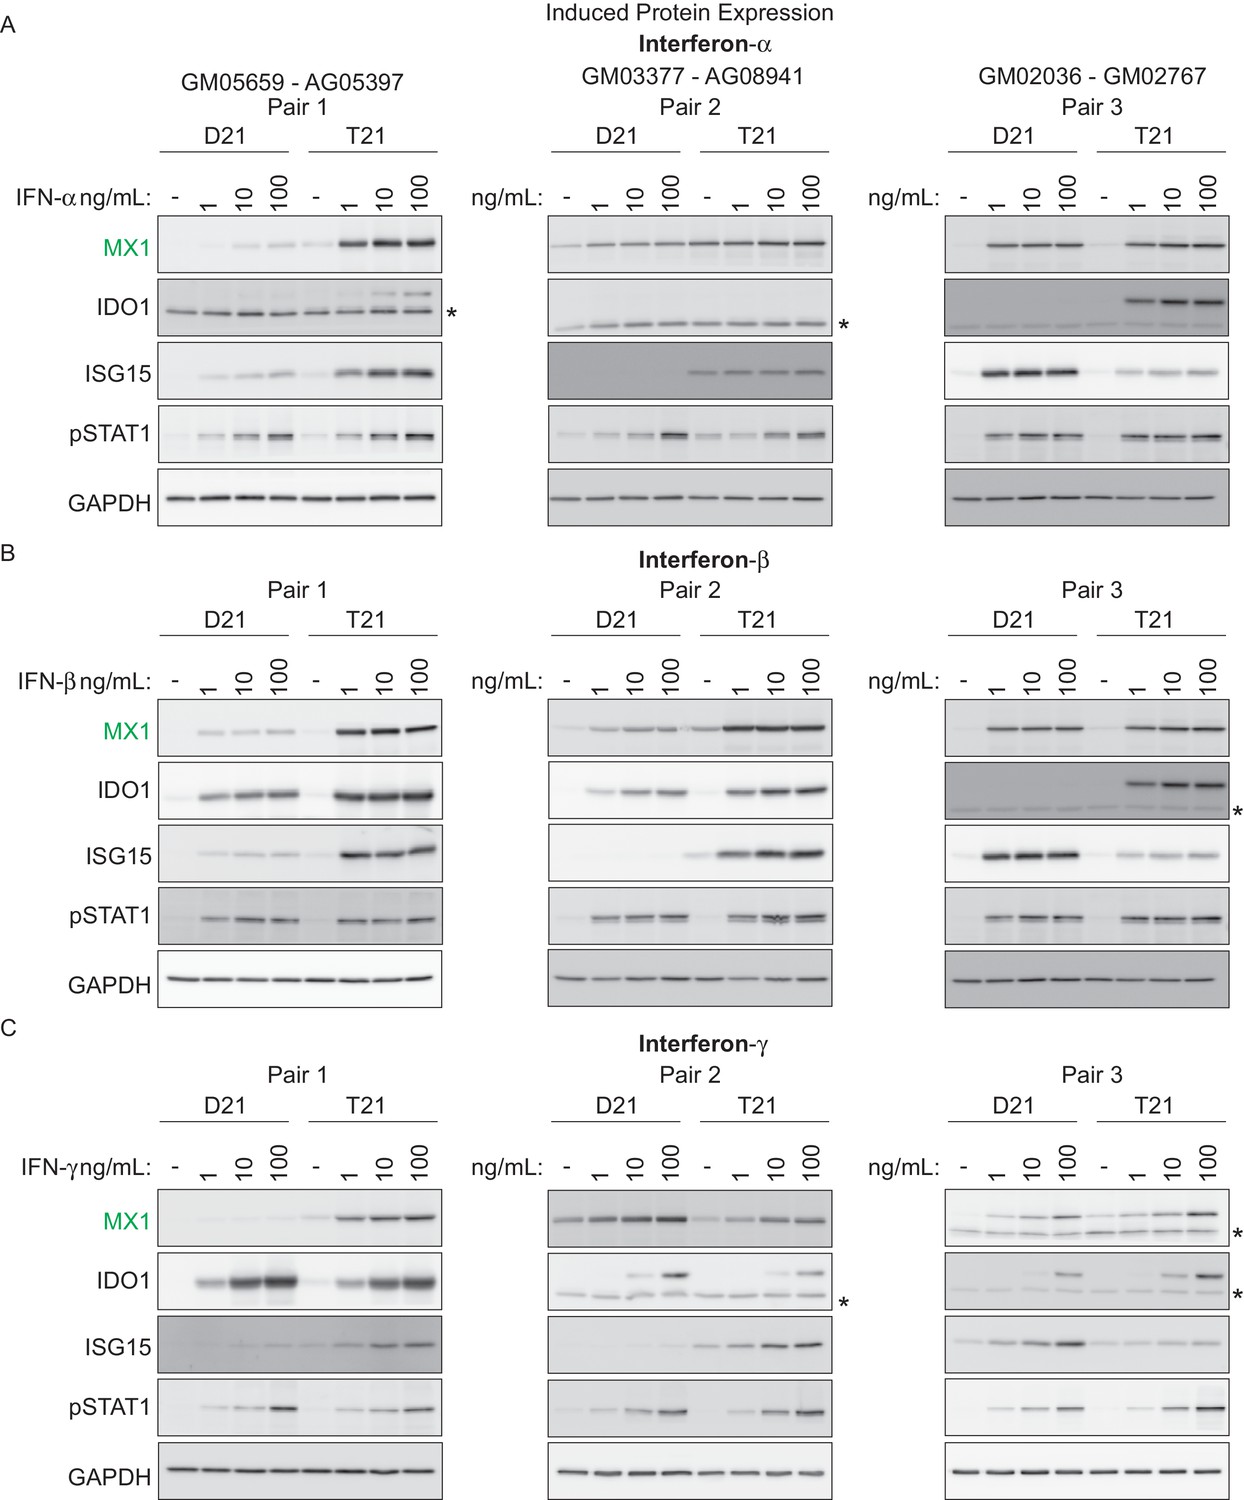
T21 fibroblasts are more sensitive to IFN stimulation than D21 fibroblasts.
(A) Western blots showing that three T21 cell lines are more sensitive to IFN-α treatment (24 hr) than age- and gender-matched D21 control cells as measured by induced expression of the ISGs MX1, IDO1 and ISG15. Elevated pSTAT1 levels confirm effective induction of the IFN pathway in response to ligand exposure. (B) Western blots as in A for IFN-β treatment. (C) Western blots as in A for IFN-γ treatment. * indicates non-specific bands.
Figure 4 with 1 supplement
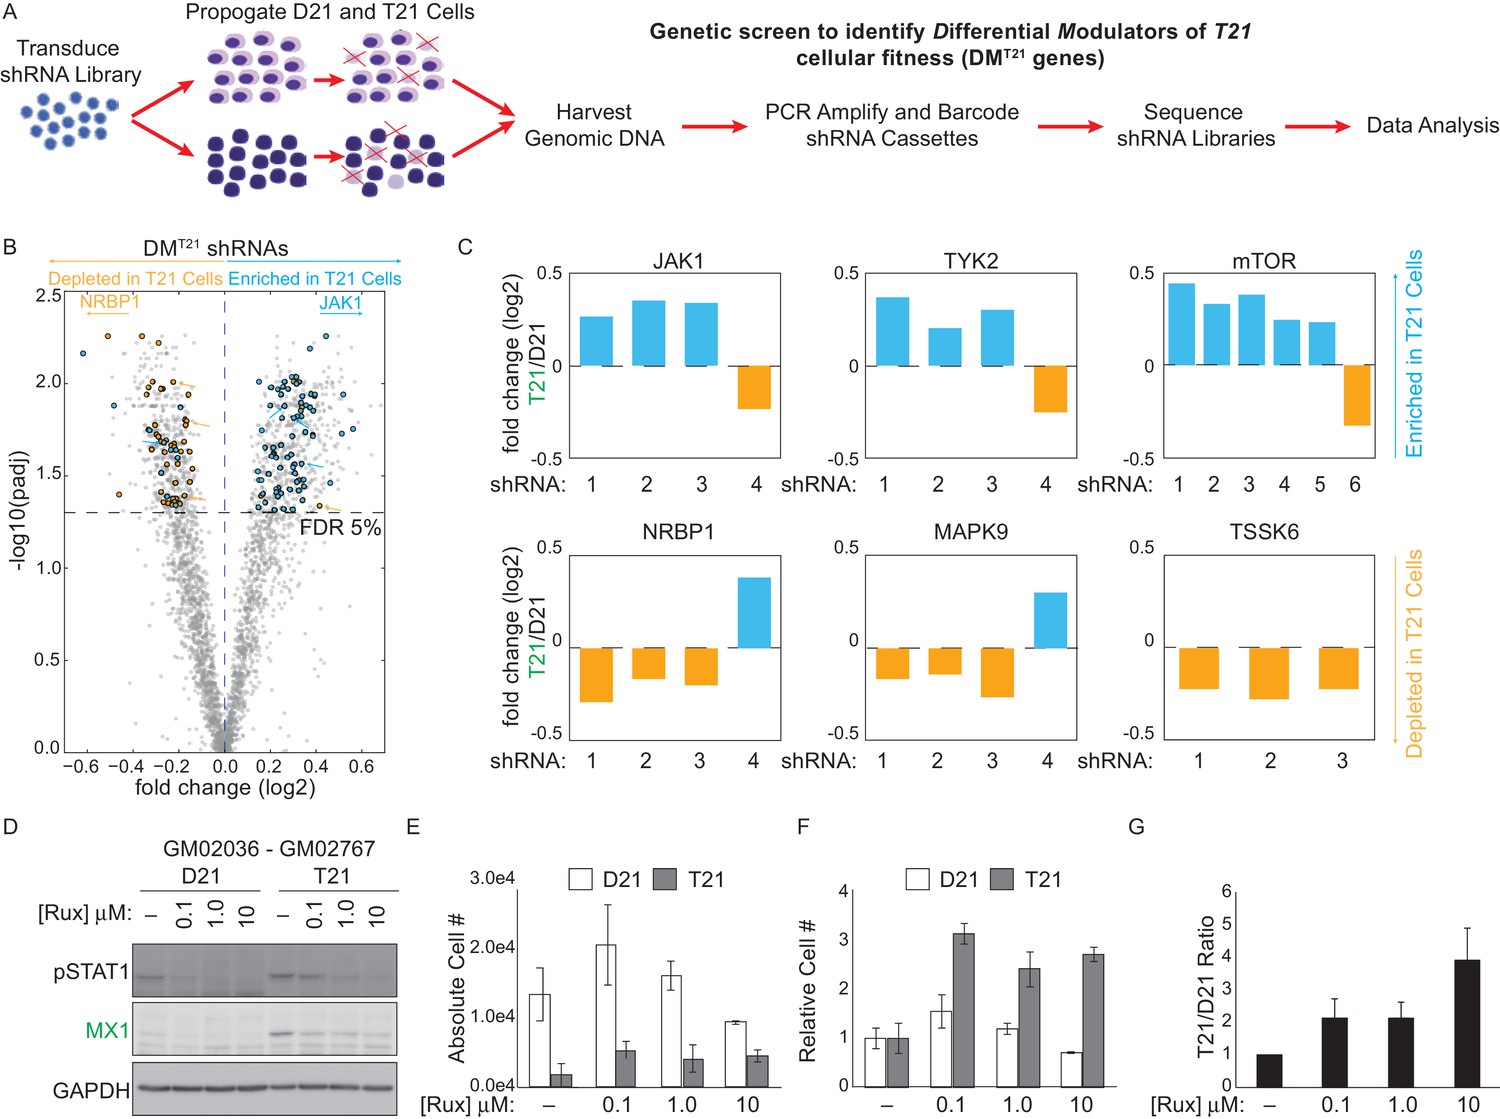
An shRNA screen identifies the interferon (IFN)-activated kinases JAK1 and TYK2 as negative regulators of trisomy 21 (T21) cellular fitness.
(A) Schematic of kinome-focused shRNA screen to identify Differential Modulators of T21 (DMT21) cellular fitness. (B) Volcano plot highlighting shRNAs targeting DMT21 genes that differentially inhibit T21 (blue) or euploid (D21, yellow) cellular fitness. Top hits were filtered by a FDR < 5% and at least three shRNAs to the same gene scoring in one direction with no more than one shRNA scoring in the opposite direction. NRBP1 and JAK1 shRNAs are indicated with arrows. (C) Bar graphs of the screen results for the IFN-related kinases JAK1 and TYK2, as well as mTOR, NRBP1, MAPK9 and TSSK6. (D) Western blot analysis confirming downregulation of STAT1 phosphorylation and MX1 expression upon inhibition of JAK kinases with ruxolitinib (Rux) at the indicated concentrations in the GM02036-GM02767 cell pair. (E) Absolute cell numbers grown for 72 hr in their respective conditioned media with the indicated doses of Rux. (F) Relative cell numbers from (E). (G) Ratio of T21:D21 relative cell numbers demonstrates the overall differential effect of Rux on the number of viable cells from this T21-D21 pair. Results from a second cell line pair are shown in Figure 4—figure supplement 1D–G. All data shown are an average of three experiments ± standard error of the mean.
Figure 4—figure supplement 1
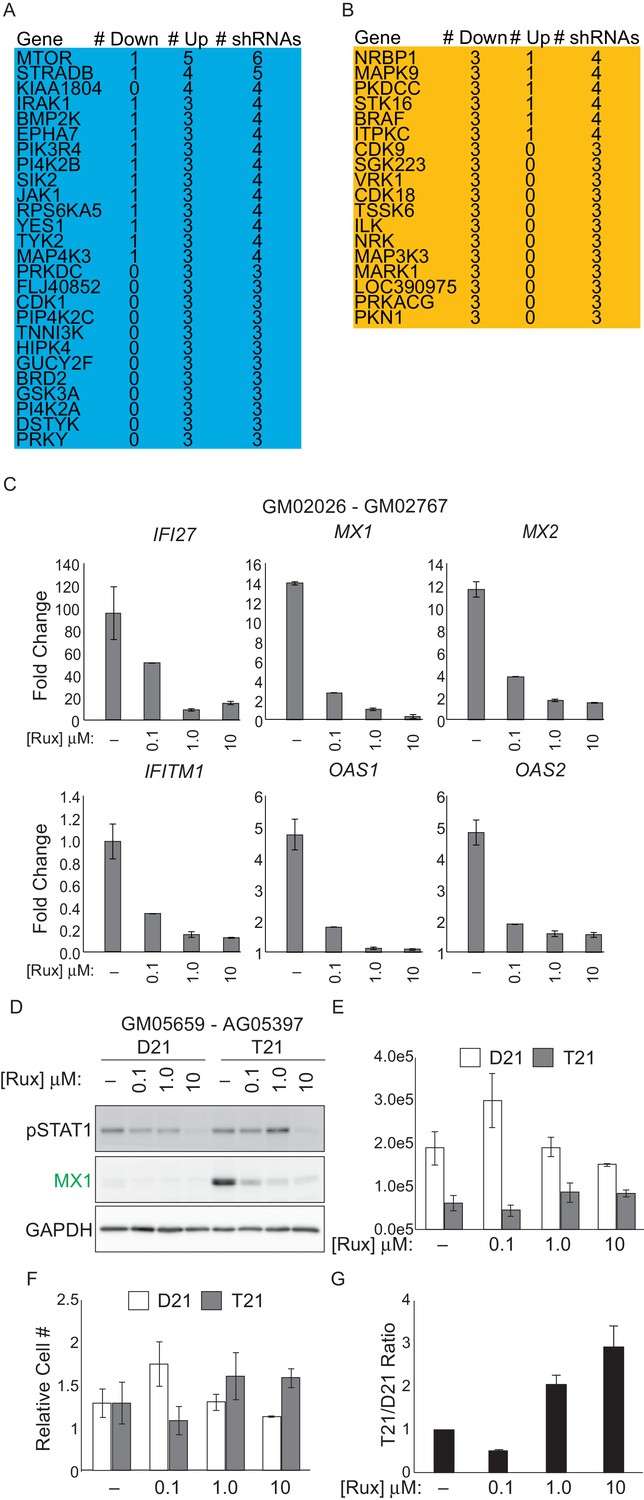
An shRNA screen identifies differential modulators of T21 (DMT21) cellular fitness.
(A, B) shRNAs targeting DMT21 genes that differentially inhibit T21 (blue) or D21 (yellow) cellular fitness. (C) Q-RT-PCR demonstrating that Ruxolitinib (Rux) treatment downregulates mRNA expression for many ISGs in a dose-dependent manner. (D) Western blots demonstrating the effect of Rux treatment on pSTAT1 and MX1 on the cell line pair GM05659 (D21) and AG05397 (T21) (pair 2). (E) Absolute cell numbers from pair 2 grown for 72 hr in their respective conditioned media with the indicated doses of Rux. (F) Relative cell numbers from (E). (G) Ratio of T21:D21 relative cell numbers demonstrates the overall differential effect of Rux on the number of viable cells from this T21-D21 pair. All data shown are an average of three experiments ± standard error of the mean.
Figure 5 with 3 supplements
Activation of the interferon (IFN) transcriptional response is conserved in trisomy 21 (T21) lymphoblastoid cell lines.
(A) MA plot displaying the gene expression signature associated with T21 in a panel of six lymphoblastoid cell lines, three of which harbor T21. Differential expressed genes (DEGs), as defined by DEseq2 (FDR < 10%), are labeled in red. (B) Volcano plot of DEGs with those encoded on chr21 highlighted in green. (C) Manhattan plot of chr21 with DEGs in red and all other genes in black. (D) Upstream regulator analysis reveals activation of the IFN transcriptional response in T21 lymphoblastoid cell lines. (E) Comparative analysis between fibroblasts and lymphoblastoids highlights conserved upstream regulators within the IFN pathway. (F) Box and whisker plots of RNA expression for the four IFN receptor subunits encoded on chr21 (green) and three interferon-related genes (black). mRNA expression values are displayed in reads per kilobase per million (RPKM). Benjamini-Hochberg adjusted p-values were calculated using DESeq2. (G) Western blot analysis confirming upregulation of IFN receptors, pSTAT1, and interferon related genes, at the protein level in T21 lymphoblastoids.
Figure 5—figure supplement 1

Biological replicates of lymphoblastoid samples are highly related.
(A) Table of lymphoblastoid cell lines used in this study. All lymphoblastoid lines used are female. (B) Principal component analysis (PCA) of RNA-seq samples from lymphoblastoid cell lines.
Figure 5—figure supplement 2
Differentially expressed genes in trisomy 21 lymphoblastoid cell lines are not organized into obvious chromatin domains.
Manhattan plots for individual chromosomes indicating differentially expressed genes in red.
Figure 5—figure supplement 3
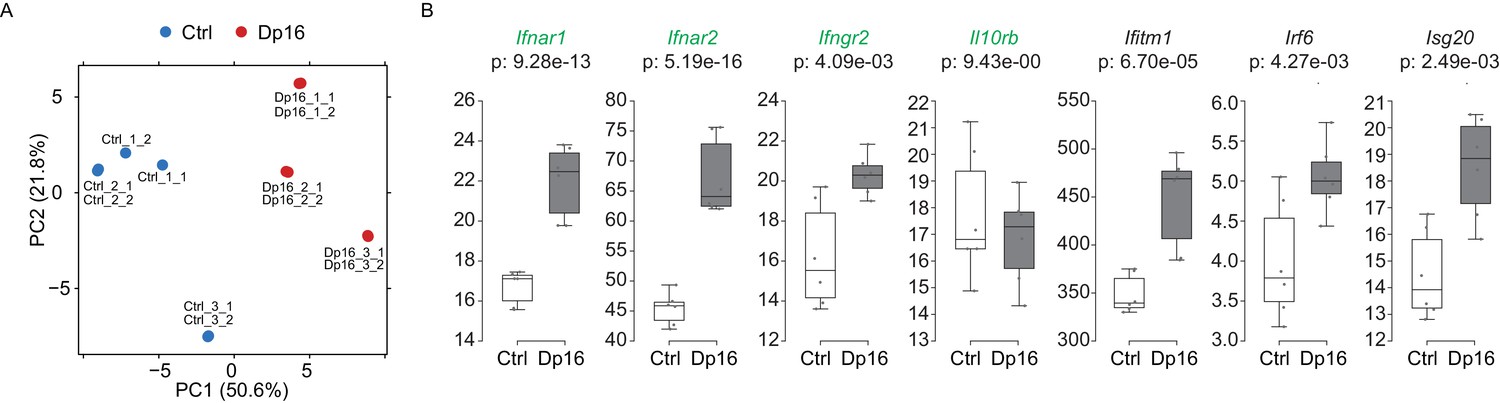
Components of the IFN response are activated in a mouse model of Down syndrome.
(A) Principal component analysis (PCA) of RNA-seq samples produced from lineage negative, Sca1 positive, c-kit positive (LSK) cells from Dp16 mice and matched littermate controls. (B) Box and whisker plots of RNA expression for the four IFN receptor subunits encoded on chr16 (green) and representative IFN-related genes from Dp16 LSK cells. mRNA expression values are displayed in reads per kilobase per million (RPKM). Benjamini-Hochberg adjusted p-values were calculated using DESeq2.
Figure 6 with 3 supplements
IFN signaling is activated in circulating blood cells from individuals with T21.
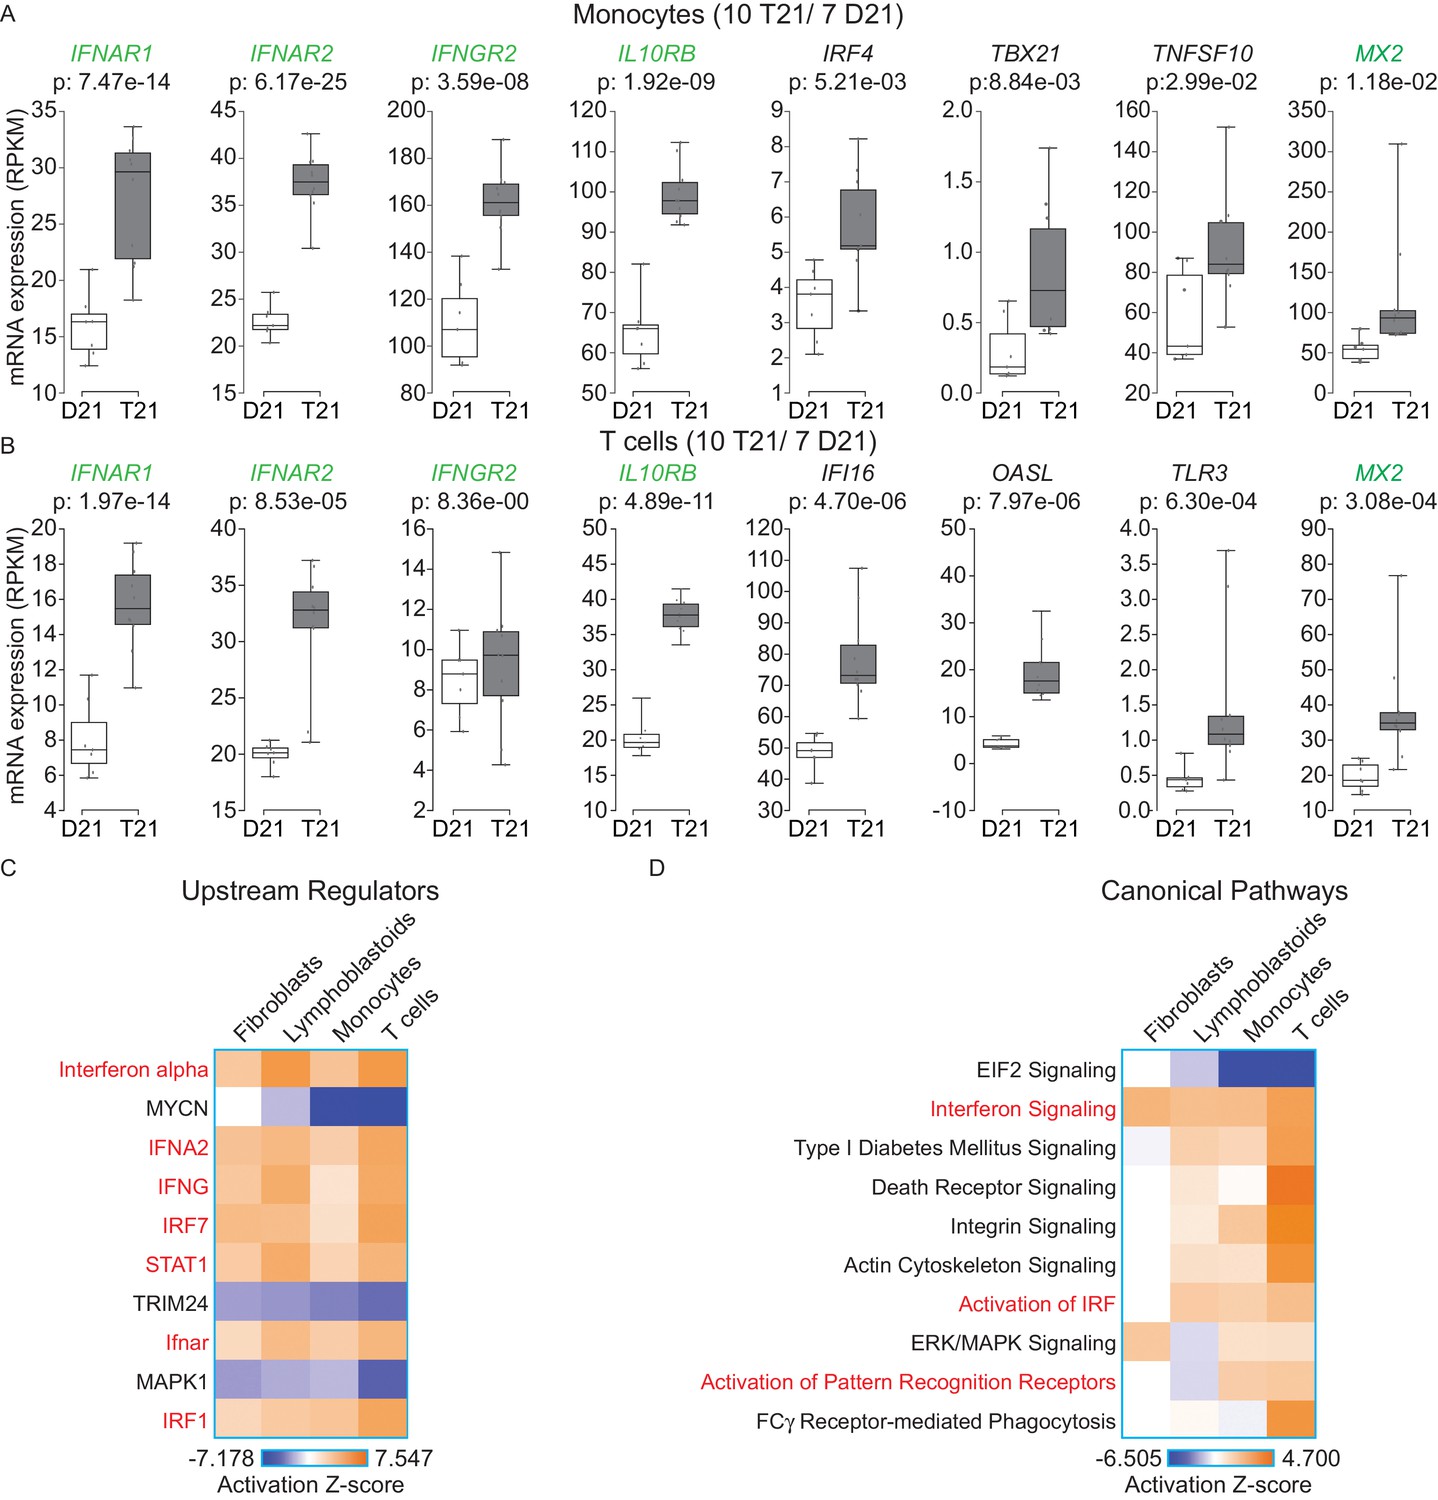
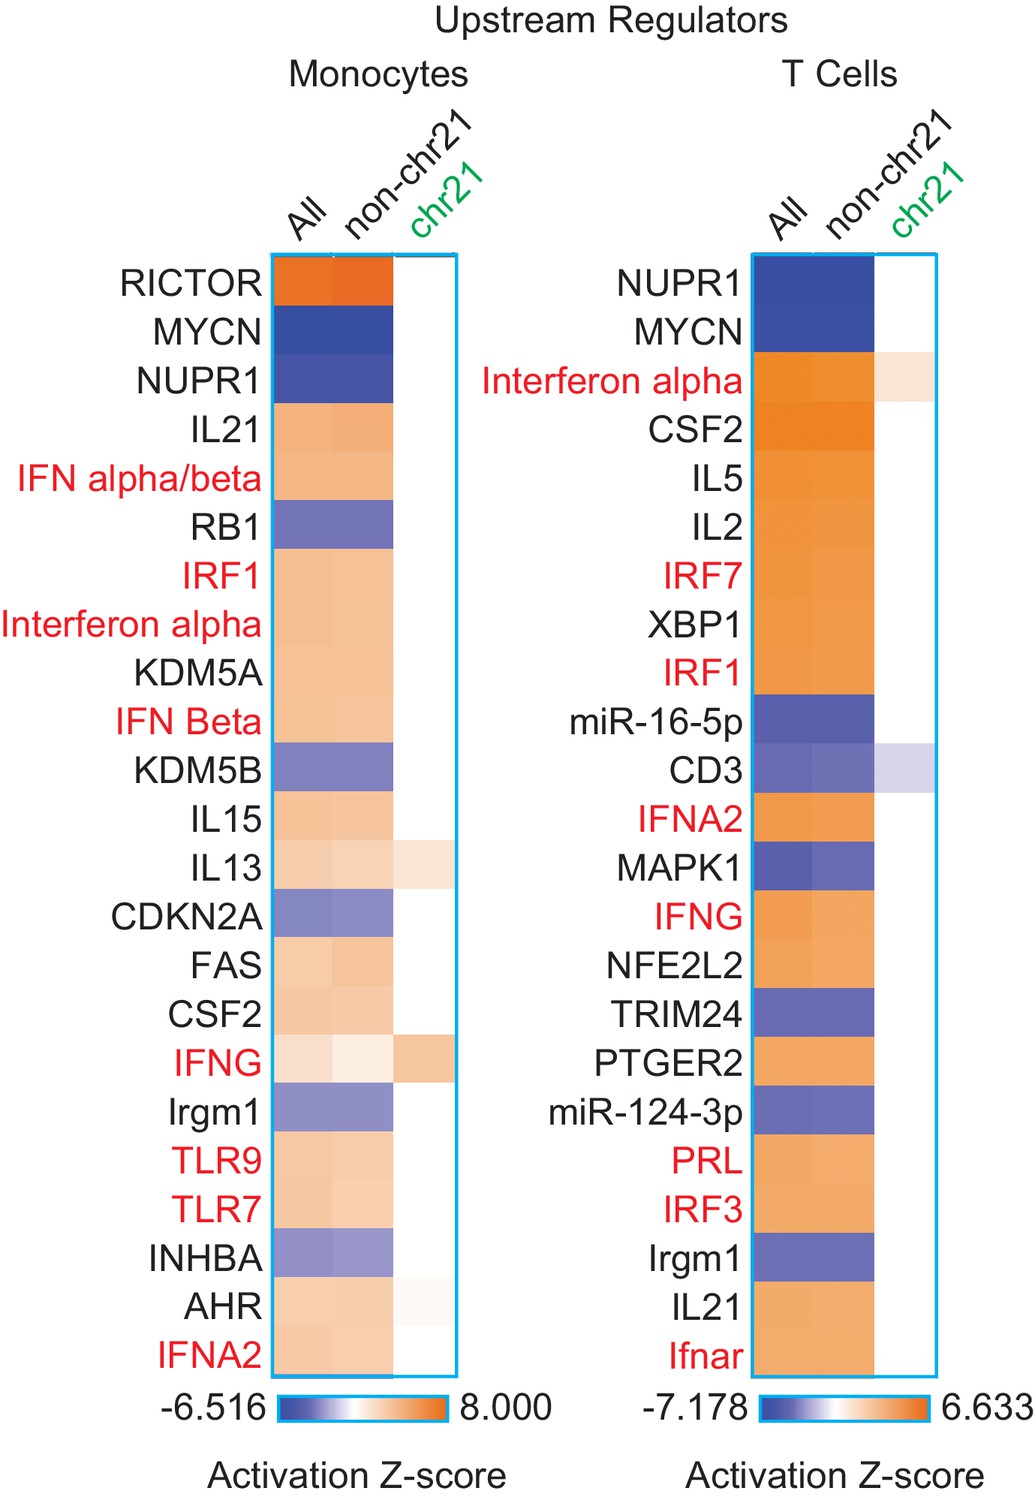
(A) Box and whisker plots of RNA expression for the four IFN receptor subunits encoded on chr21 and representative IFN-related genes in circulating monocytes. mRNA expression values are displayed in reads per kilobase per million (RPKM). Benjamini-Hochberg adjusted p-values were calculated using DESeq2. (B) Box and whisker plots of RNA expression as in (A) for circulating T cells. (C) Upstream regulator analysis reveals activation of the IFN transcriptional response in T21 monocytes and T cells, as well as downregulation of the MYCN-driven transcriptional program. (D) Canonical pathway analysis reveals activation of the IFN signaling pathway in T21 monocytes and T cells, as well as downregulation of the EIF2 signaling pathway.
Figure 6—figure supplement 1

Effects of T21 on the transcriptome of circulating monocytes and T cells from individuals with T21 and typical controls.
(A) Description of samples from individuals with T21 and typical controls used in this study. (B) Principal component analysis (PCA) of monocyte and T cell RNA-seq samples. (C) MA plots displaying the results of RNA-seq analysis for monocytes and T cells. Differentially expressed genes (DEGs), as defined by DEseq2 (FDR < 10%), are labeled in red. (D) Volcano plots of data from monocytes and T cells highlight changes in chr21 gene expression (green) consistent with increased gene dosage effects.
Figure 6—figure supplement 2
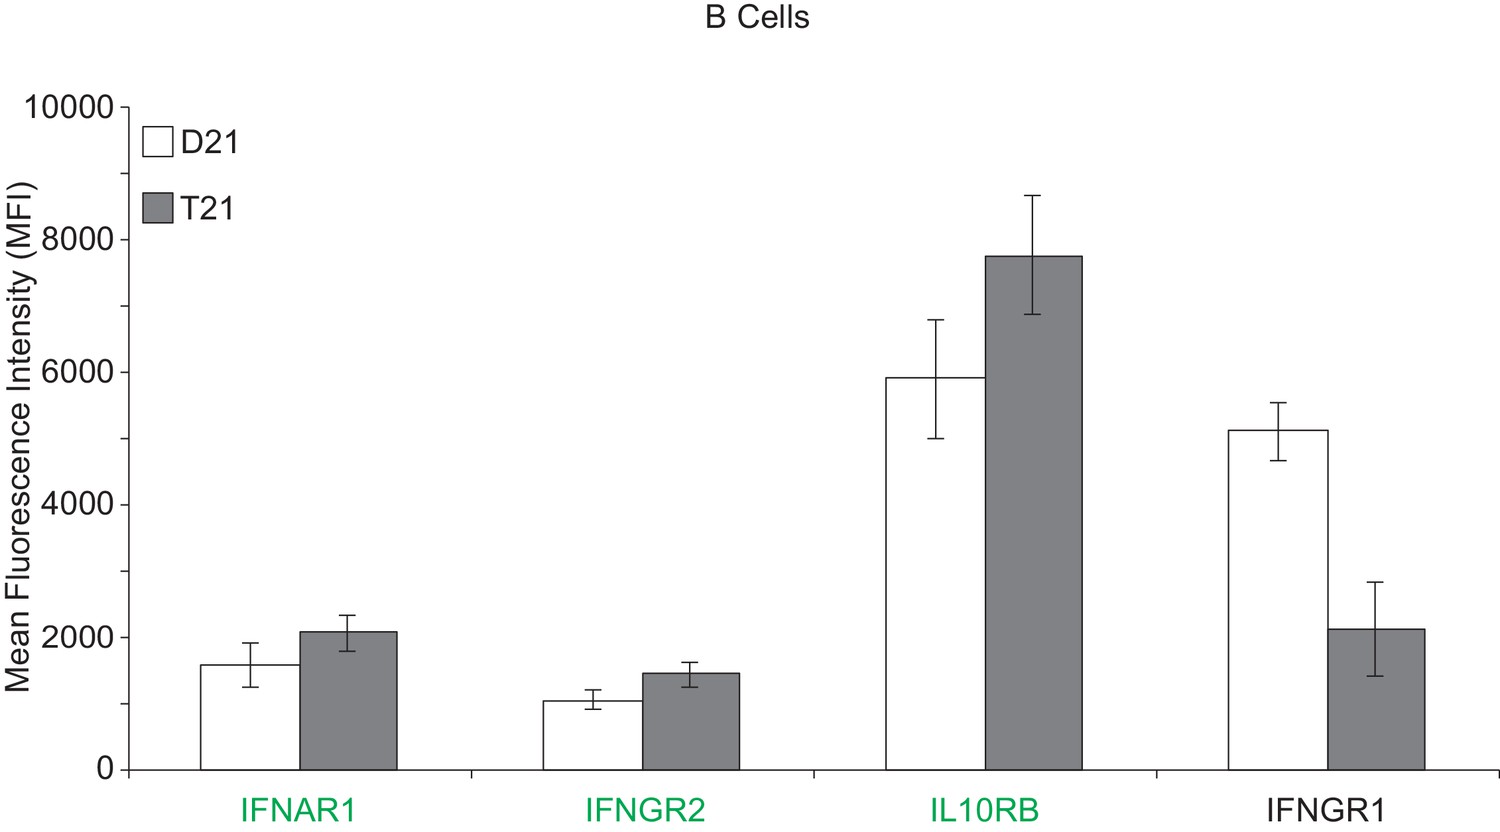
Surface expression of IFN receptors is increased in B cells from individuals with T21.
Flow cytometric analysis of surface expression of three chr21-encoded IFN receptors (in green) and one encoded on another chromosome (IFNGR1) in B cells isolated from the same individuals as monocytes and T cells used in Figure 6.
Figure 6—figure supplement 3
The IFN gene signature from monocytes and T cells is largely encoded by non-chr21 genes.
IPA upstream regulator analysis of all DEGs, non-chr21 DEGs, and chr21 DEGs, for monocytes and T cells.
Figure 7 with 2 supplements
Trisomy 21 globally downregulates the translation machinery in monocytes and T cells.
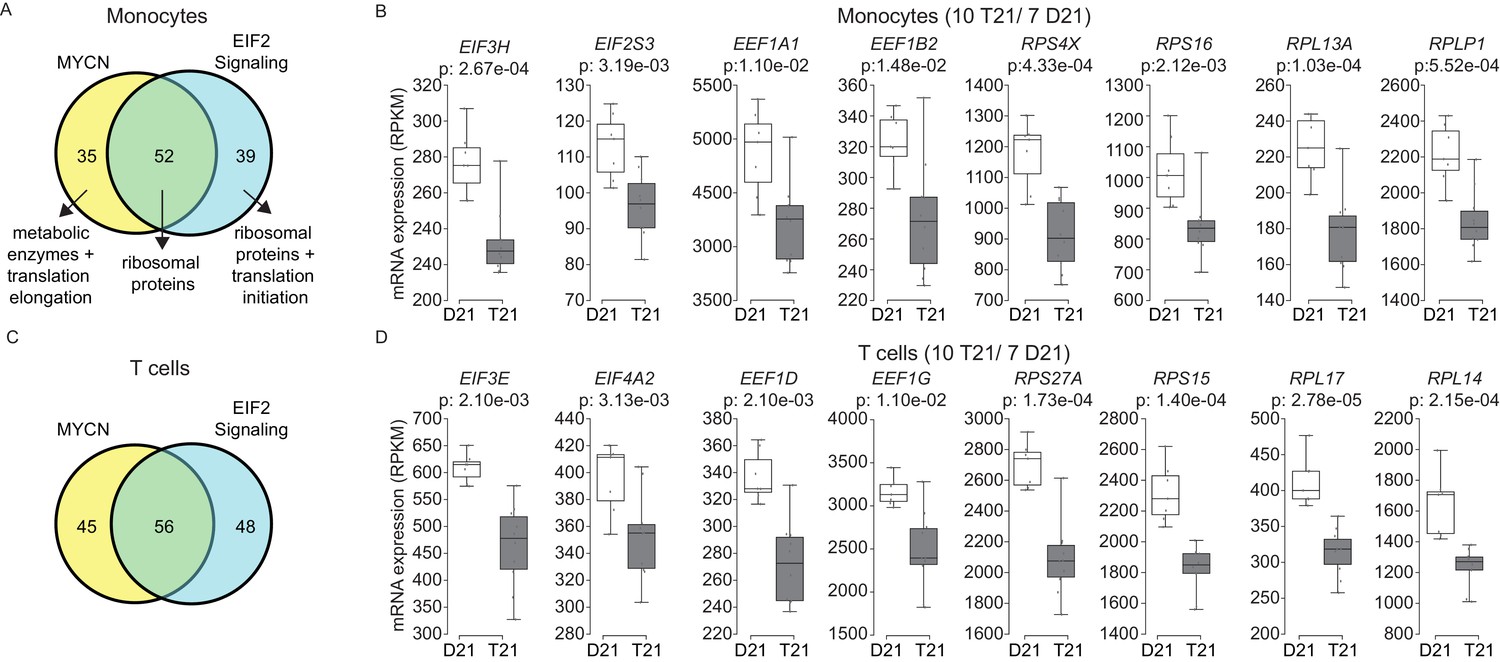
(A) Venn diagram demonstrating the overlap in DEGs comprising the MYCN upstream regulator and EIF2 signaling pathway gene signatures identified by IPA in monocytes. Prominent components of each group are indicated with arrows. See also Figure 7—figure supplement 2. (B) Box and whisker plots of RNA expression for representative translation-related genes from monocytes. mRNA expression values are displayed in reads per kilobase per million (RPKM). Benjamini-Hochberg adjusted p-values were calculated using DESeq2. (C) Venn diagram demonstrating the overlap in DEGs as in (A) for T cells. (D) Box and whisker plots of RNA expression as in (C) for T cells.
Figure 7—figure supplement 1

The MYCN transcriptional program is downregulated by T21.
A heatmap demonstrates downregulation of numerous components of the translational machinery associated with MYCN-driven transcription in monocytes from individuals with T21. The data presented are the fold change of the RPKM of each sample relative to the mean RPKM of all D21 individuals.
Figure 7—figure supplement 2
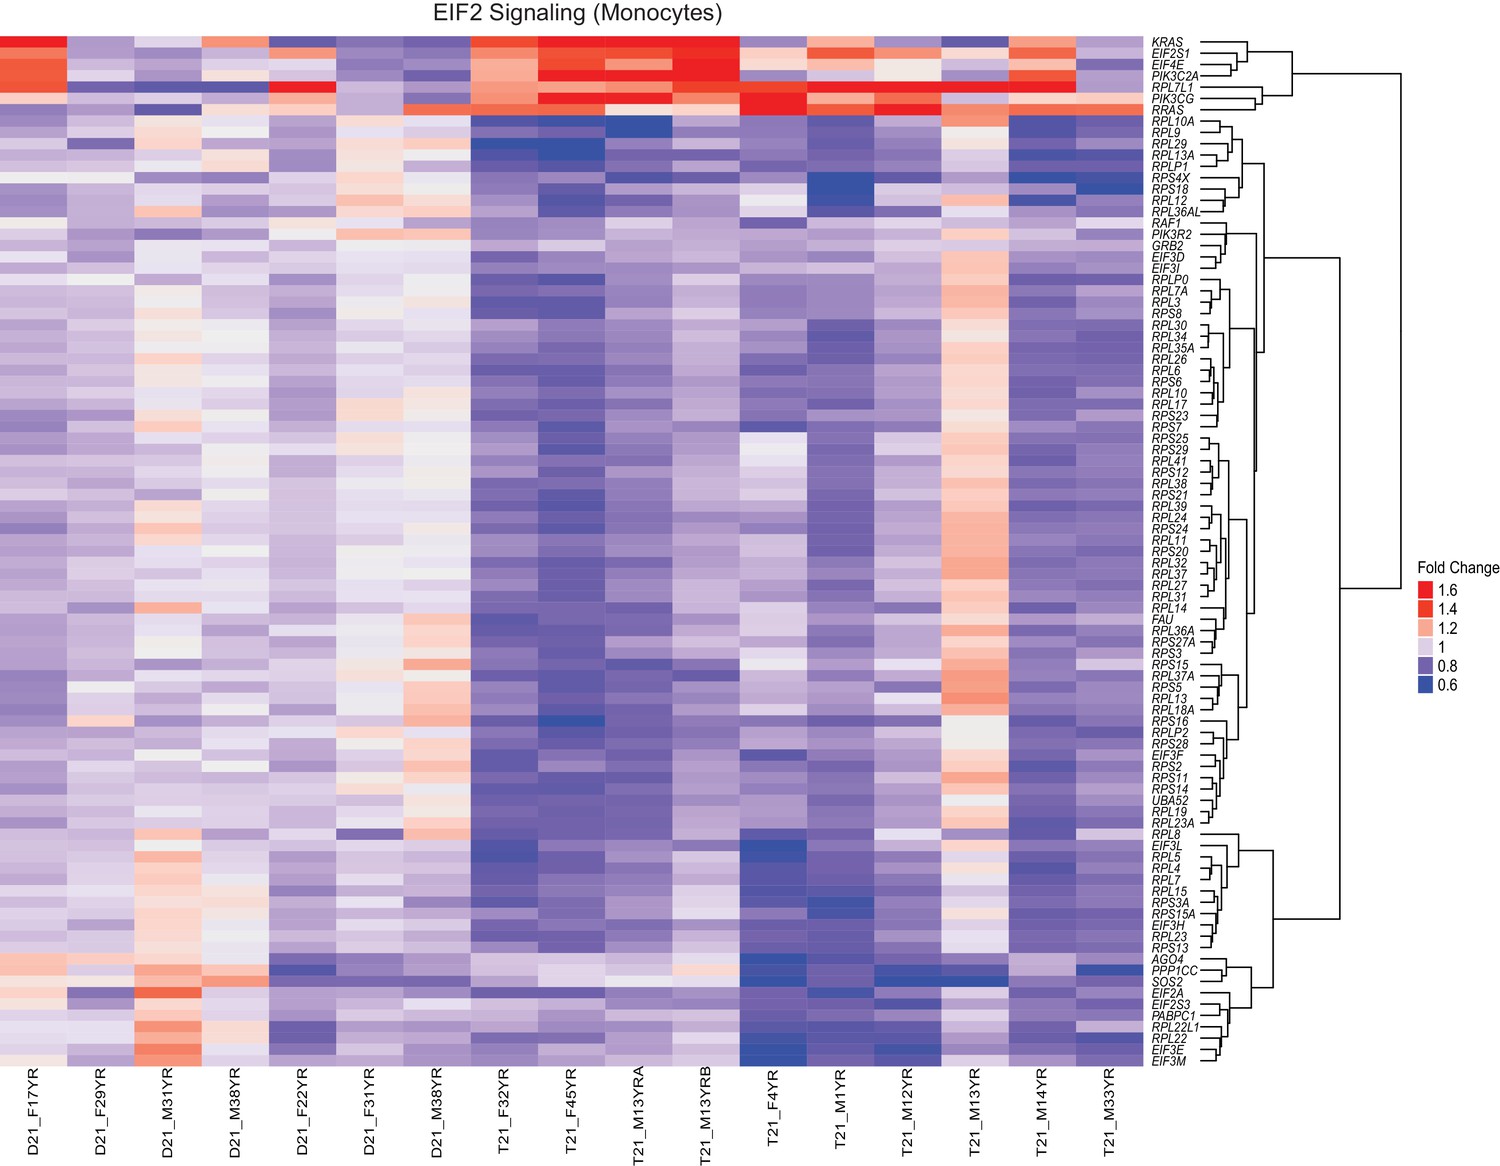
The EIF2 Signaling pathway is downregulated by T21.
A heatmap demonstrates downregulation of numerous components of the translation machinery associated with EIF2 Signaling in monocytes from individuals with T21. The data presented are the fold change of the RPKM of each sample relative to the mean RPKM of all D21 individuals.
Figure 8
Trisomy 21 activates the IFN gene expression program in a cell type-specific manner.
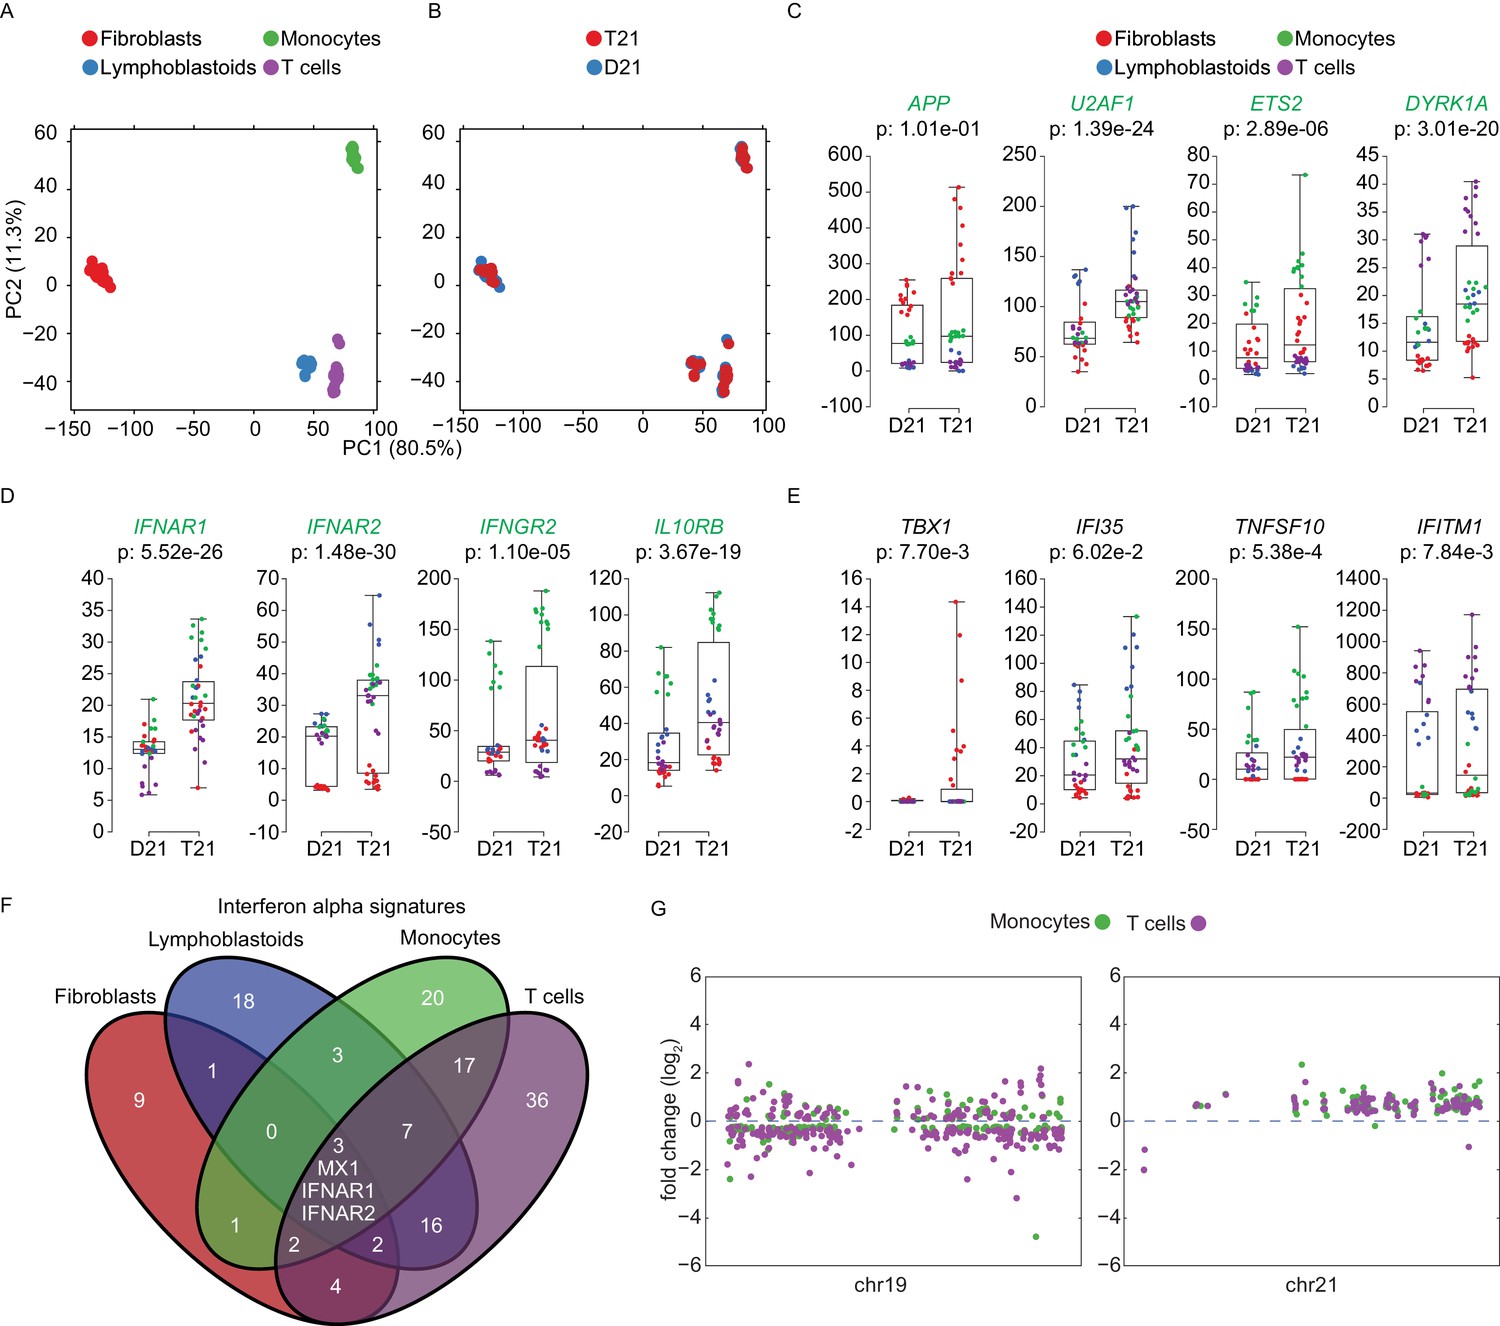
(A) Principal component analysis (PCA) of all RNA-seq samples from this study colored by cell type. (B) PCA analysis as in (A) colored by chr21 copy number. (C) Box and whisker plots of RNA expression for representative chr21-encoded genes from all samples. mRNA expression values are displayed in reads per kilobase per million (RPKM). Benjamini-Hochberg adjusted p-values were calculated using DESeq2 by comparing all T21 samples to all D21 samples. Individual data points are colored by cell type. (D,E) Box and whisker plots as in (C) for chr21-encoded IFN receptors and representative ISGs. (F) Venn diagram showing the cell type-specificity of the Interferon alpha gene expression programs identified by IPA for each cell type. (G) Manhattan plots for chromosomes 19 and 21 comparing the DEGs from monocytes and T cells derived from the same individuals.
Additional files
-
Supplementary file 1
(A) Fibroblast, (B) lymphoblastoid, (C) Dp16, (D) monocyte, (E) T cell and (F) meta RNA-seq.
DESeq2 analysis of T21 versus D21 fibroblasts. Columns include: (A) Chromosome, (B) Gene start coordinate, (C) Gene end coordinate, (D) Gene strand, (E) Gene name, (F) basemean (average read count across all samples), (G) basemeanD21 (average read count across all D21 samples), (H) basemeanT21 (average read count across all T21 samples), (I) foldChange (basemeanT21/basemeanD21), (J) log2FoldChange, (K) foldChange_adj (DESeq2 adjusted fold change), (L) log2FoldChange_adj, (M) pval (p-value), (N) padj (Benjamini-Hochberg adjusted p-value).
- https://doi.org/10.7554/eLife.16220.024
-
Supplementary file 2
Fibroblast kinome shRNA screen analysis.
DESeq2 analysis of kinome shRNA screens in T21 versus D21 fibroblasts. Columns include: (A) TRC number (B) shRNA targeting location (C) Chromosome, (D) Genomic coordinates, (E) Gene strand, (F) Gene name, (G) RefSeq ID (H) basemean (average read count across all samples), (I) basemeanD21 (average read count across all D21 samples), (J) basemeanT21 (average read count across all T21 samples), (K) foldChange (basemeanT21/basemeanD21), (L) log2FoldChange, (M) foldChange_adj (DESeq2 adjusted fold change), (N) log2FoldChange_adj, (O) pval (p-value), (P) padj (Benjamini-Hochberg adjusted p-value).
- https://doi.org/10.7554/eLife.16220.025
-
Supplementary file 3
Fibroblast SOMAscan analysis.
QPROT analysis of T21 versus D21 fibroblasts. Columns include: (A) Chromosome, (B) Gene start coordinate, (C) Gene end coordinate, (D) Gene strand, (E) Gene name, (F) RFUmean (average RFU across all samples), (G) RFUmeanD21 (average RFU across all D21 samples), (H) RFUmeanT21 (average RFU across all T21samples), (I) foldChange (RFUmeanT21/RFUmeanD21), (J) log2FoldChange, (K) Zstatistic (Z-score from QPROT), (L) FDRup (FDR of upregulated proteins), (M) FDRdown (FDR of downregulated proteins).
- https://doi.org/10.7554/eLife.16220.026
Download links
A two-part list of links to download the article, or parts of the article, in various formats.
Downloads (link to download the article as PDF)
Open citations (links to open the citations from this article in various online reference manager services)
Cite this article (links to download the citations from this article in formats compatible with various reference manager tools)
Trisomy 21 consistently activates the interferon response
eLife 5:e16220.
https://doi.org/10.7554/eLife.16220


