53BP1 and USP28 mediate p53-dependent cell cycle arrest in response to centrosome loss and prolonged mitosis
- Memorial Sloan Kettering Cancer Center, United States
- Oberlin College, United States
- Weill Cornell Medical School, United States
Figures
Figure 1 with 2 supplements
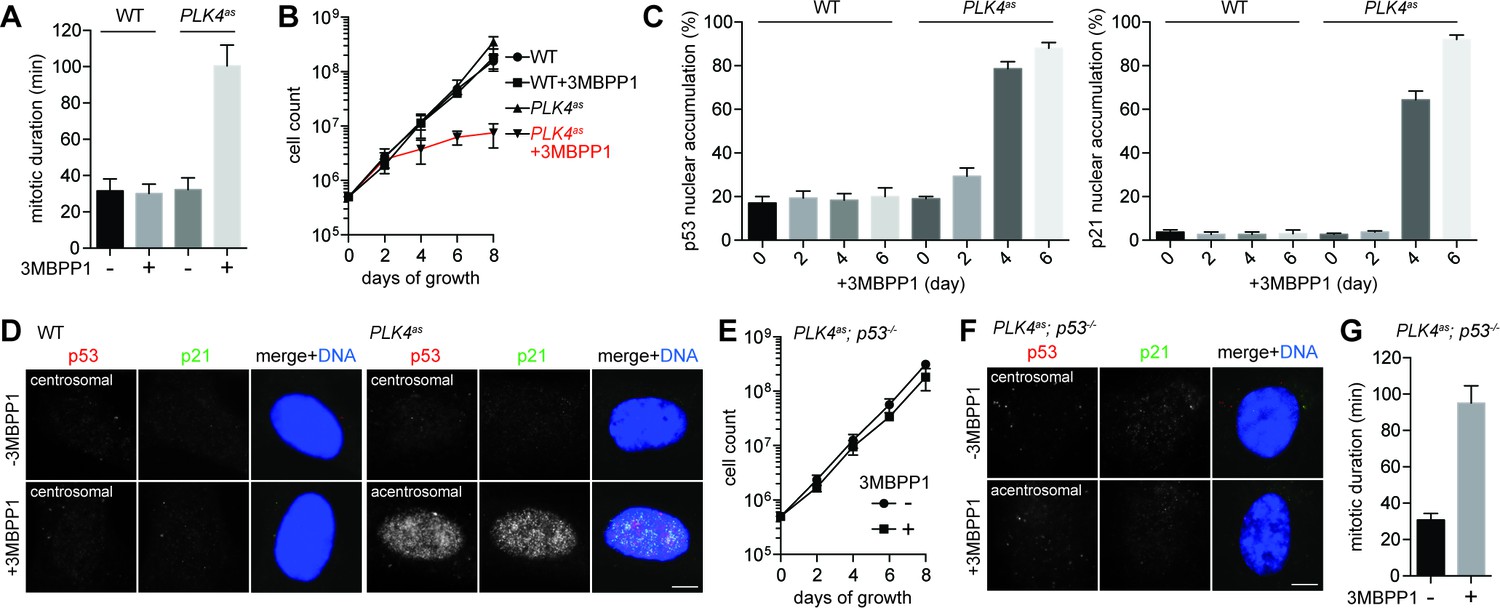
Genome-wide CRISPR-mediated loss-of-function screen for components required for centrosome loss-induced G1 arrest.
(A) Acentrosomal cells exhibits prolonged mitosis. Measurement of mitotic duration of wild type RPE1 and PLK4as cells dividing in the presence or absence of 3MBPP1 with live-cell imaging. With 3MBPP1 treatment, cells gradually lost centrosomes and ceased to proliferate; the duration of acentrosomal mitosis was measured four days after 3MBPP1 addition. Data are means ± SD. n>30, N = 3. (B) Cell proliferation ceases in acentrosomal cells. Growth curve of wild type RPE1 and PLK4as cells with or without 3MBPP1 treatment. Data are means ± SD. n>50, N = 3. (C) p53 and p21 accumulate in the nucleus of acentrosomal cells. Quantification of p53 (left) and p21 (right) nuclear accumulation in wild type RPE1 and PLK4as cells after 3MBPP1 addition. Data are means ± SD. n>100, N = 3. (D) Representative immunofluorescence images of cells in (C) on day 6 stained with antibodies against p53 and p21. Scale bar, 5 μm. (E) Acentrosomal cells continue to proliferate when p53 is removed. The growth curve of PLK4as; p53-/- cells following 3MBPP1 addition. Refer to (B) for growth curves of PLK4ascells. Data are means ± SD. n>50, N = 3. (F) p21 does not accumulate in PLK4as; p53-/- cells during acentrosomal cell division. Immunofluorescence images of cells stained with the antibodies indicated. Scale bar, 5 μm. (G) PLK4as; p53-/- cells divide by prolonged mitosis in the absence of the centrosome. Graph showing mitotic duration of centrosomal and acentrosomal PLK4as; p53-/- cells measured with live-cell imaging. Data are means ± SD. n>30, N = 3.
Figure 1—figure supplement 1
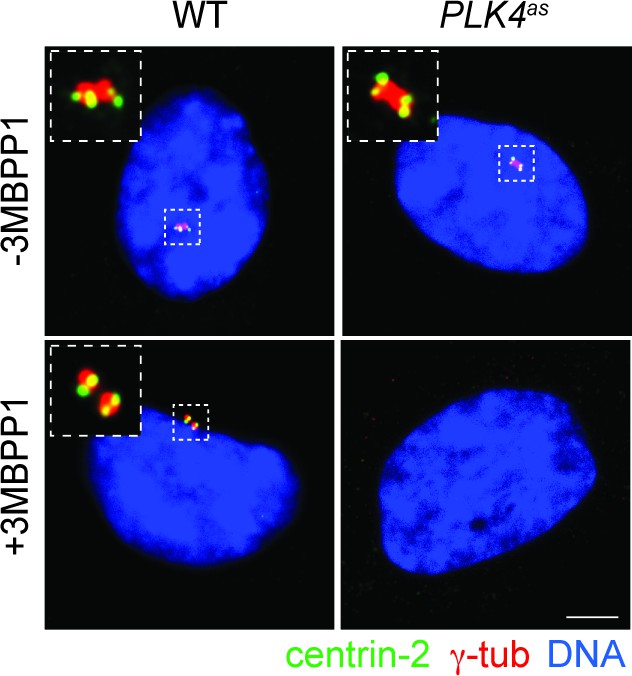
Centrosome loss upon PLK4 inactivation.
Wild type RPE1 and PLK4as cell line treated with 3MBPP1 for seven days stained with antibodies against centrin-2 and γ-tub to mark centrosomes. Scale bar, 5 μm.
Figure 1—figure supplement 2
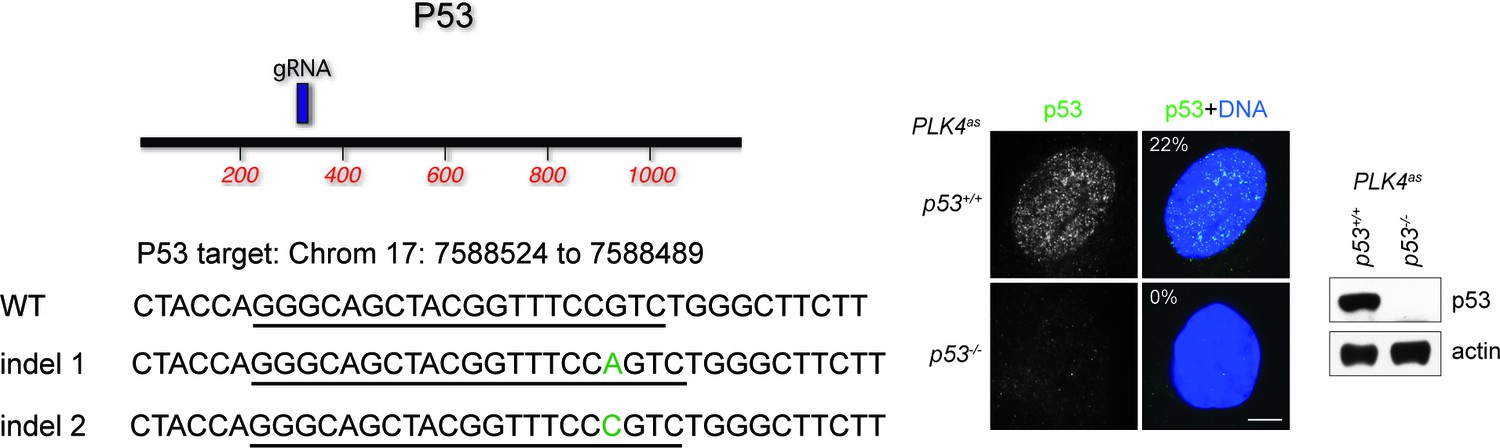
Genotyping of p53 CRISPR cell line.
Positions of sgRNA target site within the ORF of the p53 gene is depicted in the map. Descriptions of mutant indels are depicted below. Green colored nucleotides are insertions. sgRNA target site is underlined. All indels are frameshift mutations that lead to a premature stop codon. Immunofluorescence images of wild type and CRISPR cell line stained with p53 antibody are shown to the right. The percentage in the merged panel indicates the proportion of cells with positive staining of p53. Also shown to the right is a western blot of p53 levels in wild type and p53 CRISPR cell line. Scale bar, 5 μm.
Figure 2 with 2 supplements
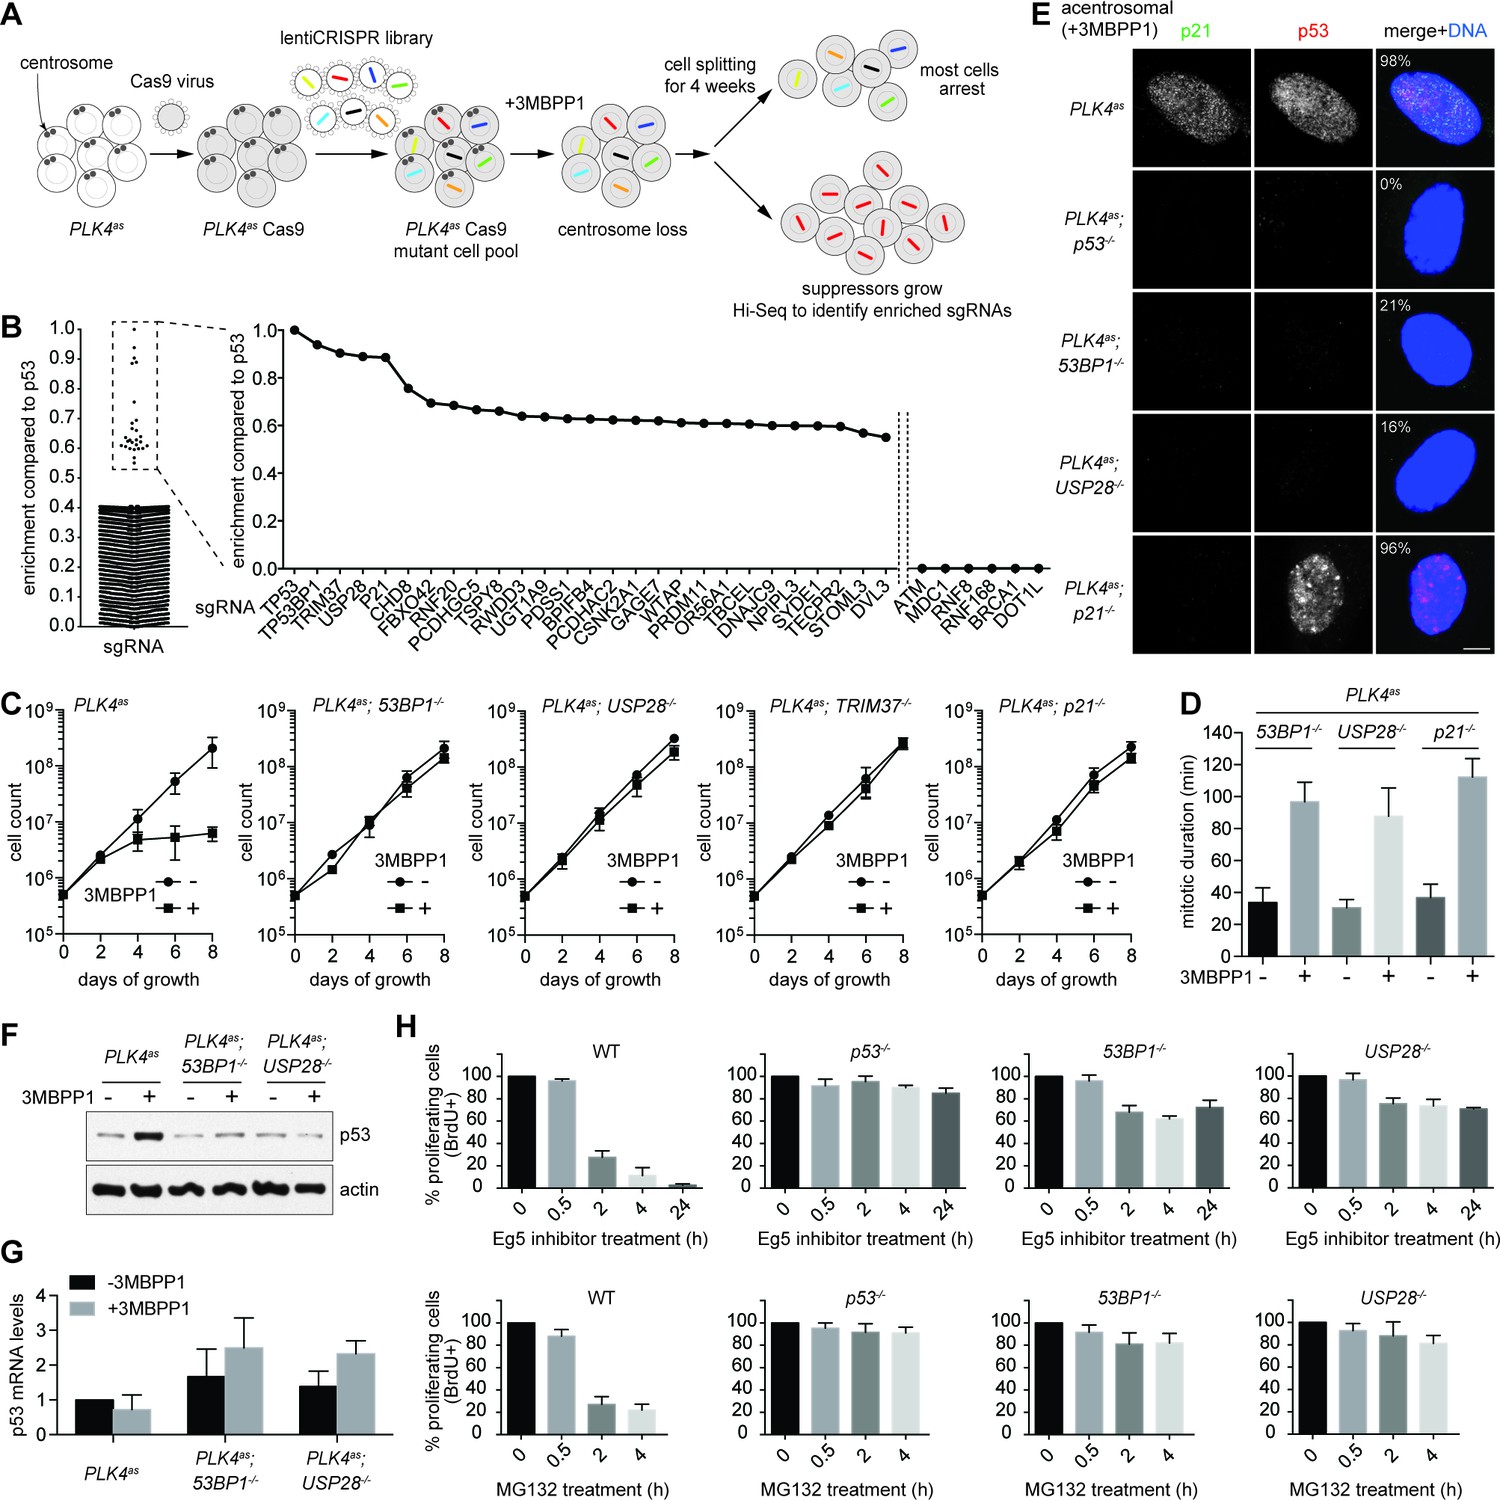
53BP1 and USP28 are broad acting components acting upstream of p53 in response to mitotic stress.
(A) Schematic representation of the loss-of-function screen for components required for centrosome loss induced G1 arrest using the human genome-scale CRISPR knockout library (GeCKO). (B) Binary logarithm of sgRNA enrichment for genes potentially involving in centrosome loss induced G1 arrest, normalized to the top scoring hit p53. The HiSeq data was collected from eight independent screens. A candidate gene must be hit repeatedly with high scores (HiSeq reads) by two or more of its six sgRNAs in independent screens. Interesting negative hits were also shown, including critical DDR components whose sgRNAs were not enriched but detected only in the baseline reads. (C) Validation of top five scoring hits from the screen other than the p53 control. The results shown here used clonal 53BP1-/-, USP28-/-, and p21-/- CRISPR knockout cell lines derived from PLK4as knock-in cells (PLK4as-KI) obtained from A. Holland (Moyer et al., 2015) (see Materials and methods). The growth curve of the indicated individual CRISPR cell lines in the presence or absence of 3MBPP1 was shown. Data are means ± SD. n>50, N = 3. (D) Acentrosomal 53BP1-/-, USP28-/- and p21-/- cells proliferate in the presence of mitotic delay. Graph showing mitotic duration of the indicated CRISPR cell lines dividing with or without centrosomes measured with live-cell imaging. Data are means ± SD. n>30, N = 3. (E) 53BP1 and USP28 function upstream of p53 to activate G1 arrest. Immunofluorescence images of CRISPR cell lines grown in 3MBPP1 stained with the indicated antibodies. The percentage in the merged panel indicates the proportion of cells with p53 nuclear accumulation. Scale bar, 5 μm. (F) Total p53 levels are not elevated in acentrosomal 53BP1-/-, USP28-/- cells. Immunoblot for p53 protein of the indicated cell lines grown in the presence or absence of 3MBPP1 for seven days. (G) p53 protein elevation during centrosome loss-induced G1 arrest is not due to increased p53 transcription. Quantification of p53 mRNA levels relative to GAPDH in (F) by qRT-PCR. Data are means ± SD. n = 6 from two independent experiments. (H) 53BP1-/-, USP28-/- cells do not arrest in G1 despite experiencing mitotic stresses induced by different drug treatments. BrdU incorporation assay for 24 hr showing proportion of proliferating cells in the indicated CRISRP cell lines following release into mitosis with different duration of Eg5 inhibitor (top panels) and MG132 (bottom panels) treatment and washout. Percentages are normalized to the untreated control. Data are means ± SD. n>250, N = 3.
Figure 2—figure supplement 1
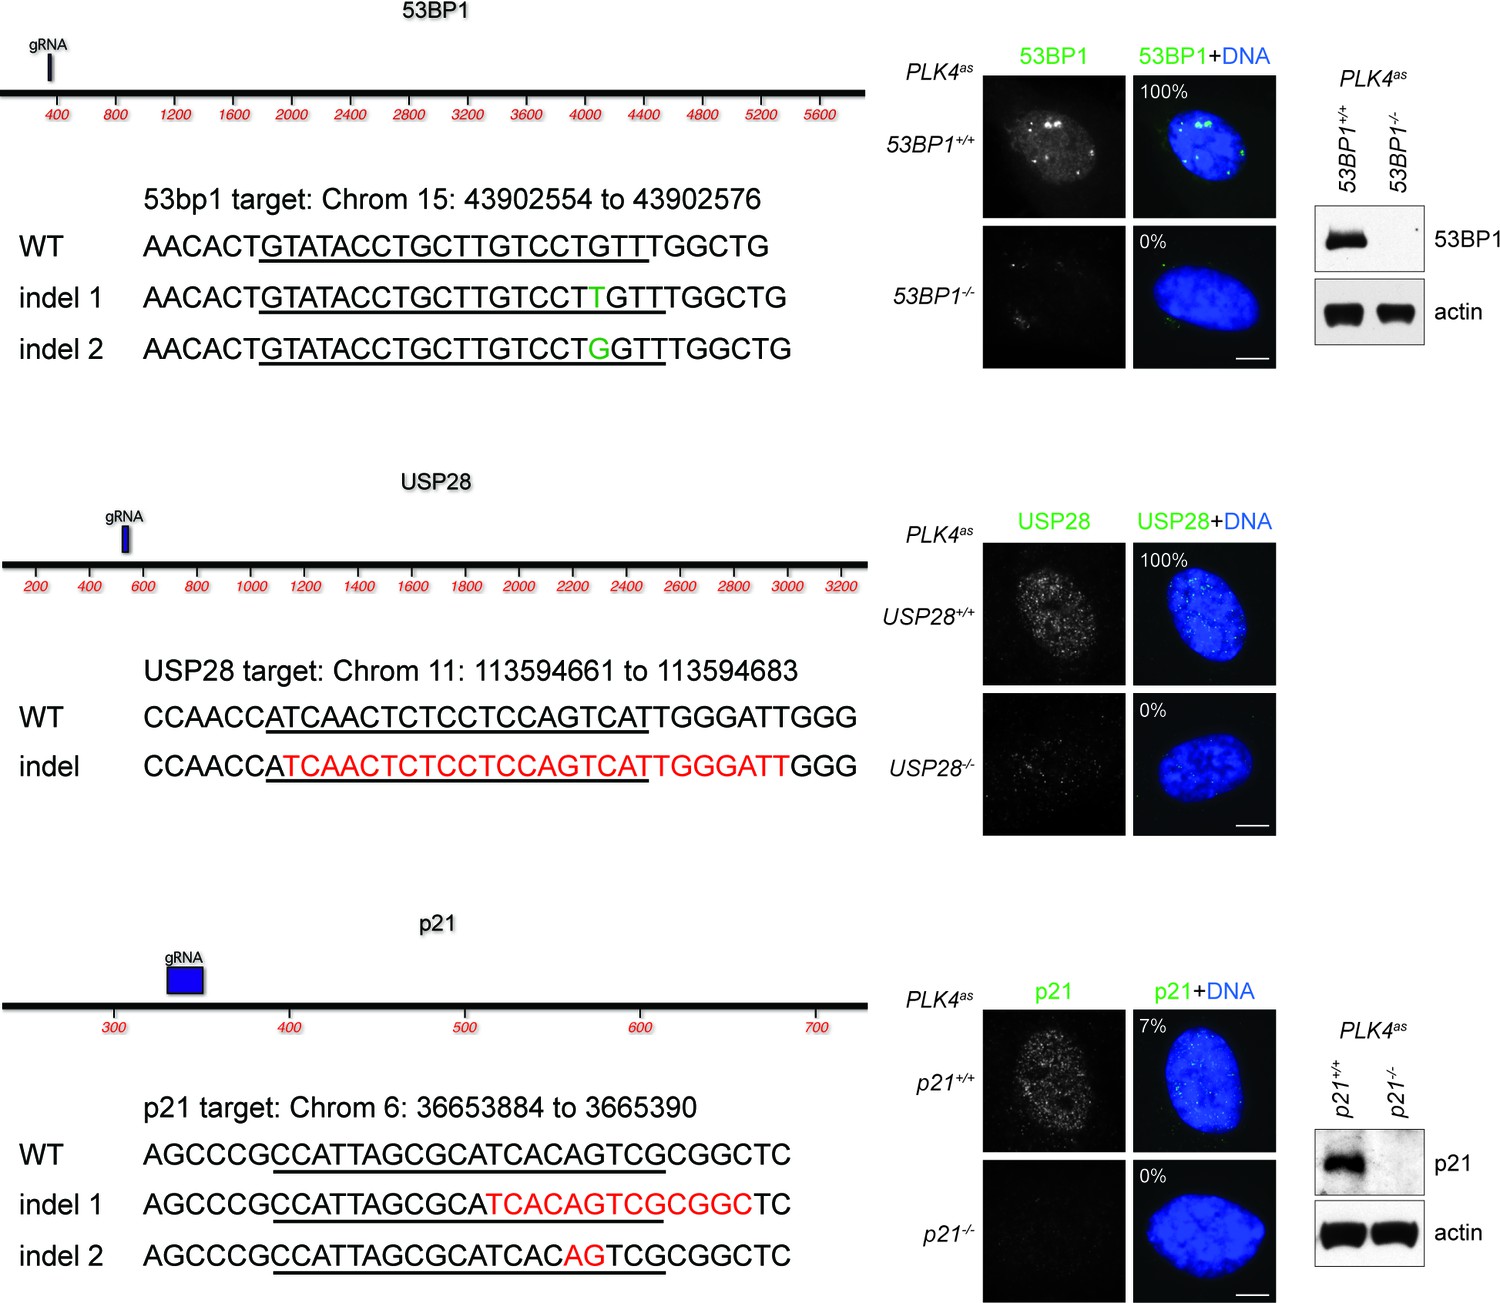
Genotyping of CRISPR cell lines.
Positions of sgRNA target sites within the ORF of each gene are depicted on maps. Descriptions of mutant indels are depicted below. Red colored bases represent deleted nucleotides. Green colored nucleotides are insertions. sgRNA target sites are underlined. All indels are frameshift mutations that lead to a premature stop codon. Immunofluorescence images of wild type and CRISPR cell lines stained with antibodies indicated are shown to the right. The percentage in the merged panel indicates the proportion of cells with positive staining of the respective antibodies. Also shown to the right are western blots of the indicated proteins in wild type and CRISPR cell lines. The endogenous level of USP28 in RPE1 cells is too low to be detected by western blot (can be detected when overexpressed, not shown), and can only be seen by immunofluorescence. Scale bar, 5 μm.
Figure 2—figure supplement 2
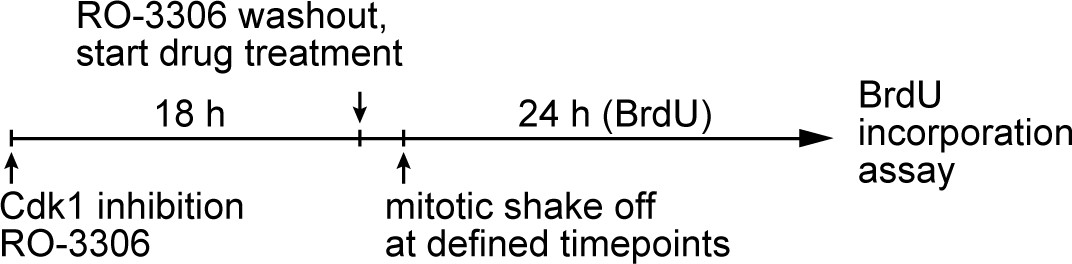
Schematic outlining the timeline of synchronization and drug treatments used.
BrdU incorporation assay for Figure 2H.
Figure 3 with 3 supplements
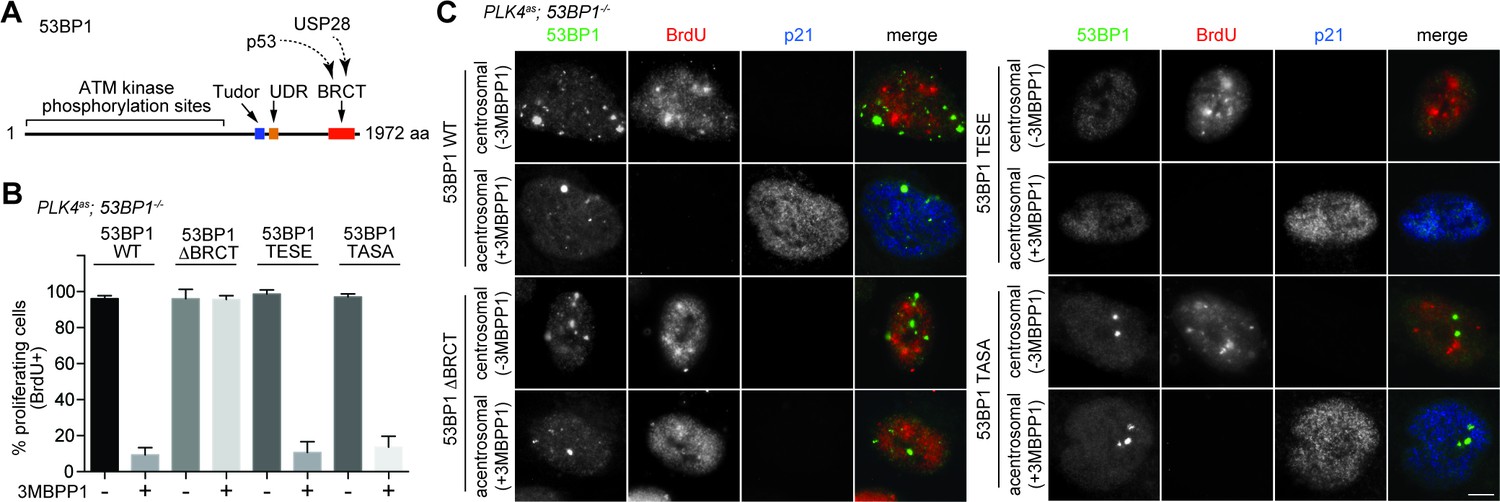
53BP1 mediates centrosome loss-induced G1 arrest independently to its DNA repair activity.
(A) Domain organization of 53BP1. BRCT (BRCA1 carboxy-terminal), UDR (ubiquitylation-dependent recruitment). p53 and USP28 interact with 53BP1 through the tandem BRCT domain. (B) 53BP1ΔBRCT mutant does not rescue the G1 arrest in PLK4as; 53BP1-/- cells after centrosome removal. Wild-type or indicated mutant 53BP1 were mildly expressed under the tetracycline inducible promoter in stable, clonal, centrosomal PLK4as; 53BP1-/- cells (see Materials and methods), during which centrosome loss was induced by 3MBPP1 addition. BrdU was added on day six after 3MBPP1 addition and cells were harvested 24 hr later for BrdU incorporation assay (3MBPP1 treatment for seven days in total). Data are means ± SD. n>150, N = 3. (C) Representative immunofluorescence images of cells in (B) stained with the indicated antibodies seven days after 3MBPP1 treatment. 53BP1 was stained with anti-GFP FITC conjugated antibody. Scale bar, 5 μm.
Figure 3—figure supplement 1
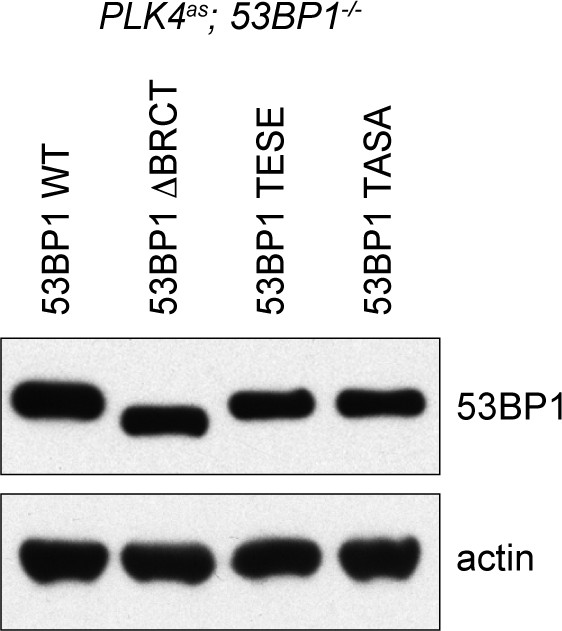
Wild type and mutant 53BP1 are exogenously expressed to similar levels in PLK4as; 53BP1-/- cells.
Western blot of PLK4as; 53BP1-/- cells mildly expressing (10 ng/ml doxycycline) wild type and mutant 53BP1.
Figure 3—figure supplement 2
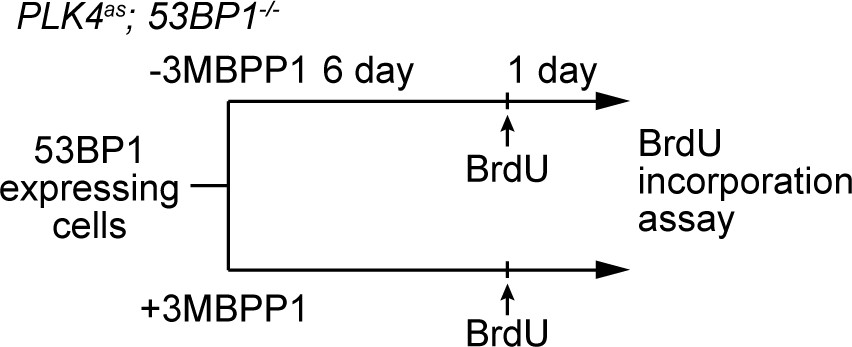
Schematic outlining the timeline of drug treatments used.
BrdU incorporation assay for Figure 3B.
Figure 3—figure supplement 3

DDR function is intact in 53BP1WT, 53BP1ΔBRCT and 53BP1TASA, but not in 53BP1TESE.
53BP1TESE delocalizes from the DNA damage sites marked by γ-H2AX. Mutant proteins of 53BP1 were mildly expressed under the tetracycline inducible promoter in stable, clonal, centrosomal PLK4as; 53BP1-/- cells, and stained with the indicated antibodies. 53BP1 was stained with anti-GFP FITC conjugated antibody. Scale bar, 5 μm.
Figure 4 with 2 supplements

USP28 is catalytically required for p53 stabilization during centrosome loss-induced G1 arrest.
(A) Organization of the conserved catalytic domains in USP28. UCH-1 (Cys box, amino acids 162–196) and UCH-2 (His box, amino acids 580–649). (B) Catalytic-inactive USP28CI cannot rescue the G1 arrest in PLK4as; USP28-/- cells after centrosome removal. Wild type UPS8 or USP28CI was mildly expressed under the tetracycline inducible promoter in stable, clonal, centrosomal PLK4as; USP28-/- cells (see Materials and methods) during which centrosome loss was induced by 3MBPP1 addition. BrdU was added on day six after 3MBPP1 addition and cells were harvested 24 hr later for BrdU incorporation assay (3MBPP1 treatment for seven days in total). Data are means ± SD. n>150, N = 3. (C) Representative immunofluorescence images of cells in (B) stained with the indicated antibodies seven days after 3MBPP1 treatment. USP28 was stained with anti-HA antibody. Scale bar, 5 μm. (D) USP28 deubiquitinates p53 in vitro. Immunoblot of ubiquitinated p53 incubated with or without USP28 in an in vitro deubiquitination assay (see Materials and methods). Note the reduction in the polyubiquitinated form of p53 in the presence of USP28. (E) High levels of USP28 can ectopically stabilize nuclear p53 in the absence of mitotic stress. Immunofluorescence images of cells stained with the indicated antibodies. Expression of wild type USP28 or USP28CI was induced in PLK4as; USP28-/- cells with 10 ng/μl (low level expression) or 100 ng/μl (overexpression) of doxycycline for two days before cell fixing and staining. The percentage in the merged panel indicates the proportion of cells with p53 nuclear accumulation. Scale bar, 5 μm. (F) Nuclear p53 accumulation caused by USP28WT overexpression is not due to increased p53 transcription. Quantification of p53 mRNA levels relative to GAPDH in (E) by qRT-PCR. Data are means ± SD. n = 6 from two independent experiments. (G) USP28 ectopically stabilizes nuclear p53 independently of 53BP1. Immunofluorescence images of cells stained with the indicated antibodies. Wild type USP28 was induced in PLK4as; 53BP1-/- cells with 10 ng/μl (low level expression) or 100 ng/μl (overexpression) of doxycycline for two days. The percentage in the merged panel indicates the proportion of cells with p53 nuclear accumulation. Scale bar, 5 μm. (H) Overexpression of 53BP1 can ectopically stabilize nuclear p53 in the absence of mitotic stress. Immunofluorescence images of cells stained with the indicated antibodies. Expression of wild type 53BP1 or 53BP1ΔBRCT was induced in PLK4as; 53BP1-/- cells with 10 ng/μl (low level expression) or 1 μg/μl (overexpression) of doxycycline for two days before cell fixing and staining. The percentage in the merged panel indicates the proportion of cells with p53 nuclear accumulation. Scale bar, 5 μm. (I) Ectopic stabilization of nuclear p53 by 53BP1 requires USP28. Immunofluorescence images of cells stained with the indicated antibodies. Wild type 53BP1 was induced in PLK4as; USP28-/- cells with 10 ng/μl (low level expression) or 1 μg/μl (overexpression) of doxycycline for two days. The percentage in the merged panel indicates the proportion of cells with p53 nuclear accumulation. Scale bar, 5 μm.
Figure 4—figure supplement 1
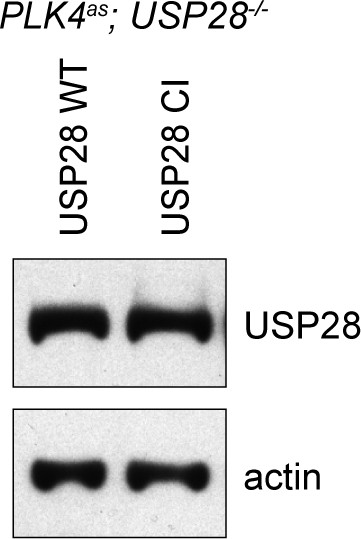
USP28WT and USP28CI are exogenously expressed to similar levels in PLK4as; USP28-/- cells.
Western blot of PLK4as; USP28-/- cells mildly expressing (10 ng/ml doxycycline) USP28WT and USP28CI. USP28 was probed with anti-HA antibody.
Figure 4—figure supplement 2
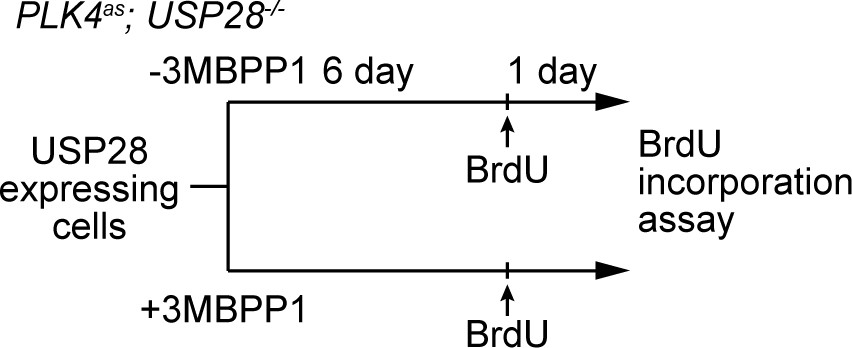
Schematic outlining the timeline of drug treatments used.
BrdU incorporation assay for Figure 4B.
Figure 5 with 2 supplements
SAC activation is not essential for mitotic stress-induced G1 arrest.
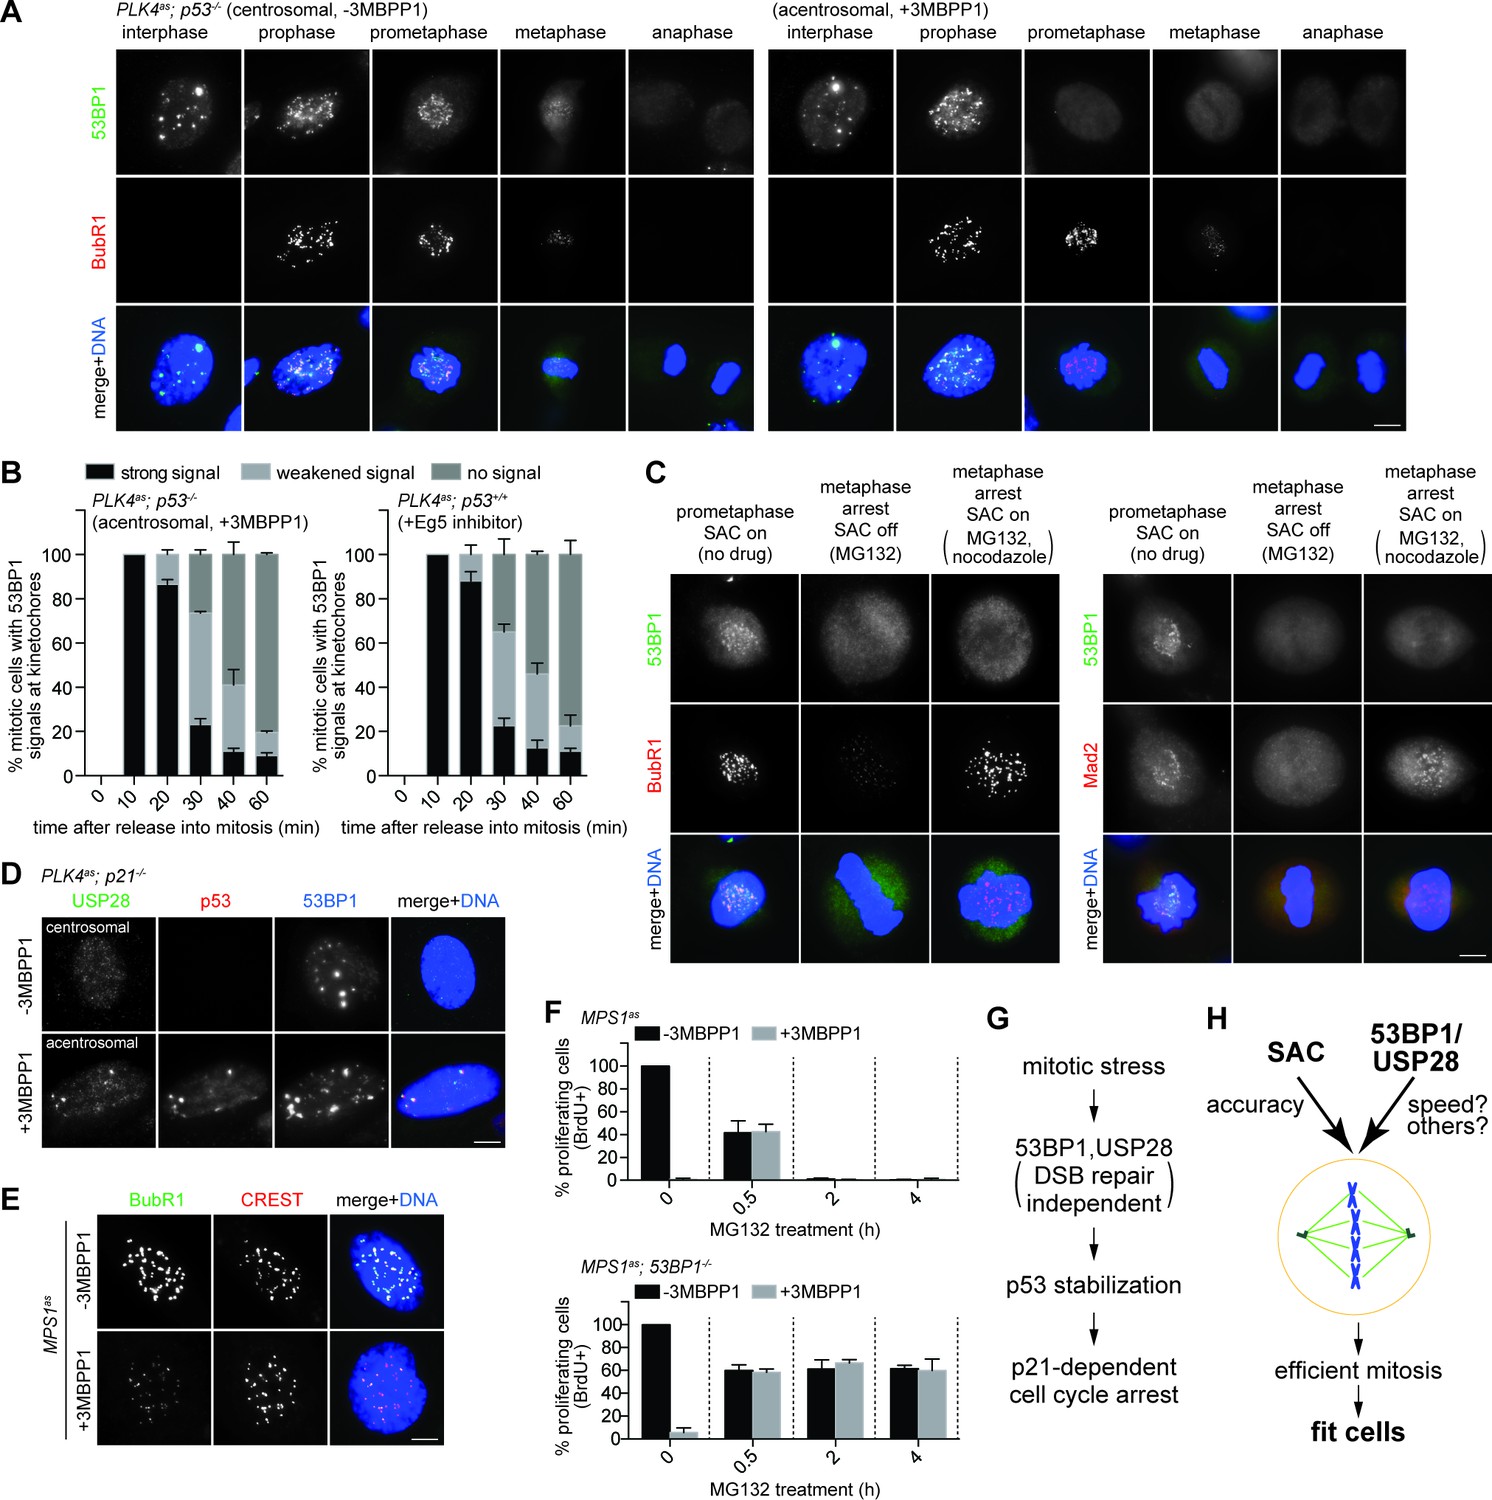
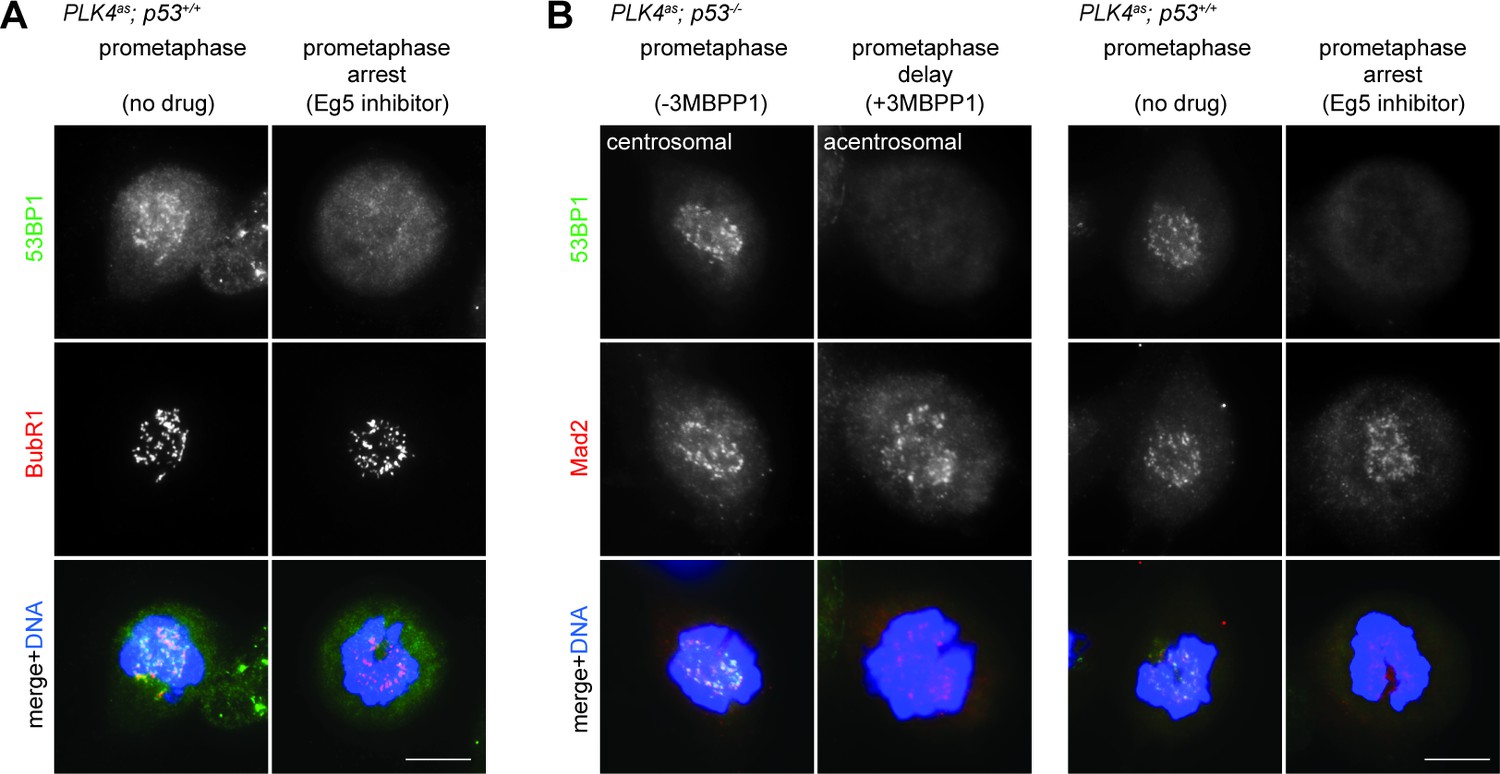
(A) 53BP1 normally disassociates from the kinetochores during anaphase, but can do so prematurely in prometaphase upon mitotic stress/delay. Immunofluorescence images of centrosomal (left) or acentrosomal (right) cells going through mitosis stained with the indicated antibodies. Bright BubR1 signals in prophase and prometaphase indicate SAC activation. Scale bar, 5 μm. (B) Disassociation of 53BP1 from mitotic kinetochores in cells experiencing mitotic stress/delay is time dependent. Quantification of proportion of mitotic cells with 53BP1 localization at the kinetochores. Cells arrested in G2/M were released into mitosis without centrosome (left), or with the spindle poison Eg5 inhibitor (right) as indicated, and then harvested at various time points after the release. Cells were stained with DAPI and antibodies against 53BP1 and BubR1 for scoring. Data are means ± SD. n>130, N = 3. (C) Disassociation of 53BP1 from kinetochores during mitotic stress is not reversible. Cells arrested in metaphase with MG132 for 4 hr followed by reactivation of SAC with nocodazole treatment for 10 min were stained with the indicated antibodies. Bright BubR1 or Mad2 signals indicate SAC activation. Scale bar, 5 μm. (D) 53BP1, USP28 and p53 form large nuclear foci in response to mitotic delay. PLK4as; p21-/- cells proliferating with or without 3MBPP1 stained with the indicated antibodies. Scale bar, 5 μm. (E) SAC is inactive in MPS1as cells treated with 3MBPP1. MPS1as cells treated with 3MBPP1 and Cdk1 inhibitor (RO-3306) for 18 hr were released into mitosis and were processed for immunofluorescence to visualize BubR1 and CREST. Note that SAC activation was disabled by MPS1 inhibition (weak BubR1 signals). Scale bar, 5 μm. (F) MG132 treated cells arrest in G1 in the absence of SAC activity. BrdU incorporation assay showing proportion of proliferating MPS1as or MPS1as; 53BP1-/- cells, with or without 3MBPP1, following release into mitosis with different length of MG132 treatment. Data are means ± SD. Percentages are normalized to the untreated control. n>250, N = 3. (G) Model of 53BP1 and USP28 transducing mitotic stresses into p53 stabilization and p21 dependent cell cycle arrest. (H) A model proposing that the independent collaboration of SAC and 53BP1/USP28 drives efficient mitosis and cell fitness.
Figure 5—figure supplement 1
53BP1 delocalizes from kinetochores in prometaphase in response to mitotic stress.
(A and B) Cells arrested or delayed in prometaphase due to Eg5 inhibitor treatment or acentrosomal cell division stained with the antibodies indicated. Bright BubR1 or Mad2 signals indicate SAC activation. Scale bar, 5 μm.
Figure 5—figure supplement 2
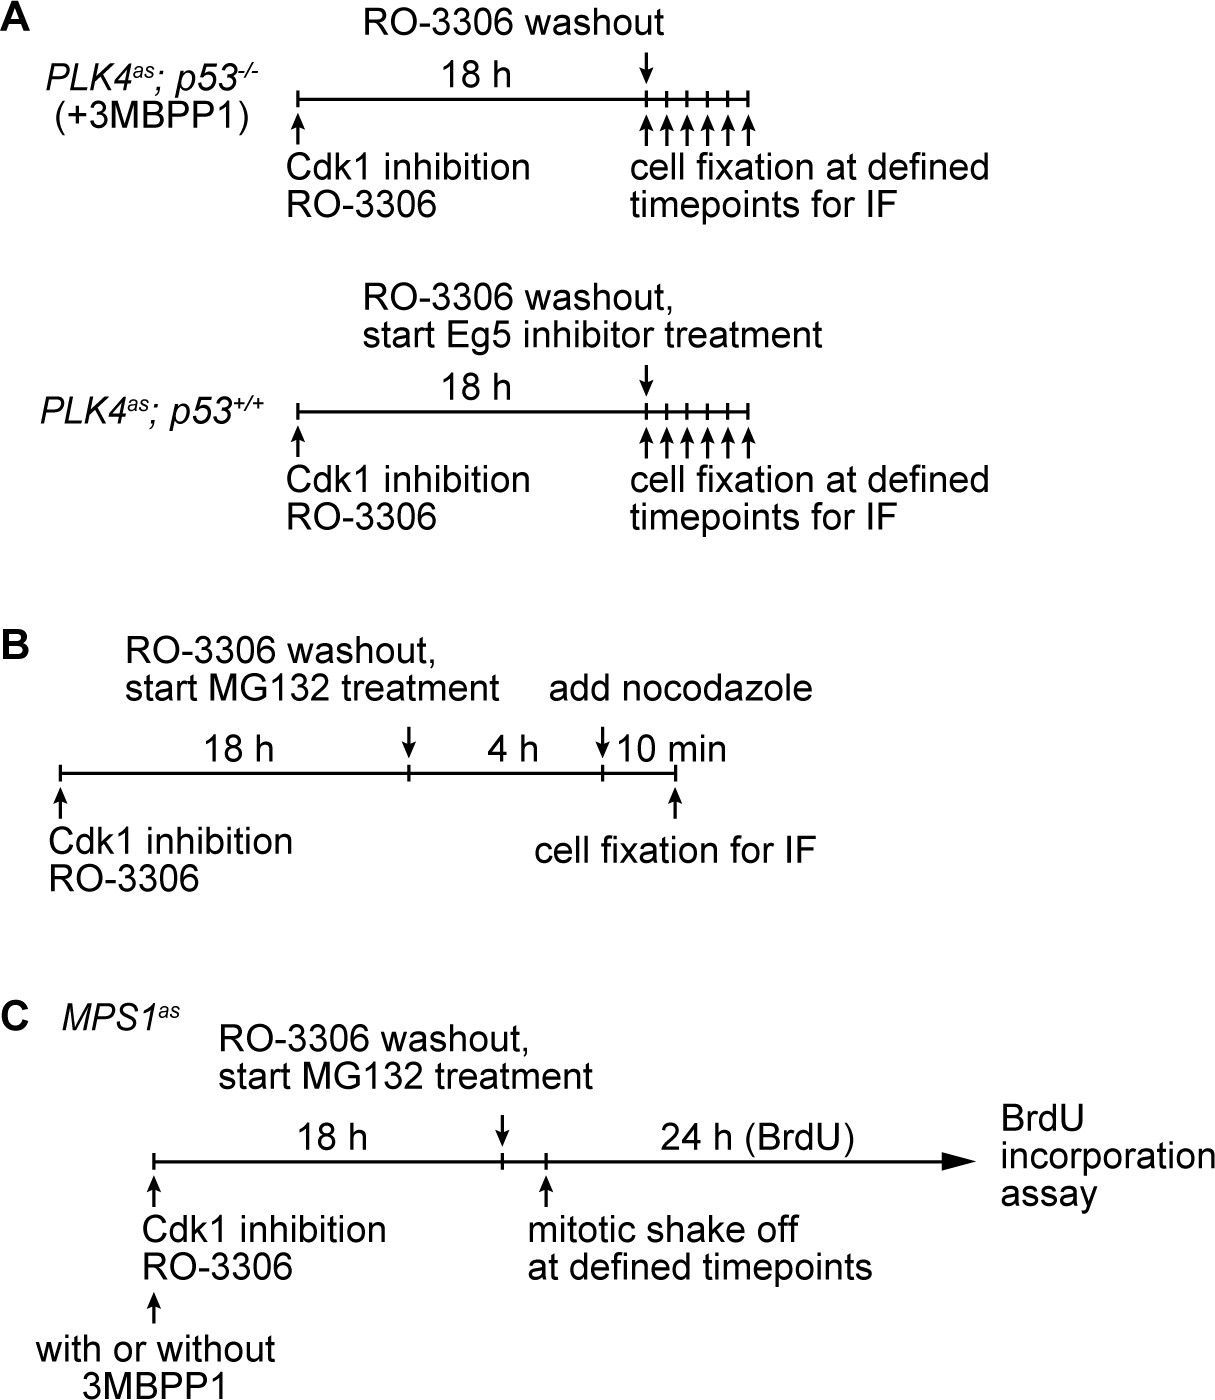
Schematic outlining the timeline of synchronization and drug treatments used.
(A) Assay for 53BP1 mitotic kinetochore localization for Figure 5B. (B) SAC reactivation assay for Figure 5C. (C) BrdU incorporation assay for Figure 5F.
Tables
Table 1
Candidate genes enriched in the eight independent screens for genes involved in centrosome loss-induced G1 arrest.
| Enrichment compared to p53 | Gene symbol | Gene name or description | Number of sgRNAs enriched out of total 6 |
|---|---|---|---|
| 1.0000 | TP53 | Tumor Protein P53 | 5/6 |
| 0.9386 | TP53BP1 | Tumor Protein P53 Binding Protein 1 | 4/6 |
| 0.9039 | TRIM37 | Tripartite Motif Containing 37 | 3/6 |
| 0.8895 | USP28 | Ubiquitin Specific Peptidase 28 | 4/6 |
| 0.8858 | P21 | Cyclin-Dependent Kinase Inhibitor 1A (P21, Cip1) | 6/6 |
| 0.7559 | CHD8 | Chromodomain Helicase DNA Binding Protein 8 | 4/6 |
| 0.6945 | FBXO42 | F-Box Protein 42 | 3/6 |
| 0.6846 | RNF20 | Ring Finger Protein 20, E3 Ubiquitin Protein Ligase | 3/6 |
| 0.6665 | PCDHGC5 | Protocadherin Gamma Subfamily C, 5 | 2/6 |
| 0.6604 | TSPY8 | Testis Specific Protein, Y-Linked 8 | 3/6 |
| 0.6395 | RWDD3 | RWD Domain Containing 3 | 2/6 |
| 0.6364 | UGT1A9 | UDP Glucuronosyltransferase 1 Family, Polypeptide A9 | 2/6 |
| 0.6285 | PDSS1 | Prenyl (Decaprenyl) Diphosphate Synthase, Subunit 1 | 2/6 |
| 0.6275 | BPIFB4 | BPI Fold Containing Family B, Member 4 | 2/6 |
| 0.6240 | PCDHAC2 | Protocadherin Alpha Subfamily C, 2 | 3/6 |
| 0.6218 | CSNK2A1 | Casein Kinase 2, Alpha 1 Polypeptide | 2/6 |
| 0.6201 | GAGE7 | G Antigen 7 | 3/6 |
| 0.6119 | WTAP | Wilms Tumor 1 Associated Protein | 2/6 |
| 0.6093 | PRDM11 | PR Domain Containing 11 | 2/6 |
| 0.6086 | OR56A1 | Olfactory Receptor, Family 56, Subfamily A, Member 1 | 2/6 |
| 0.6059 | TBCEL | Tubulin Folding Cofactor E-Like | 2/6 |
| 0.5997 | DNAJC9 | DnaJ (Hsp40) Homolog, Subfamily C, Member 9 | 2/6 |
| 0.5991 | NPIPL3 | Nuclear Pore Complex Interacting Protein Family, Member B3 | 3/6 |
| 0.5987 | SYDE1 | Synapse Defective 1, Rho GTPase, Homolog 1 | 2/6 |
| 0.5959 | TECPR2 | Tectonin Beta-Propeller Repeat Containing 2 | 2/6 |
| 0.5683 | STOML3 | Stomatin (EPB72)-Like 3 | 2/6 |
| 0.5507 | DVL3 | Dishevelled Segment Polarity Protein 3 | 2/6 |
-
Log2 scaling of sgRNAs enrichment normalized to the top scoring hit p53. The sgRNAs for genes highlighted in red were validated in this study. For a gene to be scored as a candidate, at least two of its six sgRNAs were repeatedly enriched in independent screens, with the HiSeq reads at least 3 times higher than the average of the baseline read.
Download links
A two-part list of links to download the article, or parts of the article, in various formats.
Downloads (link to download the article as PDF)
Open citations (links to open the citations from this article in various online reference manager services)
Cite this article (links to download the citations from this article in formats compatible with various reference manager tools)
53BP1 and USP28 mediate p53-dependent cell cycle arrest in response to centrosome loss and prolonged mitosis
eLife 5:e16270.
https://doi.org/10.7554/eLife.16270


