Wnt proteins can direct planar cell polarity in vertebrate ectoderm
- Icahn School of Medicine at Mount Sinai, United States
Figures
Figure 1 with 1 supplement

Polarization of Pk3/Vangl2 complexes at the anterior cell cortex.
(A) Experimental scheme. RNAs encoding GFP-Pk3 and mouse HA-Vangl2 (150 pg each) were injected into the animal-ventral region of four-cell embryos. Ectoderm was dissected from the ventral midline area of fixed embryos for imaging (red box). The anteroposterior (AP) and dorsoventral (DV) axes are indicated. (B, C) GFP fluorescence of stage 15 ectoderm expressing GFP-Pk3 alone (B) or with HA-Vangl2 (C). Arrows in C point to GFP-Pk3 at the anterior cortex. (D, E) Embryos mosaically-expressing GFP-Pk3 and HA-Vangl2 were fixed at stage 11 (D–D’’) or stage 15 (E–E’’). Staining of GFP and HA is shown as indicated. HA-Vangl2 polarization is poorly detected in some cells due to variation in protein levels. Scale bar, 20 µm. (F) A single cell expressing GFP-Pk3 and HA-Vangl2. Dashed line depicts the cell boundary. Pk3 orientation (white arrow) is defined as perpendicular to the line connecting the ends of the crescent (yellow bar). (G) Rose diagrams show the orientation of GFP-Pk3 crescents in the ventral ectoderm at the indicated stage. n, number of scored cells. (H) Summary of GFP-Pk3 polarization derived from data in (G). Each arrow in the polar plot displays the mean orientation of Pk3 crescents in a single embryo at stage 12.5 (blue) or stage 15 (red). Arrow length is 1 minus the circular variance around the mean. Data are representative of two independent experiments.
Figure 1—figure supplement 1
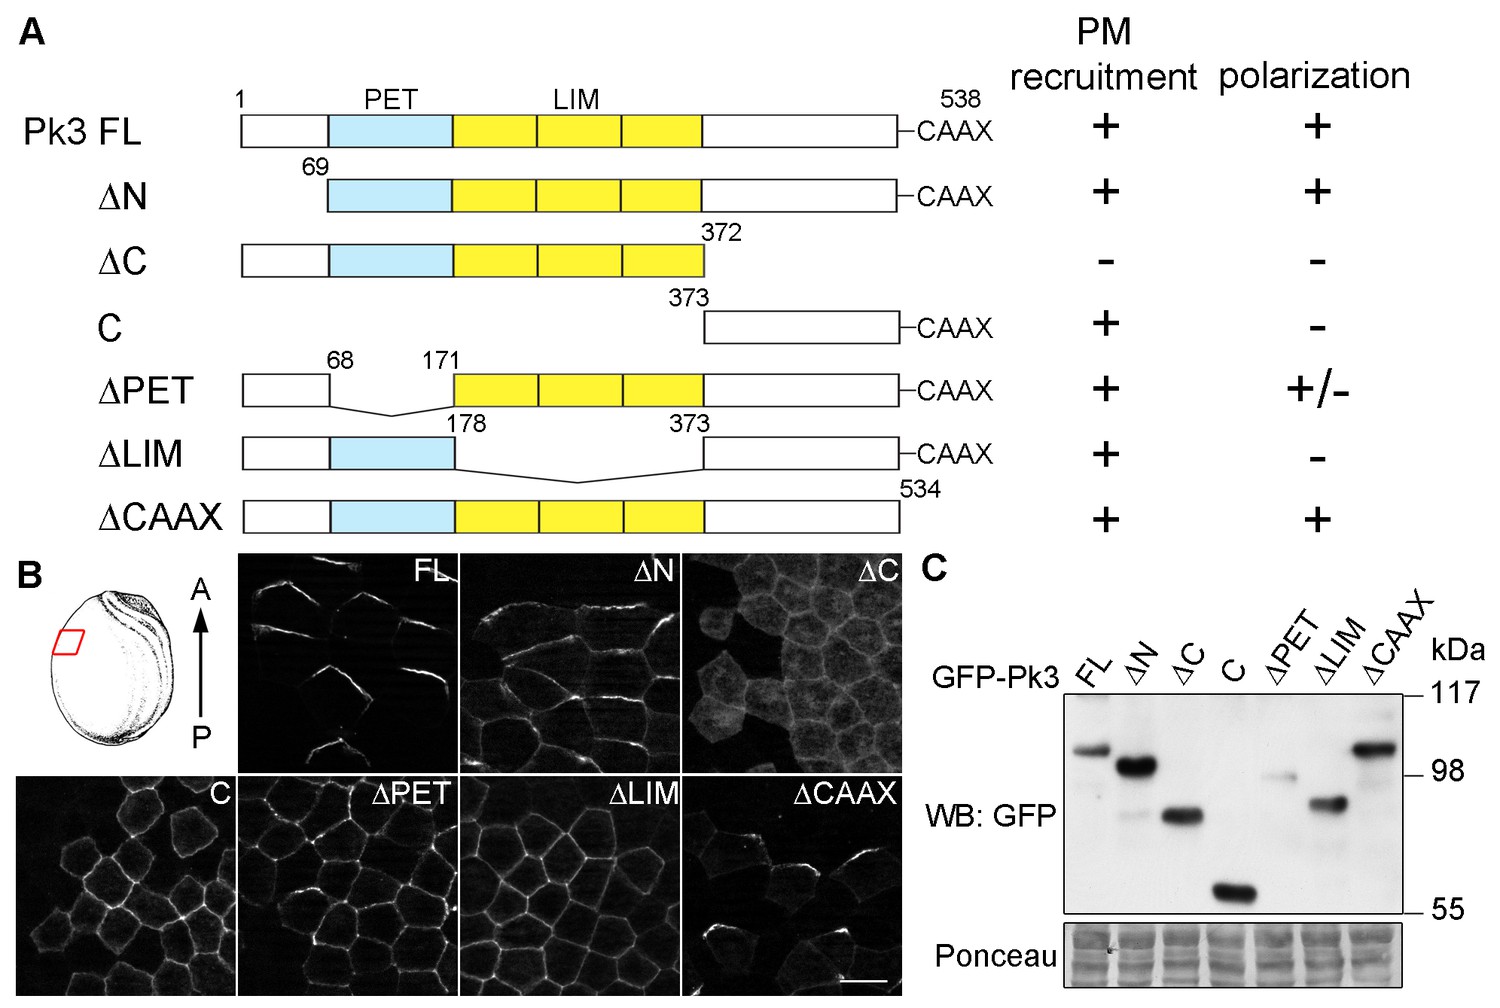
Different domains mediate Pk3 membrane recruitment and its polarization.
(A) Domain structure of the full-length (FL) and truncated Pk3 proteins and the summary of their properties in ectodermal cells coexpressing Vangl2. Two properties were assessed: the ability to be recruited to the plasma membrane (PM), and the anterior polarization of Pk3/Vangl2 complexes. +/-, inefficient polarization of the ∆PET construct. (B) Embryos expressing mouse HA-Vangl2 and the indicated GFP-Pk3 proteins were fixed at stage 15 for imaging. Immunostaining of GFP in the epidermal ectoderm is shown. The red box illustrates the approximate position of the samples. Scale bar, 20 µm. (C) Embryos expressing HA-Vangl2 and the indicated GFP-Pk3 constructs were lysed at stage 15. Pk3 protein expression levels were assessed by immunoblotting with anti-GFP antibodies. Ponceau staining reflects protein loading (bottom panel).
Figure 2 with 1 supplement
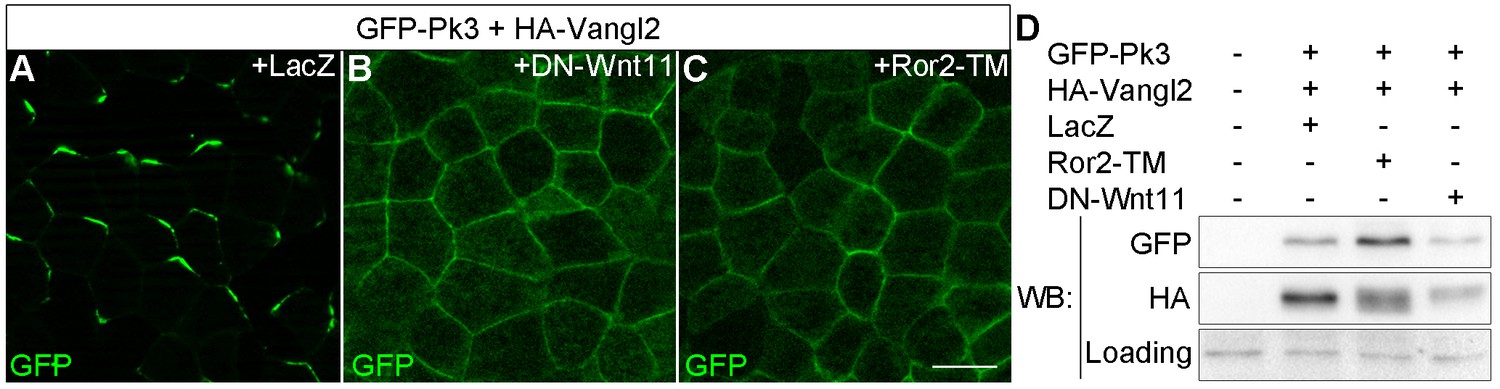
Effects of Wnt antagonists on Pk3 polarization in the epidermal ectoderm.
Embryos were injected with RNAs encoding GFP-Pk3 (150 pg), Xenopus HA-Vangl2 (120 pg), and LacZ (1 ng, A) or DN-Wnt11 (2 ng, B) or Ror2-TM (1 ng, C). (A–C) GFP fluorescence is shown in the epidermal ectoderm of embryos fixed at stage 15. Anterior is to the top. Scale bar, 20 µm. (D) Protein levels of GFP-Pk3 and HA-Vangl2 in the ectoderm analyzed by immunoblotting. A non-specific band detected by anti-HA antibody reflects protein loading.
Figure 2—figure supplement 1
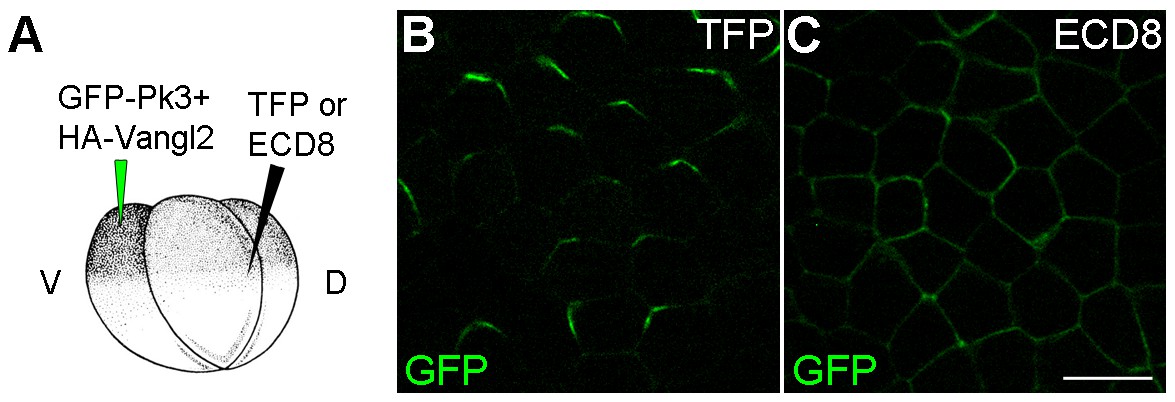
ECD8 disrupts Pk3 polarization in the epidermis.
Four-cell embryos were injected at the ventral animal location with RNAs encoding GFP-Pk3 (150 pg) and Xenopus HA-Vangl2 (60 pg), followed by injection of RNAs for TurboFP635 (TFP, 1 ng) (B) or the extracellular domain of Frizzled 8 (ECD8, 1 ng) (C) into the dorsal marginal zone. GFP fluorescence in the epidermal ectoderm of stage 15 embryos is shown. Scale bar, 20 µm.
Figure 3 with 2 supplements

The instructive role of Wnt5a in the establishment of Pk3 polarity.
(A) Experimental scheme. RNAs encoding GFP-Pk3 (150 pg) and Xenopus HA-Vangl2 (60 pg) were injected animally into a ventral blastomere of 32-cell embryos, followed by injection of TurboFP635 (TFP) RNA (150 pg, lineage tracer) with or without Wnt5a RNA (500 pg) into a blastomere either to the right (L–R) or anterior (A–P) of the Pk3-injected blastomere. The injected embryos were fixed at indicated stages, ectodermal explants were dissected, and the orientation of Pk3 crescents was evaluated by GFP fluorescence. (B–D) Cell orientation in L-R-positioned clones. (B) Low magnification view of a stage 11.5 explant. Orientation of individual cells was quantified relative to the dashed line approximating TFP clone border (boxed area). The antero-posterior and left-right axes are indicated. (C) Control embryo, (D) Wnt5a-expressing embryo. (E–H) Cell orientation in A–P-positioned clones at indicated stages. (E) Low magnification view. (F) Control embryo, (G, H) Wnt5a RNA-injected embryos. Arrows indicate cell orientation relative to the TFP clone (D, G, H). Scale bar, 50 µm. (I, K) Rose diagrams show Pk3 patch orientation in L–R (I) or A–P (K) experimental groups. Cell orientation was defined by an angle between the line joining the two ends of each Pk3 patch and the line approximating TFP clone border. (M) Orientation of Pk3 crescents in the A–P group at stage 15. See Figure 1F–H legend for quantification details. n, number of scored cells. p values were obtained by comparing the Wnt group to the control group using Chi-squared test. (J, L, N) Polar plots derived from (I, K, M), respectively, depict the mean Pk3 orientation in individual embryos. Arrow length is 1 minus the circular variance around the mean. Data were collected from two independent experiments.
Figure 3—figure supplement 1
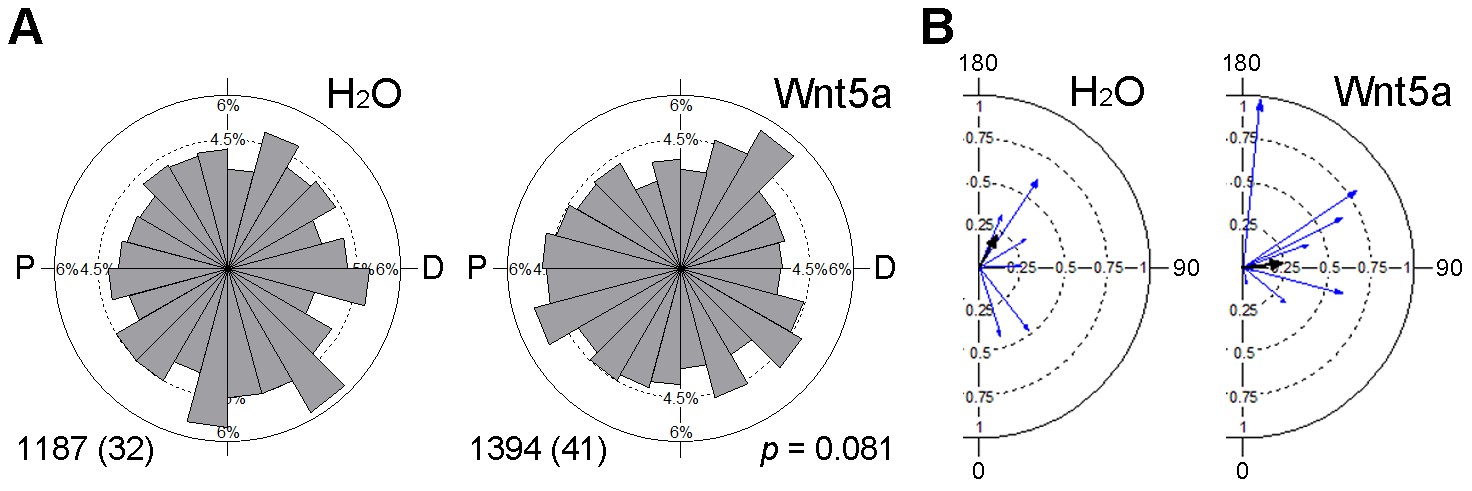
Effect of Wnt5a on microtubule orientation.
Clip170-GFP RNA (150 pg) was injected into the left animal-ventral blastomere of eight-cell embryos, followed by injection of TFP RNA with or without Wnt5a RNA (500 pg) into the right animal-ventral blastomere. The movement of Clip170-GFP foci in 3–10 ectodermal cells located within 5 cell diameters to the TFP clone border was traced at stage 11 to 11.5. (A) Rose diagrams show the directions of Clip170-GFP foci movement. The proximal (P)-distal (D) axis is perpendicular to the TFP clone border. Data are collected from three independent experiments. Numbers of analyzed traces and cells (in parentheses) are indicated. p value was obtained using Chi-squared test. (B) Polar plots display mean axial vectors of Clip170 traces in individual embryos (each embryo represented by a blue arrow). Arrow length is 1 minus the circular variance around the mean. Black arrows are mean axial vectors for each experimental group.
Figure 3—figure supplement 2
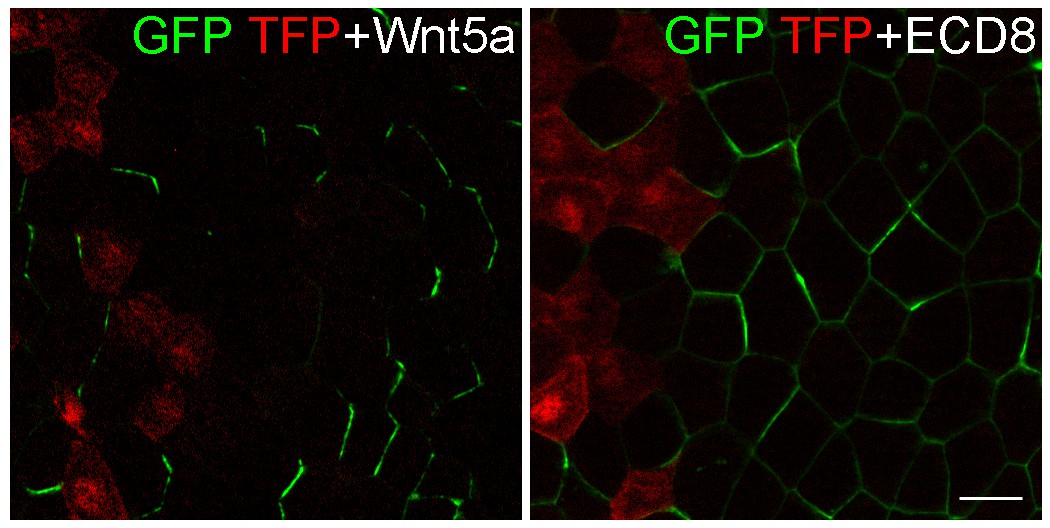
ECD8 does not direct GFP-Pk3 polarization.
Eight-cell embryos were injected at the left ventral-animal blastomere with RNAs encoding GFP-Pk3 and HA-Vangl2, followed by injection of RNAs for TFP and either Wnt5a (500 pg) or ECD8 (500 pg) into the right ventral-animal blastomere. GFP and TFP fluorescence in the epidermal ectoderm of stage 11.5 embryos is shown. Images are representative of two independent experiments. Scale bar, 20 µm.
Figure 4
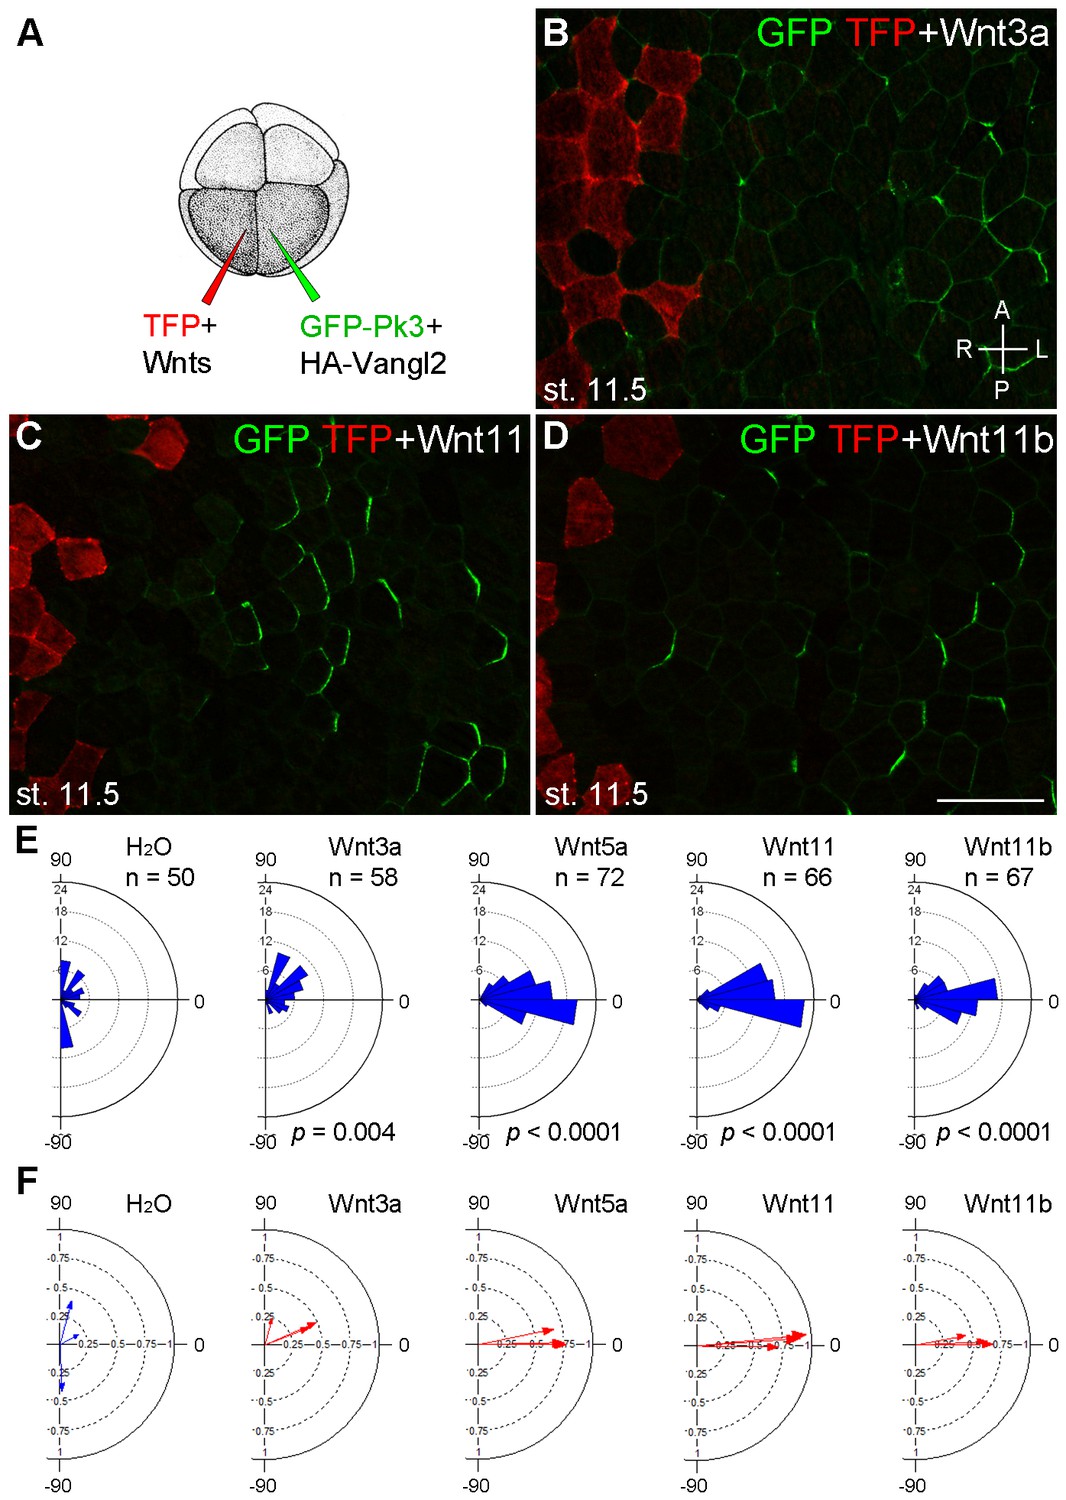
Establishment of Pk3 polarity in response to different Wnt ligands.
(A) Experimental scheme. RNAs encoding GFP-Pk3 and mouse HA-Vangl2 (150 pg each) were injected into the left animal-ventral blastomere of eight-cell embryos, followed by coinjection of a Wnt RNA (500 pg) and TFP RNA into the right animal-ventral blastomere. (B–D) Cell orientation in stage 11.5 ectoderm of embryos injected with Wnt3a (B), Wnt11 (C) and Wnt11b (D) RNAs. The antero-posterior and left-right axes are indicated. Scale bar, 50 µm. (E) Rose diagrams show Pk3 patch orientation in clones adjacent to control (H2O) or Wnt-expressing clones. See Figure 3I for details. n, number of scored cells. p values were obtained using Chi-squared test. (F) Polar plots derived from (E) depict the average Pk3 orientation in individual embryos. Arrow length is 1 minus the circular variance around the mean. Data were collected from two independent experiments.
Figure 5
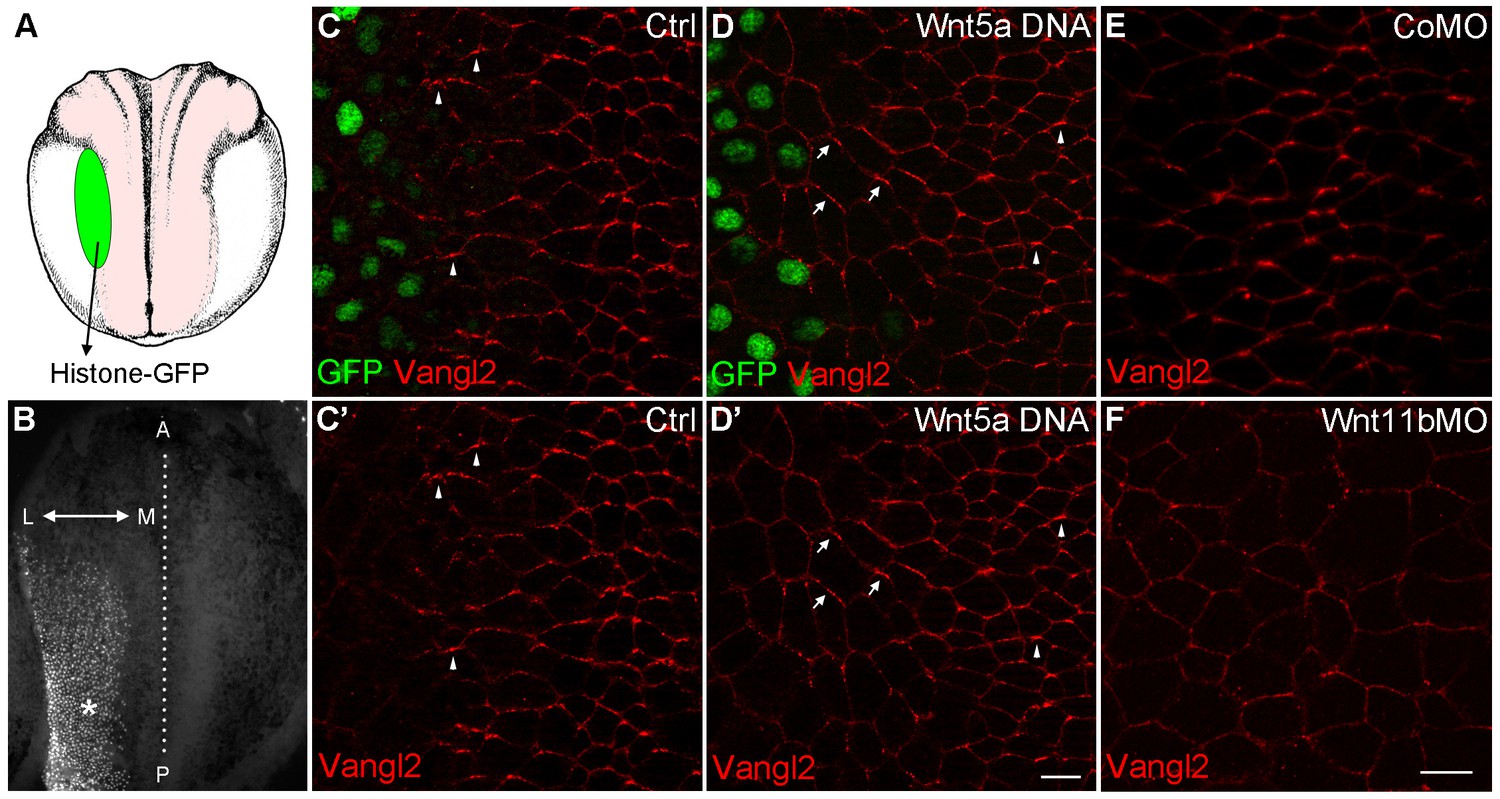
Wnt signaling instructs Vangl2 polarization in the neural plate.
(A) Experimental scheme. Histone-GFP RNA (100 pg, nuclear lineage tracer, green) alone or with Wnt5a-Myc DNA (100 pg) was targeted to the border of the neural plate (pink), followed by immunostaining of Vangl2. (B) The neural plate of a stage 15 embryo with a clone of Histone-GFP-expressing cells (asterisk). Dotted line depicts the midline, and the antero-posterior (A–P) and medial-lateral (M–L) axes are indicated. (C–D') Neural plates of embryos injected with Histone-GFP RNA alone (C–C') or with Wnt5a-Myc DNA (D–D') were immunostained for GFP and Vangl2. Vangl2 polarization is evident at the anterior cell borders (arrowheads). In cells adjacent to the Wnt5a-Myc clone, Vangl2 is oriented away from the clone (arrows). Images are representative of three independent experiments. (E–F) Wnt11b is required for Vangl2 polarization. Each vegetal blastomere of eight-cell embryos was injected with 20 ng of either control MO (CoMO) (E) or Wnt11b MO (F). Neural plate explants at stage 15 were stained to visualize Vangl2. Scale bar, 20 µm. Images are representative of three independent experiments.
Videos
Video 1
Microtubule orientation visualized by the movement of Clip170-GFP foci.
Time-lapse imaging of Clip170-GFP comets in an ectodermal cell of a stage 11 embryo. See Figure 3—figure supplement 1 for details.
Download links
A two-part list of links to download the article, or parts of the article, in various formats.
Downloads (link to download the article as PDF)
Open citations (links to open the citations from this article in various online reference manager services)
Cite this article (links to download the citations from this article in formats compatible with various reference manager tools)
Wnt proteins can direct planar cell polarity in vertebrate ectoderm
eLife 5:e16463.
https://doi.org/10.7554/eLife.16463


