Stochastic and deterministic dynamics of intrinsically irregular firing in cortical inhibitory interneurons
- University of Cambridge, United Kingdom
- University of Southampton, United Kingdom
- Institute of Experimental Medicine, Hungary
Figures
Figure 1
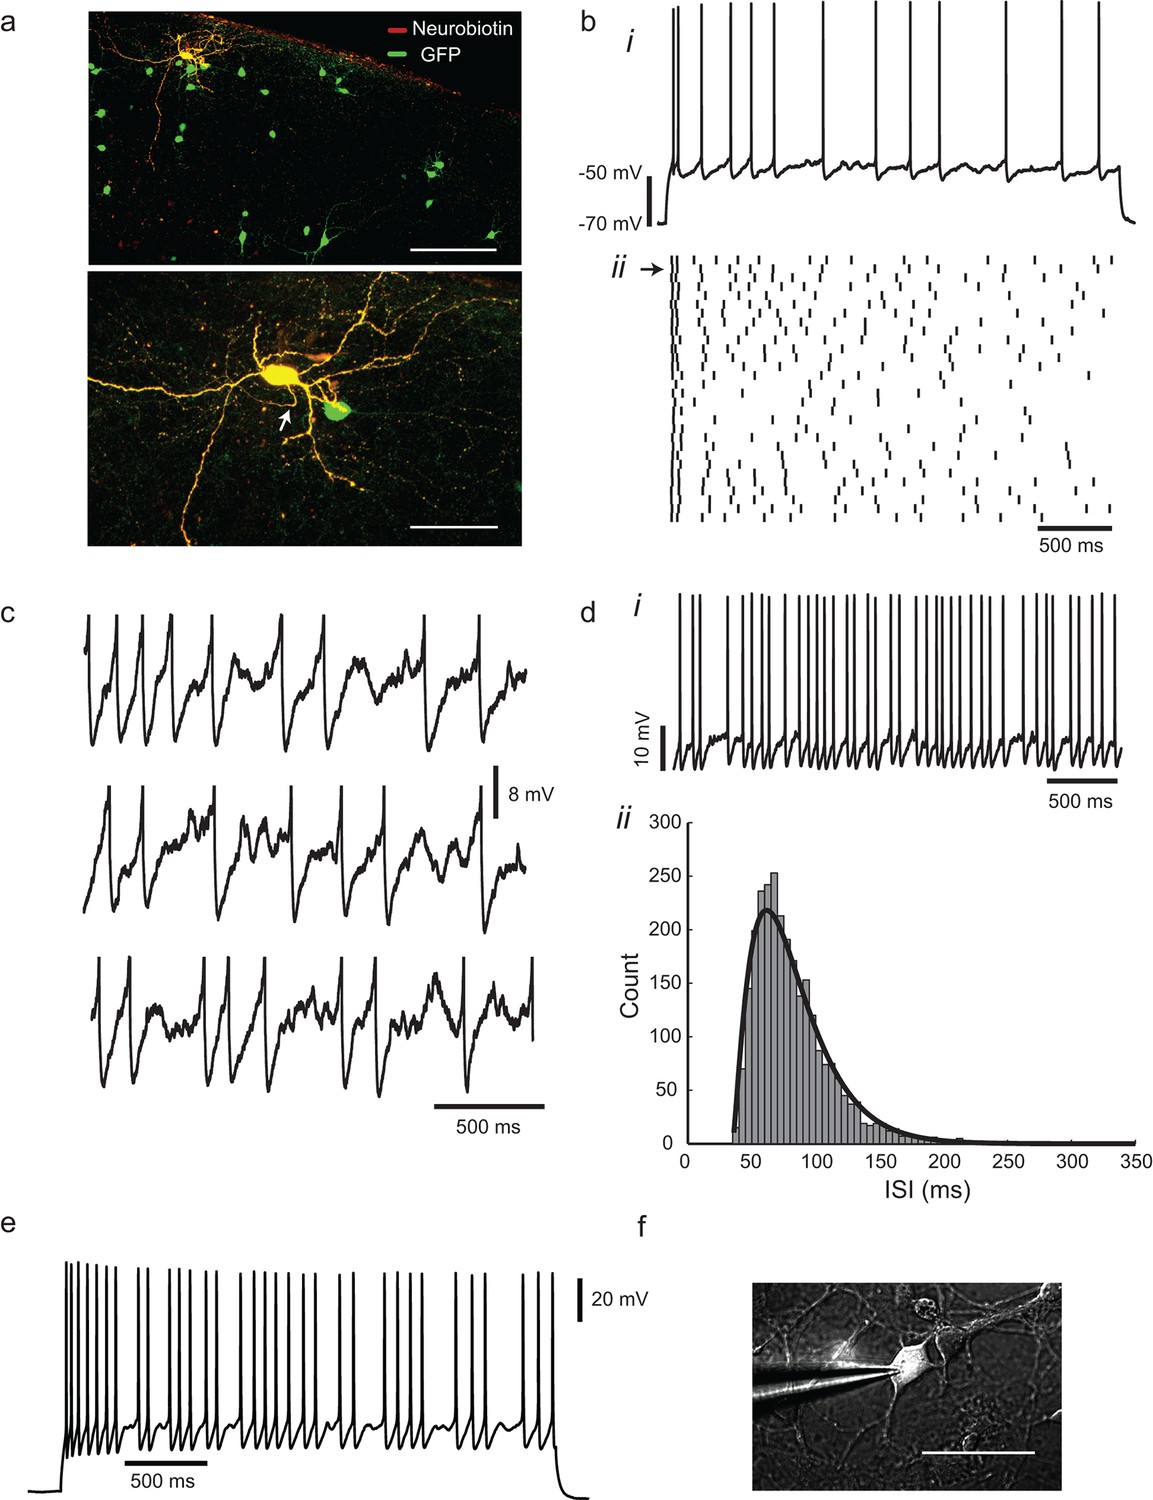
Irregular-spiking in a population of cortical inhibitory interneurons.
(a) Distribution of Gad2-GFP mouse neurons in the somatosensory cortex (top). Below is the detailed morphology of a typical irregular-spiking interneuron which was filled with neurobiotin. White arrow indicates the axon initial segment. Irregular-spiking Gad2-GFP interneurons were consistently found in superficial layers and displayed noticeably bigger somata. Stacked confocal images of cells in a 300 µm thick slice; scale bars, 150 μm and 50 μm. (b), (i) Irregular spiking in response to a constant 120 pA current step. Resting potential was −68 mV. After an initial fast spike doublet, firing settles into an irregular pattern of spikes, separated by noisy fluctuations of membrane potential. (ii) Raster plot of spike times in 30 successive responses to the same current step, separated by 10 s intervals. Spike train corresponding to (bi) is indicated by an arrow at left. (c) Close-up view of the interspike membrane potential fluctuations in three consecutive trials from the ensemble shown in (bii). Spikes have been truncated. (d), (i) Higher frequency firing in another cell, excited by a 220 pA constant current stimulus. (ii) The distribution of 2730 interspike intervals (ISIs) in one cell, fitted with a gamma distribution: where n is 2.29, τ is 20.7 ms, and refractory period tr is 35.05 ms. CV(ISI) = 0.38, mean firing frequency is 13.6 Hz. (e), Gad2-GFP cortical interneurons display the same irregular-spiking pattern in primary culture (12–16 DIV; n = 10). Irregularity increased with development, and was observable even at higher firing frequencies (15–20 Hz) as in cortical slices. (f) Patch-clamp recording of a GFP+ neuron in culture. Scale bar 50 μm.
Figure 2 with 1 supplement
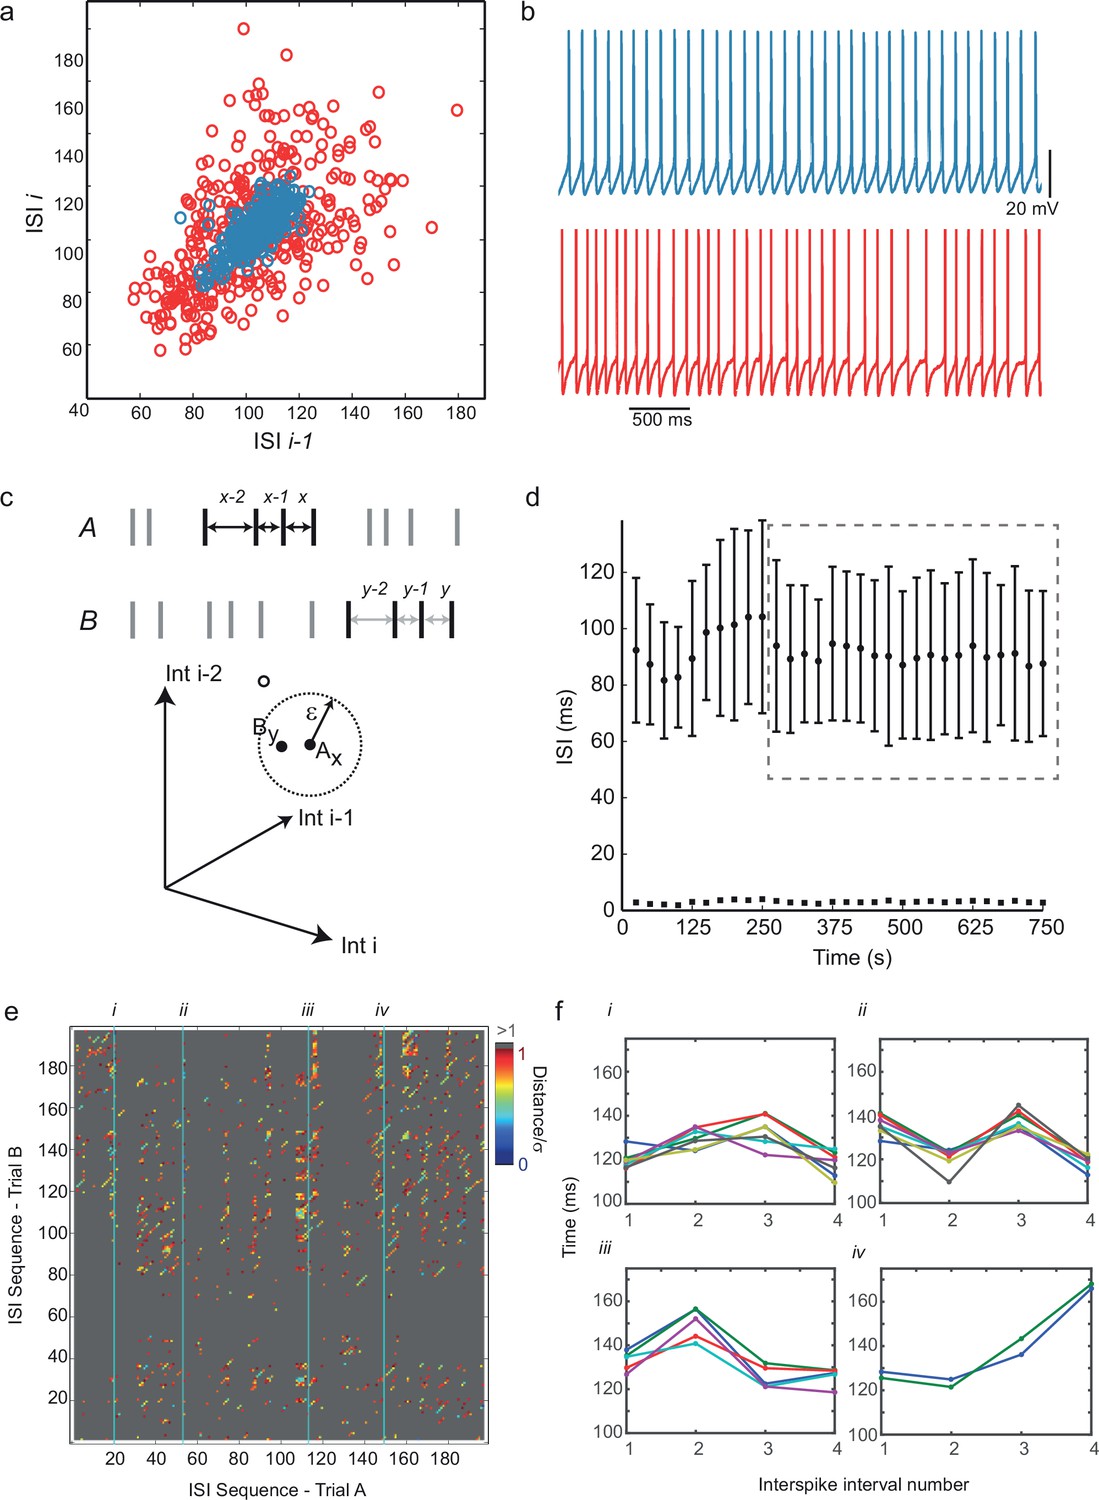
Predictability and nonlinearity of interspike interval sequences.
(a) Examples of two contrasting ISI return maps extracted from a regular-spiking cell (blue, mean frequency 9.67 Hz, CVISI = 0.075) and an irregular-spiking cell (red, mean frequency 9.65 Hz, CVISI = 0.207). (b) Segments of corresponding spike trains. (c) Principle of recurrence analysis. The dynamical state of the process is represented by vectors of consecutive ISIs, or embedding points. In this example, point Ax in a 3-dimensional embedding of an interspike interval sequence A (whose coordinates are ISIsx-2, x-1 and x) is similar to point By in interspike interval series B (top), because their distance is less than a threshold ε (bottom). (d) Selection of stationary sequences of stimulus trials for recurrence analysis. The mean ISI in each trial lasting 8 s, repeated at 25 s intervals, is plotted with its standard deviation (filled circles and error bars), and the standard error of the mean (filled squares). Sections of the time series were accepted as sufficiently stationary if the average trial-to-trial change in mean ISI was less than half the average standard error of the mean (e.g. region shown in dashed gray rectangle). (e) Example cross-recurrence plot between two consecutive stimulus trials, A and B, embedding dimension m = 4, ε = one standard deviation of the ISIs. Position (x,y) is colored according to the Euclidean distance between the length-4 ISI sequences at position x in A and y in B. Thus blue points reflect recurrence of very similar patterns. (f) Four examples of repeated patterns or 'motifs' of ISIs in sequence B corresponding to the patterns at positions (i)–(iv) in sequence A, as indicated in (e). See Figure 2—figure supplement 1 and Figure 2—source data 2 for recurrence plot quantification.
-
Figure 2—source data 1
Numerical values for Figure 2d.
- https://doi.org/10.7554/eLife.16475.005
-
Figure 2—source data 2
Table showing details of recurrence plot analysis in ten cells.
Nonstationarity is the ratio of the average change in mean ISI in consecutive trials, divided by the standard error of the mean ISI. Time series with nonstationarity > 0.5 were rejected. In five of ten cells, both recurrence and determinism were significant (p< 0.05), only recurrence was significant in a further two cells, while in the three remaining cells, neither recurrence nor determinism were significant.
- https://doi.org/10.7554/eLife.16475.006
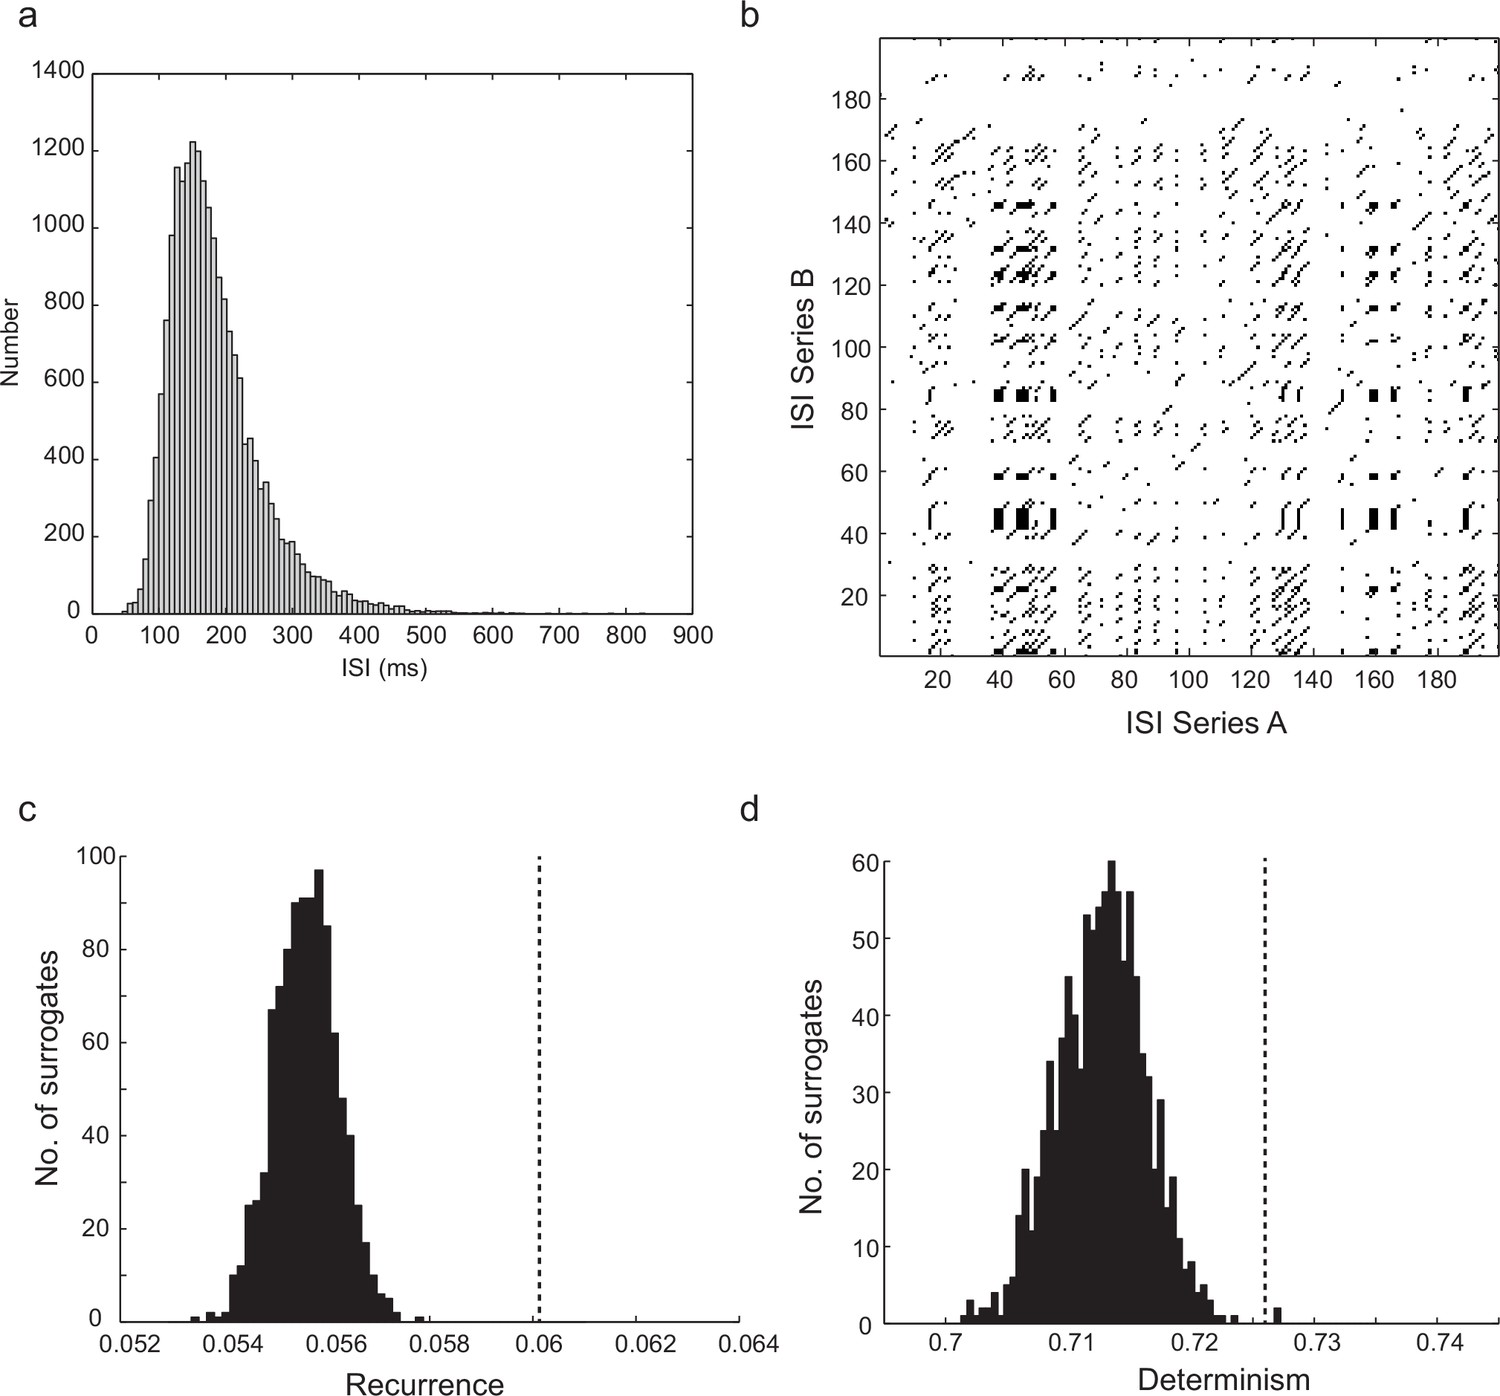
Figure 2—figure supplement 1
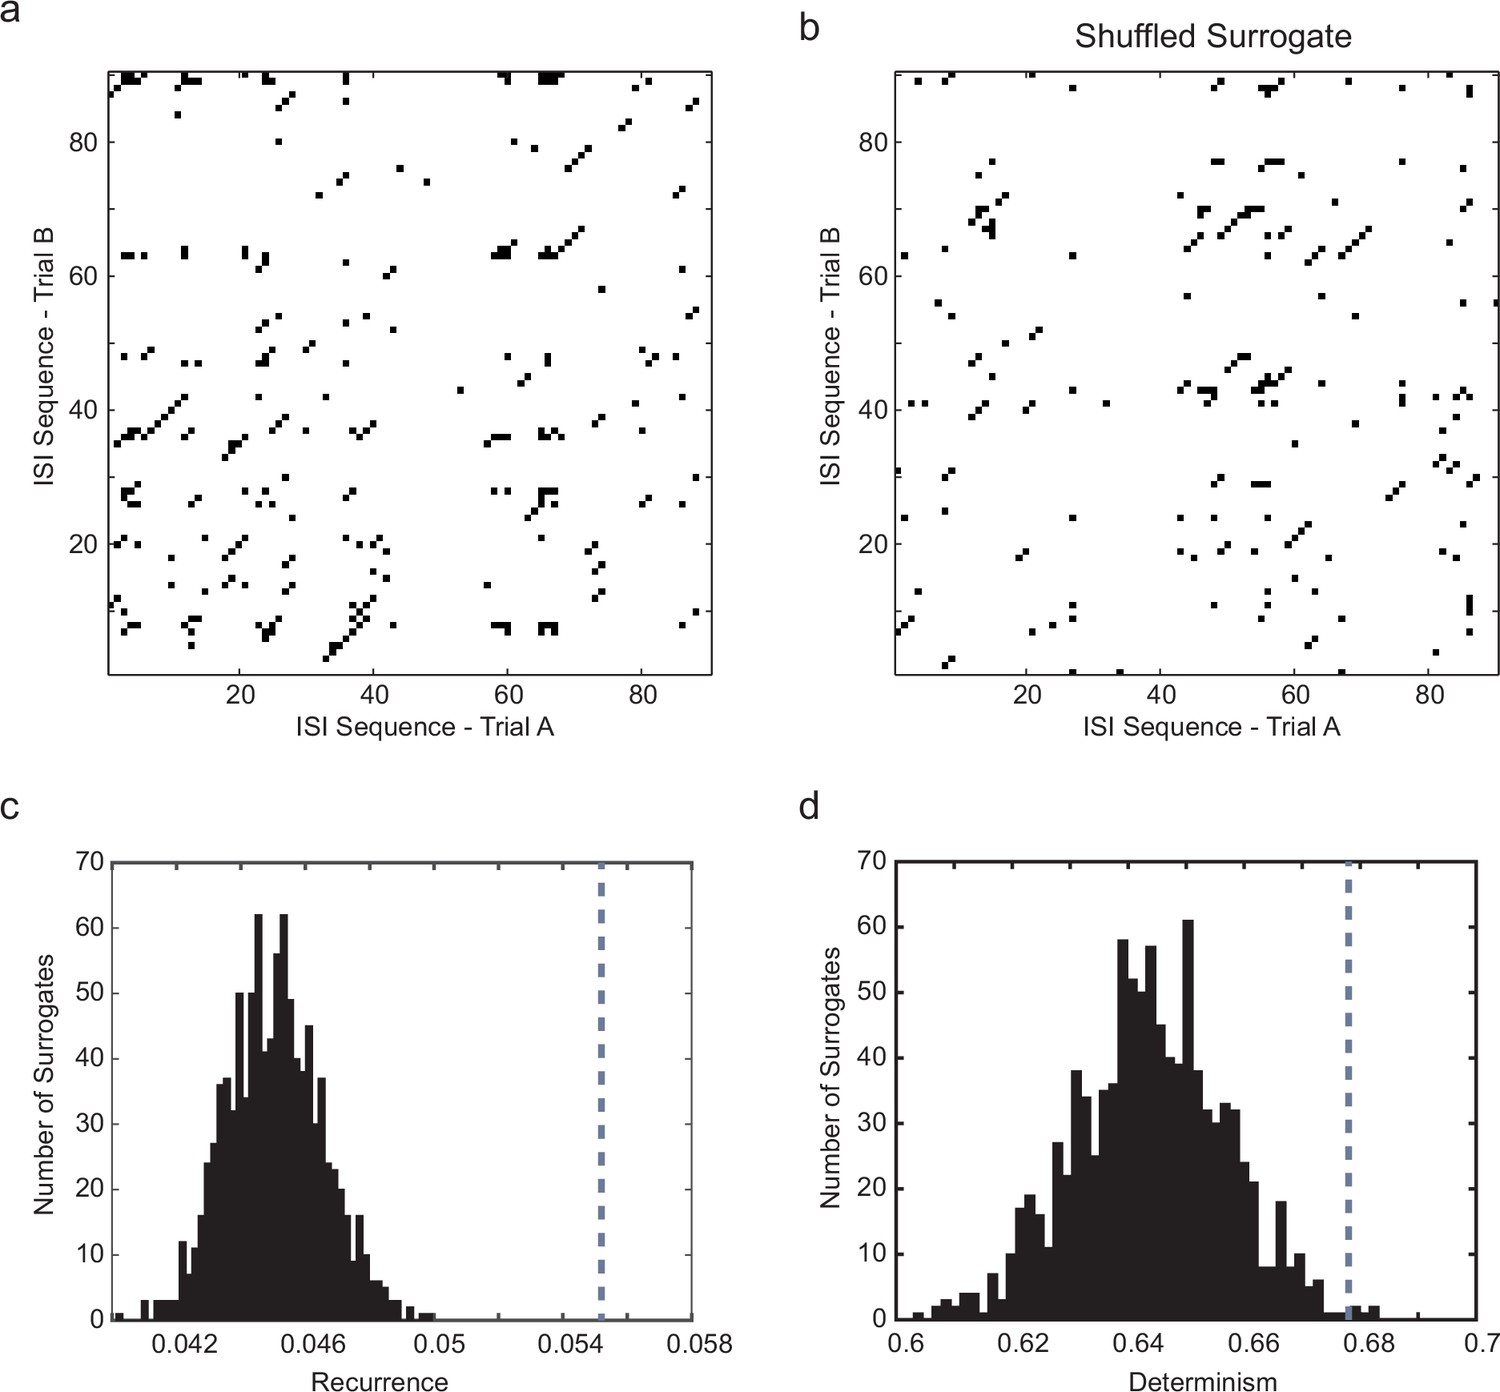
Significance testing of recurrence and determinism of interspike interval sequences.
(a) Example cross-recurrence plot for the response to one 30 s current step trial against that of the subsequent trial. Threshold (ε) = σISI, embedding dimension m = 4. Each point colored black denotes where sequences of 4 ISIs in each of the two trials were closer than ε to each other. (b) random shuffling of both sets of ISIs results in a loss of recurrence (proportion of black points in the matrix) and determinism (fraction of black points within diagonals of length 2 or greater. (c) Distribution of the recurrence values (each of which is the mean over 7 successive pairwise comparisons of consecutive 10 s trials during stationary firing) for 1000 shuffled surrogates (each ISI sequence in the CRP is randomly permuted), compared to the actual corresponding measured recurrence level (indicated by vertical dotted gray line) over the same set of trials. (d) the same for the determinism (fraction of recurrent points lying within diagonals of length ≥ 2). A z-test (Matlab ztest, right-tailed) confirms that both recurrence (p<7.52e-9) and determinism (p<0.023) are significant in this case.
Figure 3
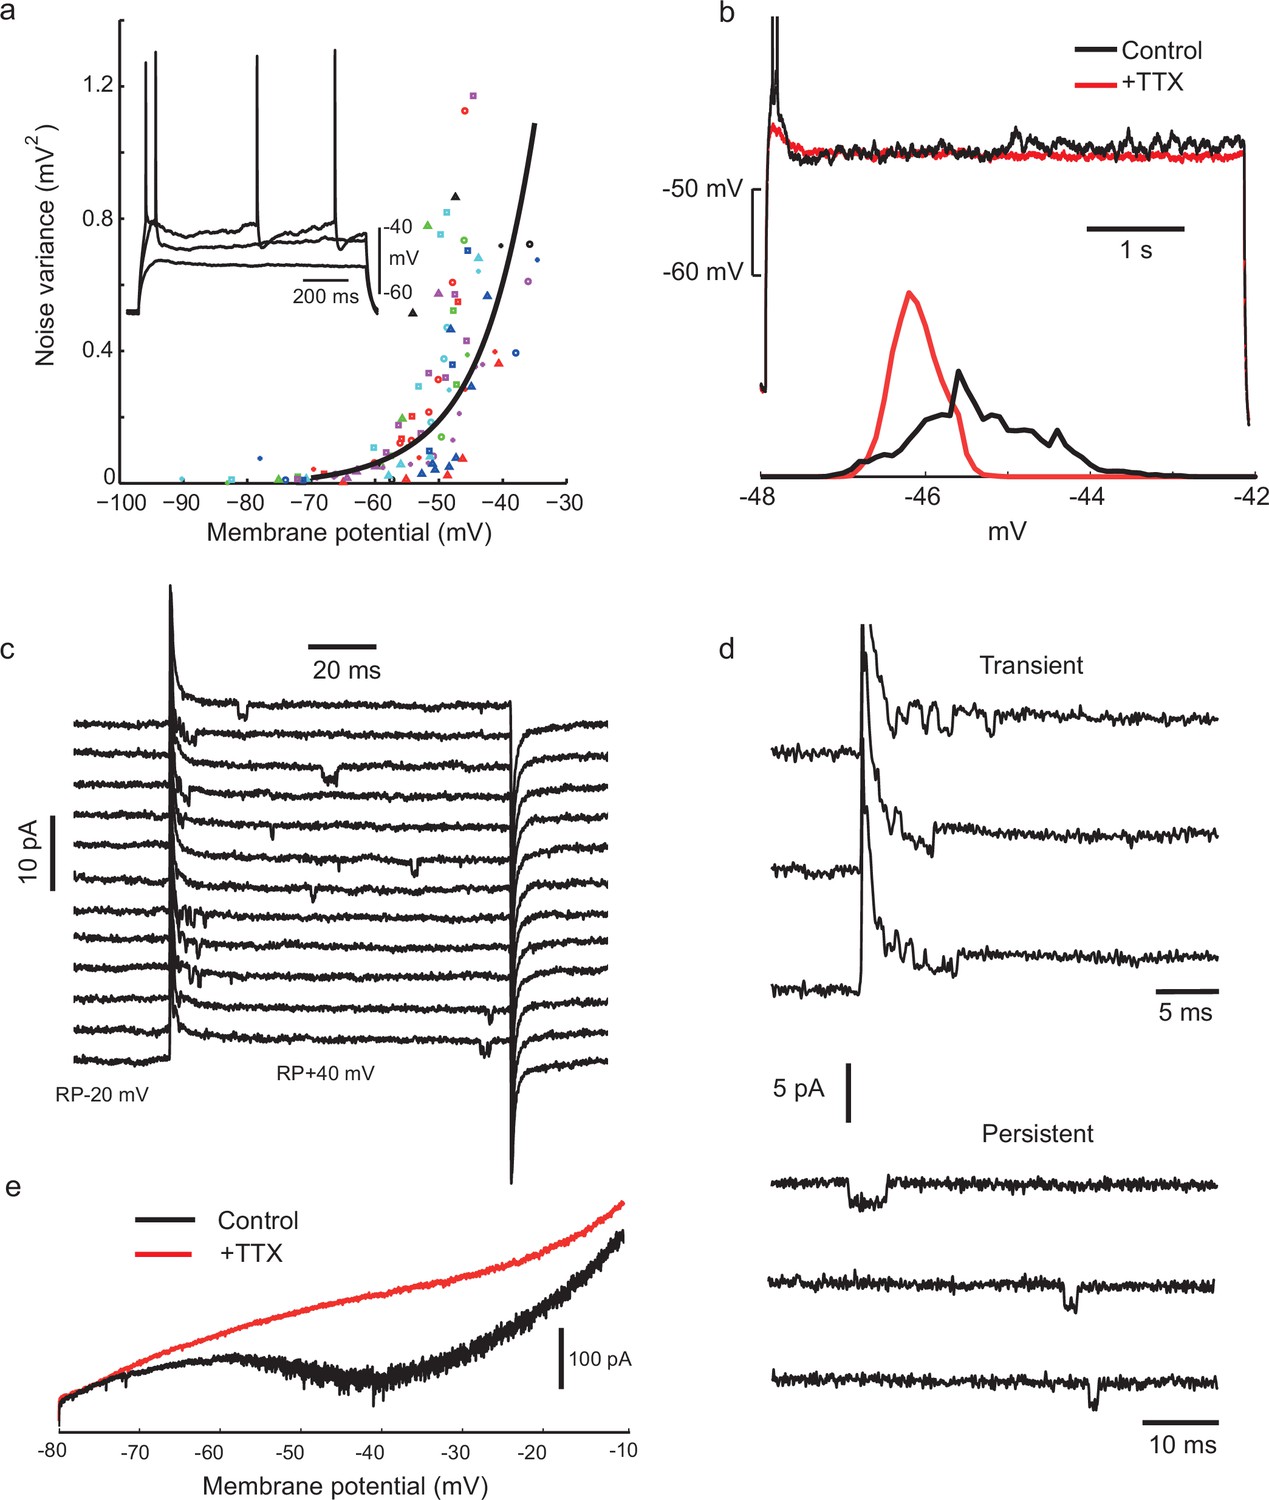
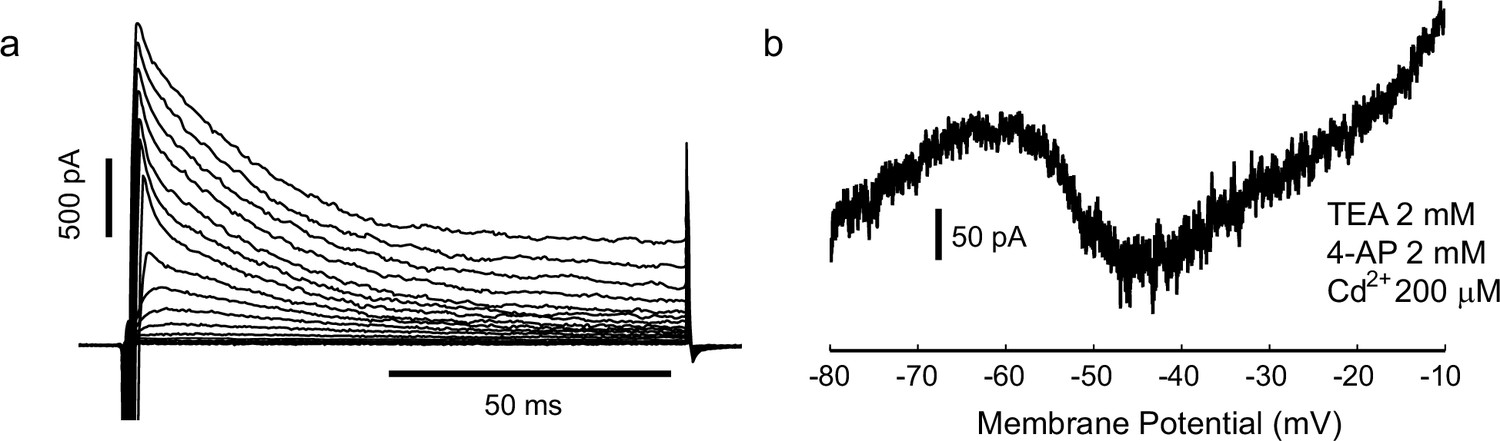
Voltage-gated sodium channel activation is required for noisy subthreshold voltage fluctuations.
(a) The amplitude of subthreshold fluctuations (see example waveform in inset) rises sharply above a threshold membrane potential (≈ −50 mV). Measurements for 23 cells indicated by different symbols. The curve shows a fit to a model of combined NaP (1950 channels) and gKt (180 channels) single channel noise, see Materials and methods for details). Inset: three example traces for one cell during step current stimulation of 60, 90 and 100 pA, showing the onset of membrane potential noise. (b) Fluctuations are blocked by applying tetrodotoxin (TTX, 100 nM). Membrane potential traces in another IS cell with and without perfusion of TTX, in response to the same current step, which is subthreshold in the steady-state after an initial doublet (top). Corresponding amplitude histogram of the membrane potential (bottom). (c) Membrane current in a cell-attached patch in response to repeated depolarizing steps, from RP-20 mV to RP+40 mV, as indicated. RP = resting membrane potential. Sodium channel openings are both transient, within 10 ms of the depolarization, and persistent, occurring late in the depolarization. (d) Transient and persistent openings at higher time resolution. (e) Whole-cell recordings confirming the presence of a TTX-sensitive, non-inactivating inward current at the firing threshold potential range (−55 mV). A slowly depolarising ramp (20 mV/s, from −80 mV to −10 mV, −70 mV holding potential) was applied in the presence of TEA (2 mM), 4-AP (2 mM) and Cd+2 (200 μM) in order to eliminate K+ and Ca+2 currents, with TTX (500 nM) added during the trial shown in red.
Figure 4 with 3 supplements
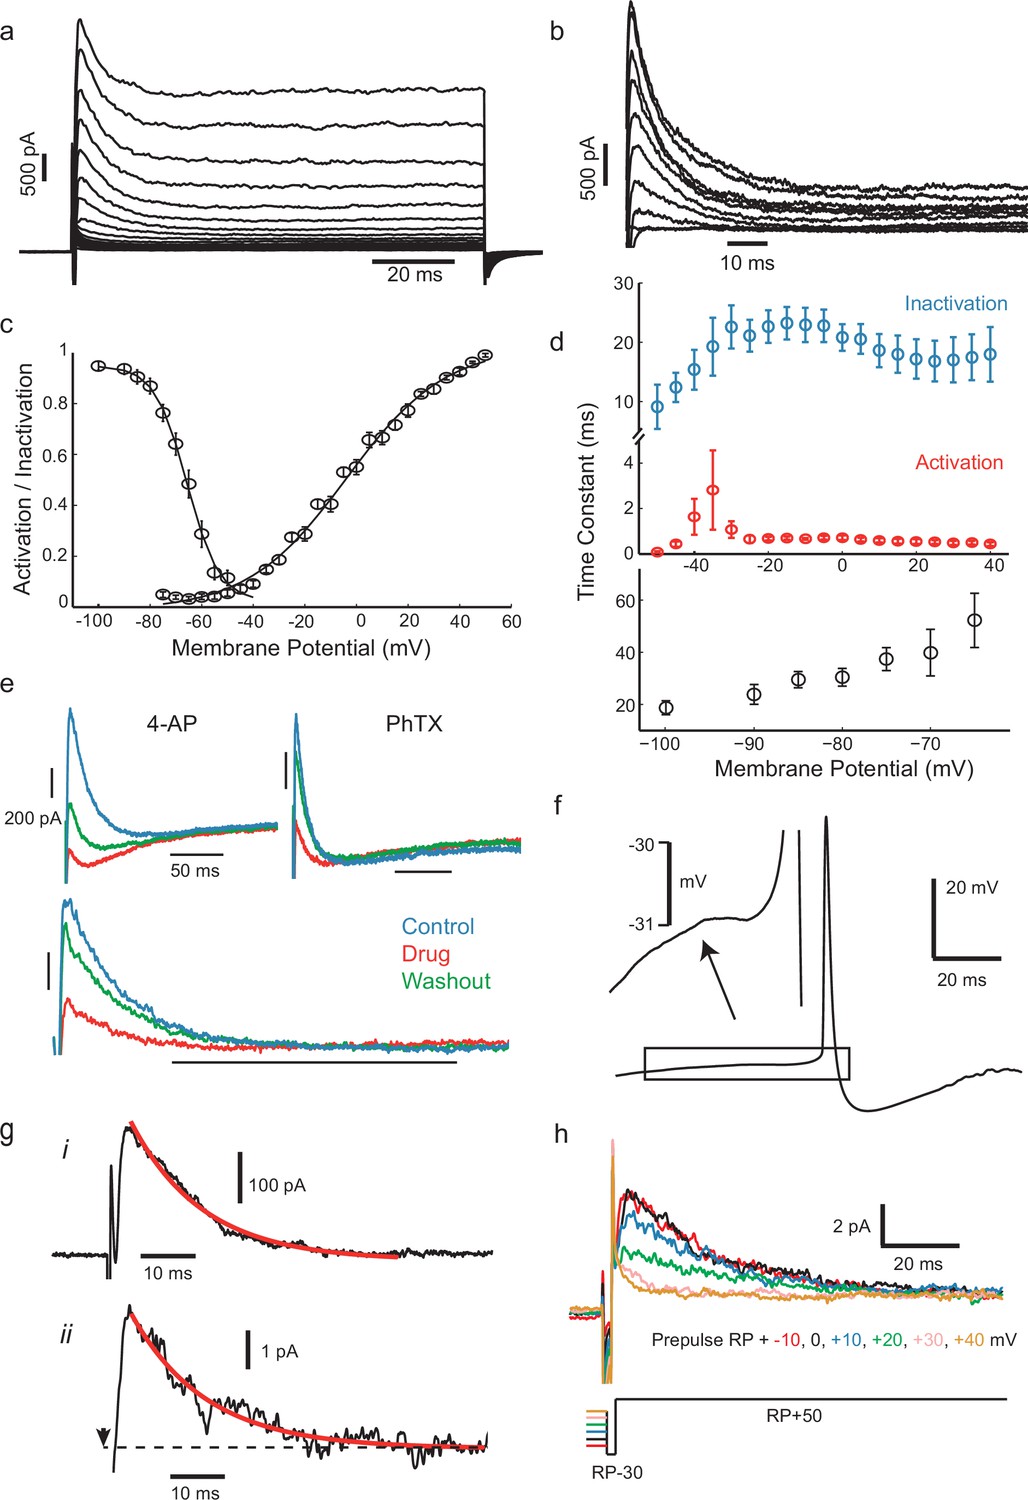
IS neurons express a fast transient outward current with similar kinetics to Kv4.
(a) Whole-cell currents in response to a family of voltage steps from −80 to 0 mV in 5 mV steps. (b) A-type current separated from other outward current components. The remaining step-evoked current following a pre-pulse (−30 mV, 200 ms) capable of inactivating A-type current was subtracted from total current. Voltage steps from −50 to +40 in 10 mV steps. Recordings were carried out in the presence of 5 mM TEA in order to block slowly activating K+ currents. (c) Voltage-dependence of steady-state activation and inactivation. (d) Activation (red) and inactivation (blue) time constants of dissected A-type current (top) and recovery of inactivation time constant (bottom). (e) The fast inactivating outward current found in these cells was sensitive to the A-type current blocker 4-AP (7 mM) and the Kv4-specific blocker phrixotoxin (PhTX, 5 µM). Top panels: total currents in control, drug application, and washout, as indicated. Lower panel: PhTX block of transient outward current fraction, separated as in (b). (f) Average of 537 aligned APs following ISIs lasting longer than 100 ms shows a small prespike dip or inflection, attributed to the activation of the transient K+ current. (g), (i) Isolated transient outward current with a single exponential fitted to the decay phase (τ = 13.05 ms). (ii) Example current from a cluster of transient K+ channels in a cell-attached patch (step from RP-30 mV to RP+50 mV at the time indicated by arrow, outward current plotted upwards), fitted with the same exponential time constant as in (i). (h) Dependence of patch current on the potential of a 500 ms prepulse before a step from RP-30 to RP+50 mV, showing that it inactivates over the range RP+10 mV to RP+40 mV.
-
Figure 4—source data 1
Numerical values for Figure 4c,d and e.
- https://doi.org/10.7554/eLife.16475.010
Figure 4—figure supplement 1
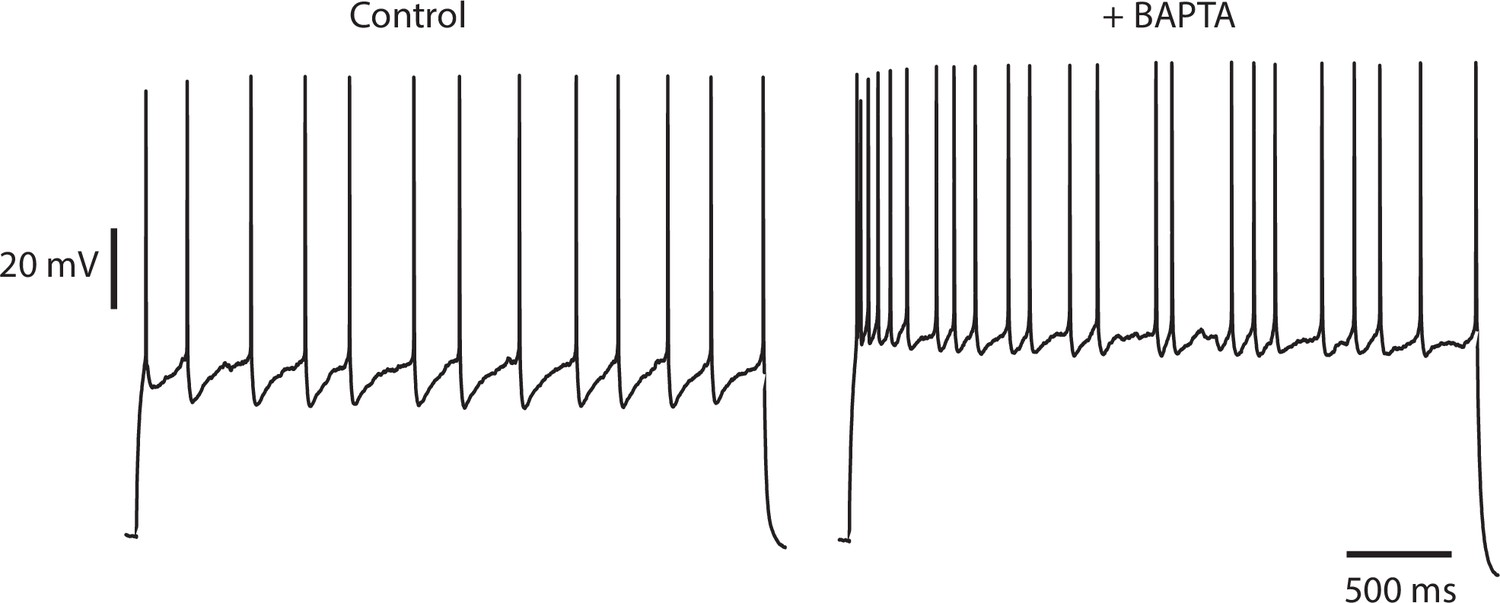
Irregularity is not diminished by buffering intracellular calcium.
An IS cell recorded with a patch pipette containing normal intracellular solution and stimulated with a steady current stimulus of 150 pA (left) is then repatched with a pipette containing intracellular solution, to which 10 mM BAPTA, a fast calcium and high-affinity buffer has been added (right), and stimulated with the same current level. Control CV(ISI) = 0.22 (125 ISIs), BAPTA CV(ISI) = 0.44 (129 ISIs, excluding initial 700 ms transient responses).
Figure 4—figure supplement 2
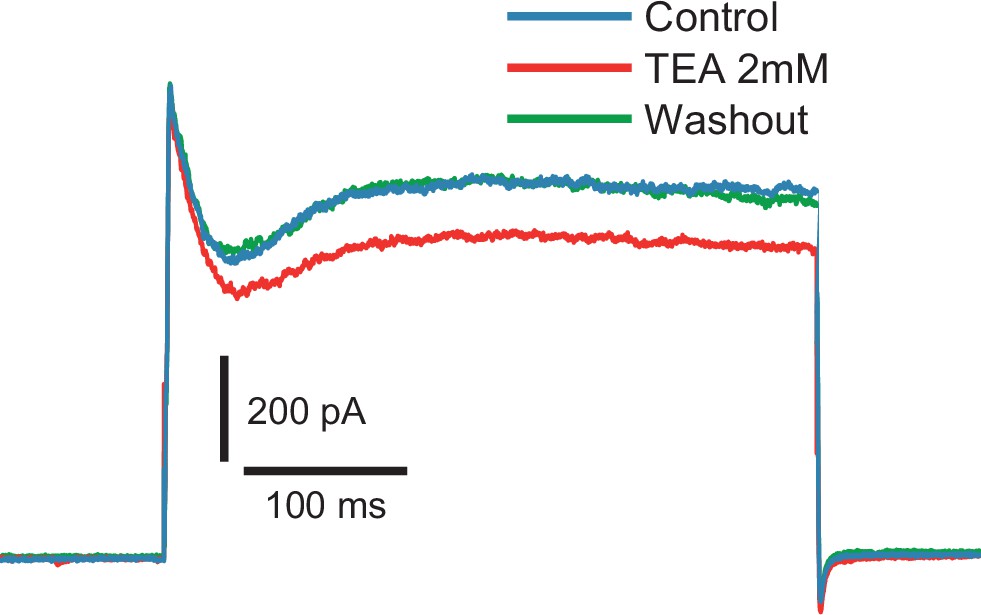
Fast inactivating outward current is insensitive to TEA (2 mM).
Voltage steps to −10 mV from −80 mV holding potential (n = 6).
Figure 4—figure supplement 3
Gad2-GFP cortical interneurons from primary cultures display the two conductances required for spiking irregularity.
(a) Cells expressed a large, fast-inactivating outward current (n = 4). Steps from −75 mV to 0 mV, held at −80 mV (b) In some cases (n = 3), after measuring spike irregularity, cells were repatched with a Cs based solution and locally perfused with Cd, TEA and 4AP, to block K+ and Ca2+ currents. Slow ramp depolarization (from −80 to −10, 20 mV/s) revealed persistent sodium current activating approximately at −55 mV, as in the slice preparation.
Figure 5 with 3 supplements
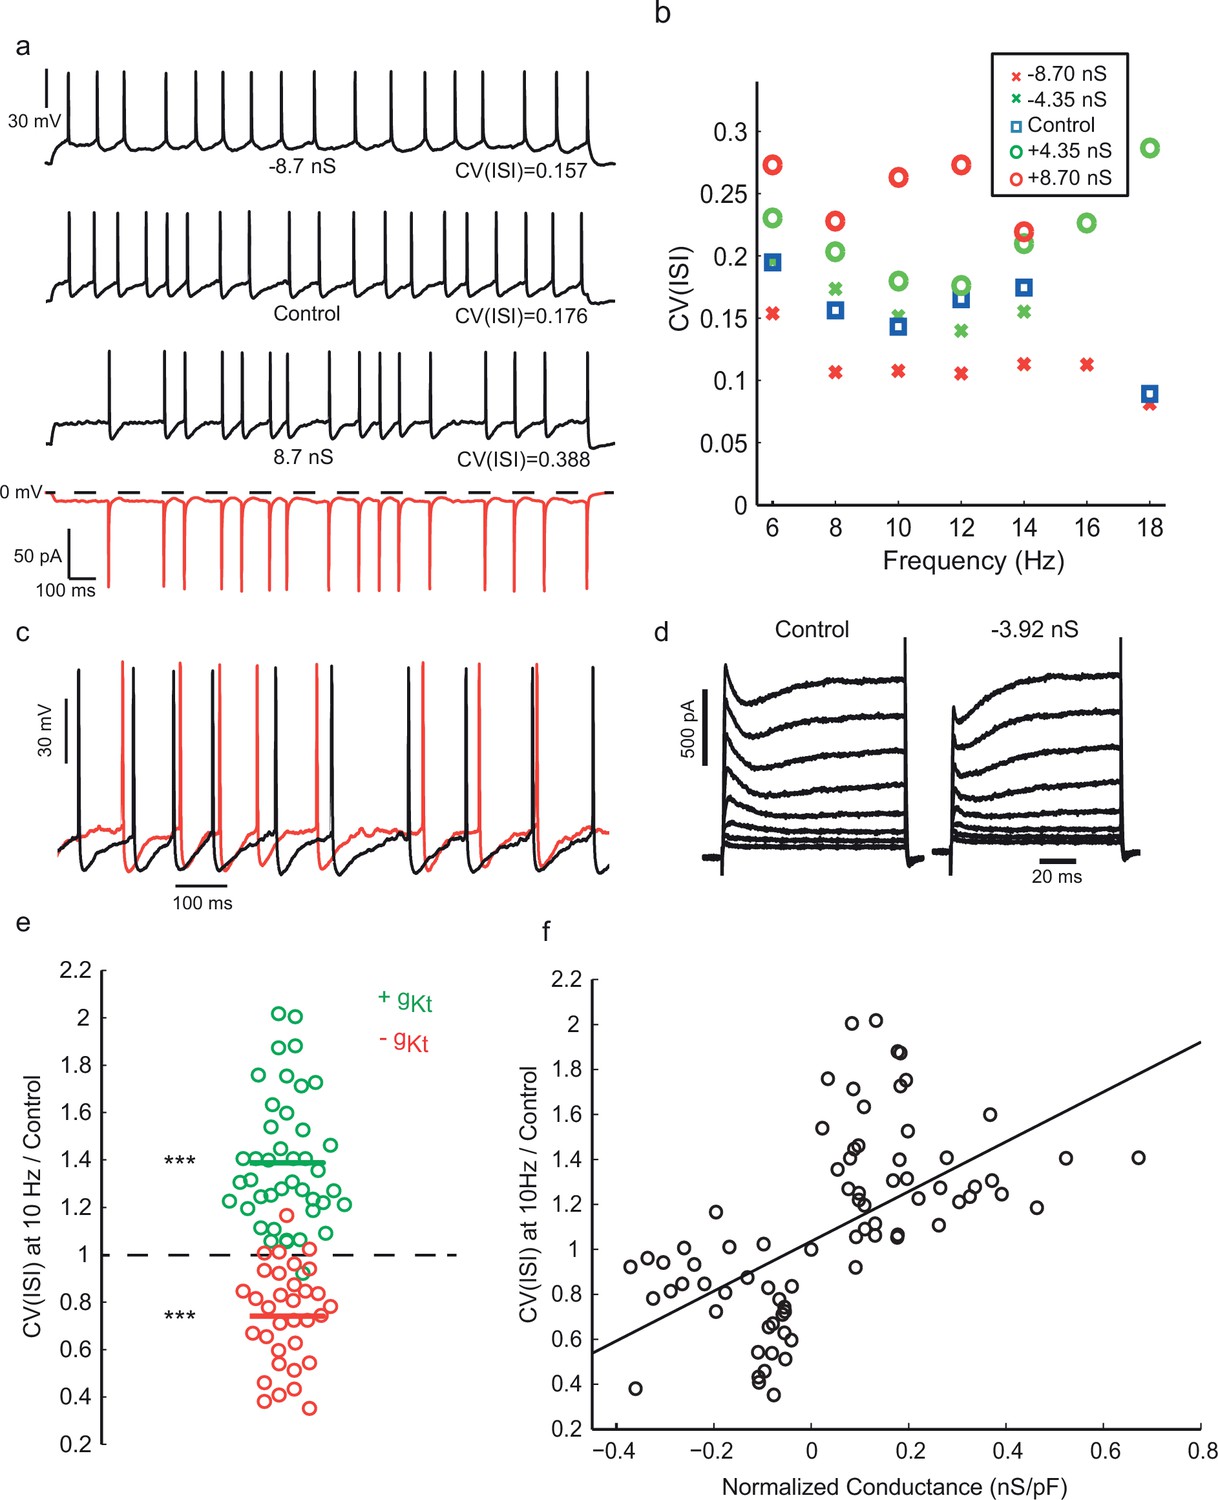
Injection of synthetic gKt modulates spiking irregularity.
(a) Positive and negative gKt injection in the same cell at the same frequency range (8–10 Hz). While −8.7 nS injection (gmax0, See Materials and methods) caused a reduction in the AHP amplitude and regularized the firing pattern, injecting +8.7 nS created more evident noisy plateaus before some APs, resulting in more irregular firing. Red bottom trace shows the current passed during the positive gKt conductance injection (outward, hyperpolarizing current plotted downwards). (b) Effect of gKt on spiking irregularity in another cell, showing its consistency over different firing frequencies. (c) Close-up of the membrane potential trajectories from (a), +gKt (red) superimposed on control (black), showing extended and increased noisy subthreshold fluctuations produced by the gKt conductance. (d) Potassium currents during a family of step depolarizations from −80 mV to −60, −50, … +10 mV. Subtraction of 3.92 nS of the fast-inactivating Kv current by dynamic-clamp largely cancels the transient component, leaving a residual, non-inactivating delayed rectifier current. (e) Relative changes in CV(ISI) at 10 Hz firing frequency induced by addition or subtraction of gKt conductance. Data from 42 cells: points are individual measurements, with some cells measured at two or more different conductance levels. Wilcoxon non parametric test, p<9.8 × 10⁻¹⁶ for positive gKt, and p<1.6 × 10⁻⁸ for negative gKt. (f) Relationship between relative change in CV(ISI) at 10 Hz firing frequency and injected gKt conductance. The linear regression fit is superimposed. Pearson’s correlation r = 0.59, p<2.66 × 10⁻¹².
-
Figure 5—source data 1
Numerical values for Figure 5e and f.
- https://doi.org/10.7554/eLife.16475.015
Figure 5—figure supplement 1
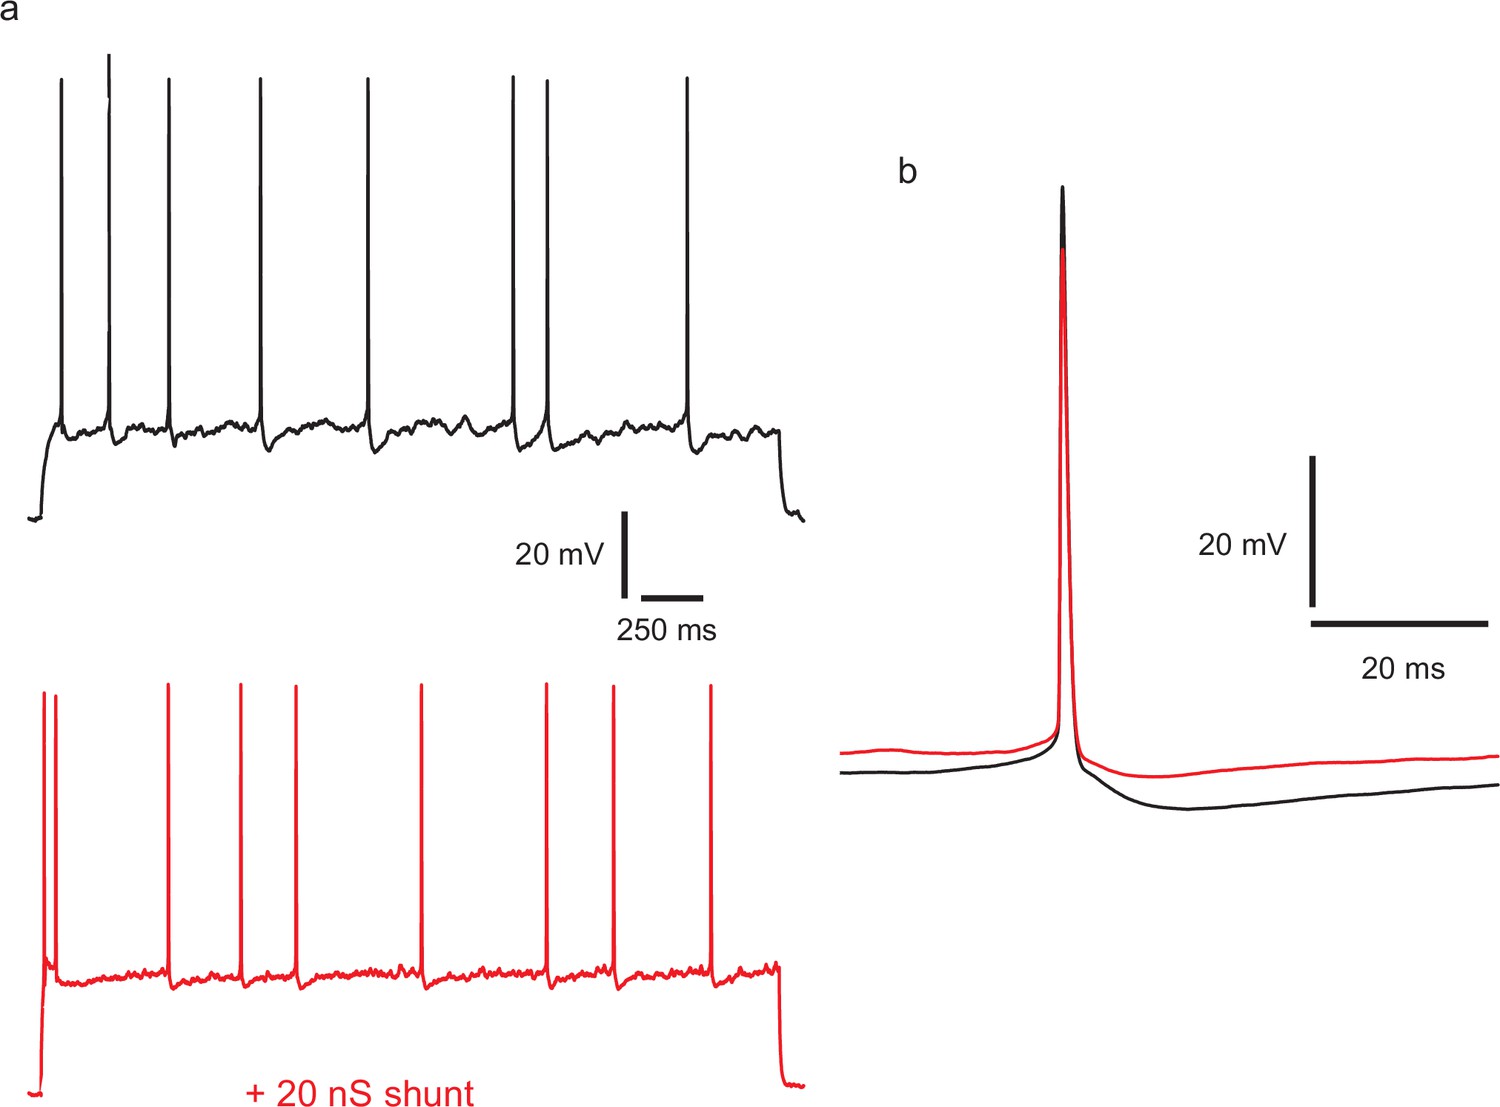
Injecting a shunting conductance at the soma, causing a large reduction in input resistance, modifies the action potential amplitude and shape, and divides down membrane potential fluctuations, but does not regularize firing.
(a) Top: example of control spiking during a 45 pA current step. A linear conductance of 2 nS, reversing at −70 mV was applied during the lower trace (red), and stimulus current increased to 115 pA to produce an equal firing frequency. CV in the control, calculated over 97 ISIs in repeated trials and excluding initial 400 ms of responses, was 0.46. CV with the shunting conductance, was similar, at 0.385 (195 ISIs). (b) Overlaid averaged action potentials, with (red) and without (black) the shunting conductance.
Figure 5—figure supplement 2
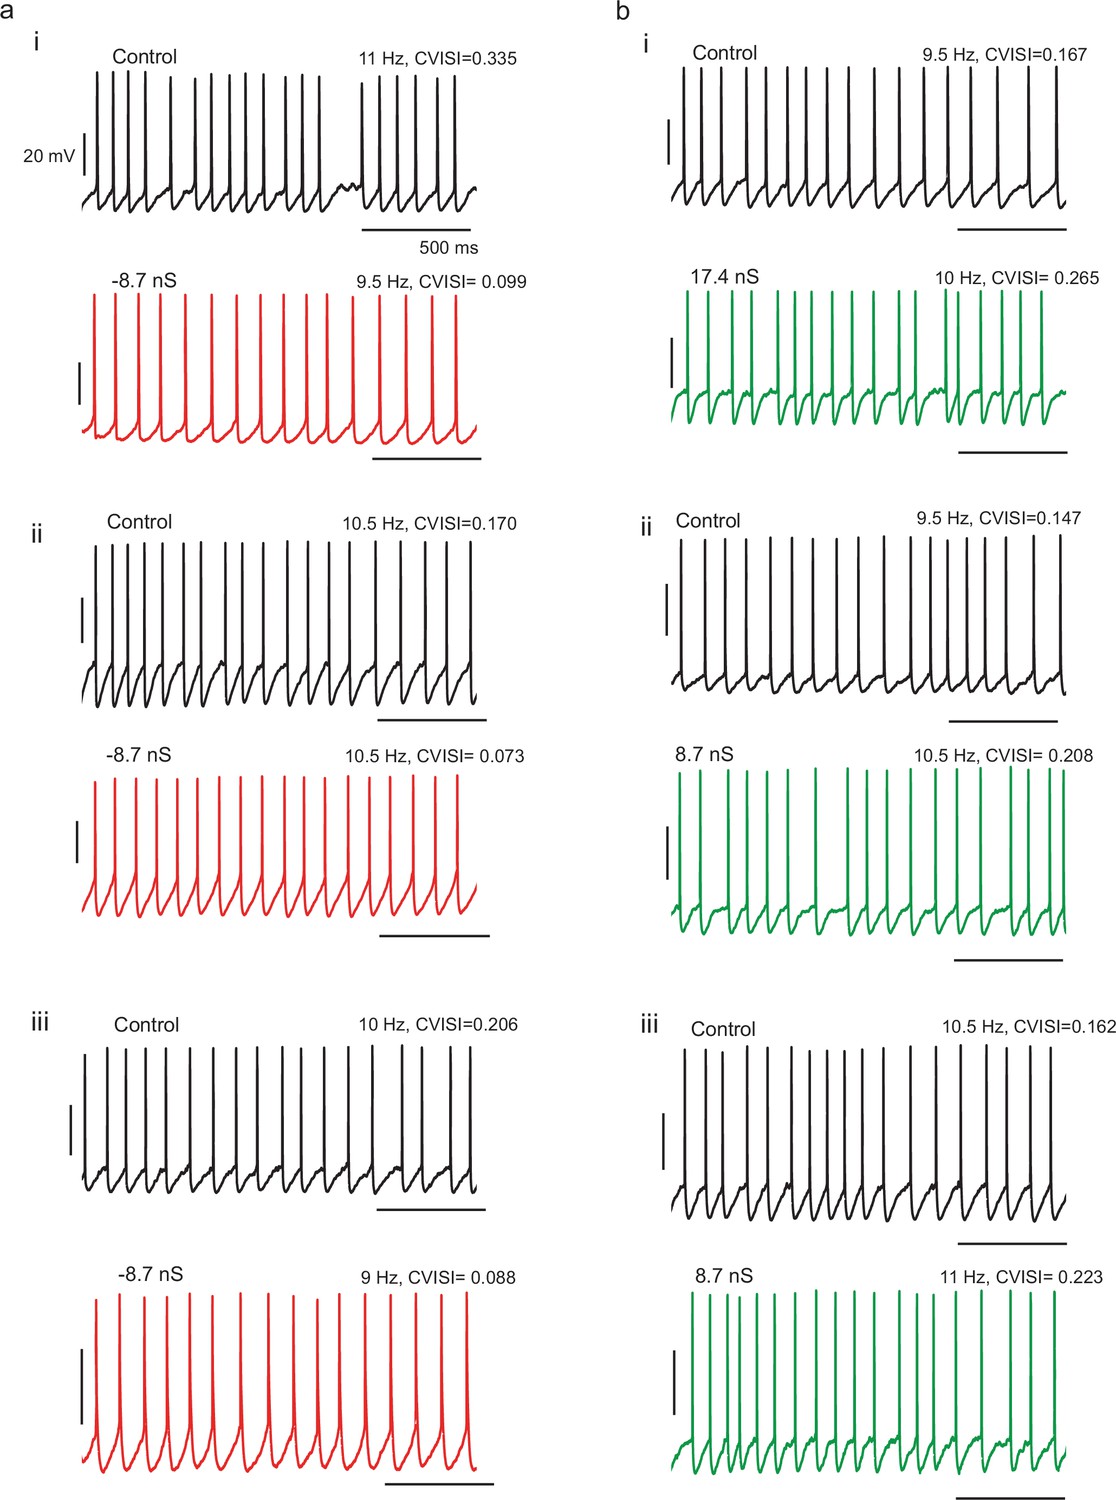
Example spike patterns for three different cells with (a) negative gKt conductance injection and three different cells with (b) positive gKt injection, showing decreased and increased irregularity respectively.
https://doi.org/10.7554/eLife.16475.017
Figure 5—figure supplement 3
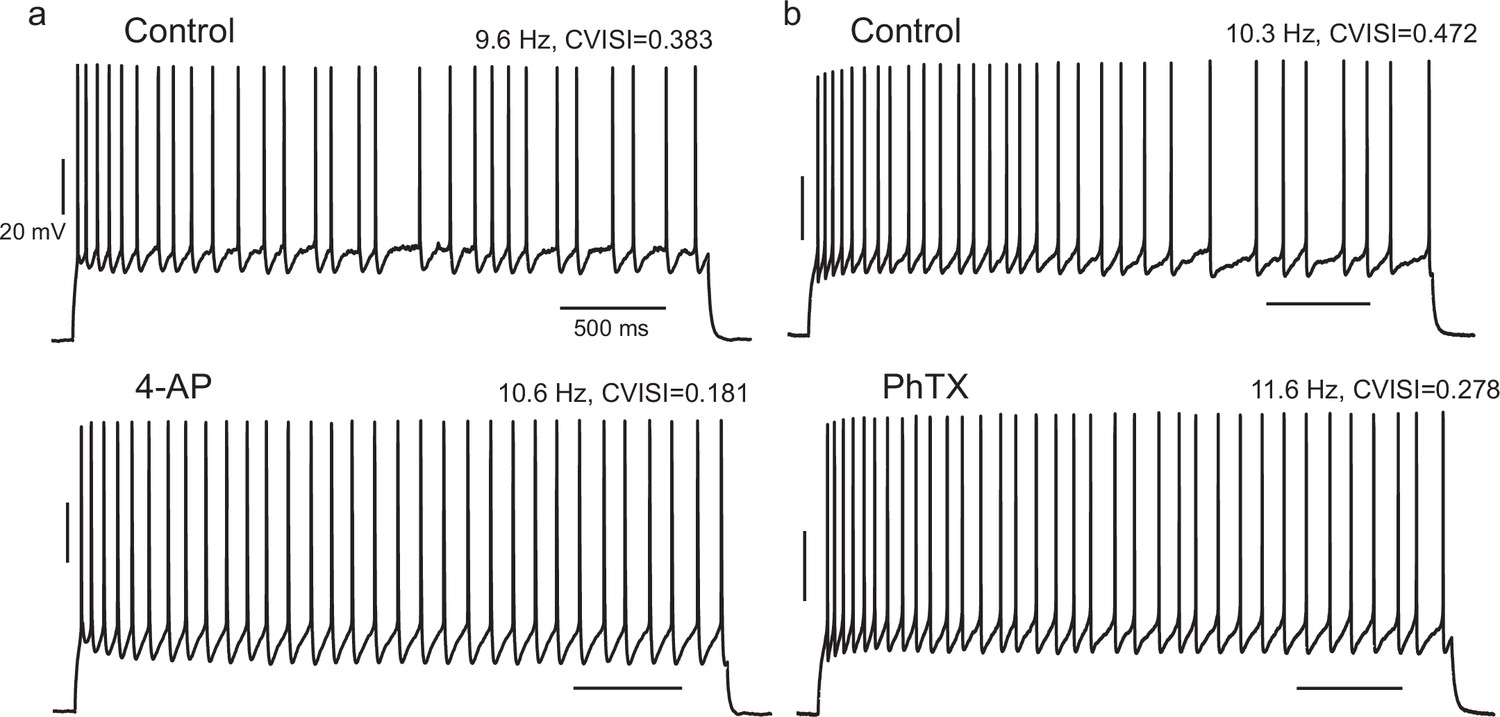
Effect of pharmacological block of A-type current in IS cells is consistent with the effect of the negative gKt injection.
(a) When 4-AP was locally perfused at 200 or 50 µM, the CVISI decreased by 44% (n = 5), while PhTX 5 µM caused a mean 23% reduction (b, n = 3).
Figure 6 with 1 supplement

Irregular firing in a simple biophysically-based model.
(a) Two-compartment model with Nav, Kv1, Kv3 and gKt-type conductances shows complex spike timing, as a result of unstable subthreshold oscillations and trapping in a nearly-fixed state. = 7 nS, stimulus current, 100 pA. For other parameters, see Materials and methods. (b) Unstable subthreshold oscillations and a fixed-point 'ghost' seen in the phase trajectory of the model with zero noise in the (mKt, hNa, V) subspace (101 pA, 7 nS ). (c) Adding noisy non-inactivating (persistent) sodium channel conductance(equivalent to 500 channels) and noisy gKt (equivalent to 7 nS or 700 channels) masks subthreshold oscillations, but preserves high spike irregularity. Stimulus current 90 pA. (d) gKt channel noise is strongly amplified by voltage-dependent sodium conductance. Subthreshold membrane potential noise for a stimulus current of 72 pA, with 7 nS and 10 nS , either stochastic or deterministic, and for the case in which all sodium current is blocked ('TTX'), and stimulus current of 90 pA, to polarize the membrane to the same range of membrane potential as without sodium current.
Figure 6—figure supplement 1
Statistics and significant recurrence and determinism of time series generated by the computational model.
(a) Example ISI distribution for the stochastic model, with 700 gKt channels, 500 NaP channels, and stimulus current of 83 pA. Note similarity to experimental ISI distribution (Figure 1dii). (b) Example cross-recurrence plot between two step depolarizations of the biophysical model with a small level of stochastic channel conductance (40 pS NaP, 30 pS gKt). (c) Level of recurrence, indicated by the dashed line, was significantly higher (p<1.3 × 10⁻¹³, z-test) than the distribution of recurrence when one time series in each comparison was randomly shuffled (histogram). (d) Level of determinism was similarly higher than that of randomly-shuffled surrogates (p<9.3 × 10⁻⁵). As the level of stochasticity is increased, the significance of both recurrence and determinism diminishes. Stimulus consisted of 96 pA steps lasting 20 s, total number of ISIs was 10,099, average firing frequency = 10.1 Hz, CV(ISI) = 0.22. See Materials and methods for details of analysis.
Figure 7
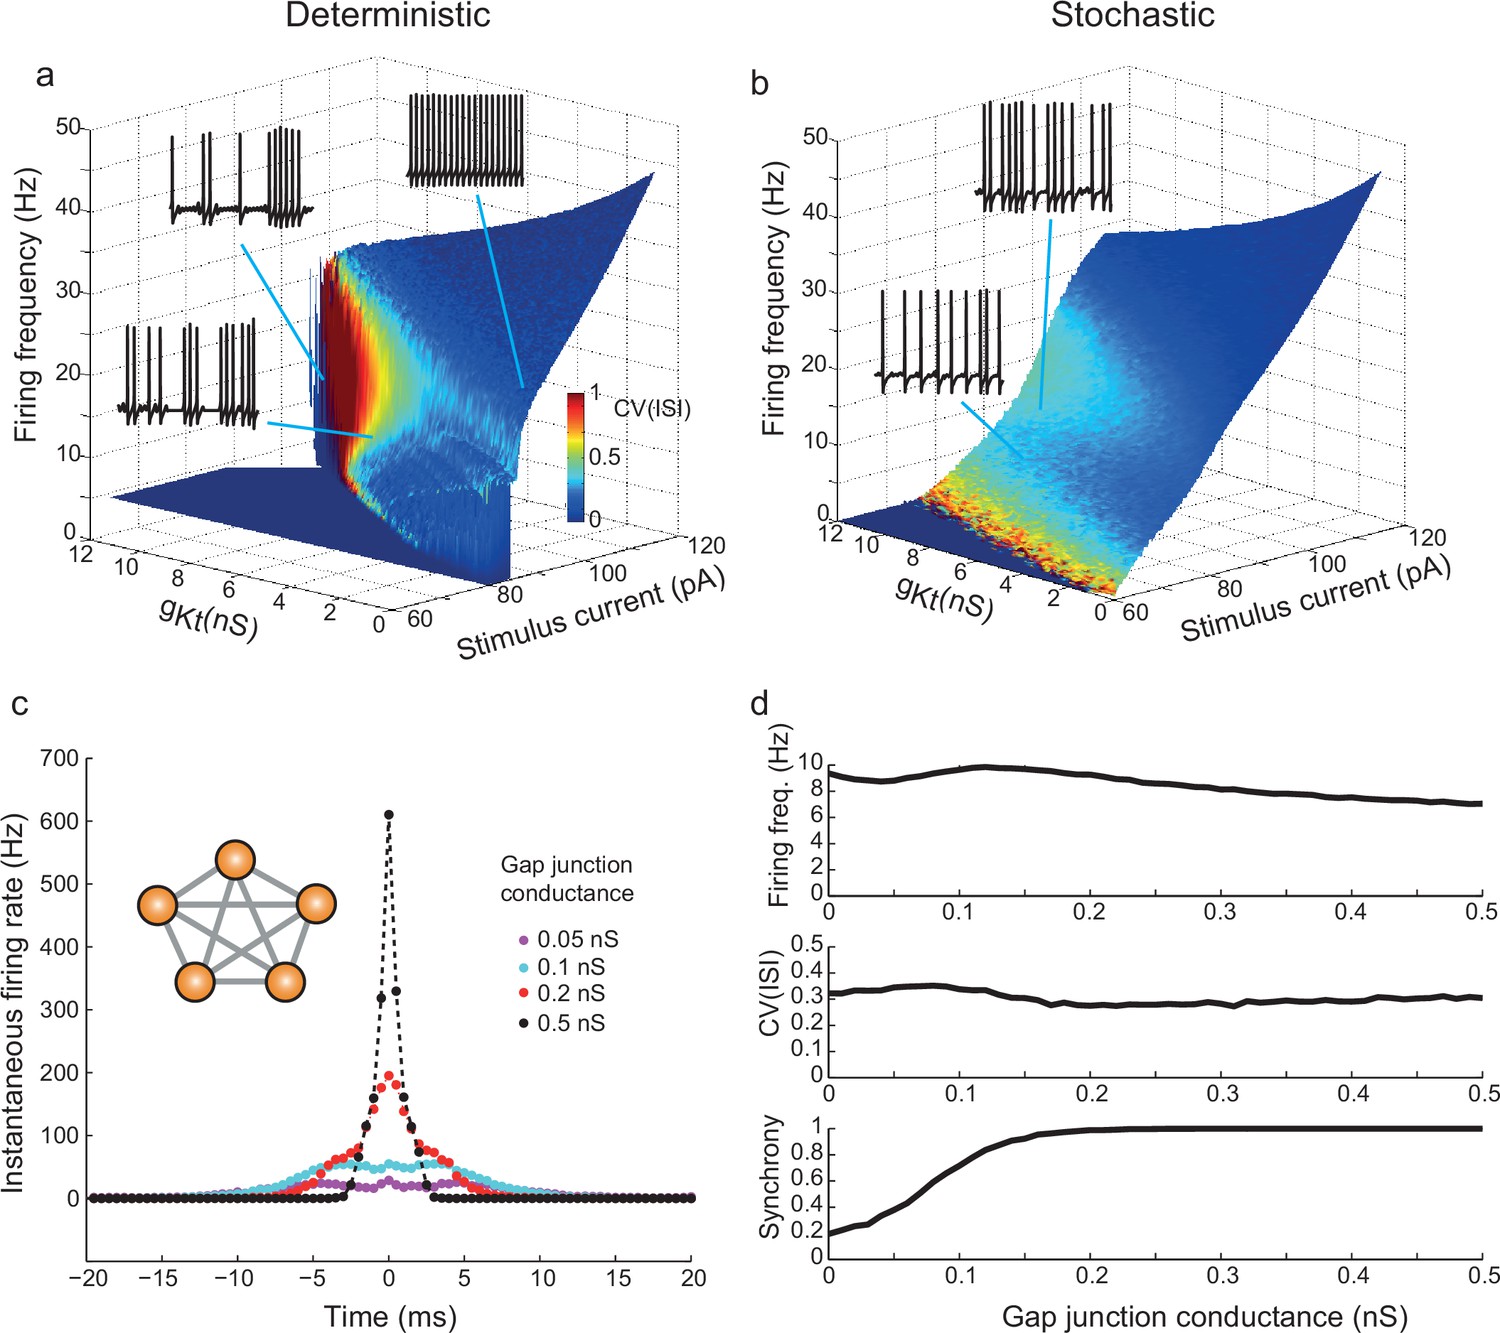
gKt enhances irregularity in deterministic and stochastic biophysical models.
(a) Surface showing the dependence of firing frequency on the total gKt and stimulus current level, colored according to the CV(ISI) of firing. Regions of low CV(ISI) correspond to periodic firing, while regions of high variability arise through the pausing and unstable subthreshold oscillation mechanisms. (b) Analogous plot for the stochastic model containing voltage-dependent noise fractions due to 1000 persistent sodium channels, and different numbers of 10 pS gKt channels equivalent to the conductance indicated. Inset example voltage traces (1 s of firing): (a) bottom: 101 pA, 7 nS; top left: 106.7 pA, 10 nS ; top right: 89 pA, 0.5 nS. (b) bottom: 90 pA, 500 channels (= 5 nS); top: 95 pA, 500 channels. (c,d) Irregularity in simulated gap-junction-coupled ensemble of IS cells (700gKt channels (= 7 nS), 500 NaP channels (= 5 nS)). (c) Cross-correlation of spike trains in one pair of neurons within a symmetrically-connected network of five IS neurons (inset), each excited by a constant stimulus of 90 pA. Exact synchrony appears as coupling is strengthened, as indicated by the single sharp peak centered on 0 ms. See Materials and methods, Spike Analysis, for details of calculation of cross-correlation. (d) Firing frequency, CV(ISI) and synchrony – the fraction of spikes in one cell which occur within ± 10 ms of spikes in the other cell – as a function of the gap-junctional conductance. CV(ISI) is undiminished even for highly synchronous firing, with strong gap-junctional conductance.
Figure 8

Synchronization to oscillating inhibition is controlled by gKt.
(a) Naturalistic stimulus protocol. The cell was stimulated with a constant step of AMPA conductance (gAMPA, reversing at 0 mV) with added conductance Ornstein-Uhlenbeck noise (standard deviation 2% of the step amplitude, τ = 5 ms), combined with a sinusoidal GABAA conductance (gGABA, reversing at −60 mV) and introduction of positive, zero or negative gKt. gAMPA was adjusted so that the cell fired close to the frequency of the gGABA inhibitory oscillation. (b) Effect of adding gKt on a slightly irregular-firing cell at 10 Hz gGABA. (i) Step current response (black), response to oscillatory conductance stimulus with (green) or without (blue) addition of 3.57 nS gKt. (ii) Spike entrainment synchrony (see Materials and methods, Spike Analysis) to the 10 Hz gGABA oscillation as a function of the oscillation amplitude. Synchrony rises progressively with oscillation amplitude in control (blue), and is depressed by the addition of 3.57 nS gKt (green). (iii) Spike phase histogram for pooled responses to lower amplitude gGABA oscillations (up to 1 nS), showing a reduction in the sharpness of synchrony. (c) Example of subtracting gKt in another irregular-firing cell at 10 Hz gGABA. (i) example responses. (ii) Subtraction of gKt (red) increased synchrony to gGABA oscillation over a wide range of amplitudes, when compared to control (blue). (iii) spike phase histograms for pooled responses up to 1 nS gGABA oscillations. Subtraction of gKt enhances the phase preference. (d) Lack of effect of gKt on synchronization to 40 Hz (gamma) oscillation. (e) Summary of effects of gKt perturbation on synchrony in different cells. Each symbol denotes an experiment on an individual cell, showing the ratio of synchrony, evaluated at ≈1/3 of the maximum gGABA amplitude applied in each case, during gKt injection, normalized to its control value with no injection. 10 Hz: gKt addition (n = 10, green) and subtraction, (n = 10, red); 40 Hz: gKt addition (n = 6, green) or subtraction (n = 7, red). At 10 Hz, but not 40 Hz, gKt perturbation has a significant effect. Wilcoxon nonparametric rank sum test, p=6.5 × 10⁻⁵ for both positive and negative gKt, and p=0.36 and 0.69 at 40 Hz for positive and negative gKt respectively.
-
Figure 8—source data 1
Numerical values for Figure 8b,c,d and e.
- https://doi.org/10.7554/eLife.16475.024
Videos
Video 1
Movie showing dynamics in phase space of the deterministic model.
Corresponds to the trajectory shown in Figure 6b.
Additional files
-
Source code 1
- https://doi.org/10.7554/eLife.16475.025
Download links
A two-part list of links to download the article, or parts of the article, in various formats.
Downloads (link to download the article as PDF)
Open citations (links to open the citations from this article in various online reference manager services)
Cite this article (links to download the citations from this article in formats compatible with various reference manager tools)
Stochastic and deterministic dynamics of intrinsically irregular firing in cortical inhibitory interneurons
eLife 5:e16475.
https://doi.org/10.7554/eLife.16475


