Set1/COMPASS and Mediator are repurposed to promote epigenetic transcriptional memory
- Northwestern University, United States
Figures
Figure 1 with 1 supplement
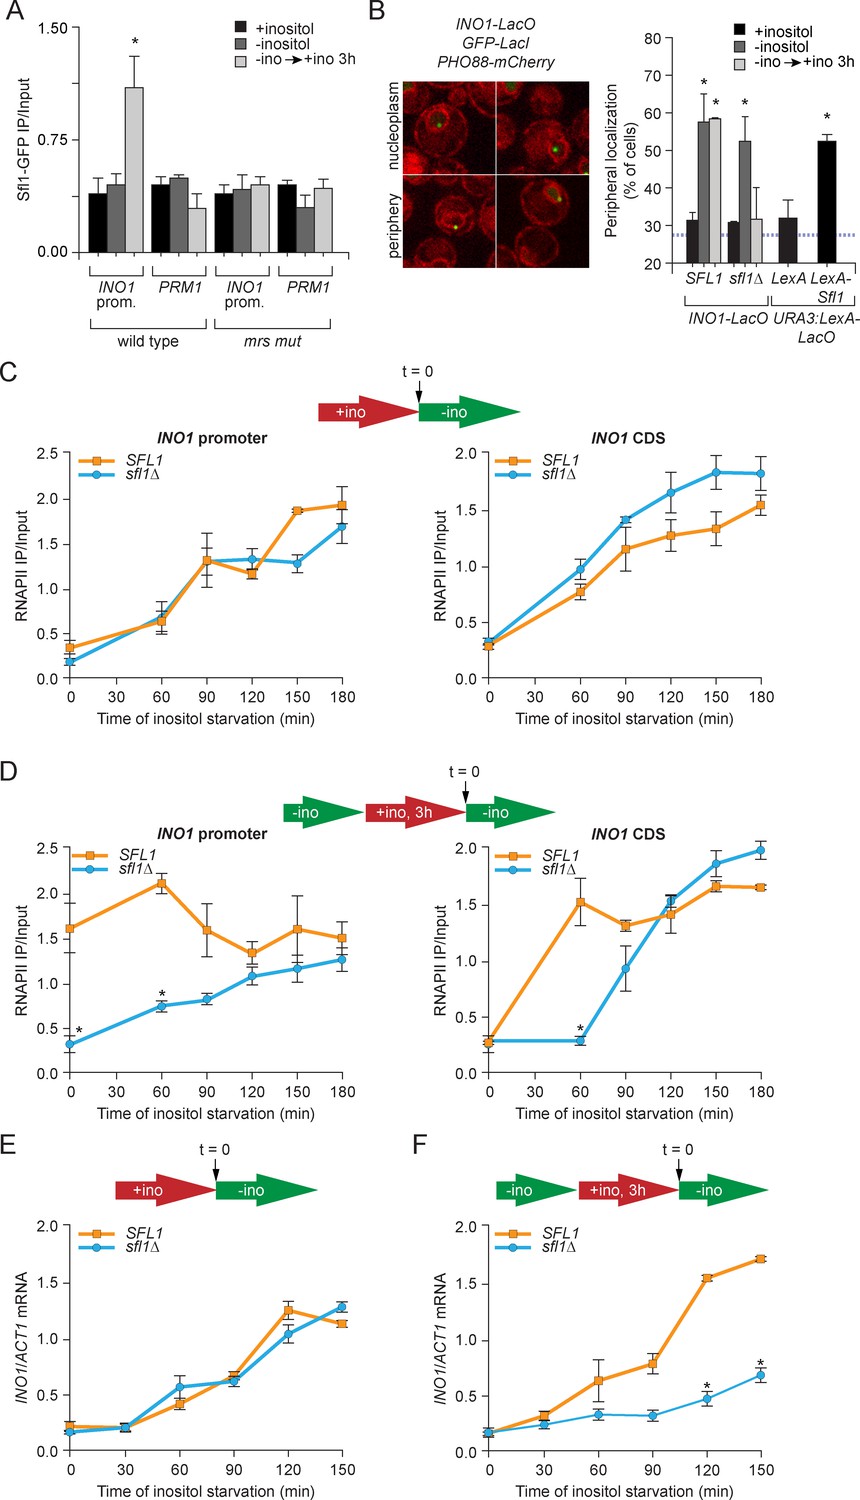
Sfl1 binds to the MRS to promote transcriptional memory.
(A) Chromatin immunoprecipitation (ChIP) of Sfl1-GFP from wild type and mrs mutant INO1 strains, quantified relative to the input fraction using primers to amplify the INO1 promoter (−348 to −260) or the PRM1 CDS, a repressed locus. The averages of three biological replicates are shown ± standard error of the mean. *p<0.05, compared with repressing conditions (Student’s t-test). (B) Left: representative confocal micrographs of INO1-LacO in a strain expressing GFP-LacI and PHO88-mCherry scored as either nucleoplasmic or nuclear periphery. Right: quantified chromatin localization of the percentage of the population in which the indicated locus colocalized with the nuclear envelope. INO1-LacO in either a wild type or sfl1∆ strain was localized in cells grown in repressing (+inositol), activating (-inositol) or memory conditions (switched from medium lacking inositol to medium containing 100 μM inositol for 3 hr (−ino → +ino). *p<0.05, compared with repressing conditions (Student’s t-test). URA3:LexA-LacO was localized in cells expressing either LexA or LexA-Sfl1 grown under repressing conditions. *p<0.05, compared with LexA alone (Student’s t-test). The hatched blue line indicates the baseline for this assay (Brickner and Walter, 2004). (C and D) ChIP of RNA polymerase II from wild-type and slf1∆ cells fixed at indicated time points during activation (C) and reactivation (D). At time = 0, cells were shifted from repressing medium containing 100 μM inositol (red arrow in schematic) to medium without inositol (green arrow in schematic). For reactivation, cells were shifted from activating medium to repressing medium containing 100 μM inositol for 3 hr. Left panels were quantified relative to input using the INO1 promoter primer set (-348 to -260, relative to the ATG); right panels were quantified relative to input using INO1 coding sequence primer set (+663 to +798, relative to ATG). *p<0.05, compared with the repressing condition (Student’s t-test). (E and F) INO1 activation (E) or reactivation (F) in wild type and sfl1∆ cells (schematic as in C and D). Cells were harvested at the indicated time points, and INO1 mRNA levels were quantified relative to ACT1 mRNA levels by RT-qPCR. The averages of three biological replicates are shown ± standard error of the mean. *p<0.05, compared with the same time point in the SFL1 strain (Student’s t-test).
Figure 1—figure supplement 1
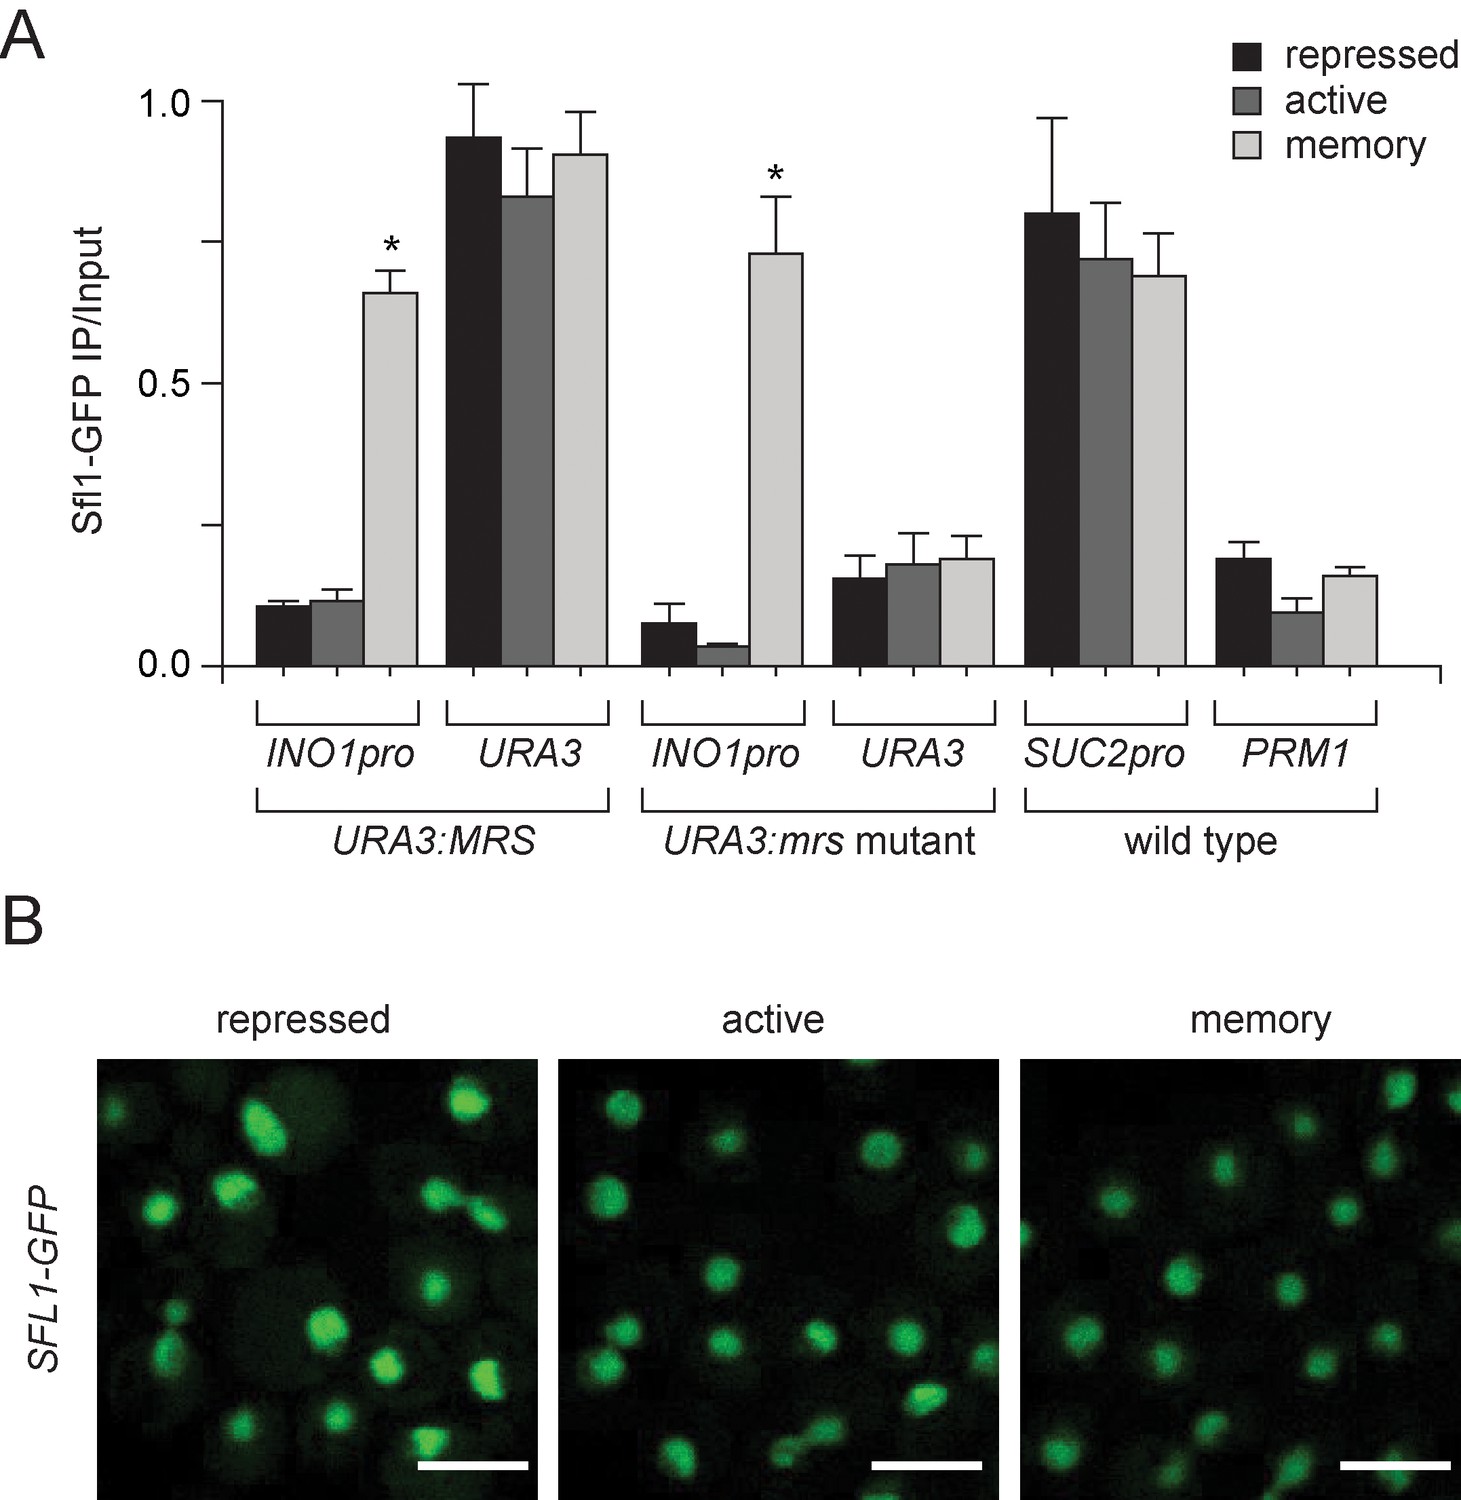
Sfl1 binding to the INO1 promoter is regulated by its context.
(A) Chromatin immunoprecipitation (ChIP) of Sfl1-GFP from cells having the MRS or mrs mutant inserted beside URA3 grown under the indicated conditions. The recovery of the INO1 promoter, URA3, the SUC2 promoter and PRM1 was quantified by qPCR relative to input. Averages of three biological replicates and standard error of the mean. *p<0.05, compared with repressing condition (Student’s t-test). (B) Confocal sum projections of stacks of SFL1-GFP cells grown under the indicated conditions, imaged using identical settings. Scale bar = 5 µm.
Figure 2 with 1 supplement

H3K4 dimethylation is an essential memory mark that is deposited by COMPASS.
(A and B) Chromatin immunoprecipitation using anti-H3K4me2 from wild-type, sfl1∆ or mrs mutant strains grown under repressing, activating or memory conditions, quantified using the INO1 promoter primer set (−348 to −260) or, as a negative control, the PRM1 CDS primer set. *p<0.05, compared with the repressing condition (Student’s t-test). (B) Recovery was quantified relative to input fractions using the promoter primer set or three different primer sets at the following postitions: pro, -348 to -260; CDS1, +41 to +161; CDS2, +361 to +499; CDS3, +663 to +798. (C) ChIP using anti-RNAPII from wild type and histone mutant (H3K4A or H3K4R) strains grown under repressing, activating and memory conditions using primers to the INO1 promoter or PRM1 CDS. *p<0.05, compared with the repressing condition (Student’s t-test). (D) Top: immunoblot against H3K4me2 or Tubulin in whole cell extracts from the indicated strains. A strain expressing Rpl13-FKBP and having the COMPASS subunit Swd1 tagged with FRB-GFP was treated with 1 µg/ml rapamycin. Bottom: confocal micrographs of Swd1-FRB-GFP at the indicated times after addition of rapamycin. (E and F) ChIP of H3K4me2 (E) and RNAPII (F) from Swd1-FRB-GFP strain grown under activation (-ino) or memory conditions (−ino → +ino) using primers to amplify the INO1 promoter or the PRM1 CDS. Cells were fixed at the indicated times after addition of either DMSO (mock) or rapamycin. *p<0.05, compared with t = 0 (Student’s t-test).
Figure 2—figure supplement 1
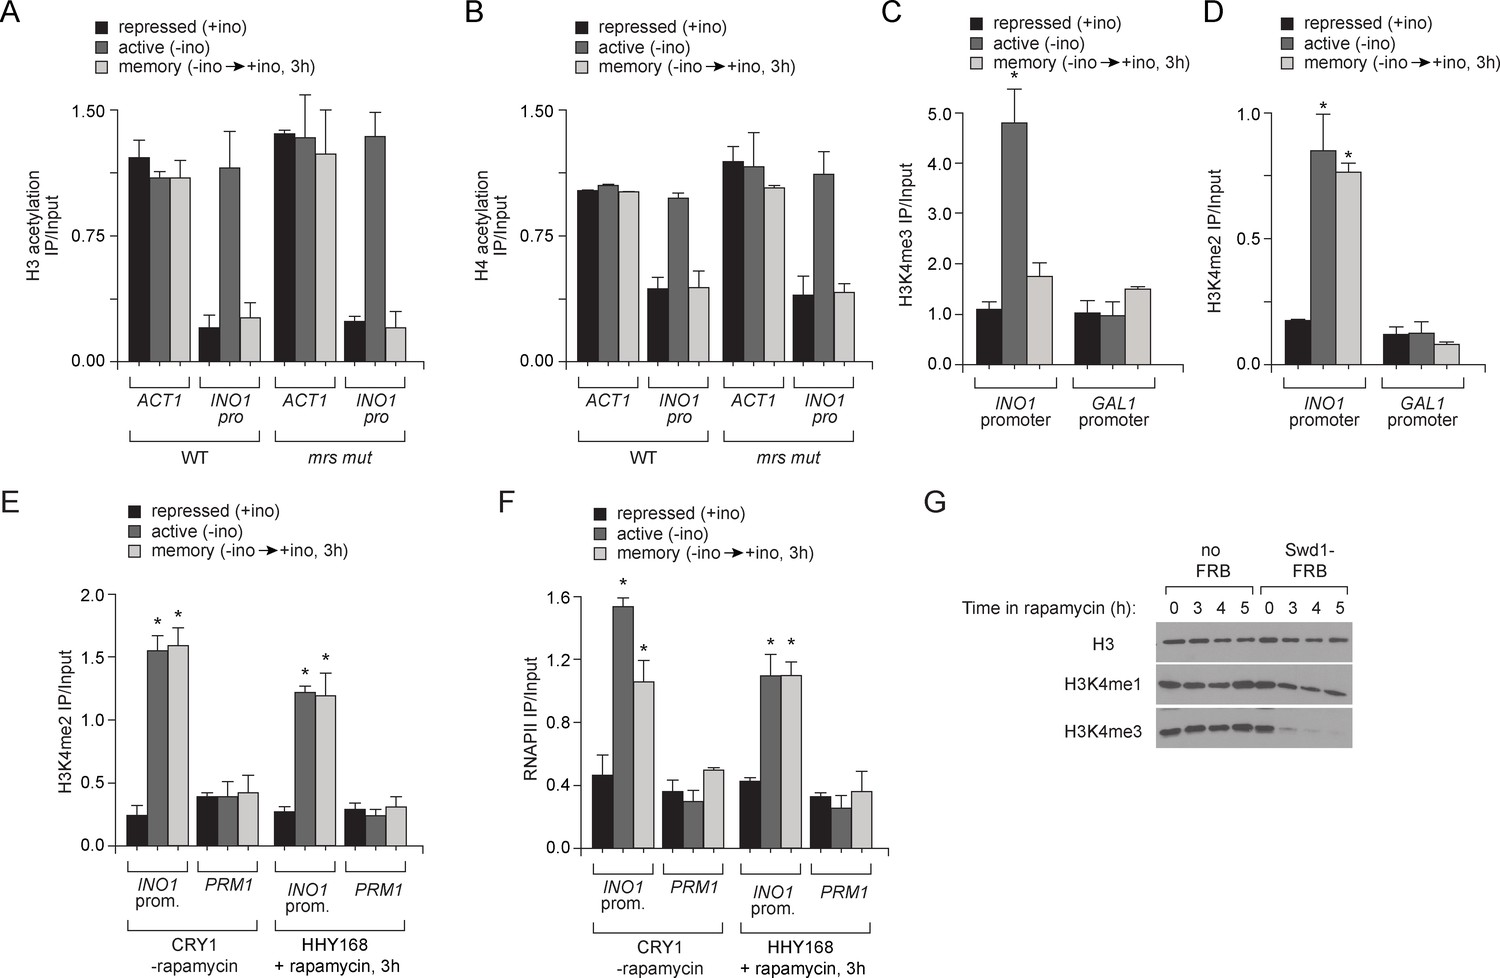
Chromatin signature of transcriptional memory.
Chromatin immunoprecipitation (ChIP) using anti-acetyl H3 (A), anti-acetyl H4 (B), anti-H3K4me3 (C) and anti-H3K4me2 (D) from either wild-type or mrs mutant strains grown under repressing, activating or memory conditions. ACT1 coding sequence serves as a positive control and GAL1 promoter serves as a negative control. *p<0.05, compared with the repressing condition (Student’s t-test). (E and F) Chromatin immunoprecipitation (ChIP) using anti-H3K4me2 (E) or anti-RNAPII (F) for CRY1 cells and HHY168 cells after 3 hr of rapamycin treatment. (G) Immunoblots against histone H3, H3K4me1 and H3K4me3 from lysates prepared from HHY168 (no FRB) or ADY23 (Swd1-FRB-GFP) at the indicated times after addition of 1 µg/ml rapamycin.
Figure 3
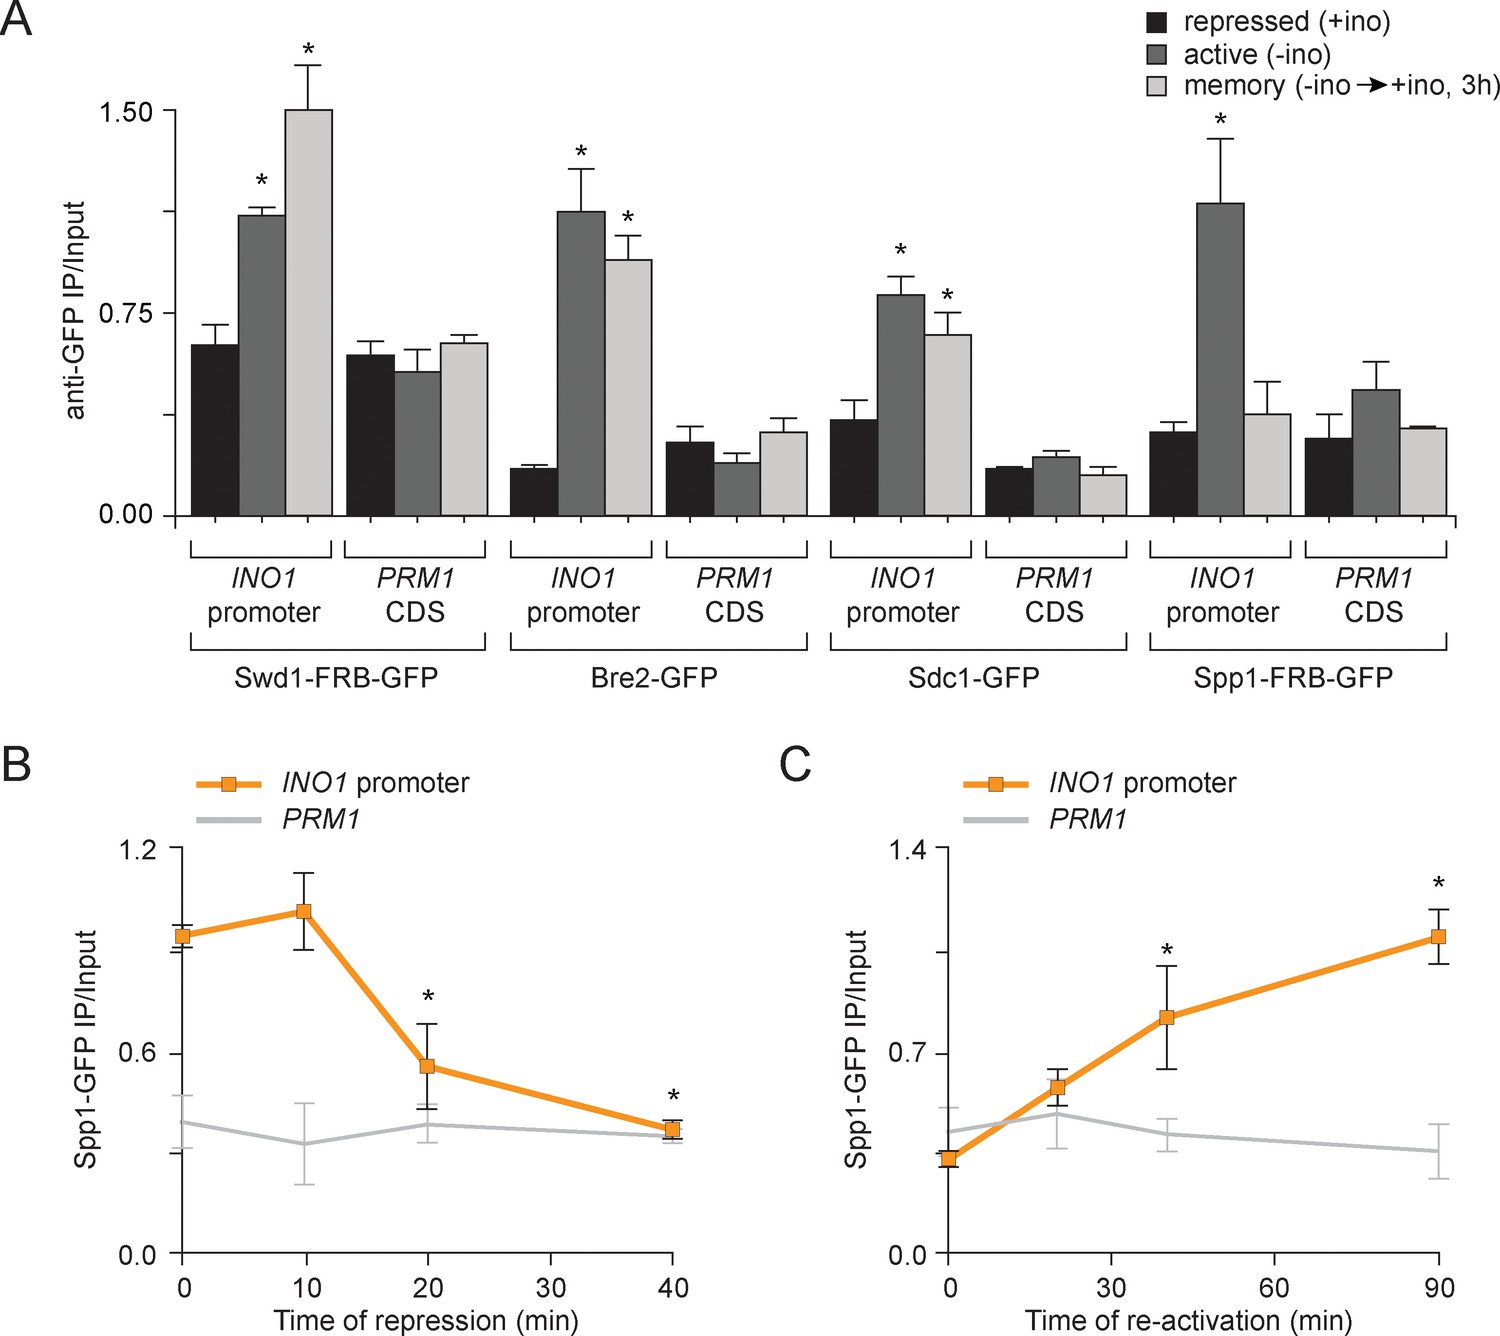
Transcriptional memory leads to remodeling of COMPASS.
(A) ChIP against COMPASS subunits Swd1-GFP, Bre2-GFP, Sdc1-GFP, and Spp1-GFP from cells grown under repressing, activating or memory conditions. (B and C) ChIP against Spp1-GFP at the indicated times either after shifting cells from activating to repressing conditions (B) or after shifting cells back from repressing to activating conditions following 3 hr of repression (C). All ChIP experiments are averages of three biological replicates ± standard error of the mean, quantified relative to input using primers to amplify the INO1 promoter (−348 to −260) or the PRM1 CDS. *p<0.05, compared with the repressing condition (A) or compared with the 0 min time point (B and C) (Student’s t-test).
Figure 4 with 1 supplement
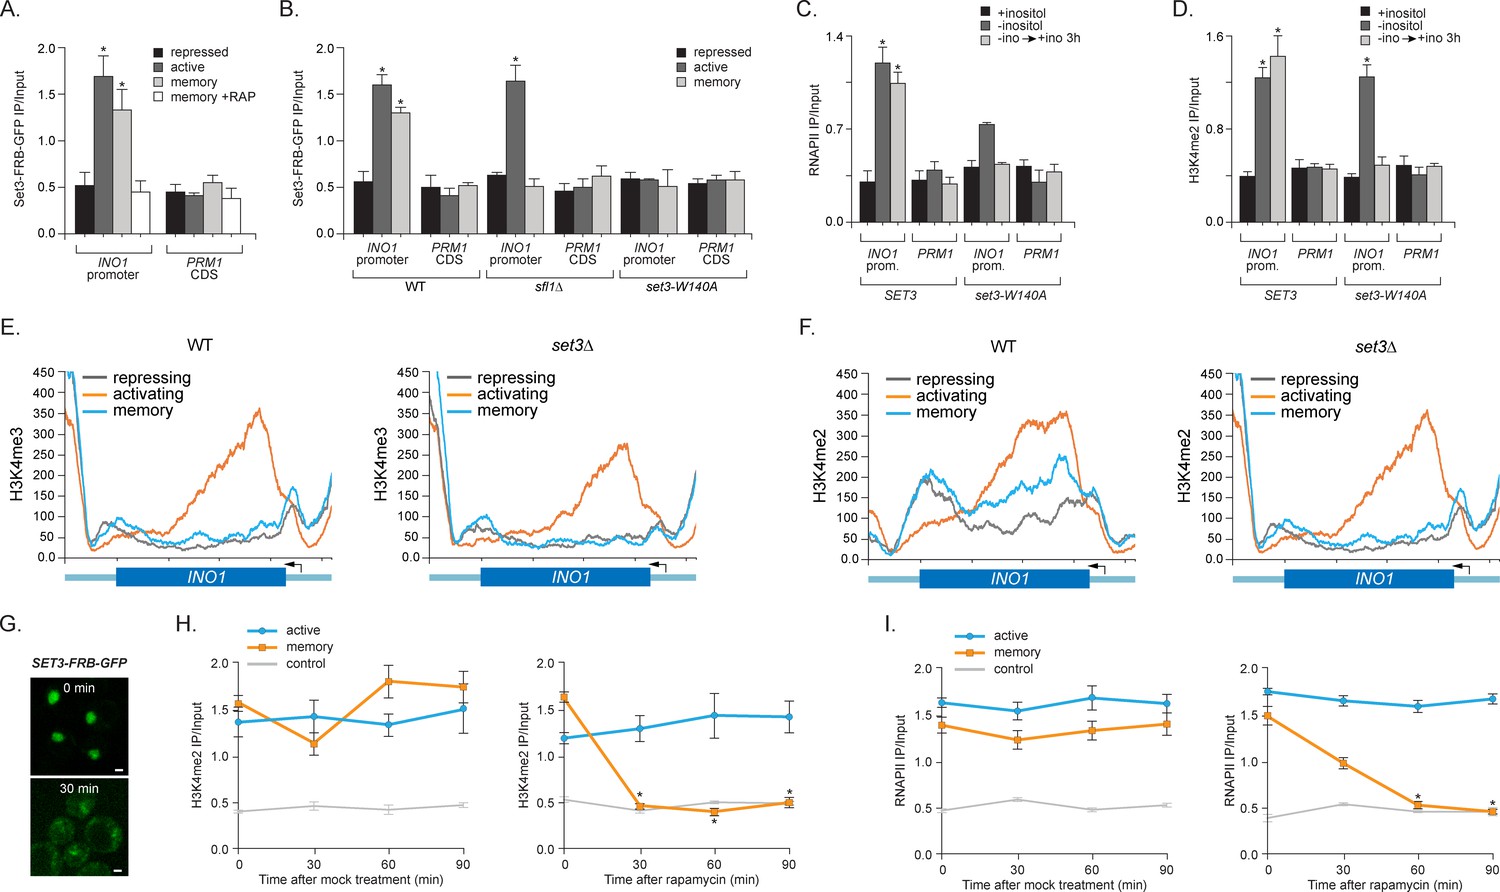
Set3 recruitment to the INO1 promoter under memory conditions requires both Sfl1 and the PHD finger.
(A) ChIP against Set3-GFP from cells grown under repressing, activating or memory conditions +/- rapamycin. (B) ChIP against SET3-GFP from wild type, sfl1∆ or set3-W140A cells grown under repressing, activating or memory conditions. (C and D) ChIP against RNAPII (C) and H3K4me2 (D) from wild type an set3-W140A strains grown under repressing, activating or memory conditions. For A–D, *p<0.05, compared with the repressing condition (Student’s t-test). (E and F) ChIP sequencing against H3K4me3 (E) and H3K4me2 (F) from wild type (left) and set3∆ (right) strains grown under repressing, activating and memory conditions using primers to amplify the INO1 promoter (−348 to −260) or the PRM1 CDS. (G) Confocal micrographs of Set3-FRB-GFP at the indicated times after addition of rapamycin. (H and I) ChIP of H3K4me2 (H) and RNAPII (I) from Set3-FRB-GFP strain grown under activation (-ino) or memory conditions (−ino → +ino). Cells were fixed at the indicated times after addition of either DMSO (mock) or rapamycin. All ChIP experiments were quantified by qPCR and are plotted as averages of three biological replicates ± standard error of the mean. *p<0.05, compared with t=0 (Student’s t-test).
-
Figure 4—source data 1
Genome wide analysis in wild type and set3∆ cells for H3K4me2 and H3K4me3 Chip-Seq.
Pairwise comparisons in separate sheets including: Set3-dependent H3K4me2 loci, Loci showing high H3K4me3 under activating vs repressing conditions, Loci showing Set3-dependent H3K4me3 under activating conditions vs repressing conditions, Loci showing higher H3K4me3 in the WT vs set3∆ strains under activating conditions and Loci that show higher H3K4me2 in the WT vs set3∆ under all conditions. Pairwise comparisons were conducted by the following procedure: For each condition, we pooled the ChIP-seq reads from the two replicates into one sample since the ChIP-seq signal from the two replicates were exceedingly similar. Then we calculated the reads coverage score for each pooled sample. The reads coverage score at a given genomic location is defined as the number reads that cover this location after extending each single-end read from start position downstream 150 bp. This score was further normalized by the total number of aligned reads of each sample for comparisons between samples. Second, we divided the genome into overlapping bins using a sliding window of width = 500 bp and a step size of 250 bp. Under this strategy, two consecutive windows will have 250 bp overlap, such that any ChIP signal, as long as shorter than 250 bp, will be completely covered in one window. This could help better detect the differential ChIP signal (compared to using non-overlap 500 bp windows where signal may split at the window boundary). Third, for each window, we define the total coverage score y as the summation of reads coverage score from all base pairs within the window. To illustrate our method for differential ChIP-seq analysis, we consider comparing the H3K4 tri-methylation between Repressed (REP) vs Memory (STR) conditions. We define a relative distance measure (D) between these two conditions as where and are the total coverage score in the window for REP and STR conditions respectively. Likewise, we define the average coverage score in the log scale as As smaller values tend to be unstable, the same value at different average magnitude of ChIP signal may have different significance (Figure 4—source data 1). We propose an adaptive criterion to select windows with significant difference. 1. For biological significance, we only considered the windows whose average signal exceeds the 10% quantile genome-wide. 2. The remaining range of from 0.10 quantile to its maximum is divided into consecutive bins with bin width of 0.1 (in the log scale). 3. For windows within each bin, we selected windows that corresponded to the lower or upper quantile or more extreme as putative significantly differentially methylated region. For example, in the REP vs. STR WT tri-methylation comparison, we are interested in regions that have lower tri-methylation in the REP condition. Thus we only select windows within each bin whose values are no greater than the lower qunatile. In this study the top 3% was used. All adjacent or overlapping windows were selected from this pipeline and merged together. For comparisons in which we expected the two samples to have a similar ChIP signal, we chose the windows corresponding to the middle 60% values of the distribution.
- https://doi.org/10.7554/eLife.16691.009
Figure 4—figure supplement 1
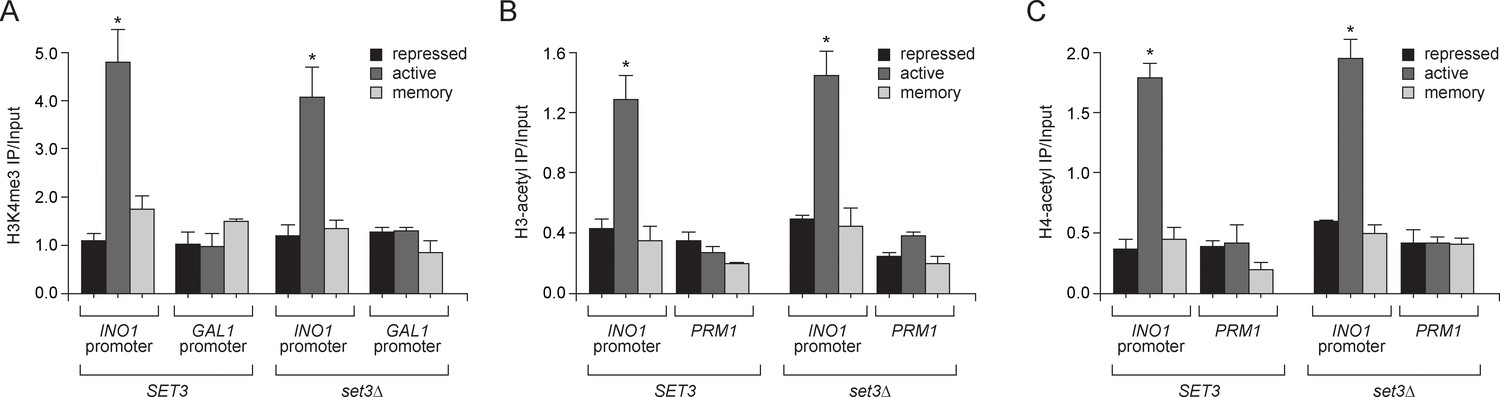
Loss of Set3 has no effect on histone acetylation or H3K4me3 at the INO1 promoter.
(A) Chromatin immunoprecipitation (ChIP) using anti-H3K4me3 (A), anti-acetyl H3 (B) and anti-acetyl H4 (C) from either wild-type or set3Δ grown under repressing, activating or memory conditions. GAL1 promoter and PRM1 serve as a negative controls. *p<0.05, compared with the repressing condition (Student’s t-test).
Figure 5
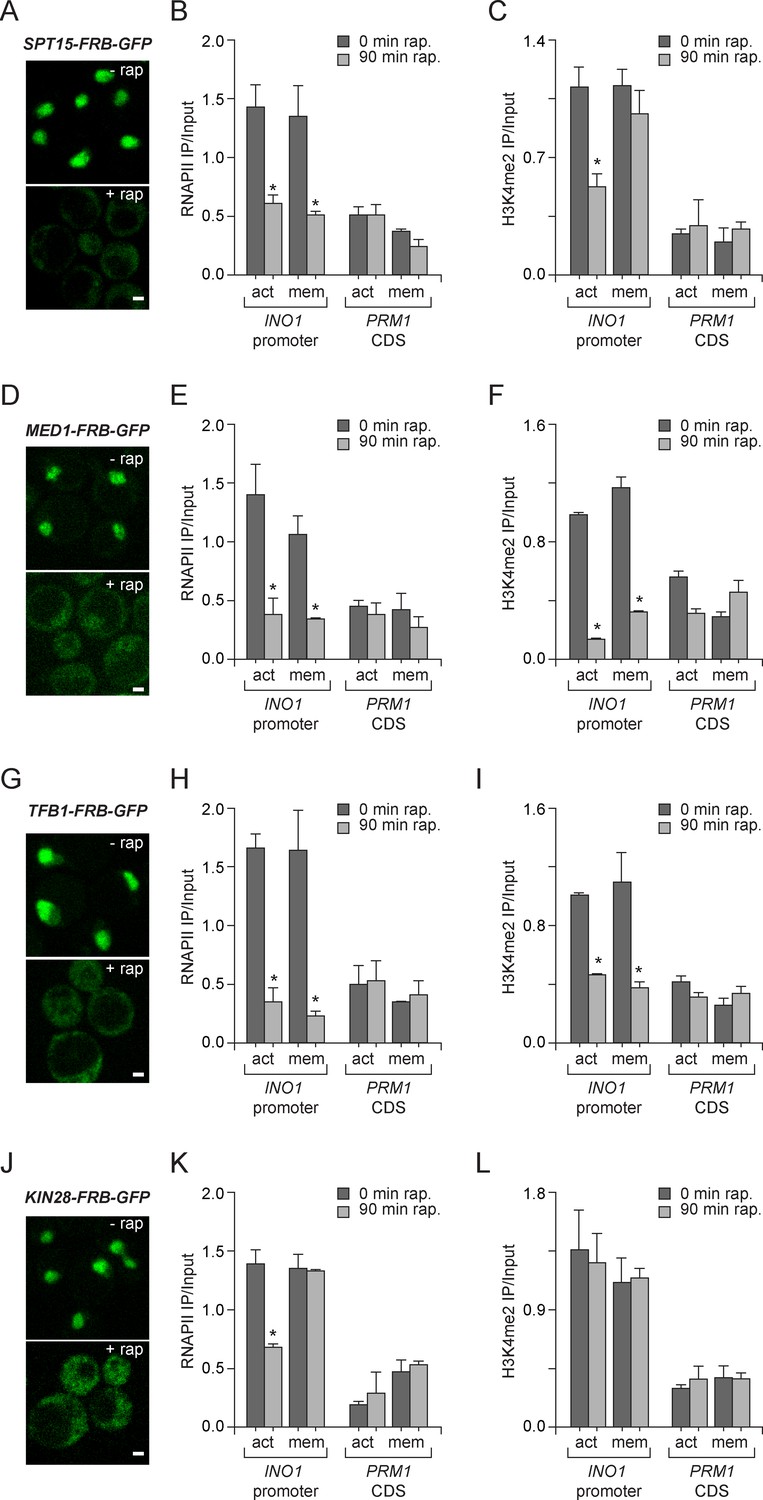
Molecular requirements for PIC assembly during transcriptional memory.
(A, D, G and J) Confocal micrographs of the indicated proteins fused to FRB-GFP before or after treatment with rapamycin for 90 min. (B, E, H and K) ChIP against RNAPII from strains expressing Spt15-FRB-GFP (B), Med1-FRB-GFP (E), TFB1-FRB-GFP (H) or Kin28-FRB-GFP (K), grown under either activating or memory conditions, before or after treatment 1 µg/ml of rapamycin. (C, F, I and L) ChIP against H3K4me2 from strains expressing Spt15-FRB-GFP (C), Med1-FRB-GFP (F), TFB1-FRB-GFP (I) or Kin28-FRB-GFP (L), grown under either activating or memory conditions, before or after treatment 1 µg/ml of rapamycin. All ChIP experiments are averages of three biological replicates ± standard error of the mean, quantified as in panel 1A, using primers to amplify the INO1 promoter (−348 to −260) or the PRM1 CDS. Mock treatment had no effect (not shown). *p<0.05, compared with 0 min rapamycin (Student’s t-test).
Figure 6
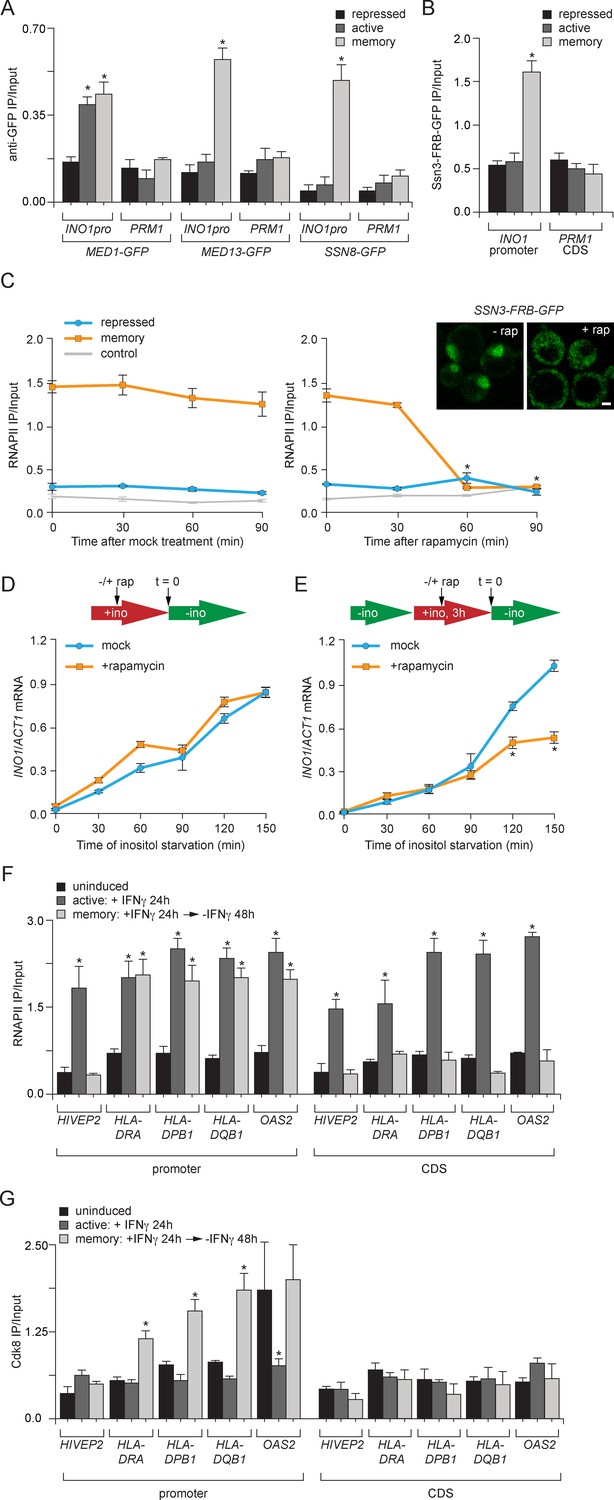
Transcriptional memory leads to Ssn3/Cdk8-dependent poised preinitiation complex.
(A) ChIP against Med1-GFP, Med13-GFP or Ssn8-GFP from cells grown under repressing, activating or memory conditions. (B) ChIP against Ssn3-FRB-GFP from cells grown in repressing, activating or memory conditions. (A and B) *p<0.05, compared with the repressing condition (Student’s t-test). (C) ChIP against RNAPII from strains expressing Ssn3-FRB-GFP grown under either repressing or memory conditions, before or after treatment 1 µg/ml of rapamycin using primers to amplify the INO1 promoter (−348 to −260) or the PRM1 CDS. Inset: confocal micrographs of Ssn3-FRB-GFP expressing cells before or after treatment with 1 mg/ml of rapamycin for 30 min. *p<0.05, compared with t = 0 (Student’s t-test). (D and E) INO1 activation (D) or reactivation (E) in Ssn3-FRB-GFP cells. For activation at time = 0, cells were shifted from medium containing 100 μM inositol (repressing conditions; red arrow in schematic) to medium without inositol (activating conditions; green arrow in schematic). For reactivation, cells were shifted from activating medium to repressing medium containing 100 μM inositol for 3 hr. Cells were treated ±1 µg/ml rapamycin for 45 min before transferring to activating conditions. Cells were harvested at the indicated time points, and INO1 mRNA levels were quantified relative to ACT1 mRNA levels by RT-qPCR. The averages of three biological replicates are shown ± standard error of the mean. *p<0.05, compared with the same time point in the mock-treated culture (Student’s t-test). (F and G) ChIP against RNAPII (F) or Cdk8 (G) from HeLa cells before, during (24 hr) or 48 hr after treatment with 50 ng/mL Interferon-γ. Recovery of the indicated promoters or coding sequences (CDS) of genes that exhibit transcriptional memory (HLA-DRA, HLA-DPB1, HLA-DQB1 and OAS2) and a gene that does not (HIVEP2) was quantified relative to input by qPCR. *p<0.05, compared with the uninducing condition (Student’s t-test). (A-F) Averages of three biological replicates ± standard error of the mean.
Figure 7
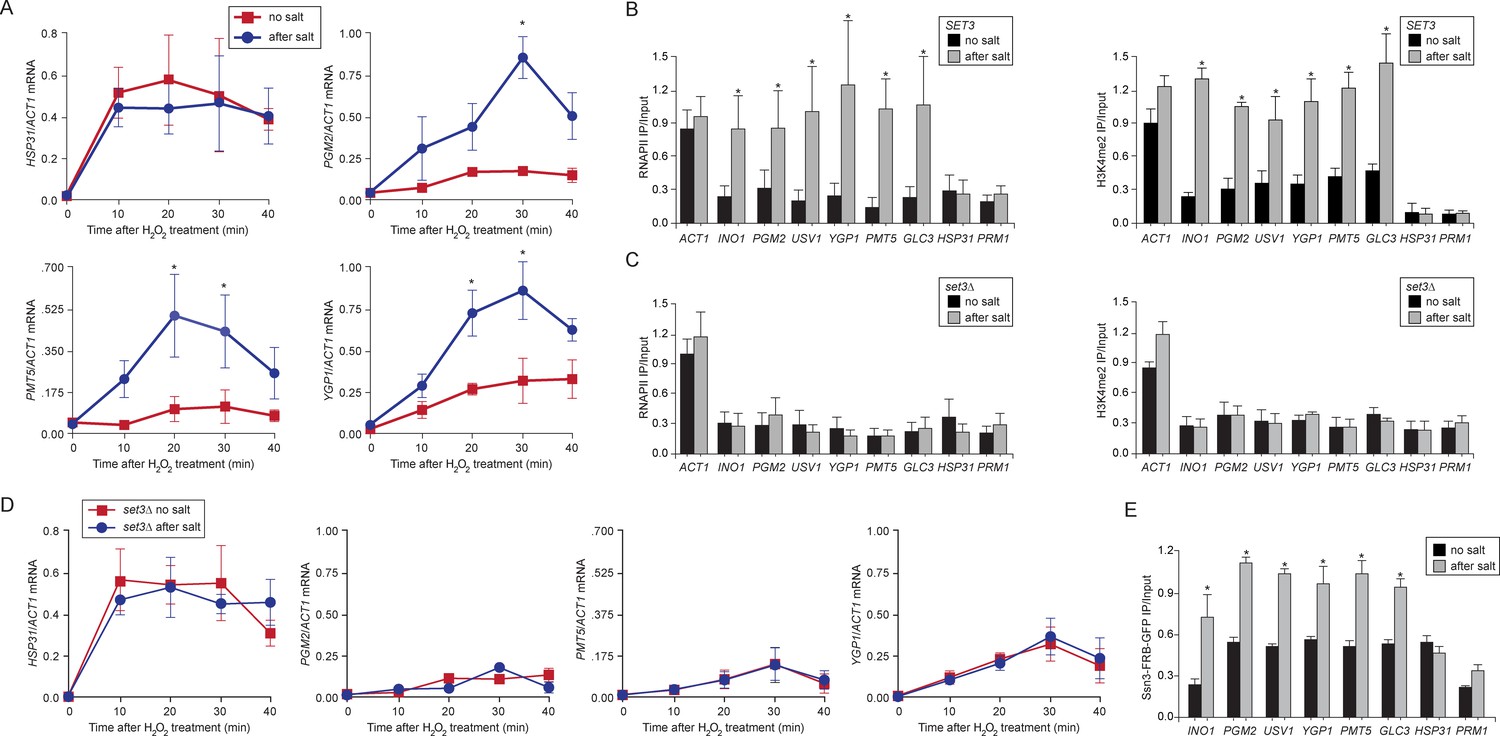
Salt-induced transcriptional memory leads to dimethylation of H3K4 and binding of poised RNAPII.
(A) mRNA levels of three genes that exhibit transcriptional memory (PGM2, PMT5 & YGP1) and one gene that does not (HSP31) at the indicated times after treatment with 0.5mM H2O2. Prior to treatment with H2O2, cells were grown either in rich media (no salt; red lines) or treated with 0.7M NaCl for 1 hr and then allowed to recover for 2 hr in rich media (after salt; blue lines). mRNA levels were quantified relative to ACT1 by RT-qPCR. Shown are the averages of three biological replicates ± standard error of the mean. *p<0.05, compared with the same time point in the no salt culture (Student’s t-test). (B) mRNA levels of three genes that exhibit transcriptional memory (PGM2, PMT5 & YGP1) and one gene that does not (HSP31) from set3∆ mutant cells at the indicated times after treatment with 0.5 mM H2O2 same data as in (A). (C and D) ChIP against RNAPII (C), H3K4me2 (D) from wild-type and set3∆ cells grown either in the absence of salt (no salt) or treated with 0.7M NaCl for 1 hr and allowed to recover for 2 hr in rich medium (after salt). (E) ChIP against Ssn3-FRB-GFP cells grown either in the absence of salt (no salt) or treated with 0.7M NaCl for 1 hr and allowed to recover for 2 hr in rich medium (after salt). All ChIP experiments are averages of three biological replicates ± standard error of the mean, quantified as in panel 1A, using primers to amplify the promoters of the indicated genes. *p<0.05, compared with the no salt condition (Student’s t-test).
Figure 8

Models for transcriptional memory.
(A) Set1/COMPASS remodeling during INO1 transcriptional memory. Nucleosomes associated with repressed INO1 in the nucleoplasm are hypoacetylated and unmethylated. Active INO1 is targeted to the nuclear periphery, nucleosomes are acetylated (orange circles) and H3K4 is trimethylated (blue circles) by COMPASS. During memory, INO1 remains associated with the nuclear pore complex, acetylation is lost, H2A.Z is incorporated and H3K4 is dimethylated by a remodeled form of COMPASS lacking the Spp1 subunit (purple). H3K4me2 recruits Set3C, which promotes the persistence of H3K4me2 by feedback on COMPASS recruitment or remodeling. (B) Cdk8+ Mediator promotes transcriptional poising. Upon activation, Cdk8- Mediator and the PIC bind to the INO1 promoter. TFIIK (Kin28/Cdk7) phosphorylates Serine 5 on the carboxy terminal domain of RNAPII to initiate transcription. During memory, Kin28 is lost and Cdk8+ Mediator is recruited. Cdk8+ Mediator promotes PIC recruitment but initiation is blocked by the absence of Kin28, poising the promoter for future activation.
Tables
Table 1
Yeast strains.
| Name | Genotype | Figures | References |
|---|---|---|---|
| CRY1 | MATa ade2-1 can1-100 his3-11,15 leu2-3,112 trp1-1 ura3-1 | 1C-F 2A,B,D 4C-F, 7A and B | Brickner & Walter, 2004 |
| ADY06 | MATα ade2-1 can1-100 his3-11, 15, leu2-3,112 trp1-1 ura3-1 set3∆::KanMX | 4E and F 7C and D | Light et al., 2013 |
| ADY20 | MATa ade2-1, can1-100, TFB1-GFP-FRB:HIS5+ leu2-3,112 trp1-1 ura3-1 tor1-1 fpr1∆::NAT RPL13A-2xFKBP12::TRP1 | 5G-I | This study |
| ADY21 | MATa ade2-1, can1-100, SPT15-GFP-FRB:HIS5+ leu2-3,112 trp1-1 ura3-1 tor1-1 fpr1∆::NAT RPL13A-2xFKBP12::TRP1 | 5A-C | This study |
| ADY22 | MATa ade2-1, can1-100, MED1-GFP-FRB:HIS5+ leu2-3,112 trp1-1 ura3-1 tor1-1 fpr1∆::NAT RPL13A-2xFKBP12::TRP1 | 5D-F | This study |
| ADY23 | MATa ade2-1, can1-100, SWD1-GFP-FRB:HIS5+ leu2-3,112 trp1-1 ura3-1 tor1-1 fpr1∆::NAT RPL13A-2xFKBP12::TRP1 | 2D-F, 3A | This study |
| ADY24 | MATa ade2-1, can1-100, SET3-GFP-FRB:HIS5+ HOS2-GFP-FRB: KanMX, leu2-3,112 trp1-1 ura3-1 tor1-1 fpr1∆::NAT RPL13A-2xFKBP12::TRP1 | 4A, G-I | This study |
| ADY31 | MATa ade2-1 can1-100, sfl1∆::HIS3, leu2-3,112 trp1-1 ura3-1 | 1C 1D 1E 1F 2A | This study |
| WLY154 | MATa ade2-1 can1-100, his3-11,15, leu2-3,112 trp1-1 ura3-1 INO1-mrsmut | 1A 2A | Light et al., 2013 |
| ADY32 | MATa ade2-1 can1-100 SFL1-FRB-GFP:HIS5+, leu2-3,112 trp1-1 ura3-1 | 1A | This study |
| ADY33 | MATa ade2-1 can1-100 SFL1-FRB-GFP:HIS5+ leu2-3,112 trp1-1 ura3-1 INO1-mrsmut | 1A | This study |
| JMY047 | MATa ade2-1 can1-100 his3-11,112 trp1-1 LacO:INO1:URA3 PHO88-mCherry:SpHis5, LEU2:LacI-GFP | 1B | This study |
| JMY049 | MATa ade2-1 can1-100 his3-11,112 trp1-1 LacO:INO1:URA3 PHO88-mCherry:SpHis5 LEU2:LacI-GFP sfl1∆:: KanMX | 1B | This study |
| CEY272 | ade2-1 can1-100 his3-11,15 leu2-3,112 trp1-1 ura3-1 LEU2:pER05 HIS3:LacI-GFP URA3:LexA BS [pADH-LexA] | 1B | Randise-Hinchliff et al., 2016 |
| CEY277 | ade2-1 can1-100 his3-11,15 leu2-3,112 trp1-1 ura3-1 LEU2:pER05 HIS3:LacI-GFP URA3:LexA BS [pADH-LexA-SFL1] | 1B | This study |
| WLY155 | MATa ade2-1 can1-100 his3-11,15 leu2-3,112 trp1-1 ura3-1 HIS3:pAFS144 TRP1:pRS304-Sec63-Myc INO1:p6LacO128-INO1 set1∆::His5+ | 2B | Light et al., 2013 |
| ADY41 | MATa his3Δ200 leu2Δ0 lys2Δ0 trp1Δ63 ura3Δ0 met15Δ0 can1::MFA1pr-HIS3 hht1-hhf1::NatMX4 hht2-hhf2::[HHTS-HHFS]*-URA3 HHT-K4R | 2C and D | Dharmacon J. Dai et al., 2008 |
| PJD47 | MATa his3Δ200 leu2Δ0 lys2Δ0 trp1Δ63 ura3Δ0 met15Δ0 can1::MFA1pr-HIS3 hht1-hhf1::NatMX4 hht2-hhf2::[HHTS-HHFS]*-URA3 wildtype HHT | 2C and D | Dharmacon J. Dai et al., 2008 |
| ADY42 | MATa his3Δ200 leu2Δ0 lys2Δ0 trp1Δ63 ura3Δ0 met15Δ0 can1::MFA1pr-HIS3 hht1-hhf1::NatMX4 hht2-hhf2::[HHTS-HHFS]*-URA3 HHT-K4A | 2C and D | Dharmacon J. Dai et al., 2008 |
| ADY34 | MATa ade2-1, can1-100, SPP1-GFP-FRB:HIS5+ leu2-3,112 trp1-1 ura3-1 | 2E, 3A-C | This study |
| ADY35 | MATa ade2-1 can1-100, SET3-FRB-GFP:HIS5+ leu2-3,112 trp1-1 ura3-1 | 4B | This study |
| ADY36 | MATa ade2-1 can1-100, SET3W140A-FRB-GFP:HIS5+ leu2-3,112 trp1-1 ura3-1 | 4B-D | This study |
| ADY37 | MATa ade2-1 can1-100 SET3-FRB-GFP:HIS5+ leu2-3,112 trp1-1 ura3-1 slf1∆::KanMX | 4B | This study |
| ADY38 | MATa ade2-1 can1-100 KIN28-FRB:His5+ leu2-3,112 trp1-1 ura3-1 tor1-1 fpr1∆::NAT RPL13A-2xFKBP12::TRP1 | 4J 4K 4L | This study |
| ADY39 | MATa ade2-1 can1-100 SSN3-GFP-FRB:His5+ leu2-3,112 trp1-1 ura3-1 tor1-1 fpr1∆::NAT RPL13A-2xFKBP12::TRP1 | 6B-E | This study |
| HHY168 | MATα ade2-1 can1-100 his3-11,15 leu2-3,112 trp1-1 ura3-1 tor1-1 fpr1∆::NAT RPL13A-2xFKBP12::TRP1 | 2Sup.1E | Haruki et al., 2008 |
| Bre2-GFP | MATa his3∆ leu2∆I met150∆I ura3∆0 BRE2-GFP:His5+ | 3A | Open Biosystems Ghaemmaghami et al. |
| Sdc1-GFP | MATa his3∆ leu2∆I met150∆I ura3∆0 SDC1-GFP:His5+ | 3A | Open Biosystems Ghaemmaghami et al. |
| Med1-GFP | MATa his3∆ leu2∆I met150∆I ura3∆0 MED1-GFP:His5+ | 6A | Open Biosystems Ghaemmaghami et al. |
| Med13-GFP | MATa his3∆ leu2∆I met150∆I ura3∆0 MED13-GFP:His5+ | 6A | Open Biosystems Ghaemmaghami et al. |
| Ssn8-GFP | MATa his3∆ leu2∆I met150∆I ura3∆0 SSN8-GFP:His5+ | 6A | Open Biosystems Ghaemmaghami et al. |
Table 2
Oligonucleotides
| Primers Name | Sequence |
|---|---|
| INO1 Promoter FW | TCATCCTTCTTTCCCAGAATATTG |
| INO1 Promoter RV | CTCAAATTAACATTGCCGCC |
| INO1 CDS1 FW | TAGTTACCGACAAGTGCACGTACAA |
| INO1 CDS1 RV | TAGTCTTGAACAGTGGGCGTTACAT |
| INO1 CDS2 FW | GCGGAGGGGAATGACGTTTATG |
| INO1 CDS2 RV | CATATTCGAGAACTTGACTTCTCTGC |
| INO1 CDS3 FW | ACGCATCAGACGCGATATCCAG |
| INO1 CDS3 RV | CTGCAAGAGGTTTTCCATGGTGTC |
| ACT1CDS FW | GGTTATTGATAACGGTTCTGGTATG |
| ACT1CDS RV | ATGATACCTTGGTGTCTTGGTCTAC |
| PRM1 CDS FW | TAACAAGATTTGTCATCCAGCCTGC |
| PRM1 CDS RV | CCTCCTATACAAAATGGCCAATATG |
| GAL Promoter FW | CCCCACAAACCTTCAAATTAACG |
| GAL Promoter RV | CGCTTCGCTGATTAATTACCC |
| HSP31 promoter FW: | GAATTAACGTTACTCATTCCTAGCC |
| HSP31 promoter RV | TTTAAAGGGTAACGGAAACCGGAAG |
| HSP31 CDS FW: | GTTGGGATGAGCATTCCTTAGCC |
| HSP31 CDS RV: | ATAGTCAAATAAGGTACCGTGGCC |
| PGM2 promoter FW: | GGAACTTACGTGAAAGGGGACG |
| PGM2 promoter RV: | CCCACATTGTTCGGGCGGC |
| PGM2 CDS FW: | TGCCACTCTTGTTGTCGGTGGTG |
| PGM2 CDS RV: | GGTTCTCATGATGTGAGAAGCGGC |
| USV1 promoter FW: | AGTCTTCCGTATATAACAATCTCAATCC |
| USV1 promoter RV: | GTTAATGAAGCTGTTGCAAAATACTGC |
| USV1 CDS FW: | CTAGAGCGGAACATCTTGCACGTC |
| USV1 CDS RV: | GCTGGTGCGAGCTGGTAGAATGG |
| PMT5 promoter FW: | TCGCTCAAATAAGTATGATCTGCAAG |
| PMT5 promoter RV: | ACTACGCTTCTGTTCCTTTTCTATTG |
| PMT5 CDS FW: | CTGCCATCGTAAGGCTACACAATATC |
| PMT5 CDS RV | GAGGACACGGTTGCATATAGCATTG |
| GLC3 promoter FW: | ATATTACGGCATCATCTTTCCCCG |
| GLC3 promoter RV: | GGAAAATGGAAAGCCTTCCTTGC |
| GLC3 CDS FW: | TCATGCTACGCCTGATGGTTCG |
| GLC3 CDS RV: | CTCCCACTAGAAATGCACGTTCC |
| YGP1 promoter FW: | CTCTATTGCATCTTCAAACTCCGAAG |
| YGP1 promoter RV: | CAAGCTTTTTATATTTCAGAGATGATGG |
| YGP1 CDS FW: | GCCTGGAATGGGTCTAACTCTAGC |
| YGP1 CDS RV: | GGTGTAGTTTGTGTGGGTCAAAGAAC |
| HLA-DRA Pro For | GATTTGTTGTTGTTGTTGTCCTGTTTG |
| HLA-Dra Pro rev | GCAAATCAATTACTCTTTGGCCAATCAG |
| HLA-Dra CD For | GAAAGCAGTCATCTTCAGCGTT |
| HLA-DRA CD Rev | AGAGGCATTGGCATGGTGATAAT |
| CIITA Pro For | GTTCCCCCAACAGACTTTCTG |
| CIITA Pro Rev | AGGTGGCCCCAAGCGGTCAG |
| CITIA CD For | CACAGCCACAGCCCTACTTT |
| CIITA CD Rev | CCGACATAGAGTCCCGTGA |
| HLA-DPB1 Pro For | GGGCCAGCAGAATATTTGAGATCACC |
| HLA-DPB1 Pro Rev | GAGTCATTGCTCACTAGGCAGAAAGTTAG |
| HLA-DPB1 CD For | TCCAGCCTAGGGTGAATGTTTCCC |
| HLA-DPB1 CD Rev | TGGTGGACACGACCCCAGCTGTTTCCTCCTG |
| HLA-DQB1 Pro For | GGCACTGGATTCAGAACCTTCACAAA |
| HLA-DQB1 Pro Rev | CTGTGGATGTTTCCATGCGTGGTAGGATTGG |
| HLA-DQB1 CD For | CCCACAGTGACCATCTCCCCATCCAGGAC |
| HLA-DQB1 CD Rev | GGGGTGGACACAACGCCAGCTGTCTCCTCC |
| OAS2 Pro For | CAGTAAACCTTGCTGCAAGGGGCGGGGAAG |
| OAS2 Pro Rev | CCGGGACAGGGAAACAAAACTAACTTAAGC |
| OAS2 CD For | GGCTCCTATGGACGGAAAACAGTC |
| OAS2 CD Rev | CAACCACTTCGTGAACAGACAGAACTTC |
| URA3 FW | GACTCACTATAGGGCGAATTGGAGC |
| URA3 RV | GCCAAGCTCGGAATTAACCCTCAC |
| SUC2 Prom FW | CCTAAGGGCTCTATAGTAAACCATTTG |
| SUC2 Prom RV | GCACAAGAACAAGAGAATGTTTTGAAG |
Download links
A two-part list of links to download the article, or parts of the article, in various formats.
Downloads (link to download the article as PDF)
Open citations (links to open the citations from this article in various online reference manager services)
Cite this article (links to download the citations from this article in formats compatible with various reference manager tools)
Set1/COMPASS and Mediator are repurposed to promote epigenetic transcriptional memory
eLife 5:e16691.
https://doi.org/10.7554/eLife.16691


