Pathogenic shifts in endogenous microbiota impede tissue regeneration via distinct activation of TAK1/MKK/p38
- Stowers Institute for Medical Research, United States
- University of Missouri, United States
- Pittsburg State University, United States
- Howard Hughes Medical Institute, Stowers Institute for Medical Research, United States
Figures
Figure 1 with 1 supplement
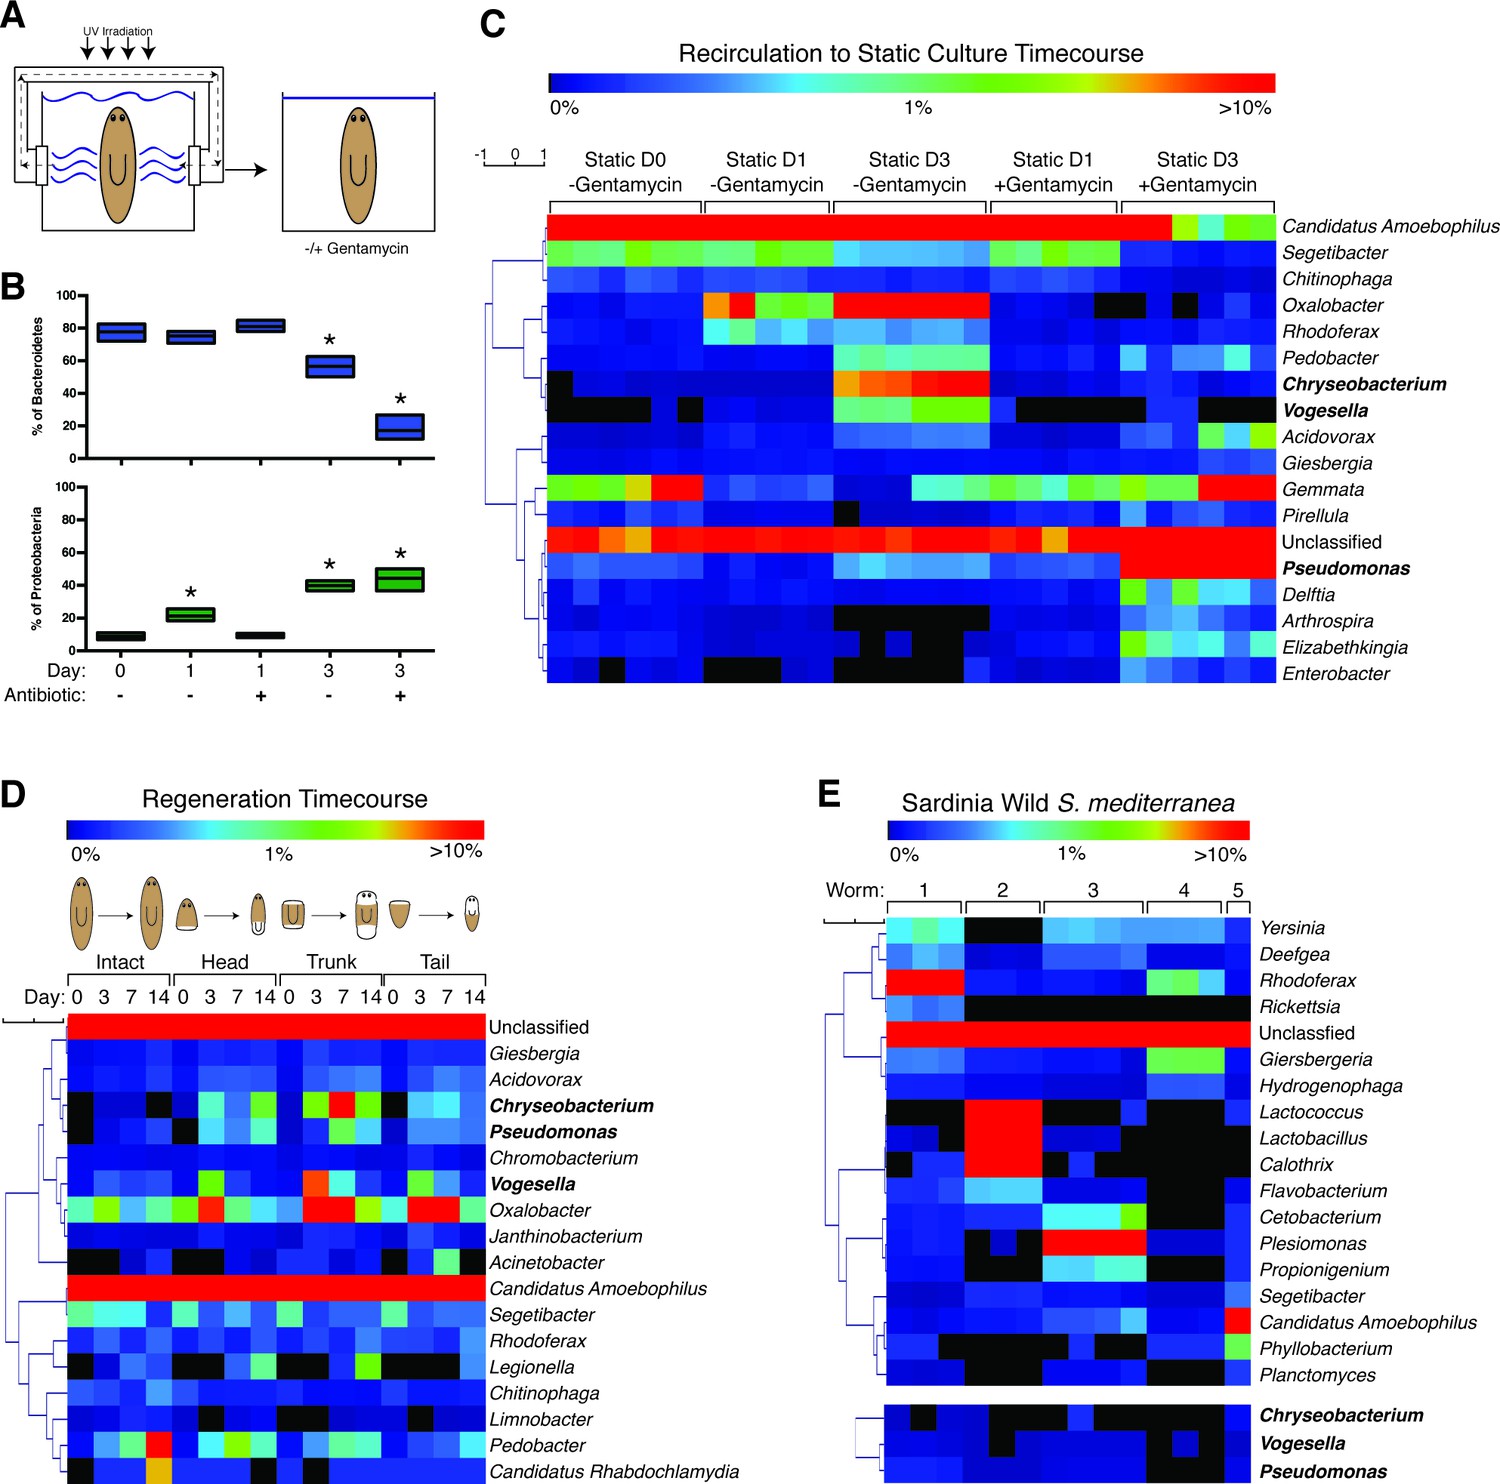
The planaria microbiome dynamically responds to changes in culture conditions and regeneration.
(A) Diagram of transition of planaria from recirculation to static culture. (B) Percentage of the phyla Bacteroidetes and Proteobacteria following exit from recirculation culture (* = t-test p<0.05). (C) Heatmap of the percentage of the top 10 bacterial genera across all the samples of CIW4 strain planaria following release from recirculation culture in the presence or absence of the antibiotic gentamycin (n = pool of ~30 worms with 2–3 generated 16 s rDNA libraries, independently sequenced twice). (D) Heatmap of the percentage of the top 18 bacterial genera of amputated head, trunk, and tail fragments during regeneration in comparison to intact worms (n = pool of 2–16 intact worms or 30–60 fragments for 16 s rDNA library generation). (E) Heatmap of the percentage of the top 5 bacterial genera across the samples of individual wild-type planaria. The heatmap of the genera Vogesella, Chryseobacterium, and Pseudomonas across wild worm samples are included for reference (n = 1–4 16 s rDNA libraries generated per worm).
-
Figure 1—source data 1
16 s rDNA sequencing results.
- https://doi.org/10.7554/eLife.16793.004
Figure 1—figure supplement 1
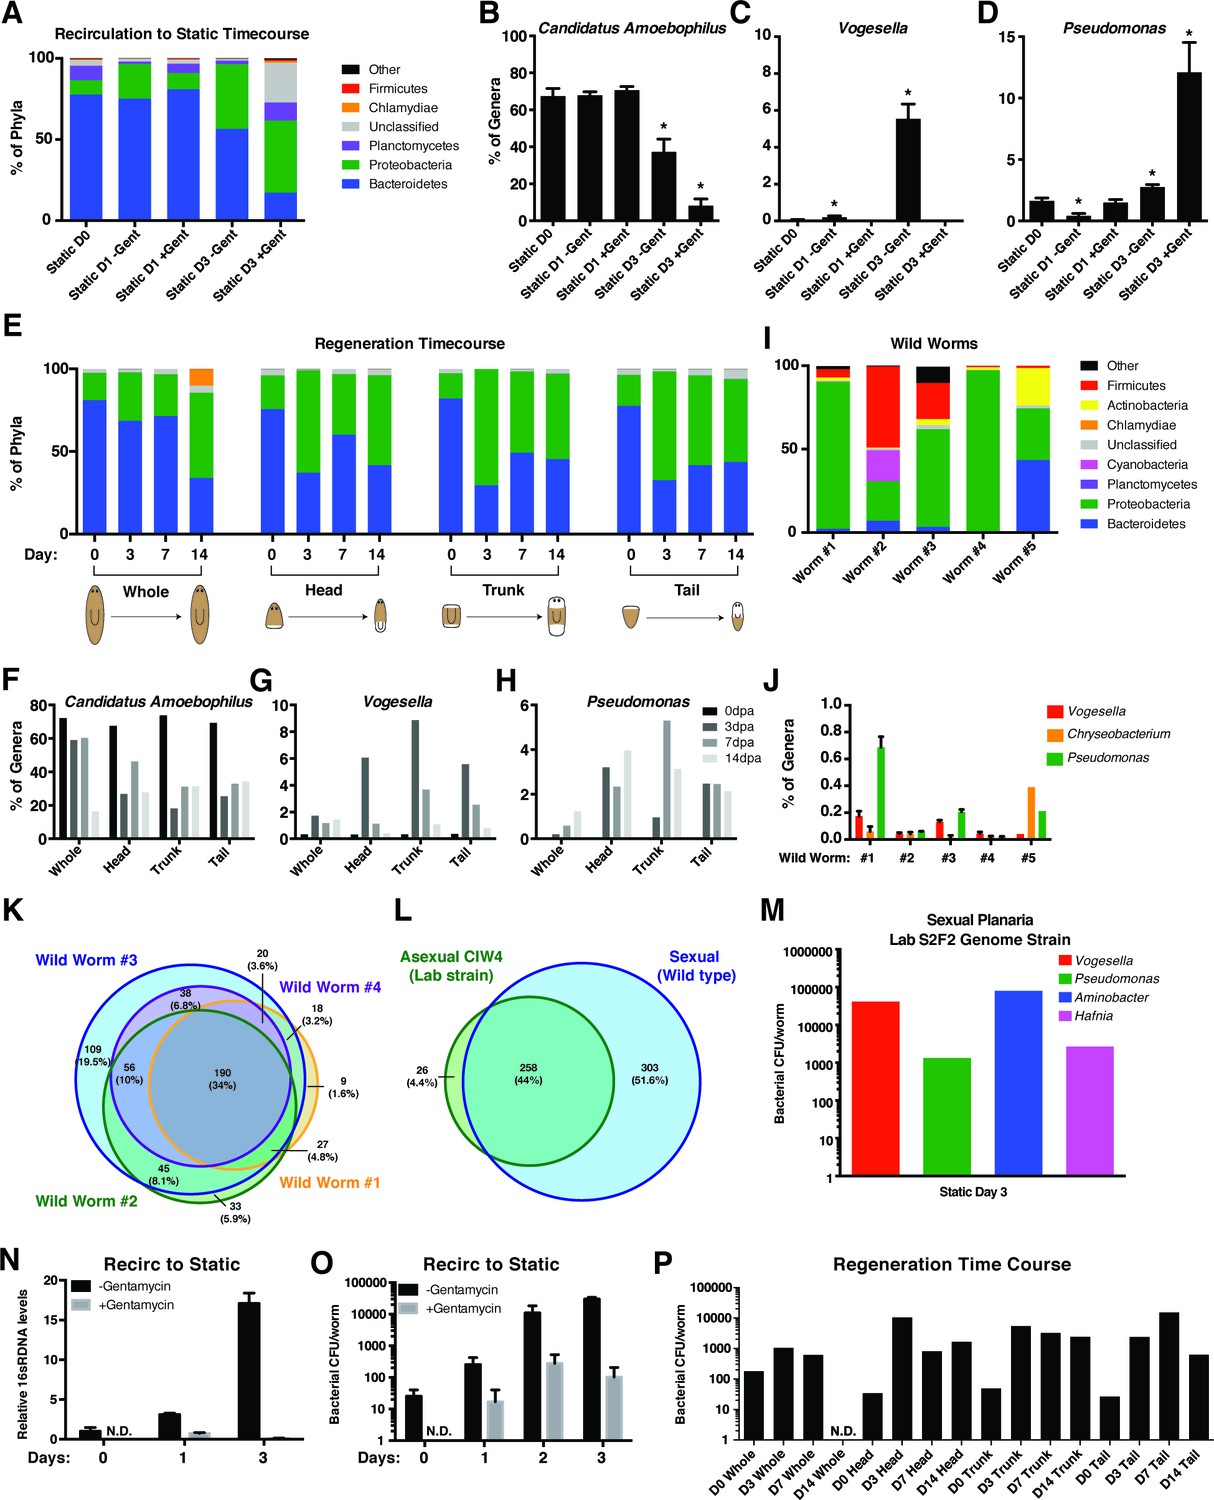
Analysis of changes in bacterial levels and composition following exit from recirculation culture.
(A) Composition of bacterial phyla during the transition from recirculation to static culture in the absence or presence of the antibiotic gentamycin (n = pool of ~30 worms with 2–3 generated 16 s rDNA libraries, independently sequenced twice). Percentage of the prominent (B) Bacteroidetes genus Candidatus Amoebophilus and Proteobacteria genera (C) Vogesella and (D) Pseudomonas during the aforementioned changes in culture conditions. (E) Composition of bacterial phyla during regeneration of head, trunk, or tail fragments in comparison to intact worms (n = a pool of 2–16 intact worms or 30–60 fragments for 16 s rDNA library generation). Percentage of the genera (F) Candidatus Amoebophilus, (G) Vogesella, and (H) Pseudomonas during regeneration. (I) Composition of bacterial phyla of individual wild type sexual planaria (n = 1–4 16 s rDNA libraries generated per worm). (J) Percentage of the genera Candidatus Amoebophilus, Vogesella, and Pseudomonas amongst wild worm samples. Proportional Venn diagram comparison of the bacterial genera of (K) individual wild worms relative to one another or (L) compared in aggregate to the genera of the CIW4 lab strain. Overlaps less than 1% not pictured. (M) Bacterial CFU quantification of prominent bacterial strains from S2F2 sexual lab strain of planaria 3 days after exit from the fill and drain system (n = 3 pooled worms). (N) qPCR of relative 16 s rDNA levels during the recirculation culture to static culture transition in the presence or absence of antibiotic (n = 3 technical replicates of pooled samples of > 30 worms). (O) Total bacterial CFUs per planaria following exit from recirculation culture in the presence and absence of the antibiotic gentamycin (n = 4 samples of 4 pooled worm homogenates, experiment independently repeated > 4 times). (P) Total bacterial CFUs per planaria or regenerating fragment after amputation (n = 3–8 pooled worm or fragment homogenates per timepoint).
Figure 2 with 1 supplement
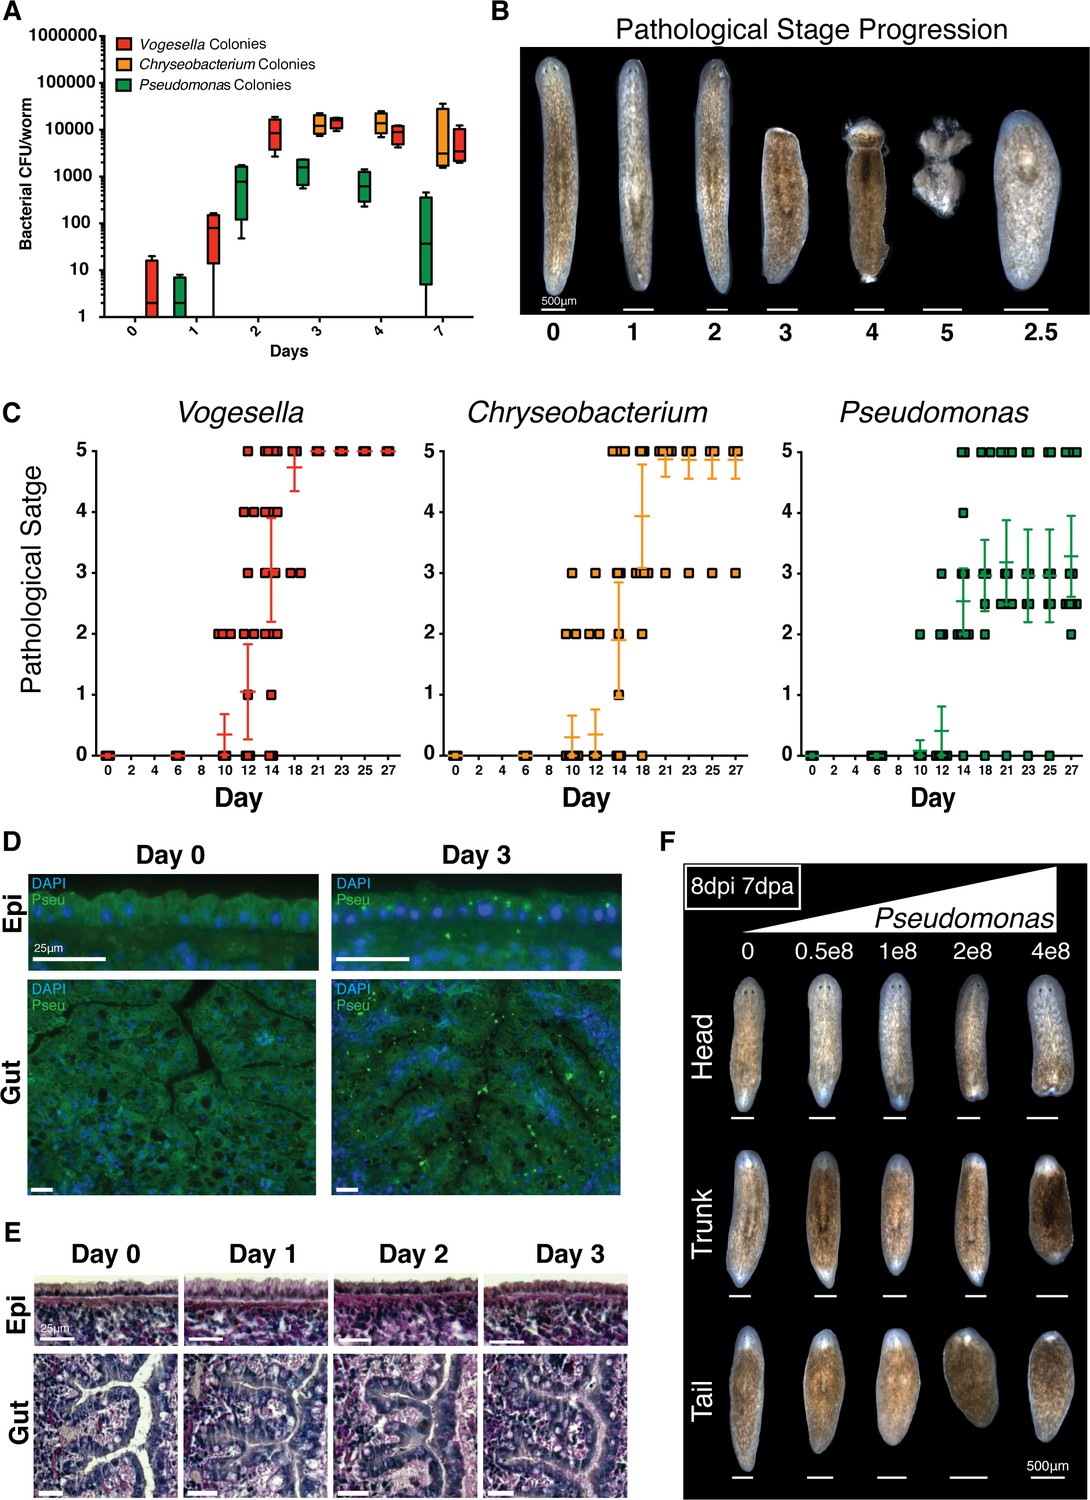
Bacterial infection compromises planarian tissue homeostasis and regeneration.
(A) Bacterial CFU quantification of prevalent bacterial strains following exit from the recirculation system (n = 4 homogenates from 4 worms per time point, experiment independently repeated > 4 times); Vogesella (red), Chryseobacterium (orange), and Pseudomonas (green). (B) Depiction and enumeration of pathological stages following bacterial infection. Stage 2.5 refers to worms that reach stage 3 but ultimately regenerated anterior structures. (C) Comparison of the effects of infection of 1e8 CFU/ml Vogesella, Chryseobacterium, or Pseudomonas (green) on pathological stage progression over time (n = 15–25, experiment independently repeated > 3 times). (D) Anti-Pseudomonas antibody staining (green) and DAPI nuclear counterstain (blue) of surface and gut epithelia following infection (n = 2, experiment independently repeated > 2 times). (E) Histological sections stained with Alcian Blue/ PAS following Pseudomonas infection (n = 2). (F) Representative images depicting the effects of increasing concentrations of Pseudomonas on regenerating head, trunk, and tail fragments. Worms were amputated 1 day following infection and images were taken seven days after amputation (n = 5).
Figure 2—figure supplement 1
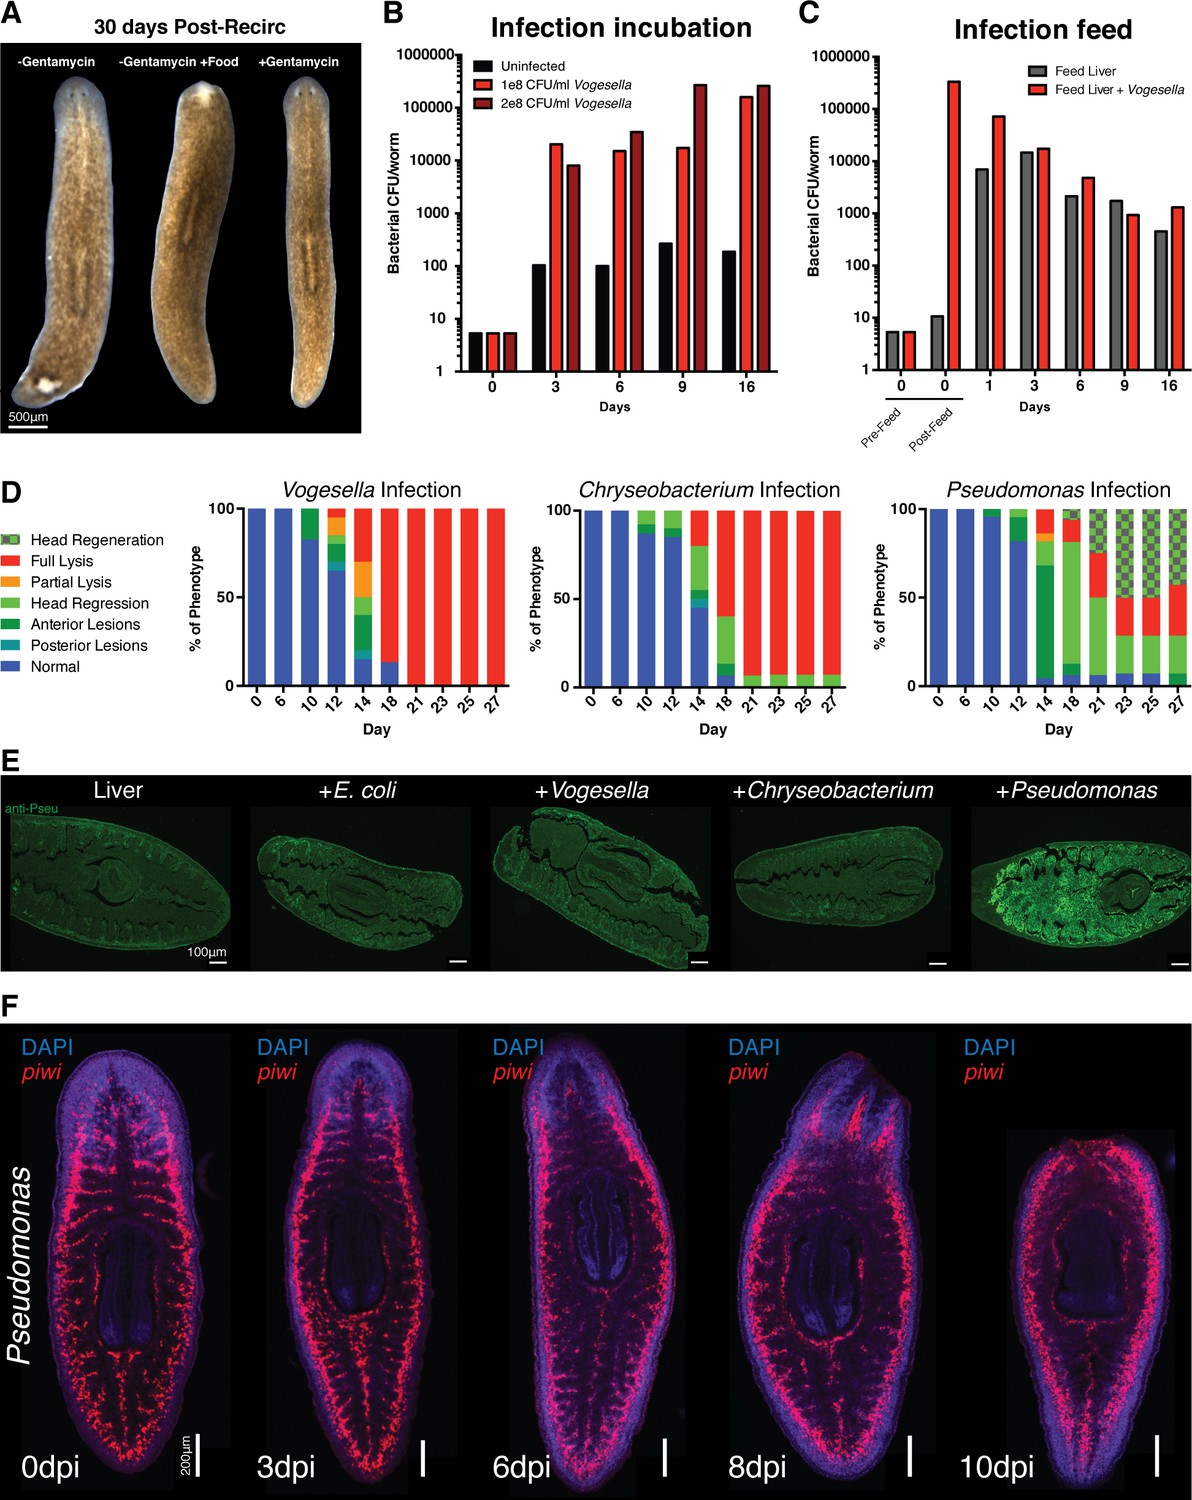
Effects of bacterial infection on worm tissue homeostasis.
(A) Images of worms 30 days post recirculation culture administered food, antibiotic, or neither (experiment independently repeated > 3 times). Bacterial CFU/worm following infection with Vogesella either by (B) direct administration to planaria water or (C) by feeding bacteria mixed with beef liver paste (CFU determined from a pool of four worms per time point). (D) Percentage of worms exhibiting demarcated phenotypes following infection (n = 15–25, experiment independently repeated > 3 times). Phenotypes are color coded as follows: blue = normal, teal = posterior lesion, dark green = anterior lesion, light green = head regression, orange = partial lysis, red = full lysis, light green+squares = head regeneration following regression. (E) Anti-Pseudomonas antibody staining of histological sections of planaria immediately following the consumption of beef liver paste alone or mixed with the specified bacteria (n = 2). (F) Labeling of neoblasts via piwi WISH during Pseudomonas infection and pathological progression (n = 5–10).
Figure 3
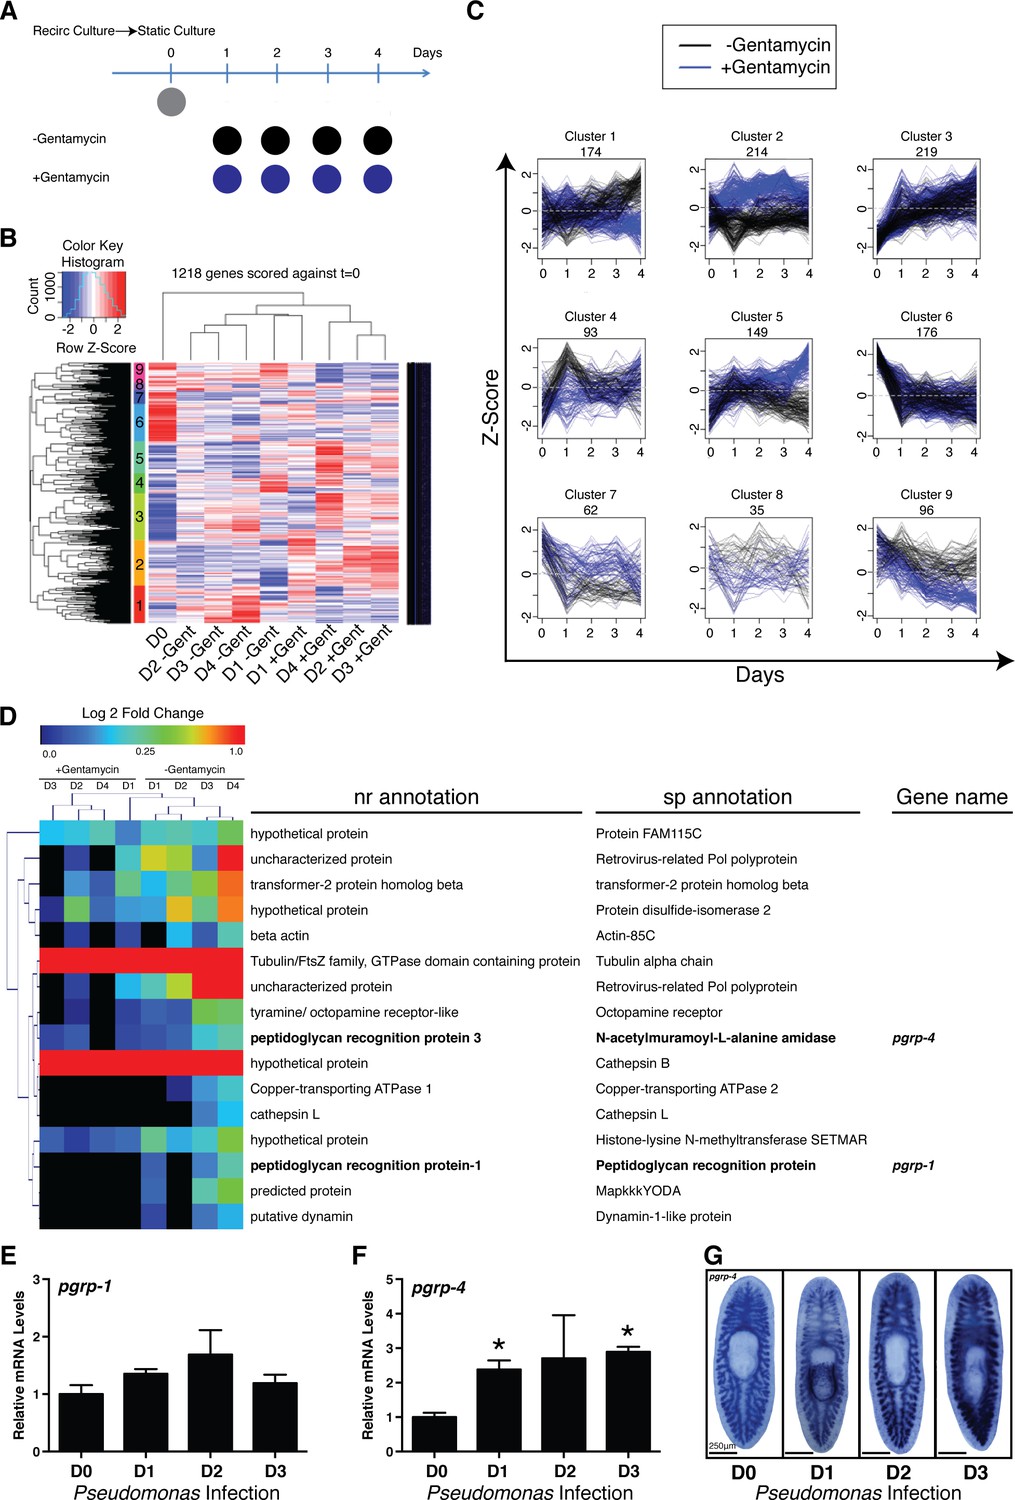
Elucidating bacterial contribution to the transcriptional changes underlying the transition of worms from recirculation to static culture conditions.
(A) Diagram depicting comparison of RNAseq samples of planaria following exit from a recirculation culture system in the absence or presence of the antibiotic gentamycin (n = 4 replicates each containing 4 planaria). (B) Hierarchical clustering of RNAseq results displaying significant clusters (1 through 9, y axis). (C) Visualization of gene expression patterns of significant clusters. (D) Differentially expressed annotated genes from cluster 1 (Day 0 vs Day 4 adj. p-value <0.05). Peptidoglycan recognition protein genes are highlighted in bold. RT and QPCR of (E) pgrp-1 and (F) pgrp-4 following Pseudomonas infection (n = 3 biological replicates, 3 technical replicates, * = t-test p<0.05). (G) WISH of pgrp-4 following Pseudomonas infection (n = 5–7).
-
Figure 3—source data 1
RNAseq analysis of worms during recirculation to static culture transition.
- https://doi.org/10.7554/eLife.16793.011
Figure 4 with 1 supplement
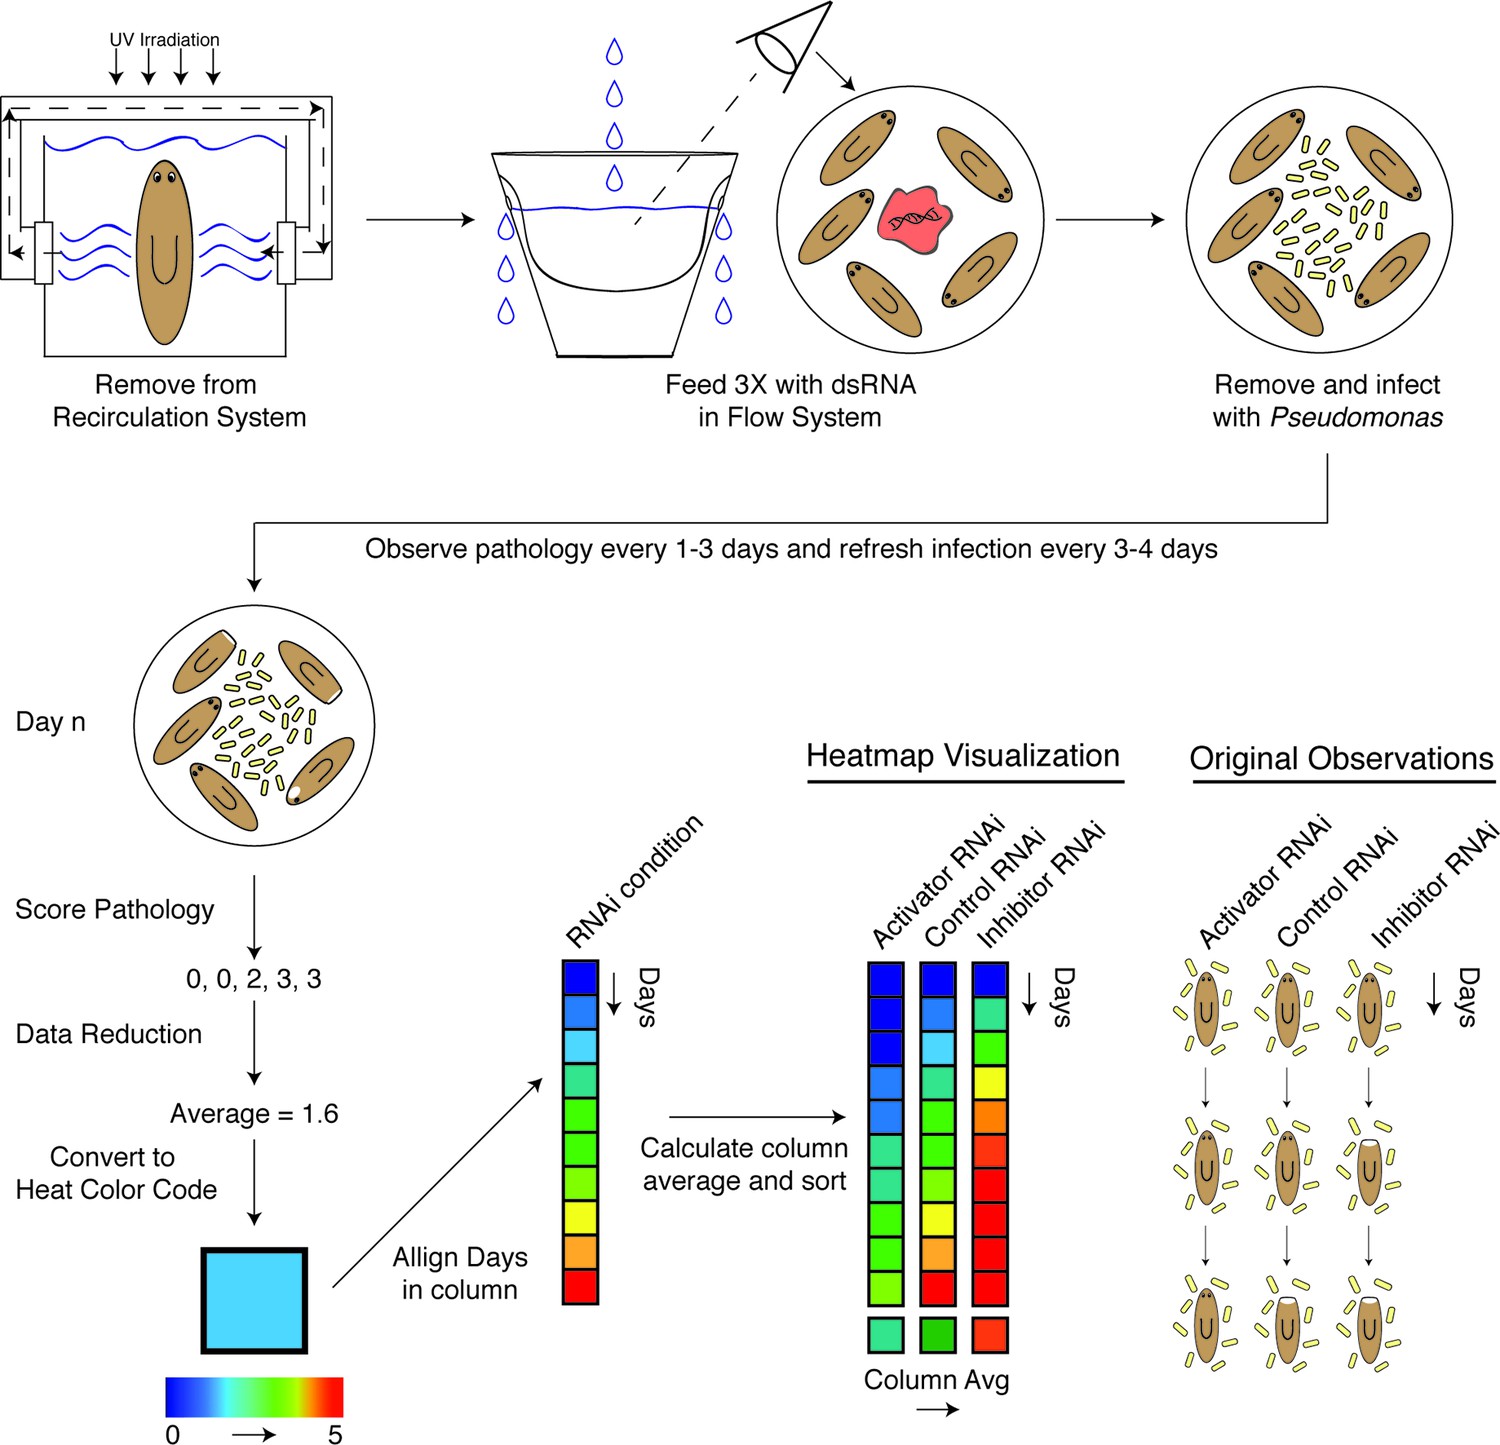
Diagram depicting workflow and data analysis of an RNAi screen to identify genes modulating pathological progression.
Planaria are transferred directly from the recirculation system to a flow culture system permitting maintenance of a reduced septic state during dsRNA feedings. Following 3 RNAi feedings, planaria are removed for infection with Pseudomonas. Observations of pathological stages are recorded every 1 to 3 days, and planaria are replenished with fresh water containing Pseudomonas every 3 to 4 days. Following enumeration of pathological stages, data for each day is reduced to an average pathological score and converted to a heat color code. Days for each RNAi condition are aligned in ascending order along the y-axis of a column. The average score of each column is calculated and used to sort the effects of RNAi conditions in ascending order along the x-axis. The result is a heat map visualization ranking the effects of RNAi treatments on the pathological progression in response to bacterial infection in planarians over time.
Figure 4—figure supplement 1
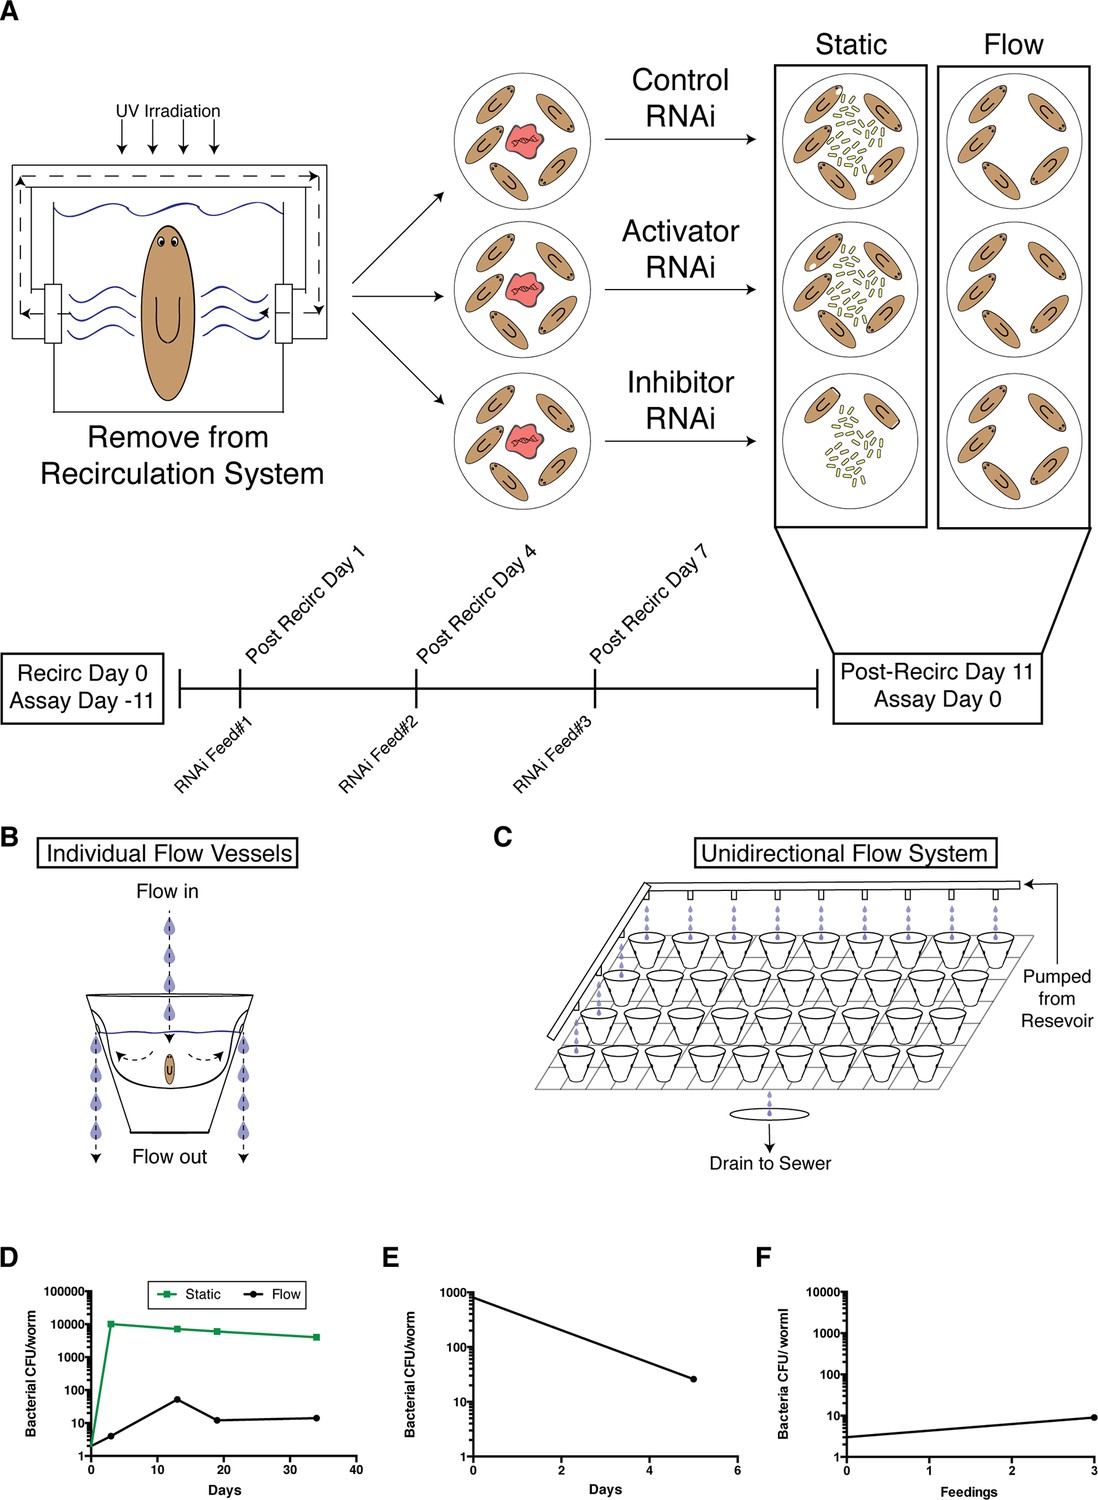
A novel flow culture method for planarian RNAi in low septic conditions.
(A) Diagram depicting comparison of worm health following execution of the RNAi protocol in static versus flow culture. Worms removed from recirculation culture and placed in static culture experience a robust amplification of bacterial levels and are susceptible to lesion formation. RNAi of components that normally inhibit lesion formation or bacterial infection would exacerbate this effect. In comparison, maintenance of worms in a flow culture system can maintain the healthy, low septic state independent of RNAi manipulation. Diagram of (B) individual planarian flow culture vessels and (C) an integrated unidirectional flow system (planaria water is administered to all cups but depicted only in the left column and the upper row to simplify visualization). (D) Comparison of bacterial CFU/worm during culture in static versus flow RNAi conditions following exit from recirculation culture. (E) Effects of flow culture on bacterial CFU of worms with pre-existing heightened bacterial levels. (F) Bacterial CFU/worm prior to and after 3 RNAi feedings in the flow culture system (experiment independently repeated > 3 times). Bacterial CFUs were determined from samples of 4 pooled worms per timepoint.
Figure 5

Heatmap depicting results of an RNAi screen for mediators of pathological progression following bacterial infection in planaria.
(A) Heatmap depicting average pathological scores for each RNAi treatment following 2e8 CFU/ml Pseudomonas infection (n = 5–12 worms per condition). Days versus average pathological score over time are aligned along the y-, and x- axes, respectively. Unc control sample is indicated by a dashed box. RNAi-targeted genes that significantly reduce or enhance pathological progression are highlighted in green and red, respectively (2-way ANOVA p<0.05). (B) Focus on RNAi of genes that result in a significant reduction (activators) or enhancement (inhibitors) or pathological progression. (C–F) Heatmaps depicting the percentage of worms exhibiting pathological stage (C) 0, (D) 3, (E) 5, and (F) 2.5 for each RNAi treatment following Pseudomonas infection. Ordering and significance based on average pathological score over time are maintained for reference.
-
Figure 5—source data 1
Homologous innate immune and inflammatory genes from RNAi screen.
- https://doi.org/10.7554/eLife.16793.015
-
Figure 5—source data 2
Pathological scores of worms in RNAi screen for mediators of infection induced tissue degeneration.
- https://doi.org/10.7554/eLife.16793.016
Figure 6
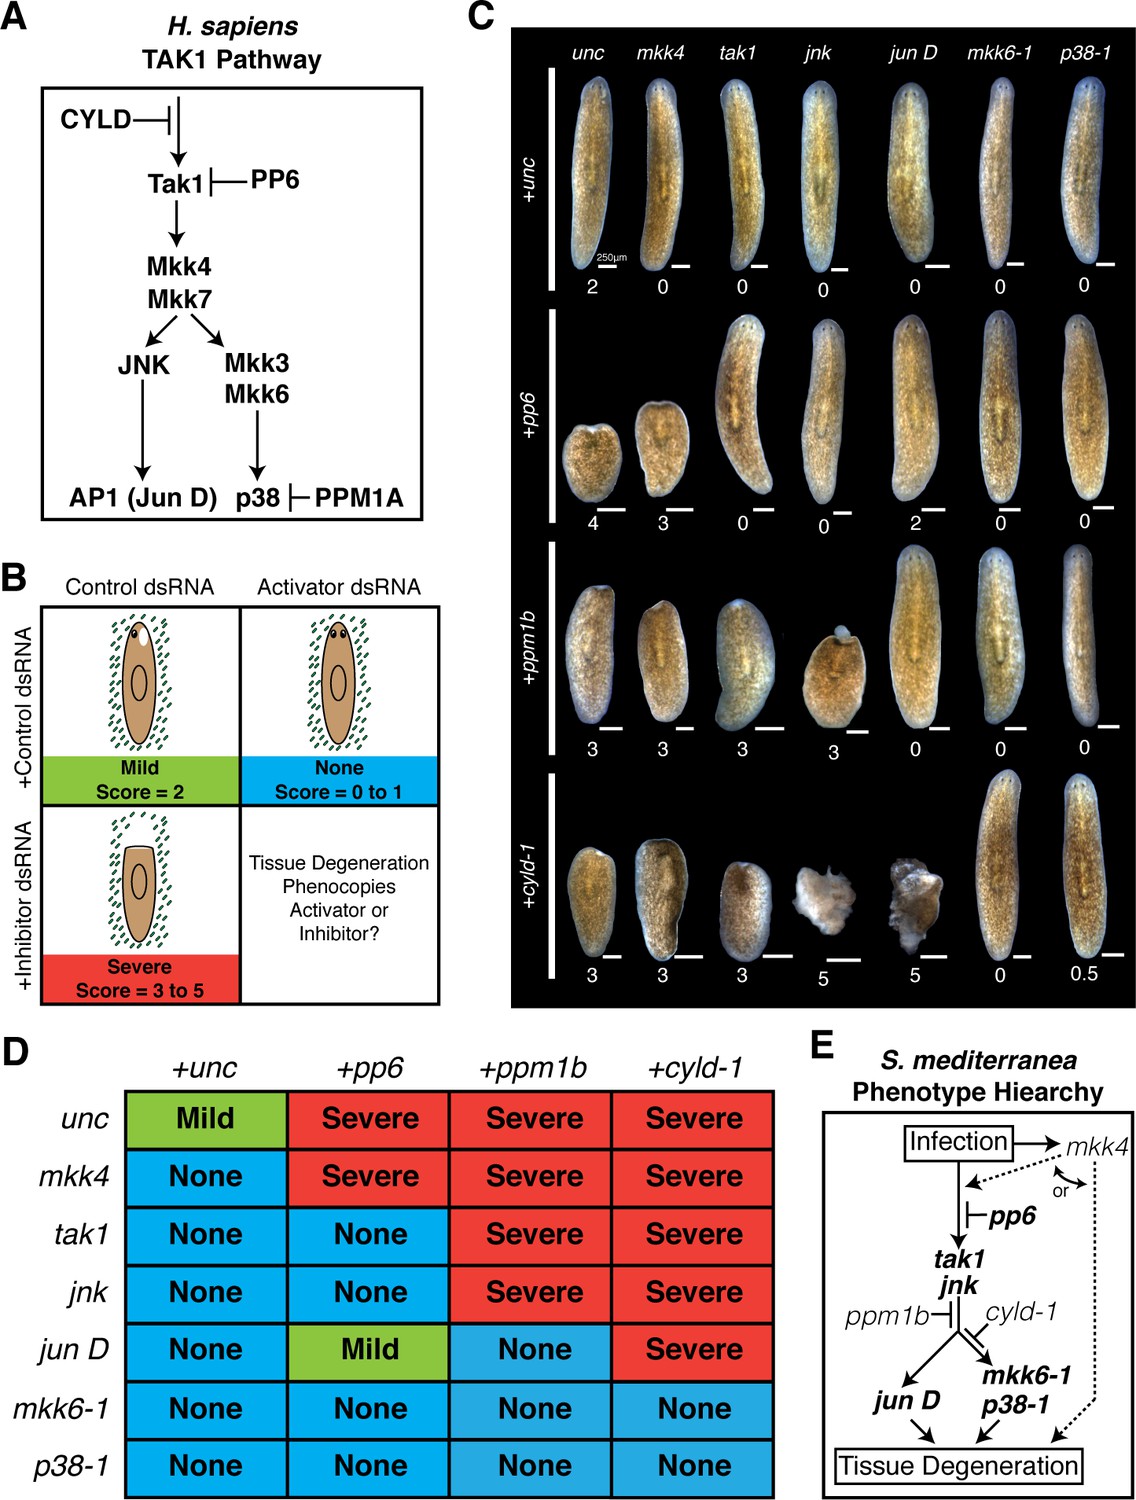
Epistatic analysis of activators and inhibitors of planarian pathological progression.
(A) Diagram depicting relevant components of the TAK1 pathway in Homo sapiens. (B) Diagram depicting combinatorial RNAi experiment and assay of tissue degeneration outcome. (C) Representative images and median pathological stage of worms following RNAi treatment with each combination of 6 activators and 3 inhibitors 12 days post Pseudomonas infection (n = 6–24). (D) Table of phenotypic outcomes following combinatorial RNAi treatment and Pseudomonas infection. (E) Diagram depicting phenotypic hierarchy of the mediators of pathological progression in Schmidtea mediterranea (bold = order is consistent with Homo sapiens TAK1 Pathway).
-
Figure 6—source data 1
Pathological scores of worms during combinatorial RNAi analysis.
- https://doi.org/10.7554/eLife.16793.018
Figure 7
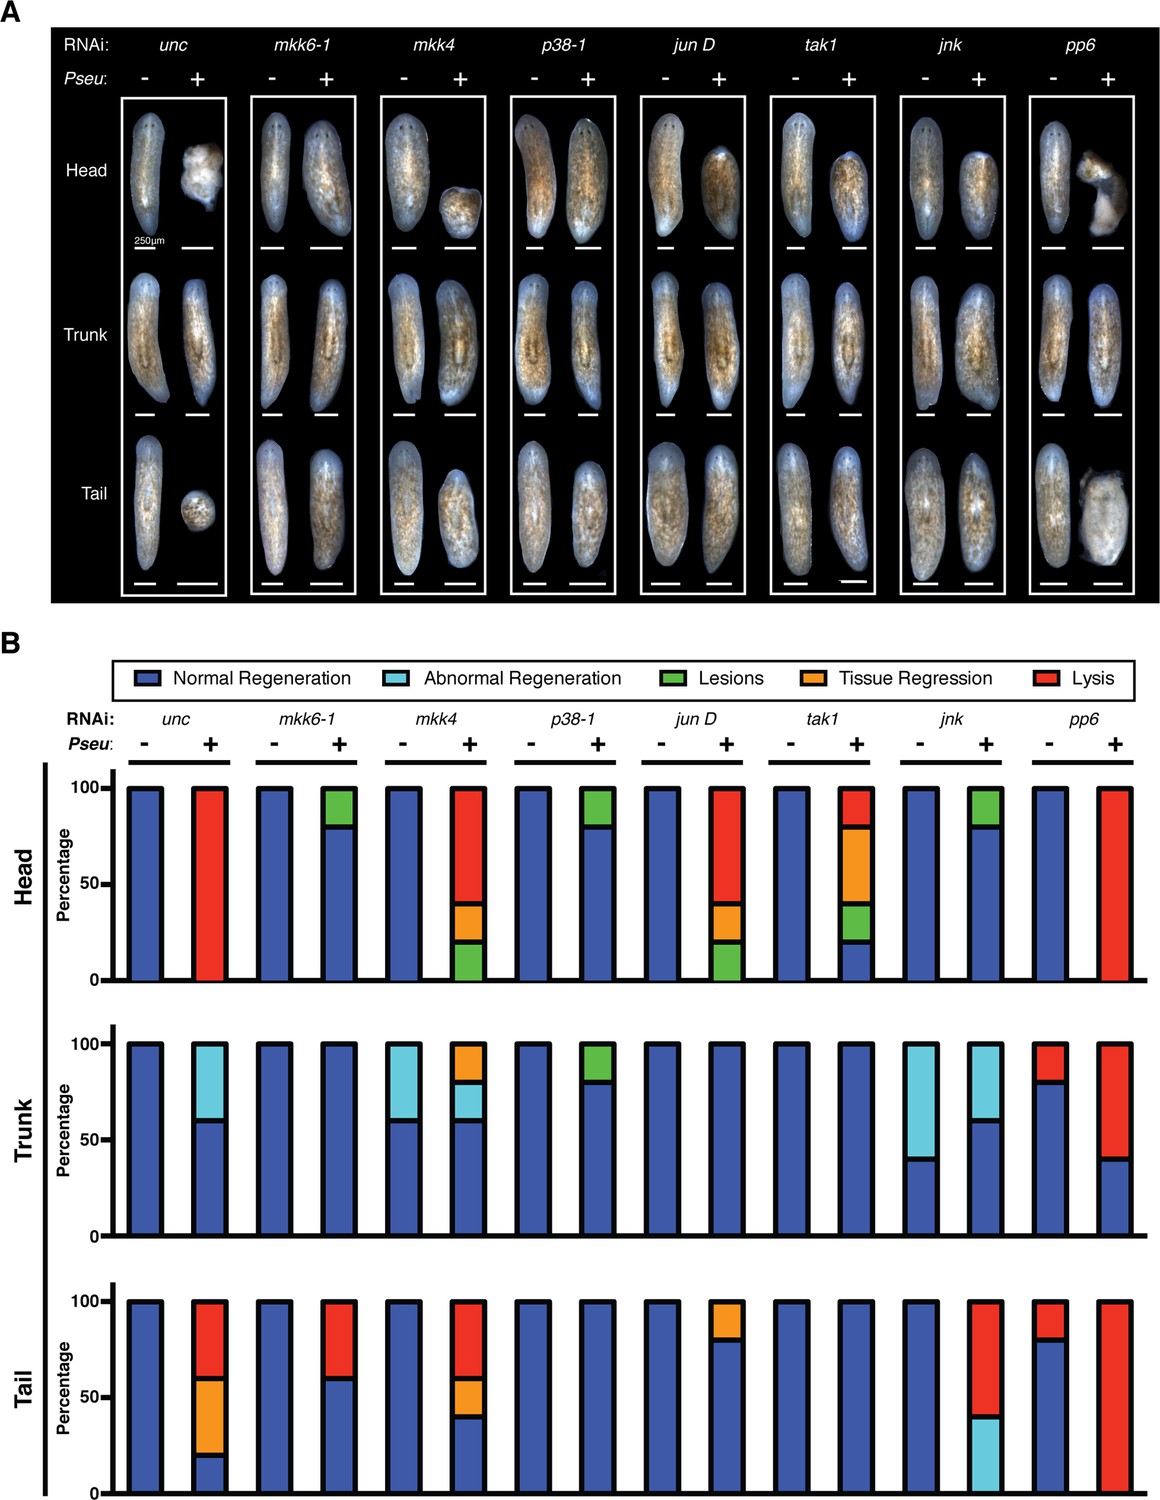
Effects of planarian pathological progression mediators on regeneration in the presence and absence of infection.
(A) Representative images of regenerating head, trunk, and tail fragments following specified RNAi treatment in the presence or absence of Pseudomonas infection. Worms were amputated above and below the pharynx 2 days post infection and imaged 14 days post amputation (n = 5, non-lysed fragments shown when present). (B) Quantitation of phenotypes of regenerating head, trunk, and tail fragments following specified RNAi treatment in the presence or absence of Pseudomonas infection (dark blue = normal regeneration, light blue = abnormal regeneration, green = lesions, orange = tissue regression, red = lysis). Animals were scored at the same time when representative images were taken at 16dpi 14dpa.
Figure 8 with 3 supplements
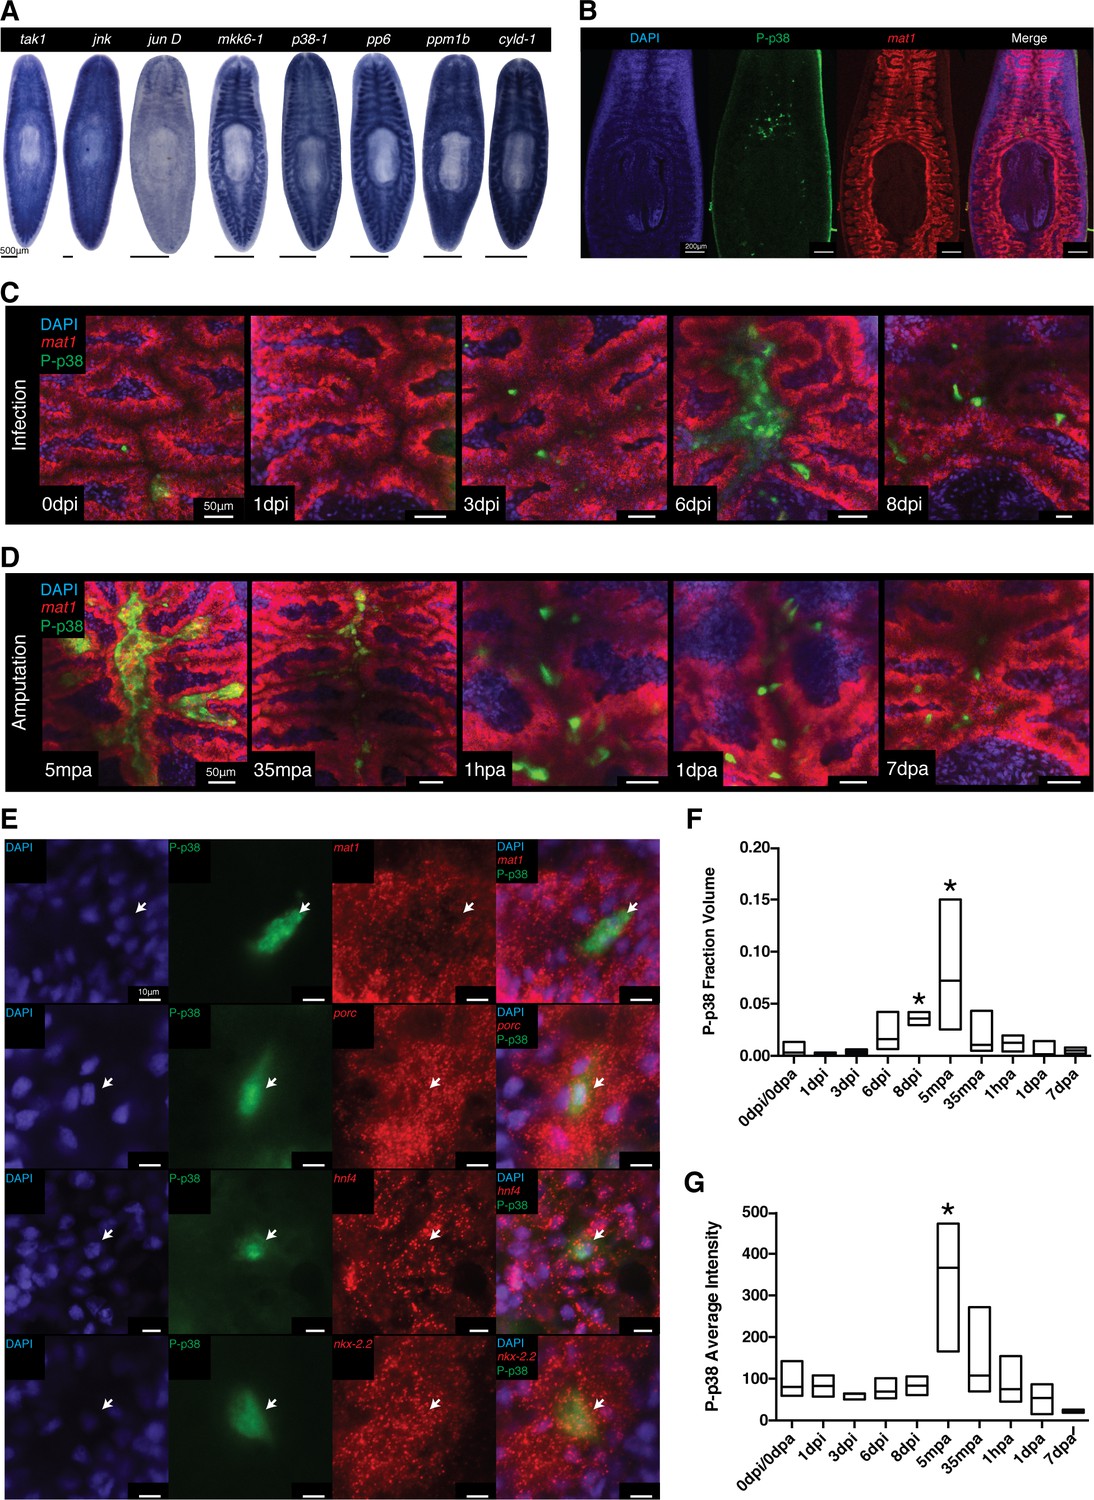
Signaling dynamics in gut tissue during infection and regeneration visualized with a phospho-p38 antibody.
(A) Colorimetric WISH of genes comprising the TAK/MKK/p38 signaling module (n > 3 worms). Combinatorial fluorescent whole mount ISH and immuno-labeling of gut marker mat1 and phospho-p38 (P-p38) (B) prior to stimulation, (C) following infection with 2e8 CFU/ml Pseudomonas, or (D) after amputation (n = 2–11 worms). (E) Higher magnification images of P-p38+ cells co-labeled with gut markers mat1, porc, hnf4, and nkx-2.2 following amputation (35-65 mpa). Quantification of P-p38 (F) Fraction Volume and (G) Average Intensity following infection or amputation (* = t-test p<0.05).
Figure 8—figure supplement 1
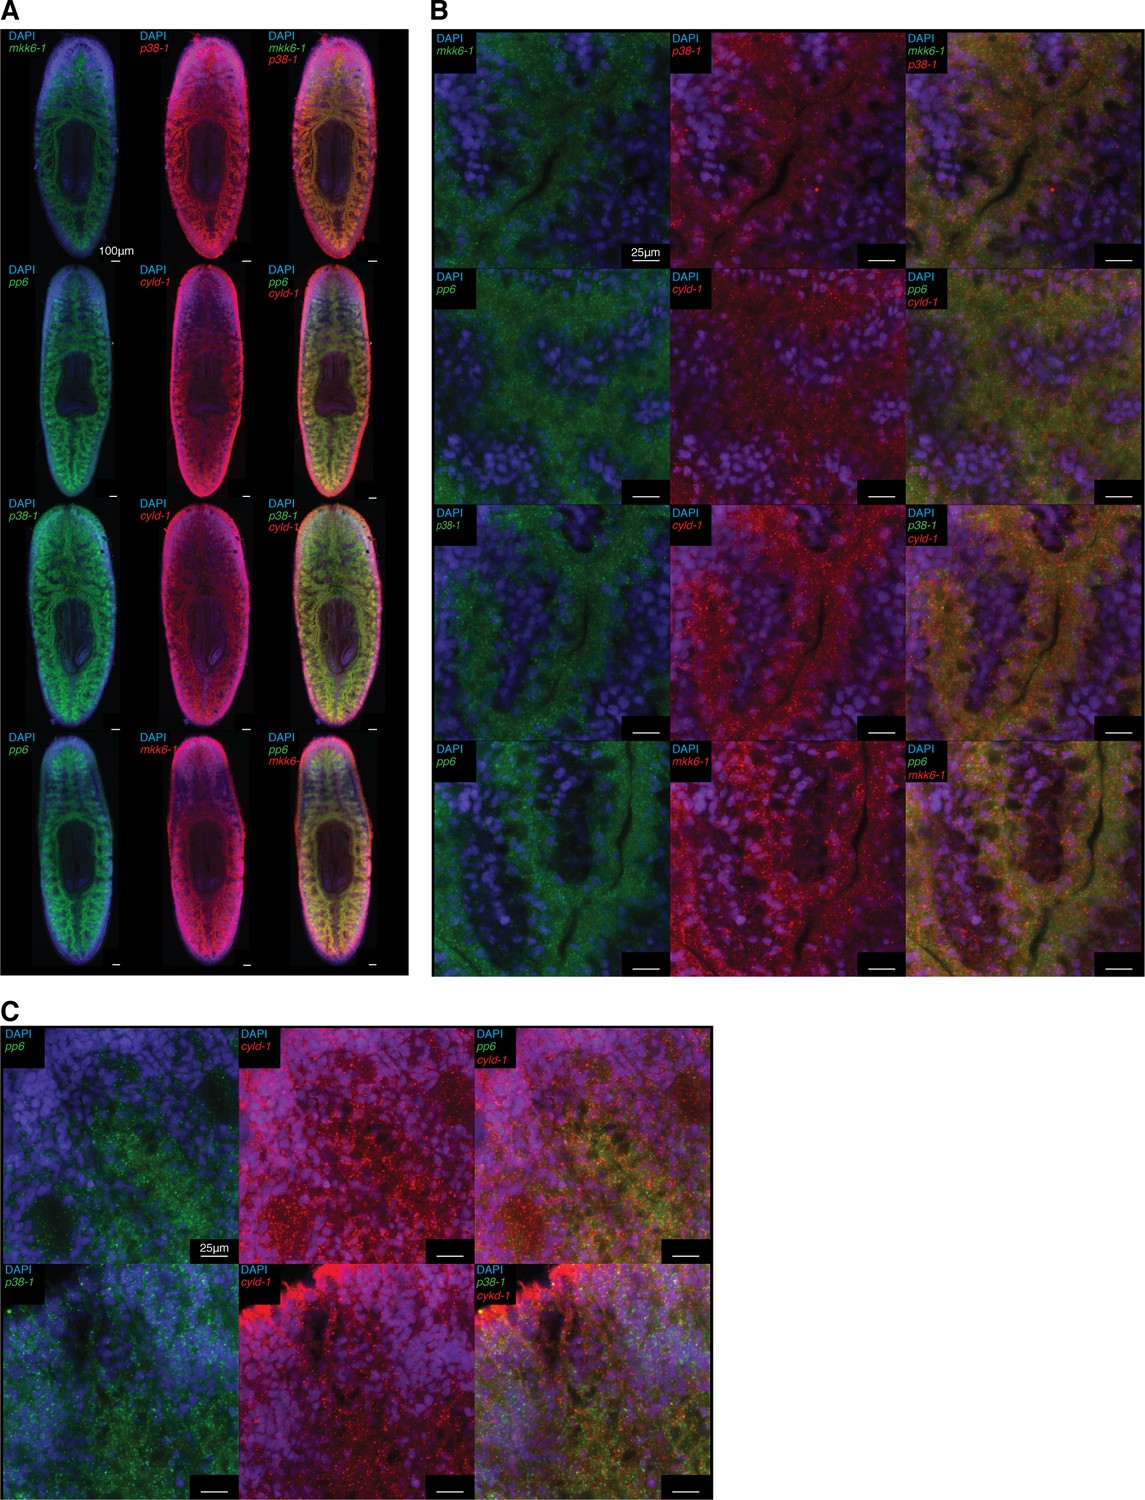
Co-expression of TAK1/MKK/p38 pathway components.
Fluorescent double WISH of mkk6-1/p38-1, pp6/cyld-1, p38-1/cyld-1, and pp6/mkk6-1 in (A) whole worms and (B) posterior gut tissue (n = 6–8 worms).(C) Fluorescent double WISH of pp6/cyld-1 and p38-1/cyld-1 in the anterior mesenchyme (n = 6–8 worms). Identical settings used for posterior gut and anterior mesenchyme for comparison of cells surrounding the gut. Negative controls treated identically but lacking DIG and DNP labeled probes were used to determine non-specific background staining.
Figure 8—figure supplement 2
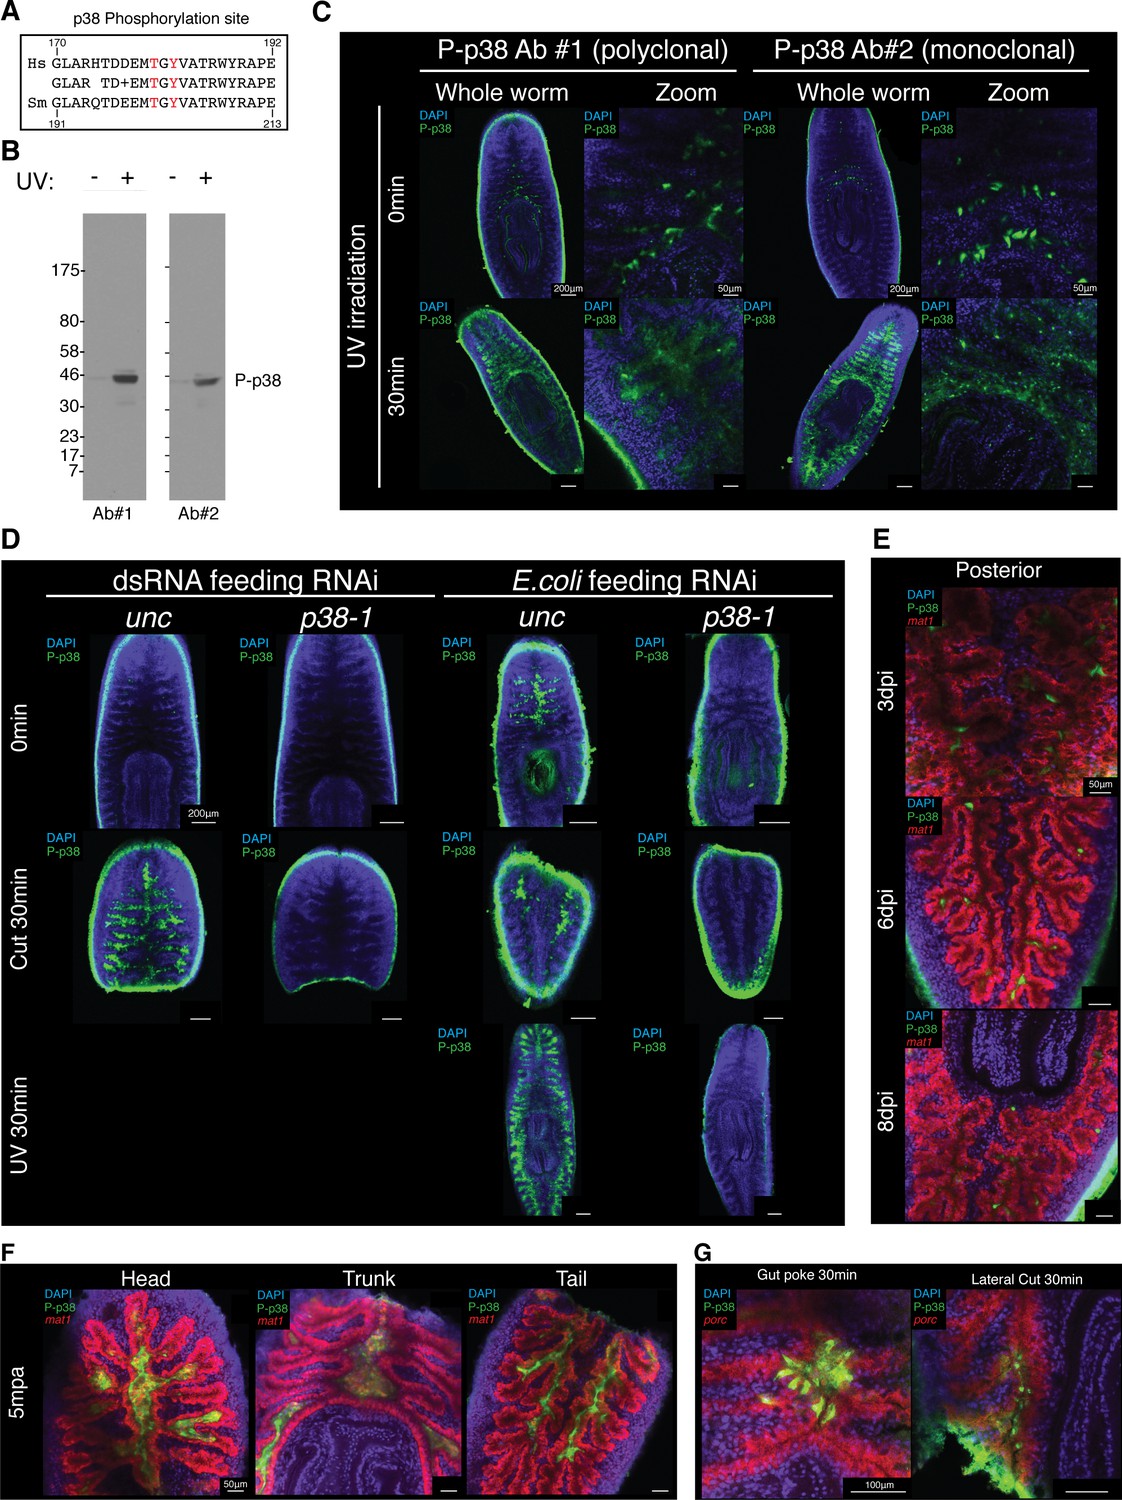
Validation of an antibody that recognizes planarian P-p38.
(A) Conservation of the amino acids surrounding the Thr180/Tyr182 p38 phosphorylation in Homo sapiens and Schmidtea mediterranea. (B) Western blot of planarian protein lysate that is untreated or treated with 30 min of UV irradiation and stained with P-p38 antibody #1 (polyclonal) or P-p38 antibody #2 (monoclonal). (C) Whole mount P-p38 antibody of staining of planaria that are untreated or treated with 30 min of UV irradiation (n > 4 worms). (D) Whole mount P-p38 antibody staining of planaria following unc or p38-1 RNAi and subjected to the following treatments: untreated, 30 min post amputation, 30 min post UV irradiation (n > 3 worms). Confocal images of (E) infected posterior gut or (F) amputated fragments following WISH of the gut marker mat1 and anti-P-38 staining. (H) Whole mount ISH of porc and P-p38 staining of gut tissue injured via poking or lateral cut (n > 2 worms).
Figure 8—figure supplement 3
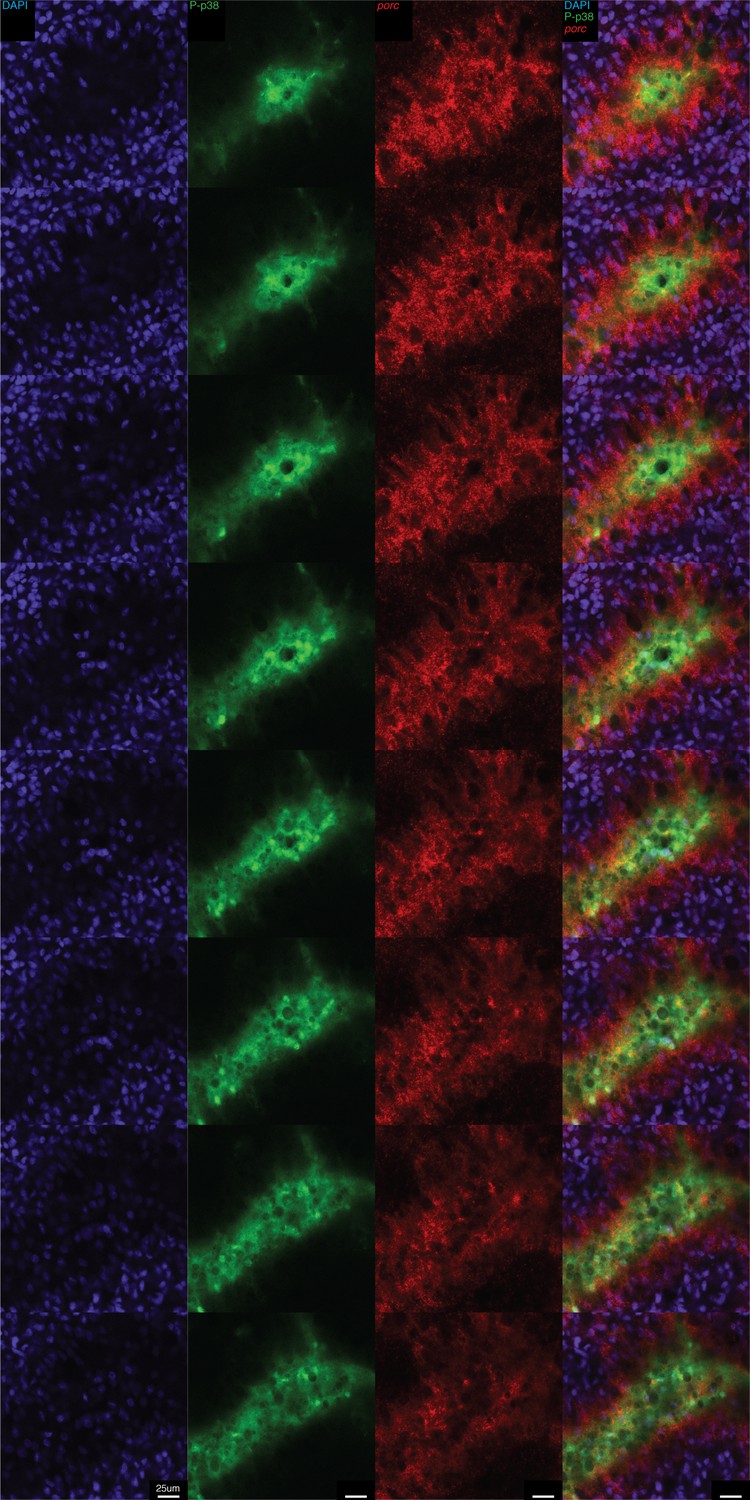
High resolution analysis of P-p38 signaling in gut tissue following amputation.
Whole mount ISH of porc and P-p38 staining of anterior gut tissue 5 min post amputation. Z-series of images.
Figure 9 with 1 supplement
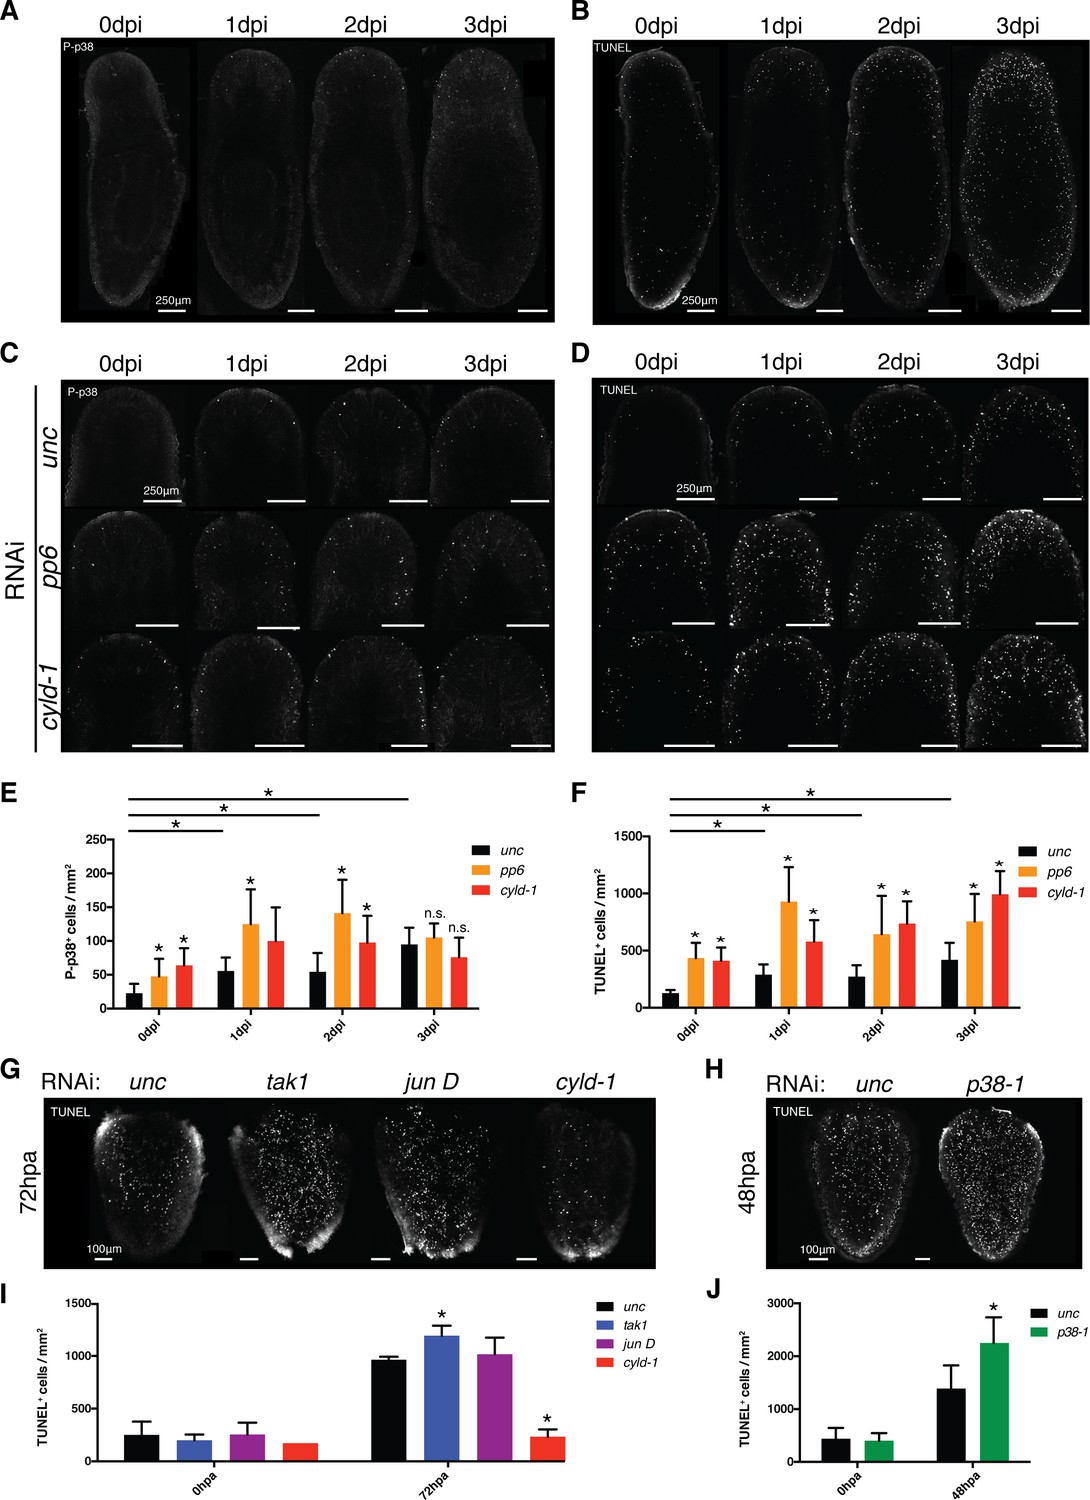
TAK1/MKK/p38 signaling mediates contrasting regulation of apoptosis in infection versus regeneration.
(A) P-p38 staining or (B) TUNEL of Unc RNAi worms following Pseudomonas infection. Focus on the effects of pp6 and cyld-1 RNAi on (C) P-p38 signaling and (D) TUNEL in the anterior regions of planaria during Pseudomonas infection. Quantification of RNAi effects on (E) P-p38+ and (F) TUNEL+ cells in the anterior during infection (n = 5–9). Confocal images of TUNEL in amputated tail fragments following RNAi of TAK1/MKK/p38 signaling components. RNAi effects assayed at (G) 72 hr or (H) 48 hr post-amputation (two independent experiments). (I, J) Quantification of RNAi effects on corresponding TUNEL experiment (n = 1–7) (* = t-test p<0.05).
Figure 9—figure supplement 1
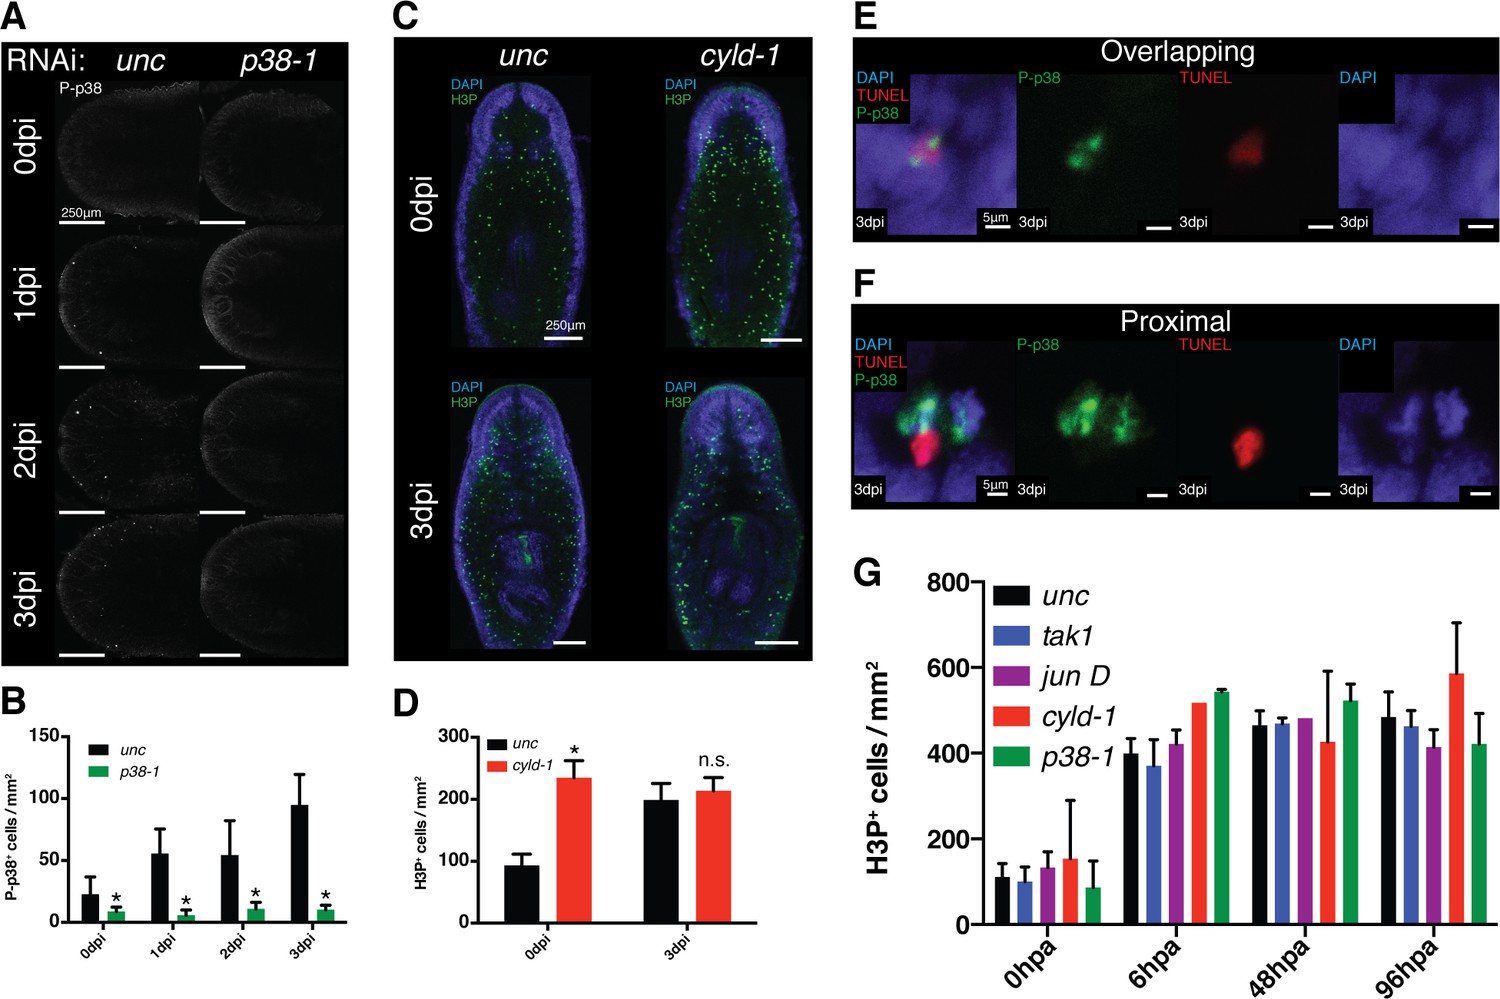
Effects of TAK1/MKK/p38 signaling on proliferation and apoptosis.
(A) Imaging and (B) quantification of the effects of p38-1 RNAi on P-p38 staining of cells in the anterior region prior to or following infection (n = 7–9). (C) Confocal images and (D) quantification of H3P labeling in worms prior to and following Pseudomonas infection of cyld-1 RNAi worms in comparison to unc control (n = 2–5). Magnified images of cells in which TUNEL+ cells either (E) overlap with or are in (F) proximity of P-p38+ cells. Quantification of the effects of TAK1/MKK/p38 signaling on proliferation within tail fragments following amputation (n = 1–13) (* = t-test p<0.05).
Figure 10
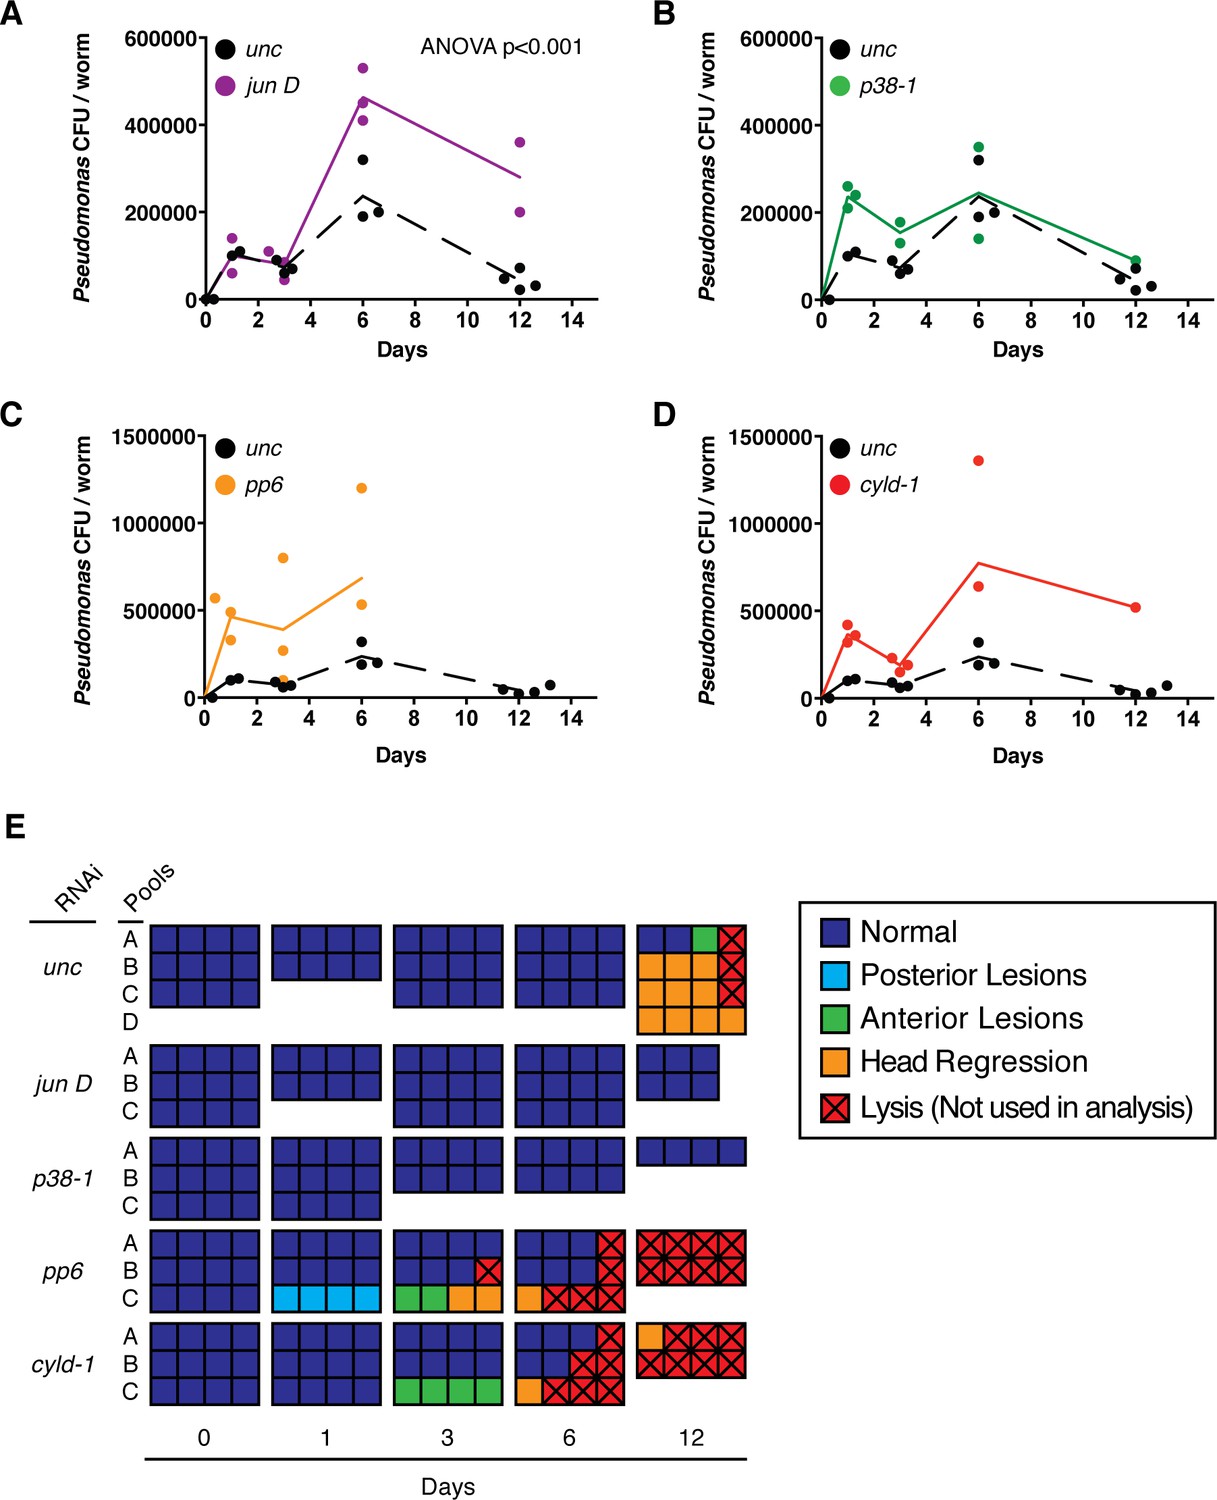
Effects of TAK1 components on the immune response.
Bacterial CFU/worm following infection with a single dose of 2e8 CFU/ml Pseudomonas and RNAi of (A) jun D, (B) p38-1, (C) pp6, or (D) cyld-1 (n = 1–4 pools of 1–4 worms each). (E) Pathological state of individual infected worms (squares) pooled for bacterial CFU/worm analysis.
Tables
Table 1
Distribution of Species reads in CIW4 S. mediterranea.
| No. of species (Average) | No. of species (Standard deviation) | |||||
|---|---|---|---|---|---|---|
| Sample | ≥1 read | ≥10 reads | ≥100 reads | ≥1 read | ≥10 reads | ≥100 reads |
| Recirc D0 | 268.7 | 85.3 | 37.5 | 36.3 | 13.99 | 5.3 |
| D1 -Gent | 245.8 | 79.6 | 34.2 | 17.4 | 5.1 | 0.8 |
| D1 +Gent | 281.8 | 89.4 | 41.2 | 10.8 | 7.8 | 2.7 |
| D3 -Gent | 368 | 144 | 58.8 | 57.2 | 28 | 11.6 |
| D3 +Gent | 354.6 | 126.4 | 57.2 | 26.5 | 14.85 | 5.8 |
Table 2
16 s rDNA homology of emergent bacterial strains.
Table 3
Quantitation of overlapping and proximal P-p38 and TUNEL signal.
| RNAi condition | Days post infection | % of P-p38 signal overlapping with TUNEL | % of P-p38 signal proximal to TUNEL |
|---|---|---|---|
| unc | 0 | 1.27 | 12.66 |
| cyld-1 | 0 | 5.78 | 45.66 |
| pp6 | 0 | 4.29 | 67.86 |
| unc | 1 | 1.16 | 39.31 |
| cyld-1 | 1 | 4.52 | 62.05 |
| pp6 | 1 | 8.87 | 79.31 |
| unc | 2 | 1.90 | 34.29 |
| cyld-1 | 2 | 3.48 | 60.65 |
| pp6 | 2 | 5.73 | 57.96 |
| unc | 3 | 2.55 | 44.19 |
| cyld-1 | 3 | 3.98 | 54.23 |
| pp6 | 3 | 8.29 | 57.46 |
Download links
A two-part list of links to download the article, or parts of the article, in various formats.
Downloads (link to download the article as PDF)
Open citations (links to open the citations from this article in various online reference manager services)
Cite this article (links to download the citations from this article in formats compatible with various reference manager tools)
Pathogenic shifts in endogenous microbiota impede tissue regeneration via distinct activation of TAK1/MKK/p38
eLife 5:e16793.
https://doi.org/10.7554/eLife.16793


