Synergistic plasticity of intrinsic conductance and electrical coupling restores synchrony in an intact motor network
- University of Missouri-Columbia, United States
Figures
Figure 1
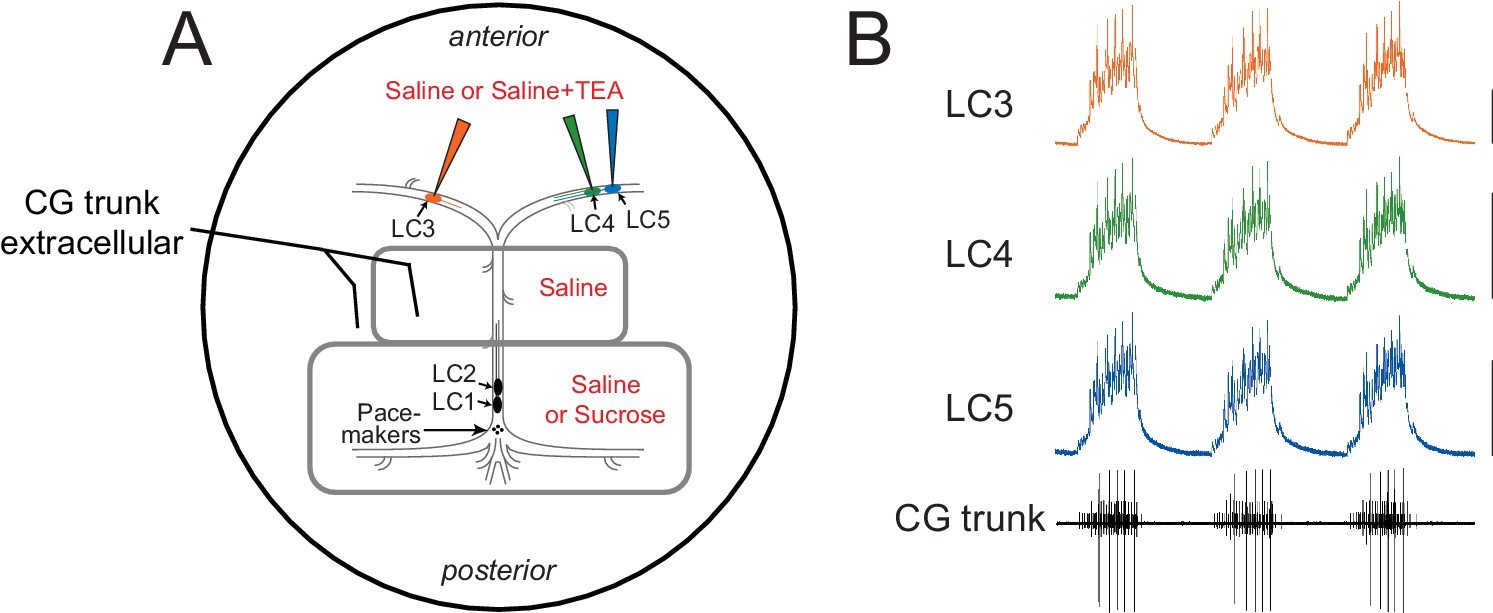
Experimental setup for the recording and superfusion of CG neurons.
(A) Petroleum jelly wells (gray) allow the posterior LC1 and LC2 as well as the pacemaker small cells (SCs) to be pharmacologically isolated from the anterior large cells (LC3, LC4, LC5). Pacemaker cells can be maintained in physiological saline, or the network can be temporarily shut down by replacing saline with 750 mM sucrose. Extracellular recordings are performed with stainless steel pin electrodes from the 'trunk' nerve that contains the axons of all 5 LCs and the pacemaker cells. Intracellular recordings are taken from the anterior LCs. The area outside the petroleum jelly wells is superfused with pharmacological agents to target only the anterior large cells. (B) Simultaneous intracellular recordings from the three anterior LCs and extracellular recording of the network output via the trunk nerve, demonstrating synchrony among LCs in the control ongoing rhythm. Scale bars = 10 mV, recording duration = 9 s.
Figure 2
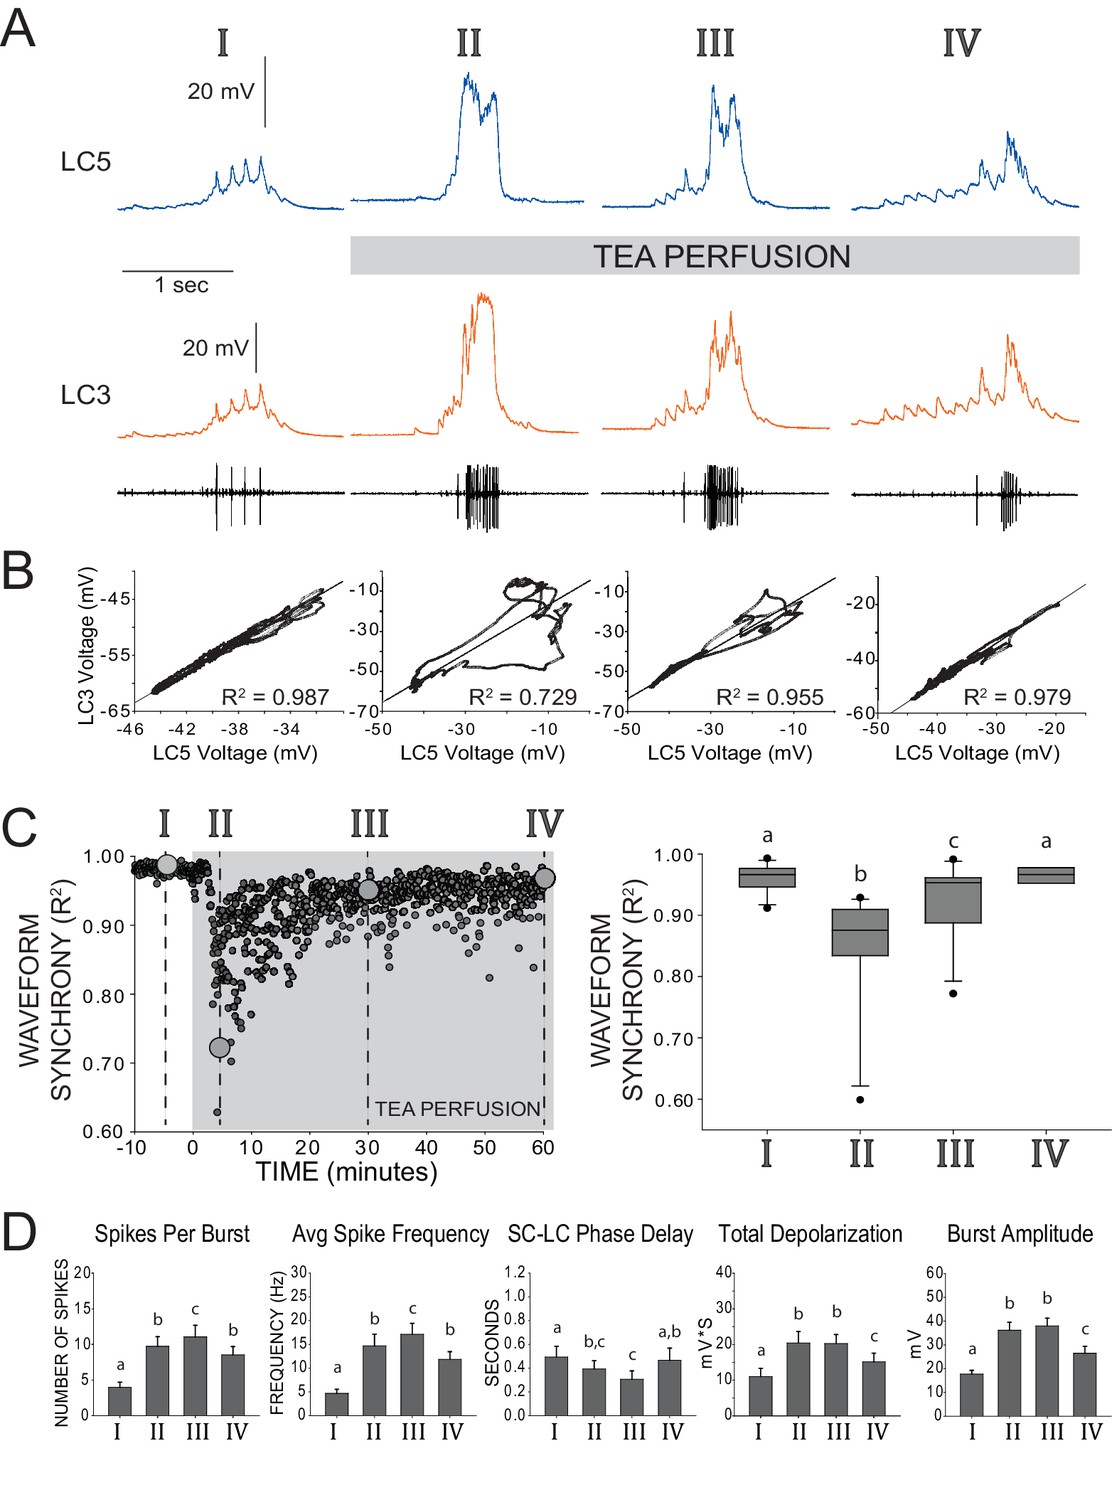
Restored excitability and waveform synchrony among LCs after 1 hr of TEA exposure.
(A) Representative recordings of LC3 and LC5 and of network activity over one hour of TEA exposure. Roman numerals (I, II, III, IV) designate time points of reference throughout the remainder of the figure, as follows: I – control saline, II – acute TEA exposure identified as the maximum effect on loss of synchrony across LCs (i.e. lowest R2 value), III – 30 min of TEA exposure, IV – 60 min of TEA exposure. (B) Scatterplots show pairwise correlation of time-matched voltages (sampled at 10 kHz) of the waveforms shown in the representative traces. R2 values are calculated from Pearson’s correlation tests for these two cells. Loss and restoration of conserved output is demonstrated by changes in coherence in the scatterplot as well as in R2 value. (C) Synchrony of waveforms of the two cells seen in panels A and B plotted as R2 values over the entire time course of the experiment. Roman numerals and large gray circles represent the values that were obtained from the scatterplots as each time point shown in panel B. TEA perfusion persists from time zero through 60 min. Box plots show distributions of R2 values from cross-correlation analyses of LC voltage waveforms for pairs of LCs from N = 11 preparations. Lines within boxes mark the median, box boundaries represent 25th and 75th percentiles, whiskers represent 5th and 95th percentiles, and points represent outlying observations. Groups with significant differences in median synchrony (p<0.05; Wilcoxon signed rank tests) are denoted with different letters. (D) Excitability of LCs was quantified by five measurements (mean ± SD). Analysis of each preparation used the average of 10 consecutive bursts at each time point (N = 8 preparations). Number of spikes per burst, spike frequency within each burst, and the latency between pacemaker firing and first motor neuron spike (SC-LC Phase Delay) were calculated from extracellular traces. Total depolarization and amplitude of each burst are based on intracellular recordings. Significant differences across groups (p<0.05; paired t-tests) are denoted with different letters, such that any two bars with a letter in common are not significantly different.
Figure 3
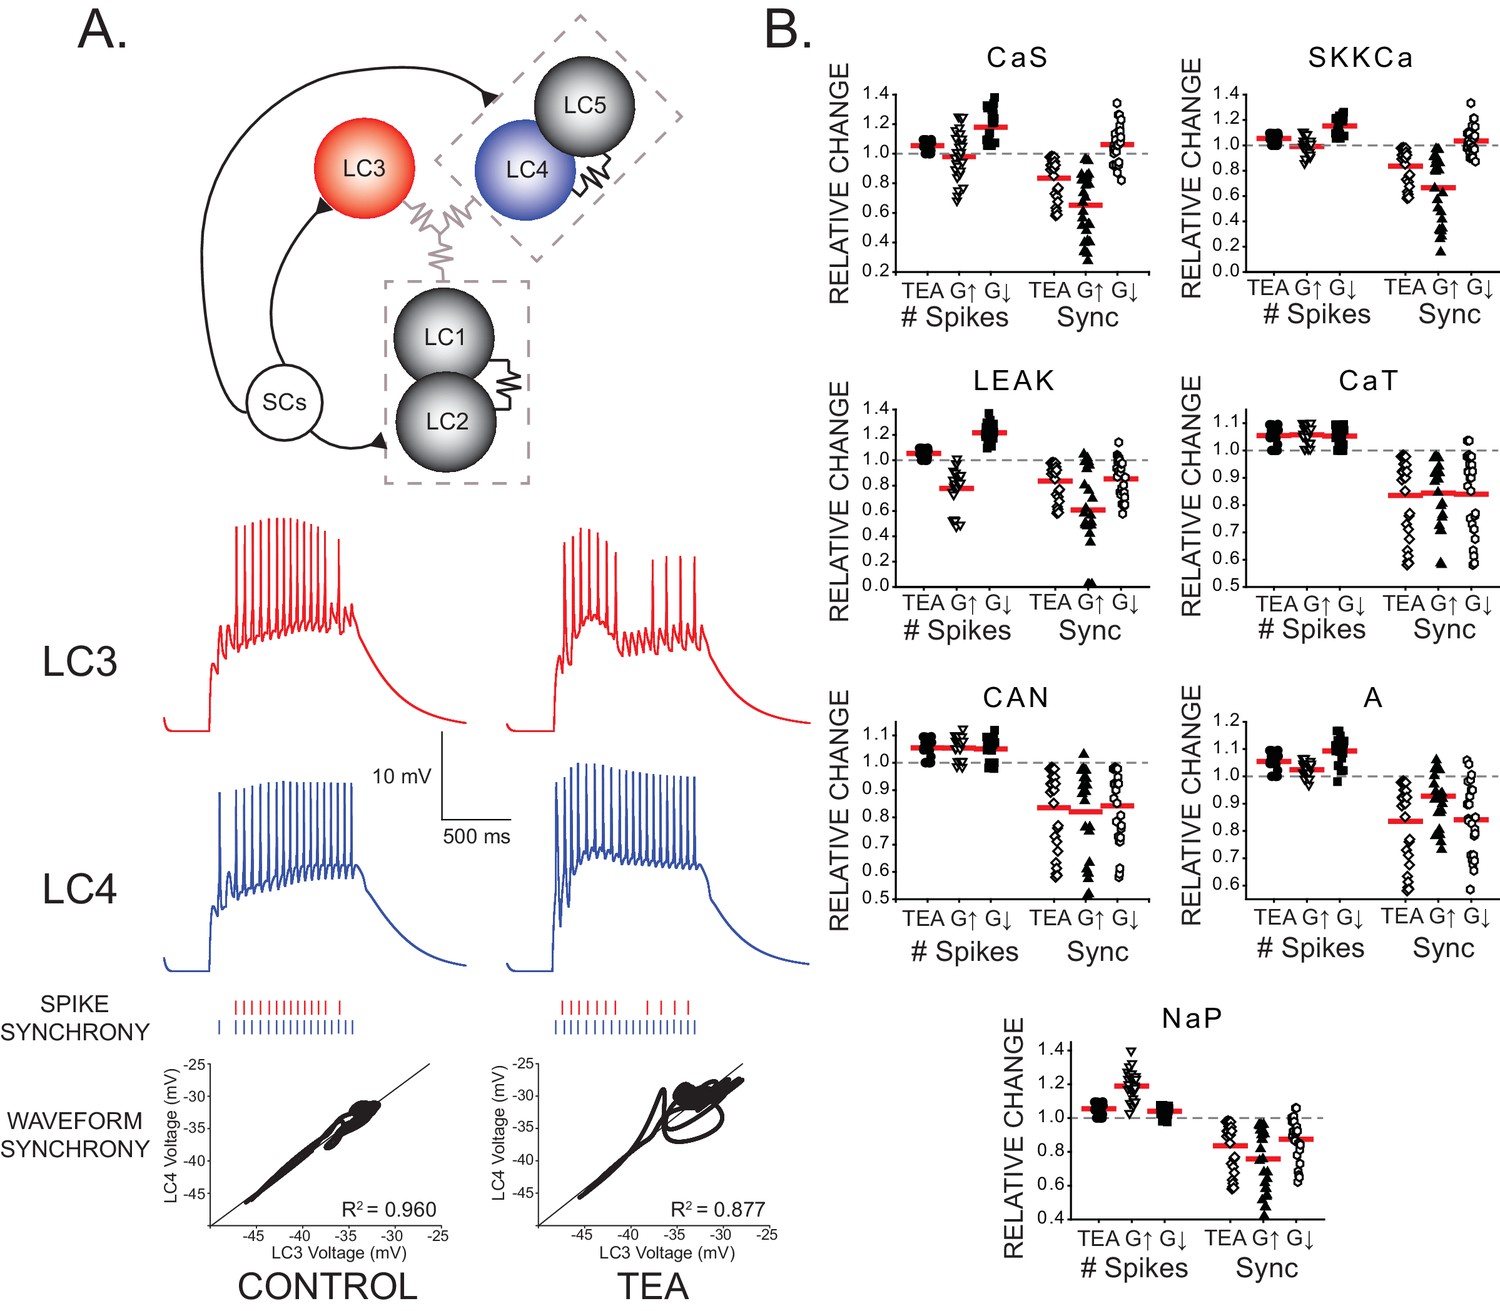
Effects of increasing and decreasing individual ionic conductances on excitability and synchrony in model CG networks.
(A) Schematic representation of model network organization and connectivity. Five large cell (LC) motor neurons are innervated via excitatory synapses from a common small cell pacemaker input (SCs). LC model neurons consist of two compartments - soma and axon - of which only the somata are pictured. Somata contain 9 conductances: GCaS, GCaT, GLEAK, GCAN, GA, GBKKCa, GSKKCa, GKd, and GNaP. Paired LCs (1+2, 4+5) have stronger local coupling (black resistor symbols), and all 5 LCs are reciprocally electrically coupled via weaker gap junctions (gray resistor symbols). An example of LC3 and LC4 model output within a network burst activity is shown in the red and blue traces under both control and TEA (90% reduction in both GKd and GBKKCa) conditions. Graphical representations of spike synchrony (raster plots) and waveform synchrony (scatterplots; as in Figure 2) are shown for the model neurons, demonstrating that both measures reflect the loss of LC synchrony as a result of TEA. (B) Measurements of both output variables (# of spikes and spike synchrony) were made under three model conditions: control, TEA, and TEA + either a 2x increase (G↑) or 2x decrease (G↓) in a given conductance. N = 27 distinct model networks. All output measurements are normalized to their initial (control) conditions. Red lines represent the mean for a given group. Dashed line represents the 1.0 value (baseline) for a given measure. Compensatory responses that restore excitability and synchrony will tend to move the mean towards baseline.
Figure 4
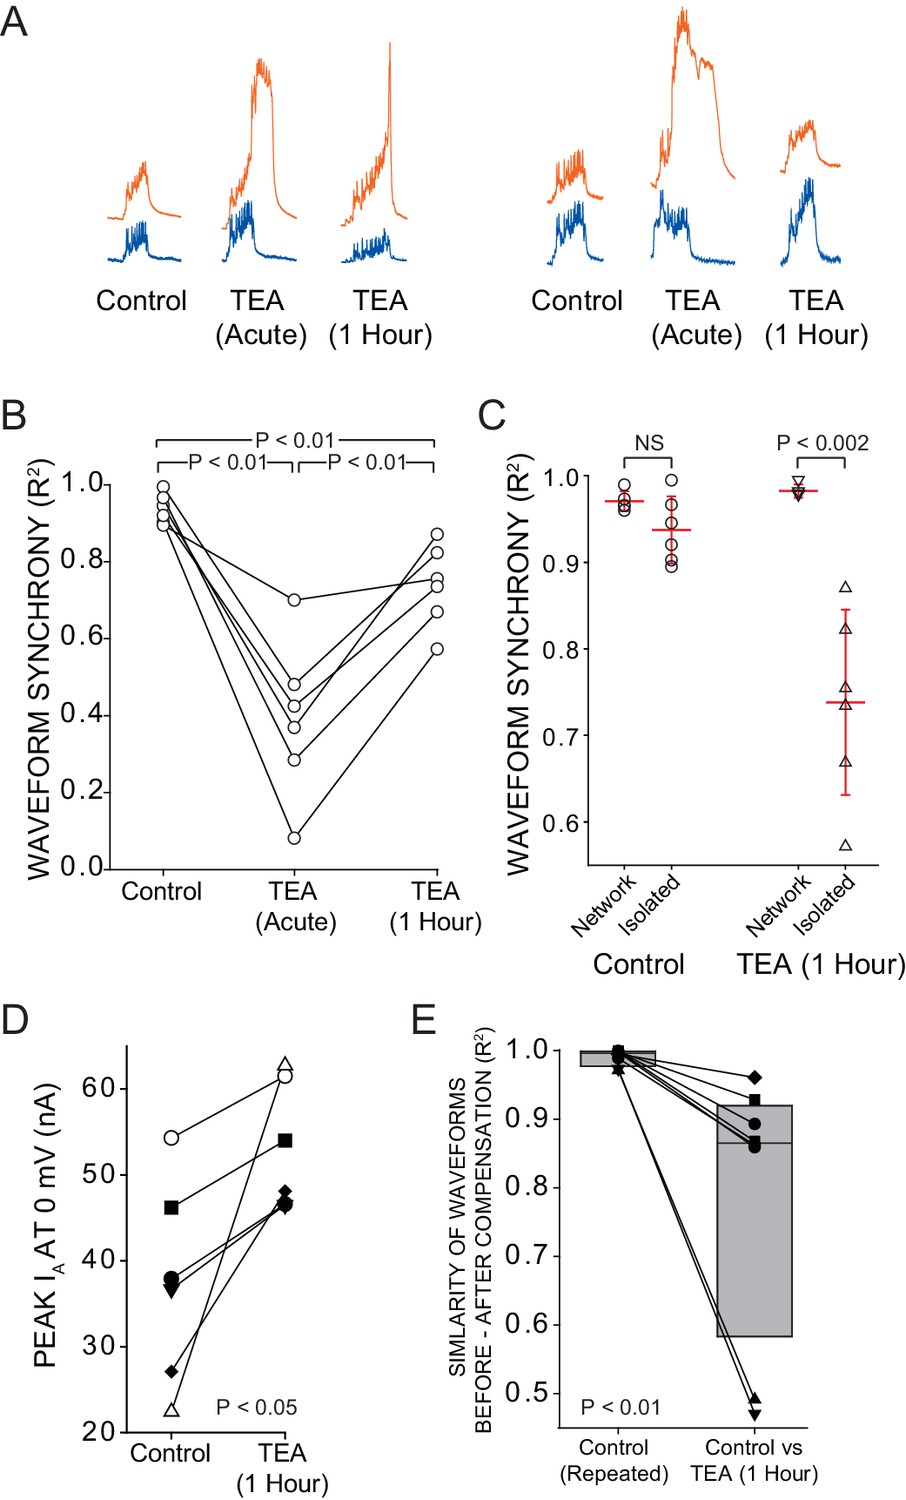
Intrinsic compensation involving GA partially restores synchrony after TEA block.
A reversible sucrose block was used to temporarily stop network activity and a current stimulus protocol was delivered to individual LCs at three time points: control, after 5 min of TEA perfusion (acute), and after 1 hr of TEA perfusion (after compensation). (A) Representative traces from 2 different preparations compare the responses of LC3 (orange) and LC5 (blue) to the same current injection (Stimulus Protocol) at each of the three time points. (B) R2 values for N = 6 preparations at each time point are plotted with the same preparation connected across time points. All 3 conditions were significantly different from one another (p<0.01; paired t-tests). (C) When isolated cell output was compared with the output in the network, there was no difference in R2 at the control state, but following 1 hr of compensation in the network, there was a significant (p<0.002 – t-test) difference in synchrony scores (mean ± SD) between cells when isolated vs. when they are in the intact network. (D) IA was measured by two-electrode voltage clamp before and after compensation in N = 6 LCs in the intact CG. Voltage clamp data were obtained by temporarily silencing network activity with 750 mM sucrose. There was a significant increase in IA after 1 hr in TEA (mean 56 ± 65% increase, p<0.05 –Wilcoxon signed rank test). (E) Similarity of waveform in the same neurons before and after 1 hr TEA exposure. R2 values were calculated for the output of the same cells before and after TEA exposure, and are shown as before-and-after values in the same cell connected by a line. Box plots show distributions of R2 values from cross-correlation analysis of LC voltage waveforms N = 8 cells. Lines within boxes mark the median, box boundaries represent 25th and 75th percentiles. 'Control' is the comparison of voltage waveforms to 2 separate rounds of current injection in the absence of TEA. Although there was improvement in similarity of waveforms after 1 hr in TEA (panel A), the newly compensated output after 1 hr of TEA exposure does not recapitulate the original response to the stimulus protocol (significantly different from control; p<0.01 – Wilcoxon signed rank test).
Figure 5
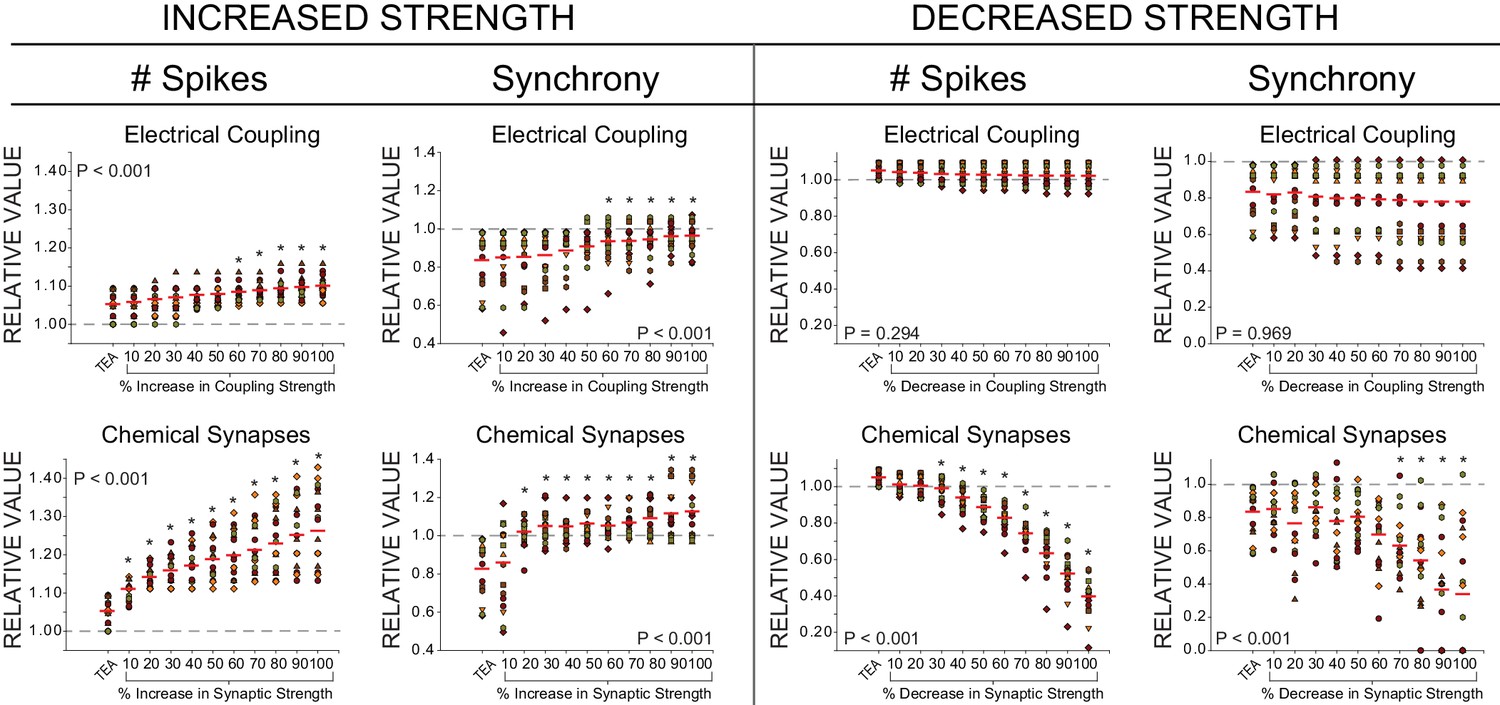
Effects of increased or decreased strength of chemical synapses and electrical coupling on excitability and synchrony in model CG networks.
Measurements of two output variables (# of spikes and synchrony) were made under three model conditions: control, TEA (90% reduction in both GKd and GBKKCa), and TEA + an incremental increase or decrease (up to 100% by 10% increments) for both chemical (pacemaker to LC) or electrical (LC to LC) connections. N = 27 distinct model networks. All output measurements are normalized to their initial (control) conditions to visualize trends. Dashed line represents the 1.0 value (baseline) for a given measure. Red lines represent the mean for each group. Each different colour and shape for points corresponds to one model network, and the same networks are shown across conductance levels. P-values in each plot refer to the results of a one-way ANOVA across all groups. Asterisks (*) denote groups in each plot that were significantly different from the TEA group via Holm-Sidak post-hoc tests.
Figure 6

Changes in electrical coupling associated with compensation in biological CG networks.
(A) Artificial electrical coupling restores synchrony in isolated LCs. With acute exposure to TEA, isolated LCs produce disparate output in response to an identical stimulus. The stimulus protocol consists of current injections that mimic biological synaptic currents and back propagating action potentials (see Ransdell et al., 2013a) from four consecutive bursts of network activity. The current was injected simultaneously into isolated cells, while the dynamic clamp was used to provide an artificial coupling conductance. Representative traces of the same two cells shown in TEA with different levels of synaptic current applied. Only the final burst of the four-burst input stimulus is shown for clarity. N = 7 different preparations (bottom panel) show an increase in synchrony with increasing coupling conductance. (B) Biological coupling increases during network compensation. Hyperpolarizing current injections were used to measure coupling coefficients between LC3 and LC5 during control conditions, with acute TEA exposure (5 min) and after 1 hr compensation in TEA. The input resistance of LCs was measured and showed no significant change at any time point. No significant differences were observed for coupling coefficient or coupling conductance between control and acute TEA conditions. Coupling coefficient significantly increased after 1 hr in TEA (Mean increase 85 ± 82% from control, N = 11, p<0.01, Wilcoxon signed rank test). Measurements from LC4 and LC5 show that coupling conductance increased significantly as a result of 1 hr TEA exposure (mean increase 49.5 ± 36% from control, N = 13, p<0.001, Wilcoxon signed rank test). Significant differences across groups are denoted by different letters. Plots show mean ± SD. (C) Representative traces from two different preparations of changes in coupling observed before (Control) and after 1 hr of TEA exposure. Top traces are between LC3-LC5 and the bottom traces are between LC4-LC5. Measurements were made in two-electrode current clamp, and the current was injected into LC5. Because current injections were manually timed to occur between bursts of network activity, slightly different durations of current pulses occurred in the two recordings in the top recordings. Recordings from LC4-LC5 were used for coupling conductance measurements seen in panel B, as their close proximity allows for much less influence of electrotonic distance on calculations of conductance.
Figure 7
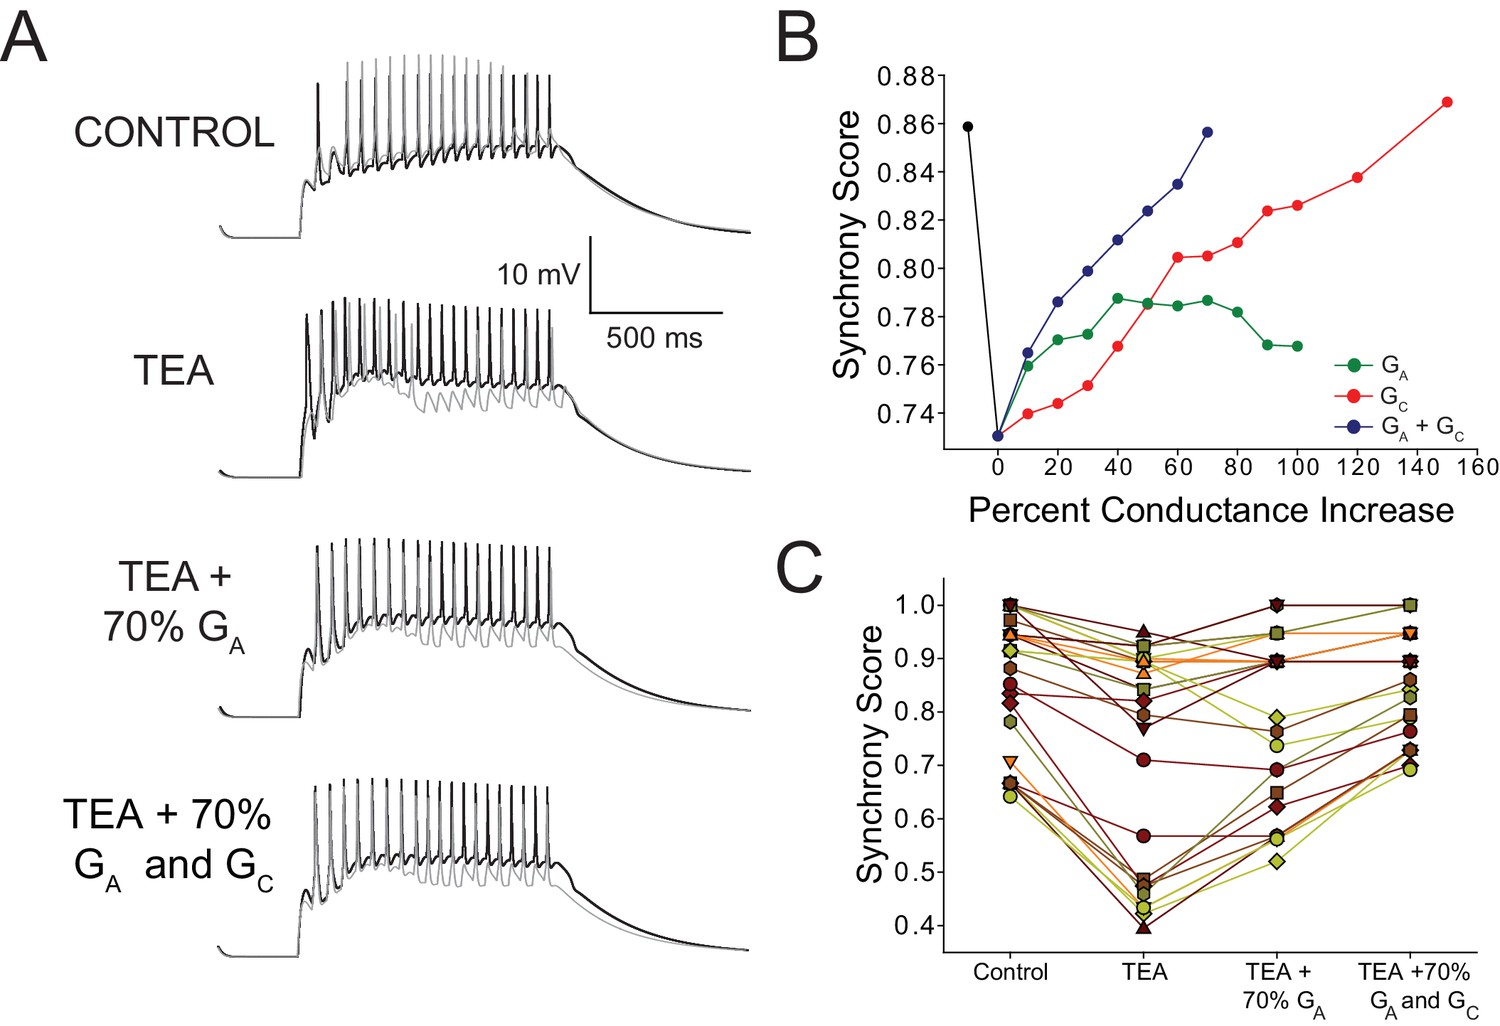
Increased GA and coupling conductance (GC) among LCs act in concert to help restore synchrony across LCs in model networks.
(A) Voltage response of a typical network LC3 (gray) and LC4 (black) cells under three model conditions: control, TEA (90% reduction in both GKd and GBKKCa), TEA + 70% increase in GA, and TEA + 70% increase in GA and GC. (B) Effects of increasing GA alone, GC alone, or both GA and GC on synchrony in model networks. Dashed lines represent simple linear regression fits to the points for each condition. Black line represents the change in synchrony from control to TEA. Points shown are the average values for N = 27 networks. (C) Summary of Synchrony Score shown for all 27 model networks. Stepwise changes are shown from Control, TEA, TEA + increasing GA by 70%, and TEA + increasing both GA and GC by 70% (the point at which maximal synchrony is restored as per the analysis in panel B). Individual points correspond to those used to generate averages in panel A at the 70% level to give an idea of the variability in the data set. Individual preparations are connected with lines to show trends across networks.
Tables
Table 1
Nominal model conductance values:
| Conductance | Value (S/cm2) |
|---|---|
| Leak | 2e-4 |
| A | 6e-4 |
| BKKCa | 7.3e-3 |
| g1_Kd | 3e-4 |
| g2_Kd | 3.5e-5 |
| CaS | 1.7e-4 |
| CAN | 1.06e-4 |
| SKKCa | 8.79e-5 |
| CaT | 1.5e-4 |
| NaP | 3.06 e-4 |
Table 2
Model current parameters.
| Iion | xp | x∞ | τx (msec) |
|---|---|---|---|
| IA | m3 | ||
| h | |||
| ICaS | m2 | ||
| h | |||
| ICaT | m | ||
| h | |||
| Ikd | m14 | ||
| h1 | |||
| m24 | |||
| INaP | m3 | ||
| ICAN | w | ||
| ISKKCa | w | ||
| IBKKCa | a | ||
| b |
-
F = Faradays constantR = Gas constantV = Membrane voltage[Ca2+] = Calcium concentration
Download links
A two-part list of links to download the article, or parts of the article, in various formats.
Downloads (link to download the article as PDF)
Open citations (links to open the citations from this article in various online reference manager services)
Cite this article (links to download the citations from this article in formats compatible with various reference manager tools)
Synergistic plasticity of intrinsic conductance and electrical coupling restores synchrony in an intact motor network
eLife 5:e16879.
https://doi.org/10.7554/eLife.16879


