Limitations to photosynthesis by proton motive force-induced photosystem II photodamage
- Michigan State University, United States
- Max-Planck-Institut für Molekulare Pflanzenphysiologie, Germany
- Imperial College London, United Kingdom
- Washington State University, United States
Figures
Figure 1
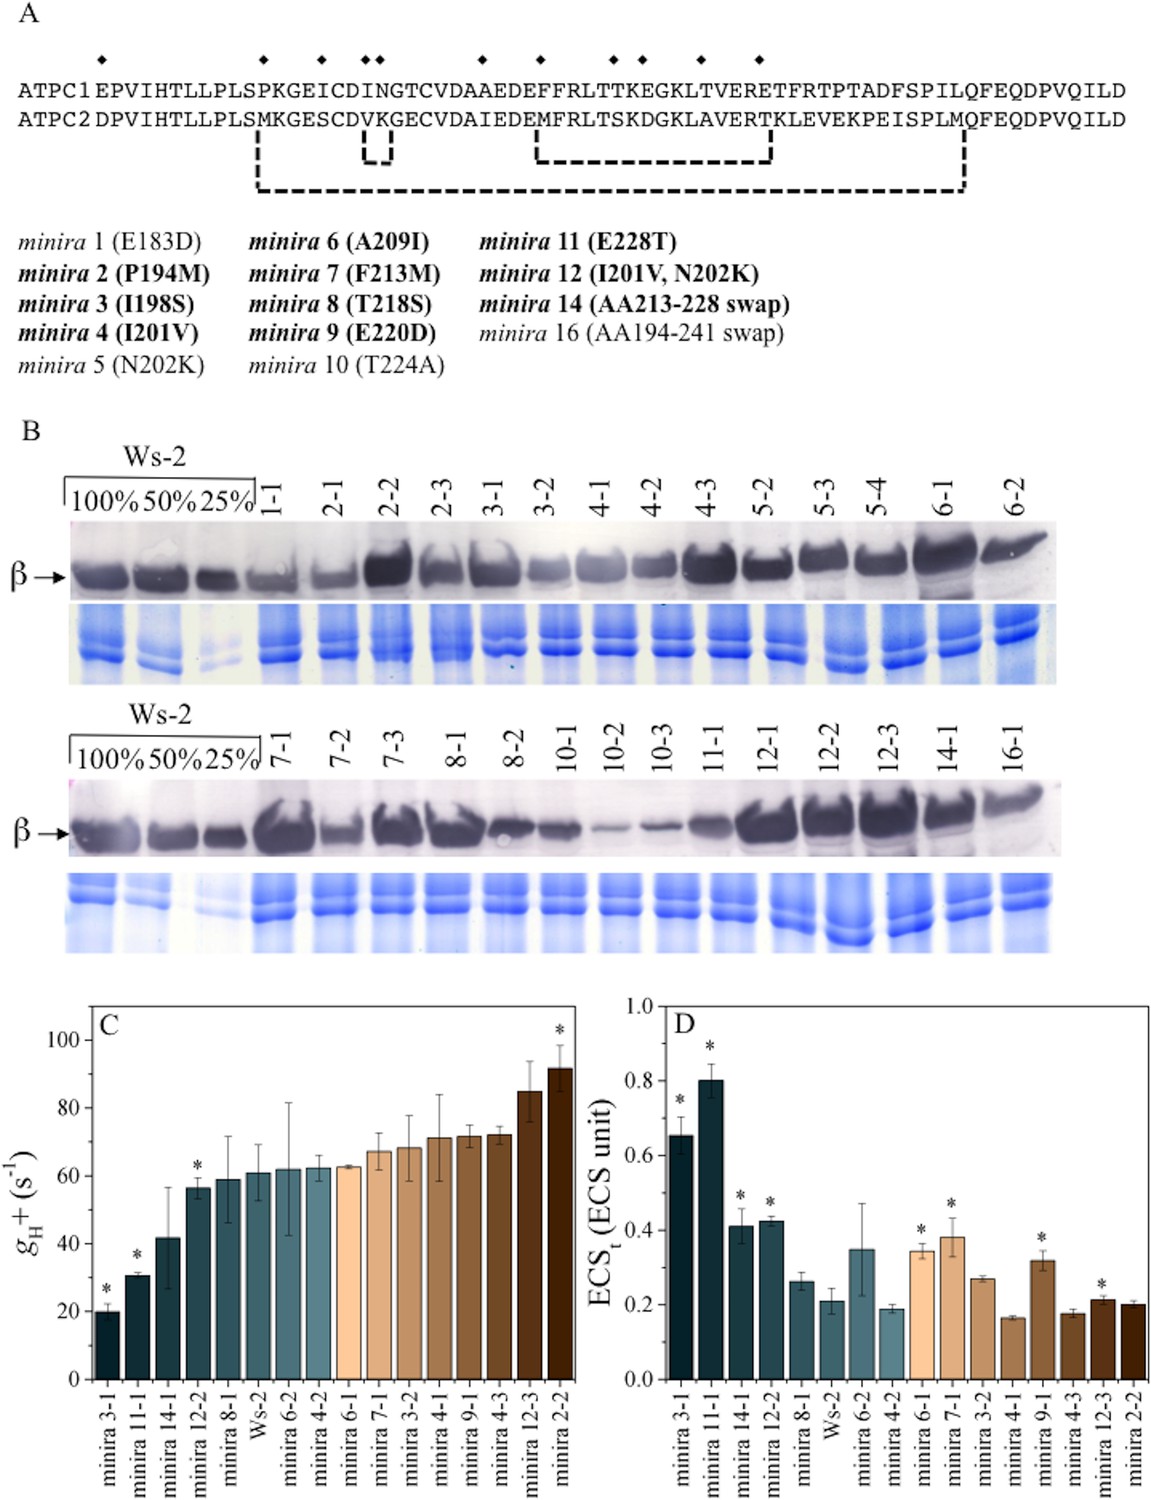
γ-subunit mutations alter photosynthetic proton efflux.
Sequence alignment of Arabidopsis ATPC1 and ATPC2 regulatory region (A). Amino acid differences incorporated into ATPC1 to generate minira are indicated by symbols (♦). Amino acid numbers are based on standard spinach positions, which minira numeric designations are based upon position within the amino acid primary sequence. Regions where multiple changes were incorporated from ATPC2 are outlined in brackets. Bold: mutations resulting in successful transgenic plants with stable phenotypes utilized for experiments. Accumulation of chloroplast ATP synthase complexes was verified across resulting transformant lines (B). Total leaf protein was probed for chloroplast ATP synthase β-subunit compared to a titration of wild type (Ws-2) accumulation. Gels run with identical samples stained with Coomassie Brilliant Blue are shown below to ensure equal loading to the 100% wild type samples. The conductivity of the ATP synthase for protons (gH+, C) and the light-driven pmf (ECSt, D), calculated from the decay of the electrochromic shift at 100 μmol photons m−2s−1 actinic light (mean ± s.d, n = 3). Statistically significant differences (*p<0.05) from wild type were determined using a t-test. ECS units were defined as the deconvoluted ΔA520 μg chlorophyll−1 cm2.
Figure 2 with 16 supplements
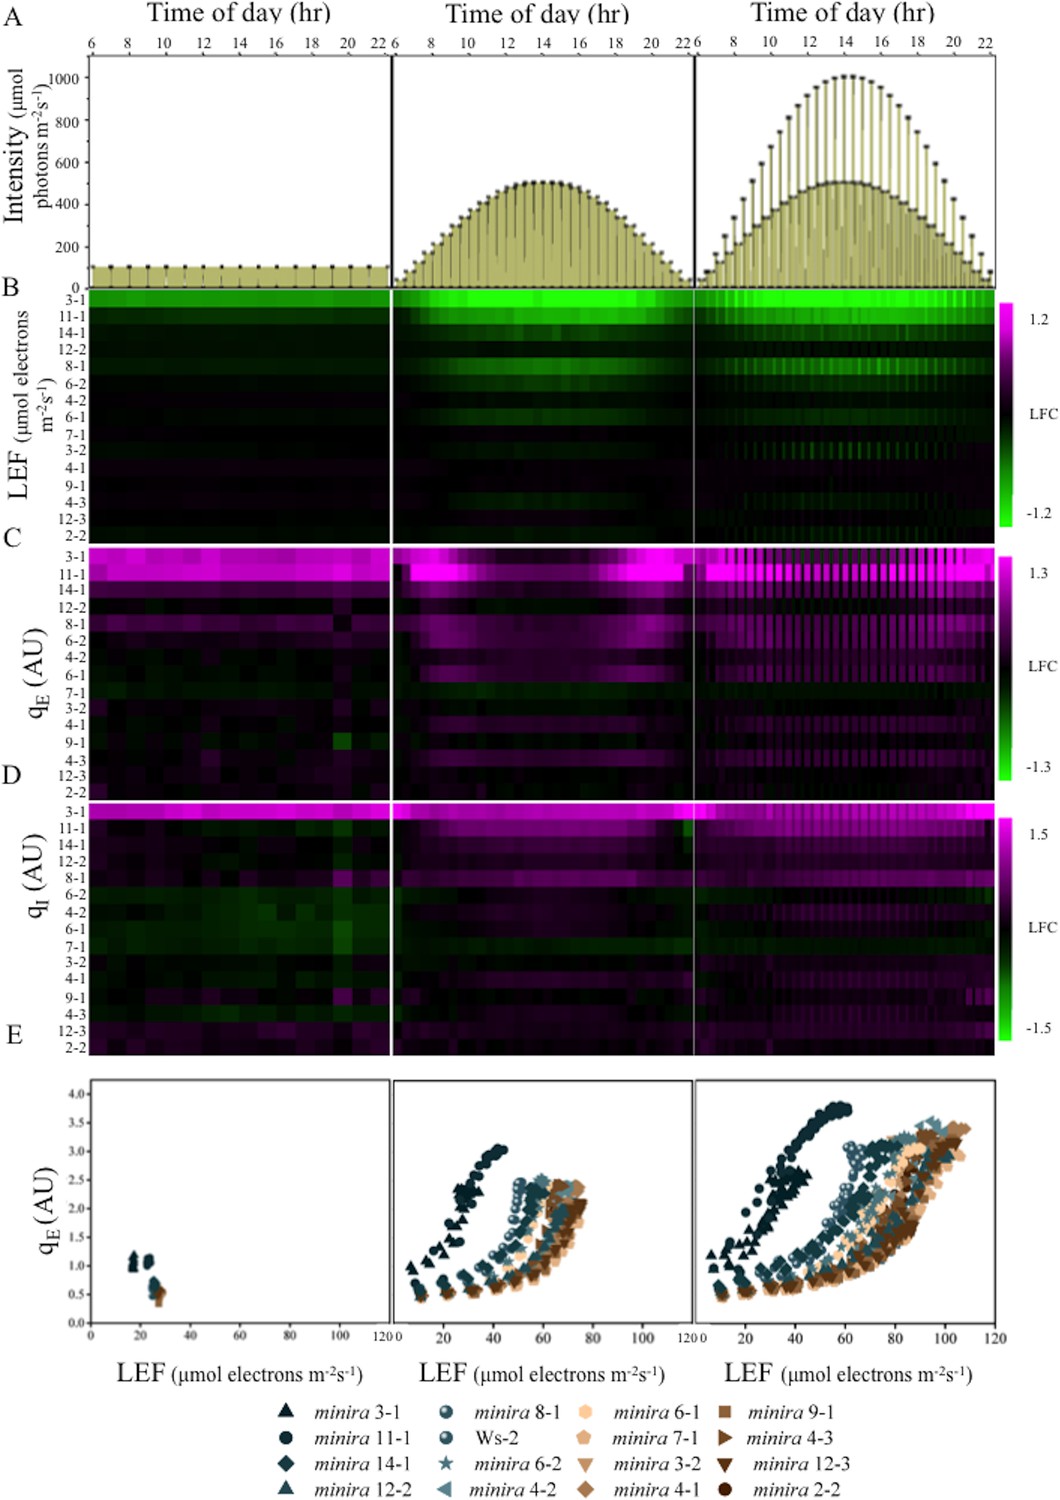
Dynamic light conditions enhance pmf dependent phenotypes.
Whole plant fluorescent images were captured over three days under the illumination conditions displayed in Panel A and listed in Supplementary file 2. Plants were illuminated over the 16-hr photoperiod, shown as yellow filled areas representing the light intensity when present in A, under either a constant light intensity (day one), a sinusoidal photoperiod (day two), or a sinusoidal photoperiod interrupted by fluctuations in light intensity (day three). Square symbols in Panel A indicate each light intensity change. Steady-state fluorescence parameters were captured for each plant at the end of each light condition. Panels B,C and D represent the responses of LEF, qE and qI respectively (n ≥ 3). Data are shown as log2-fold changes compared to the wild type. Kinetic data including wild type are shown in Figure 2—figure supplements 1–15. The rows were sorted in order of ascending gH+ values measured as in Figure 1C. Panel E plots the dependence of the mean (n ≥ 3) of qE against the linear electron flow (LEF) for each time point measured for the day. For visualization purposes the error bars have been omitted from E.
Figure 2—figure supplement 1
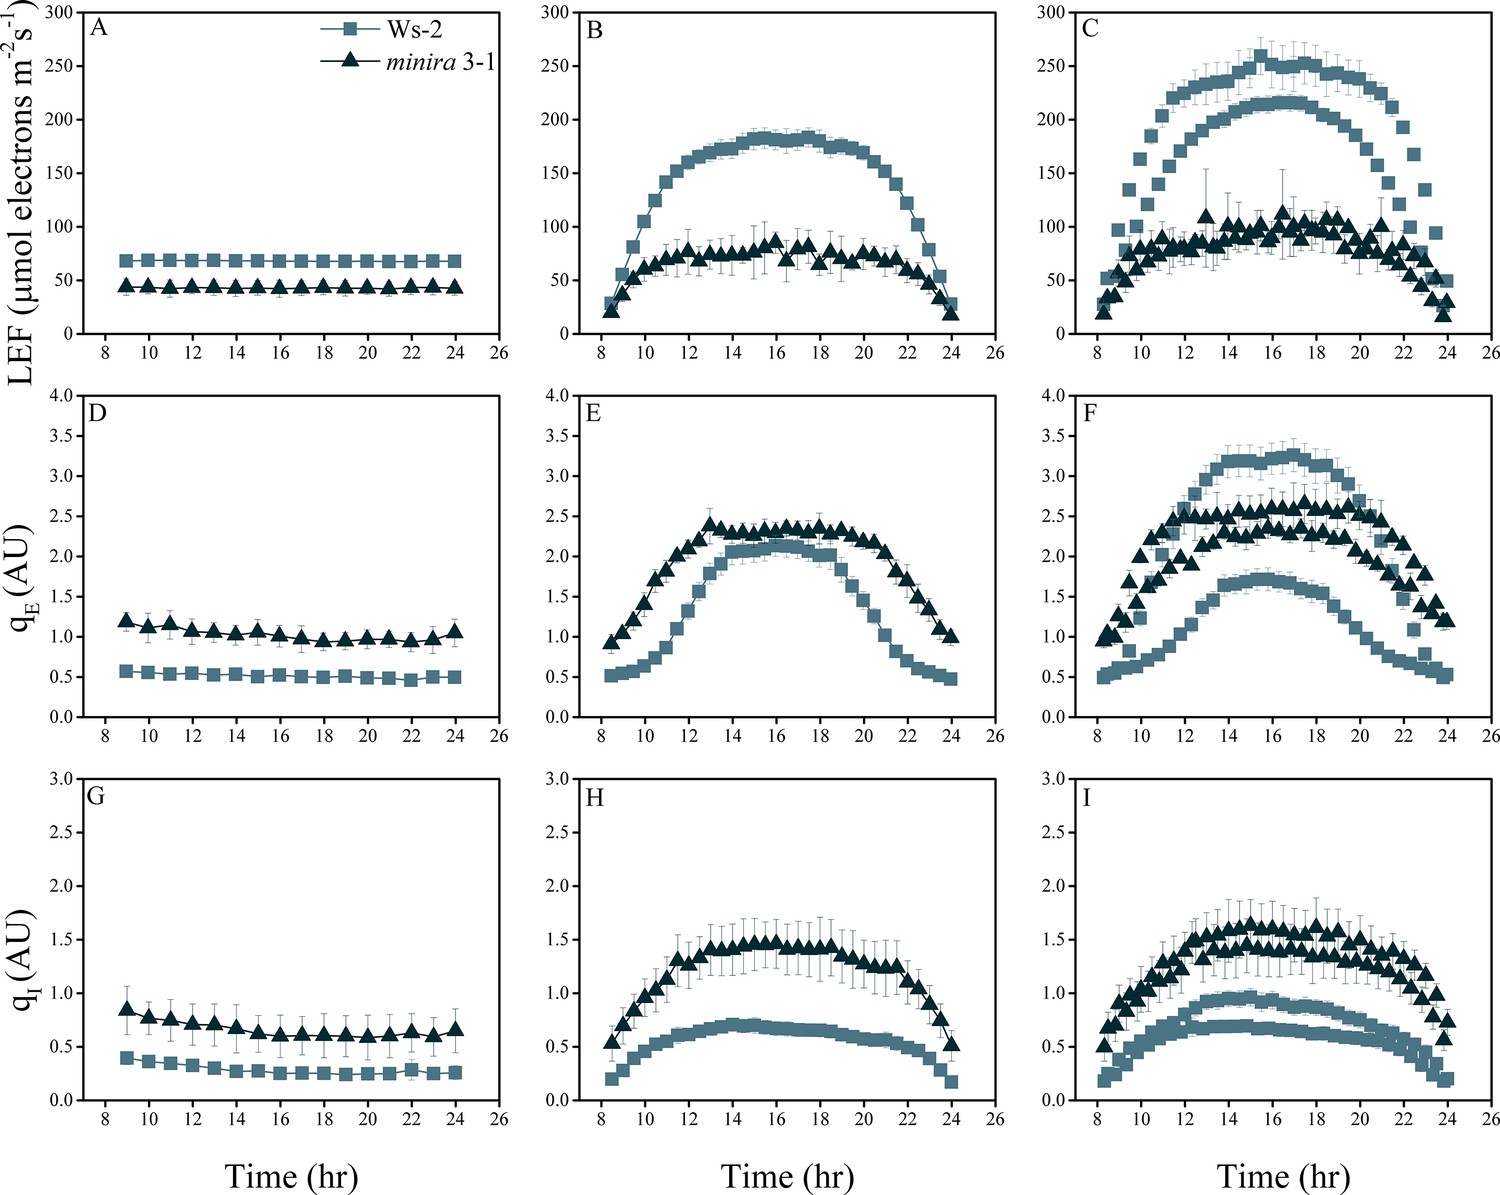
Whole plant fluorescence imaging phenotyping of minira 3–1 mutant.
Three week old plants were imaged over three consecutive 16-hr photoperiods and fluorescent measurements taken at the end of each light transition for LEF (A–C), qE (D–F), and qI (G–I) for Ws-2 and minira 3–1. Values represent mean of n ≥ 3 ± s.d., all of which were imaged in the same experiment. Timing and illumination are the same as Figure 2 and are detailed in Supplementary files 2a–c.
Figure 2—figure supplement 2
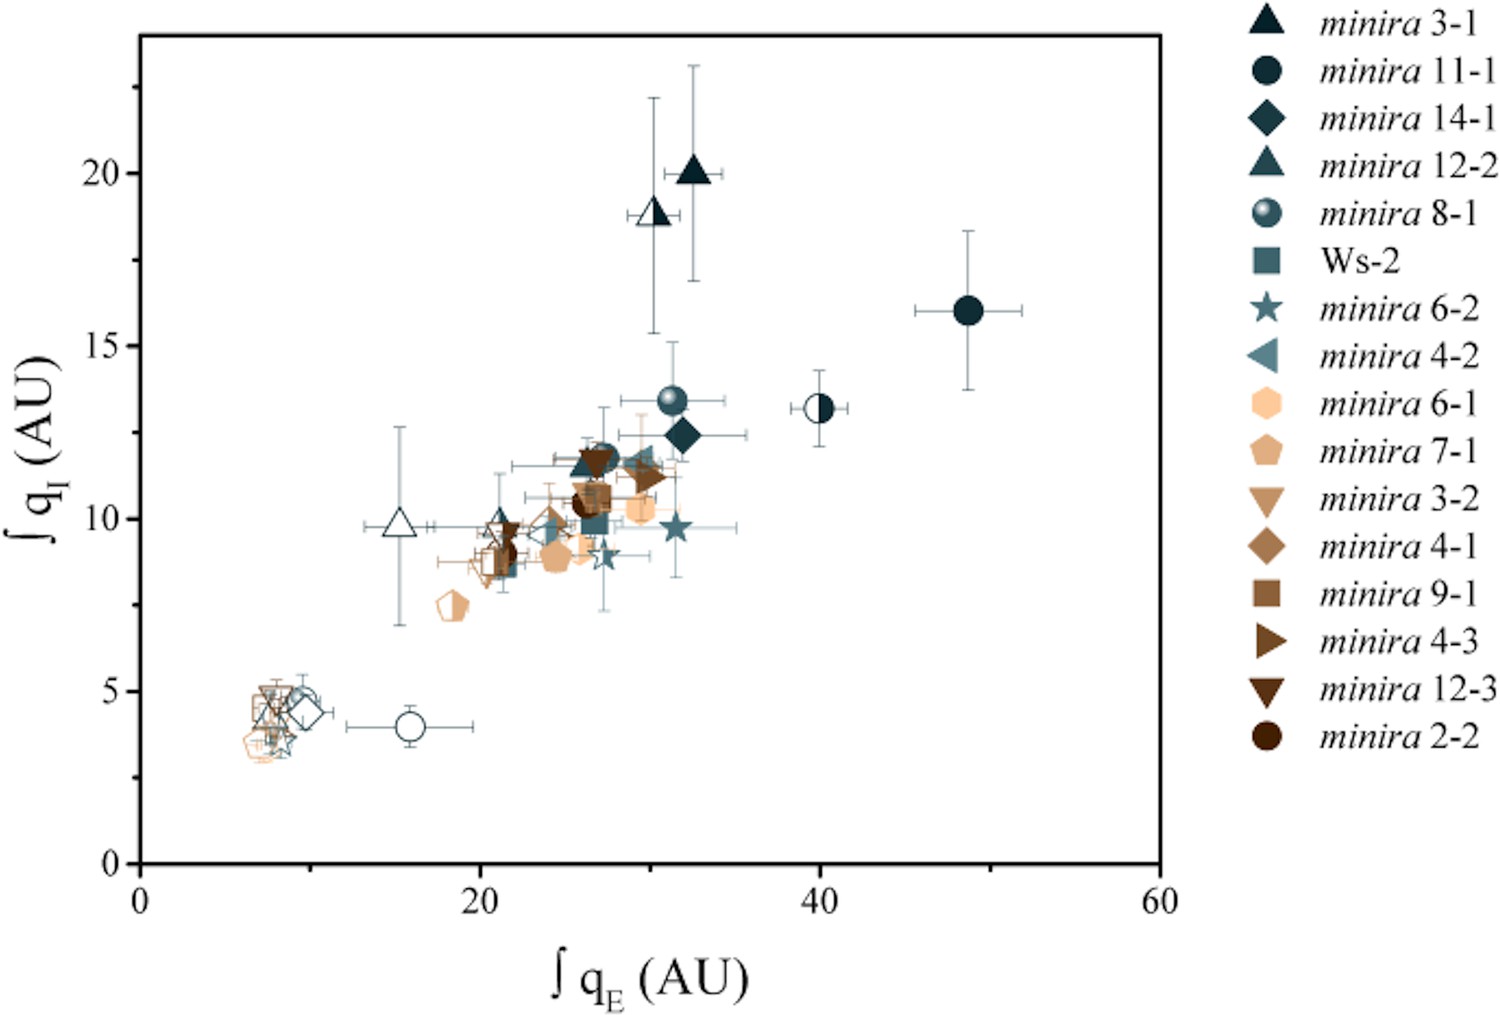
Increased pH-dependent quenching correlates with increased photoinhibitory quenching.
Whole plant fluorescent phenotypes were measured over three consecutive photoperiods. Day one consisted of a single irradiance level (open symbols), day two of sinusoidal irradiance (half filled symbols), and day three of sinusoidal irradiance interrupted by bright fluctuations (closed symbols). The pH-dependent fluorescence quenching (qE) and photoinhibitory quenching (qI) were integrated over time for each plant for each photoperiod to determine how prolonged exposure to an increased pmf influences the extent of photoinhibition. Data represent the integrated total for each day (n ≥ 3, ± s.d).
Figure 2—figure supplement 3
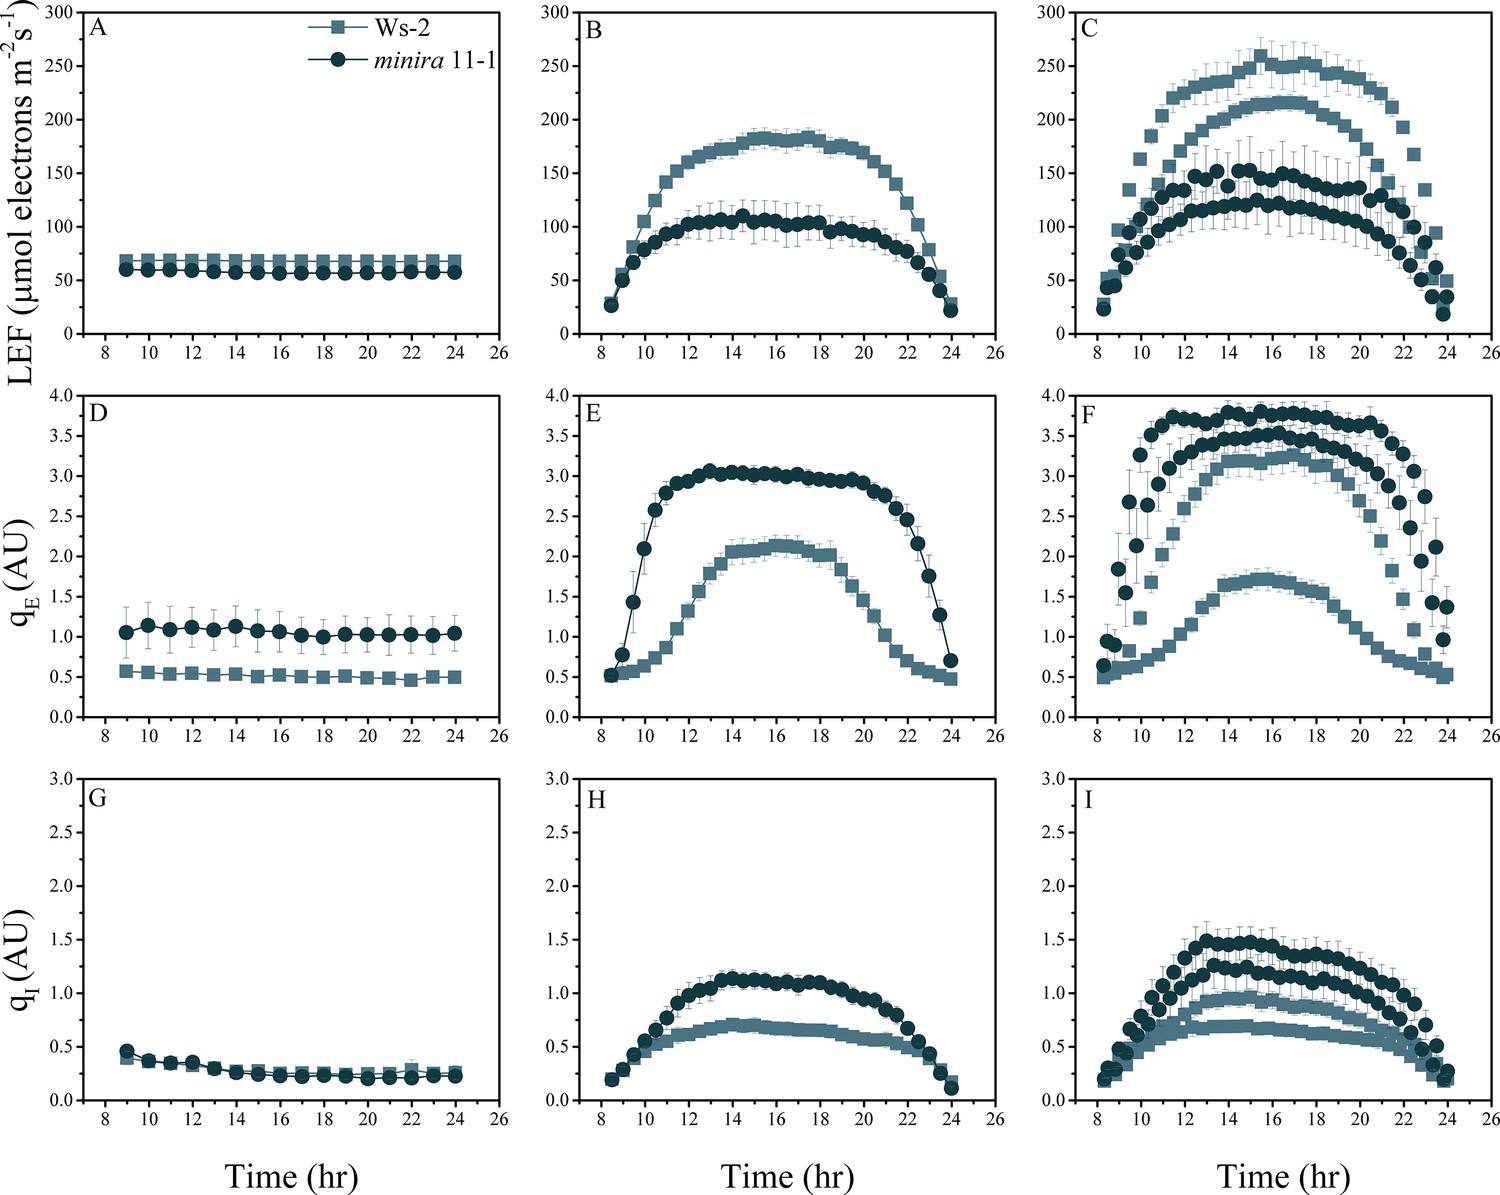
Whole plant fluorescence imaging phenotyping of minira 11–1 mutant.
For details, please refer to the legend of Figure 2—figure supplement 1.
Figure 2—figure supplement 4
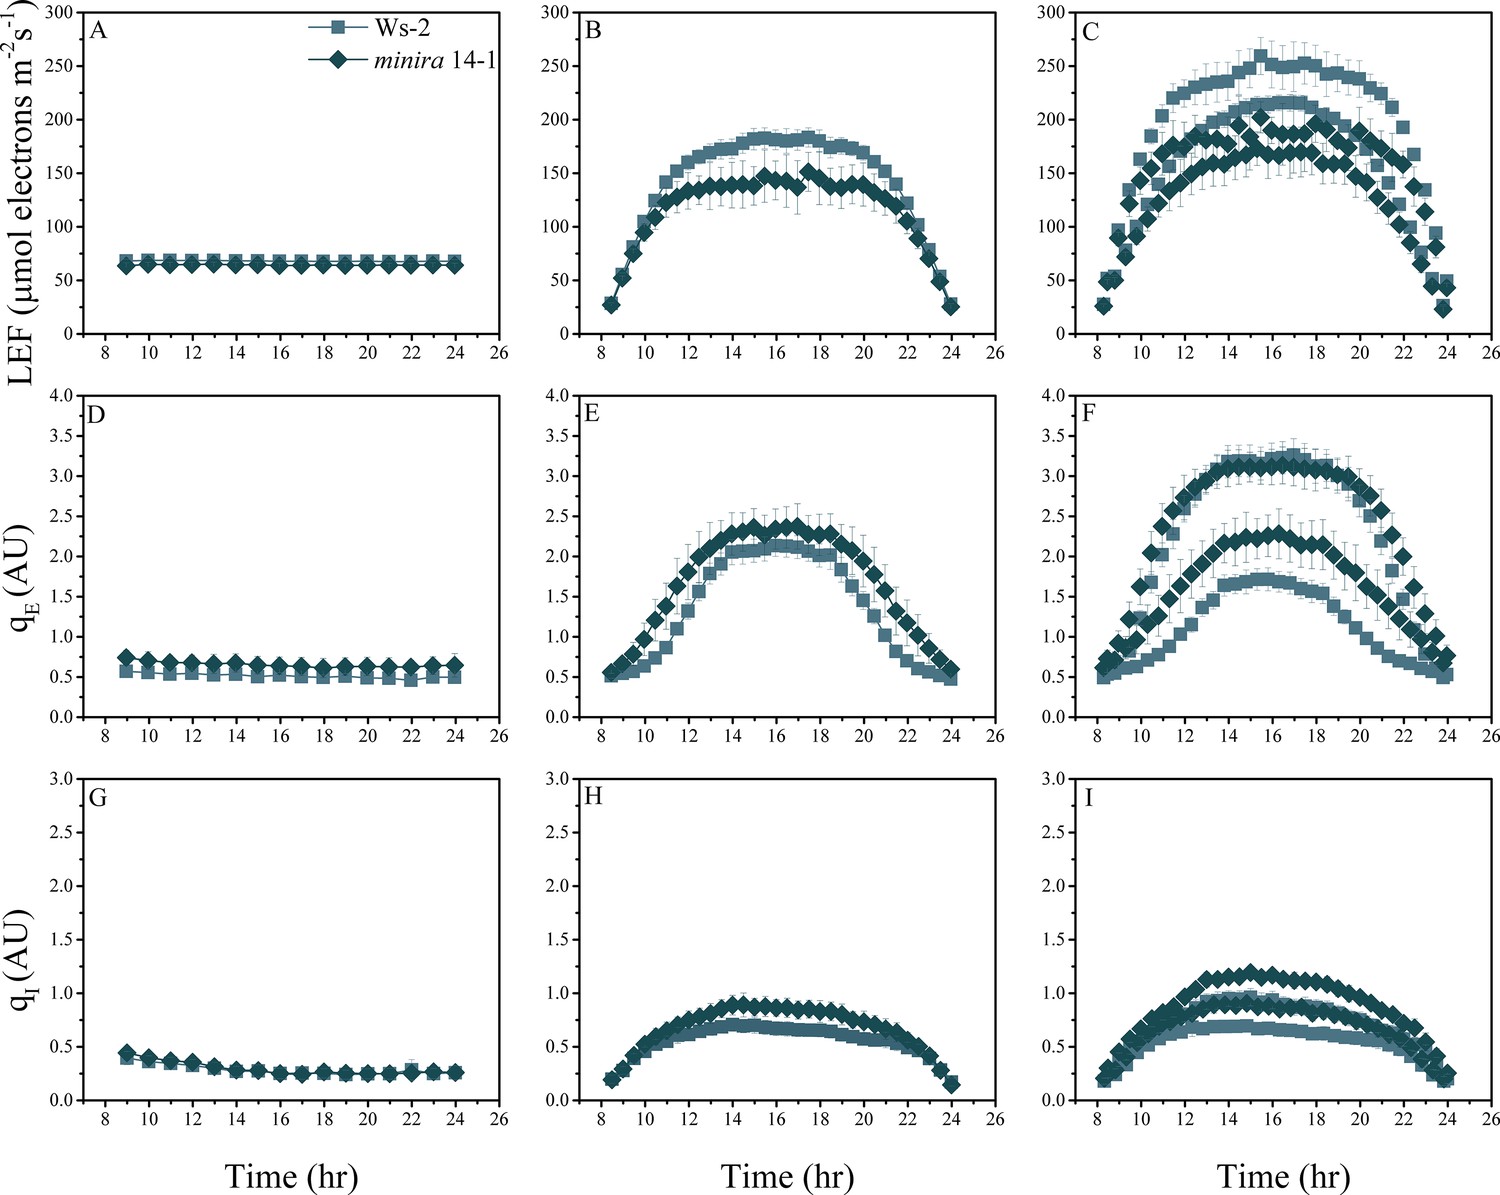
Whole plant fluorescence imaging phenotyping of minira 14–1 mutant.
For details, please refer to the legend of Figure 2—figure supplement 1.
Figure 2—figure supplement 5
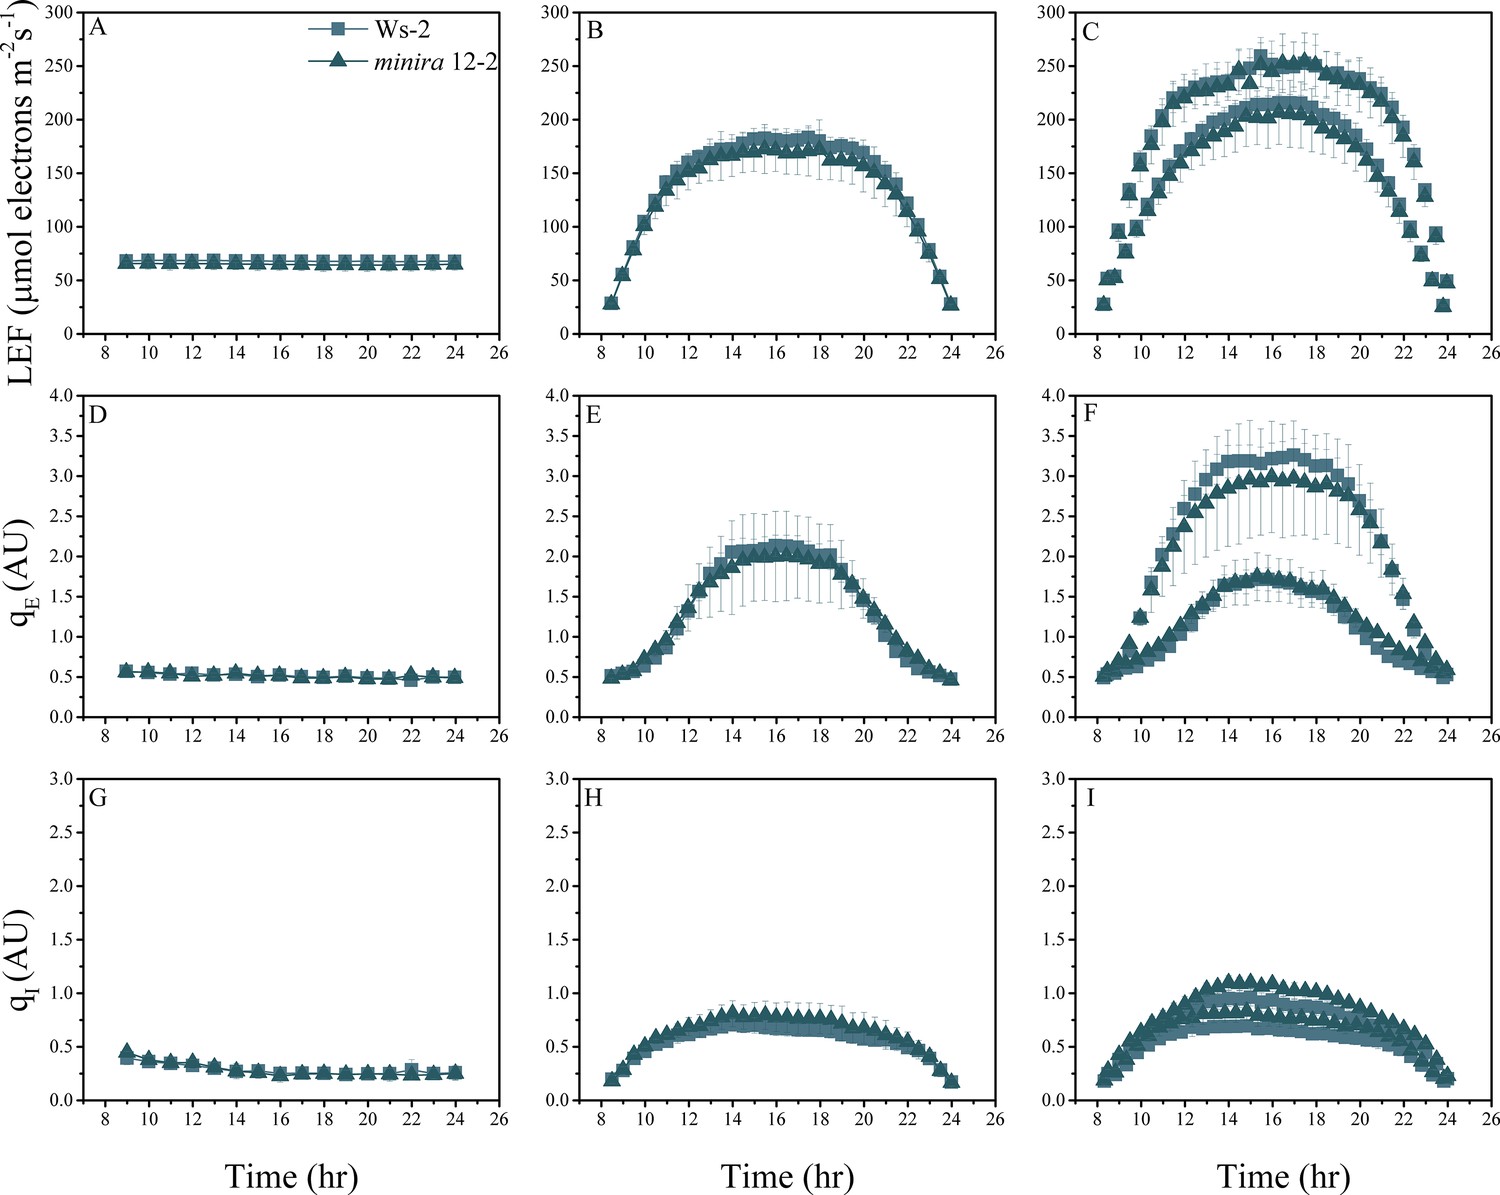
Whole plant fluorescence imaging phenotyping of minira 12–2 mutant.
For details, please refer to the legend of Figure 2—figure supplement 1.
Figure 2—figure supplement 6
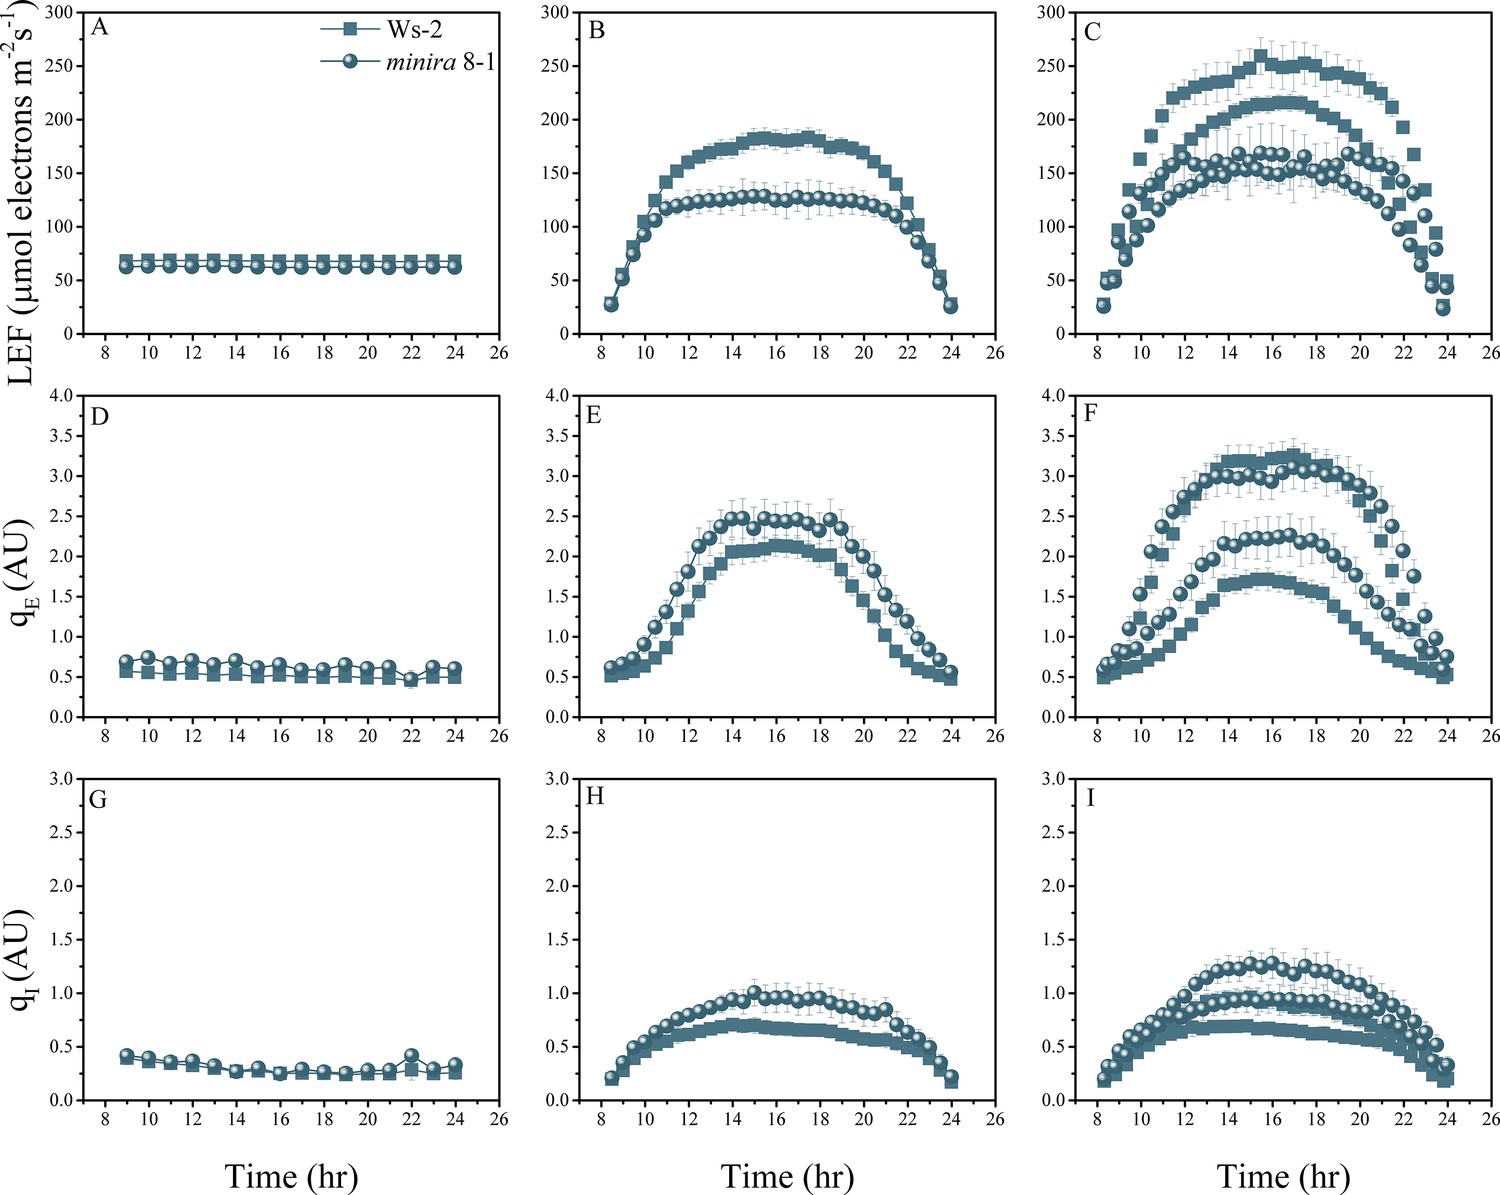
Whole plant fluorescence imaging phenotyping of minira 8–1 mutant.
For details, please refer to the legend of Figure 2—figure supplement 1.
Figure 2—figure supplement 7
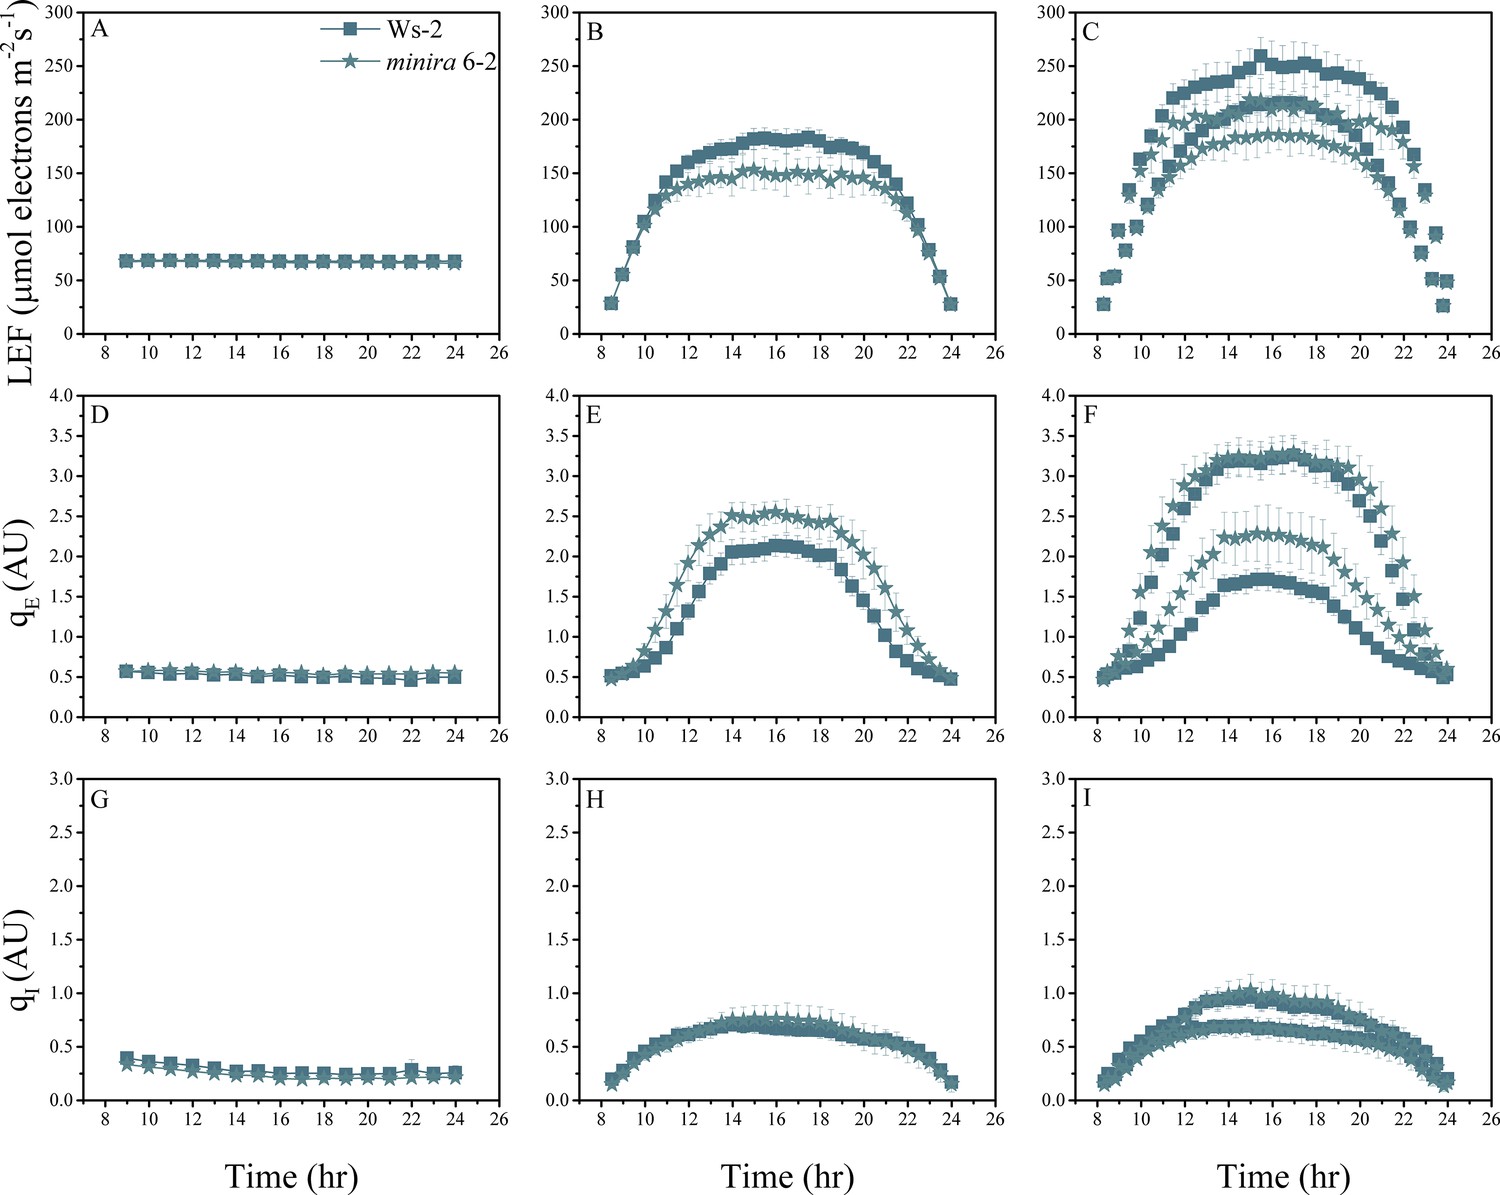
Whole plant fluorescence imaging phenotyping of minira 6–2 mutant.
For details, please refer to the legend of Figure 2—figure supplement 1.
Figure 2—figure supplement 8
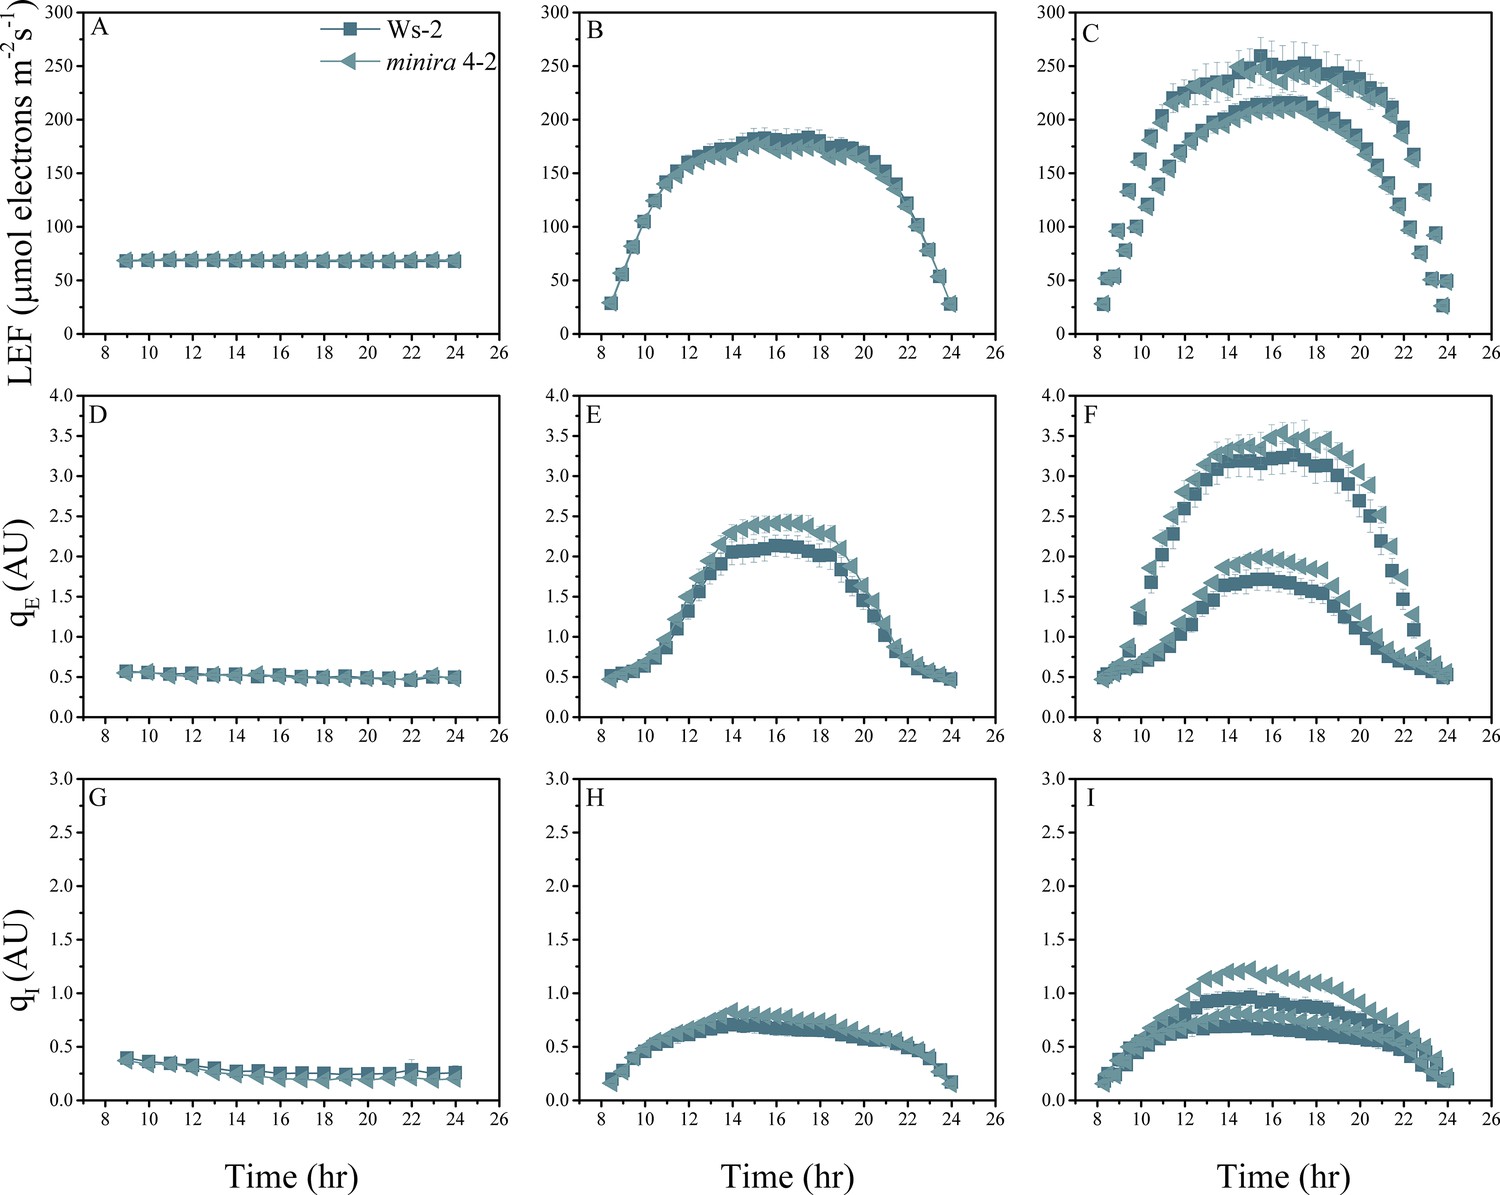
Whole plant fluorescence imaging phenotyping of minira 4–2 mutant.
For details, please refer to the legend of Figure 2—figure supplement 1.
Figure 2—figure supplement 9

Whole plant fluorescence imaging phenotyping of minira 6–1 mutant.
For details, please refer to the legend of Figure 2—figure supplement 1.
Figure 2—figure supplement 10
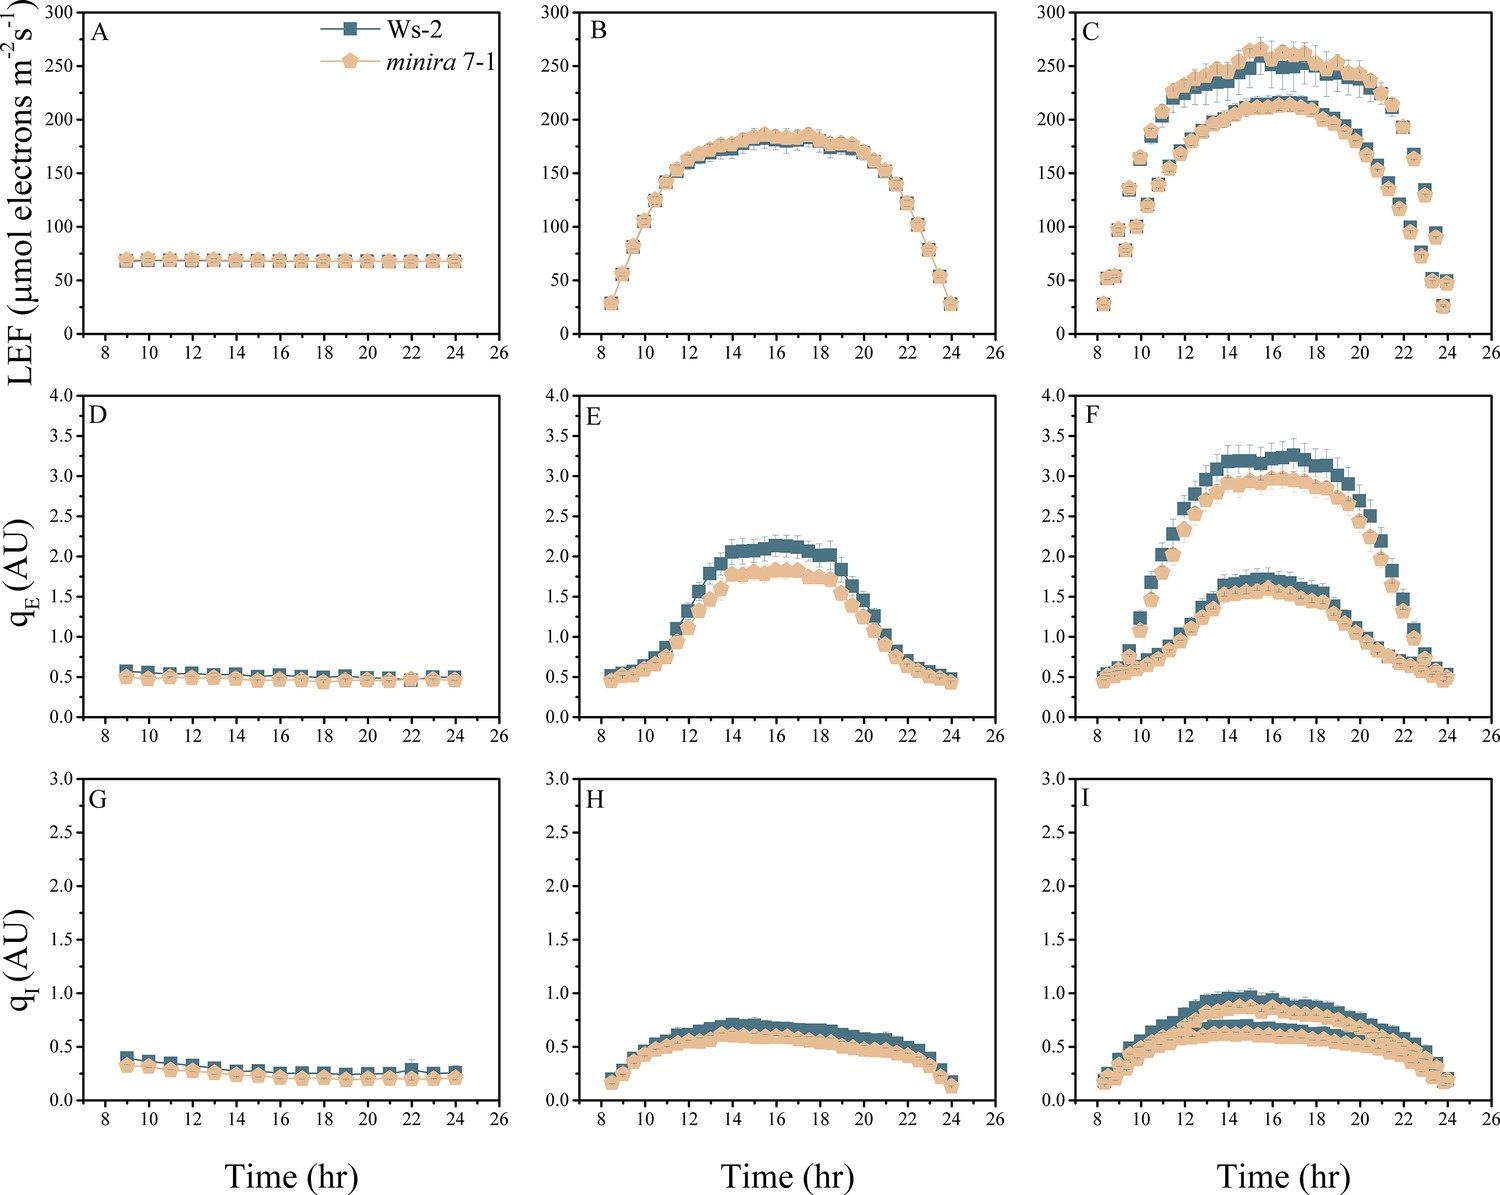
Whole plant fluorescence imaging phenotyping of minira 7–1 mutant.
For details, please refer to the legend of Figure 2—figure supplement 1.
Figure 2—figure supplement 11
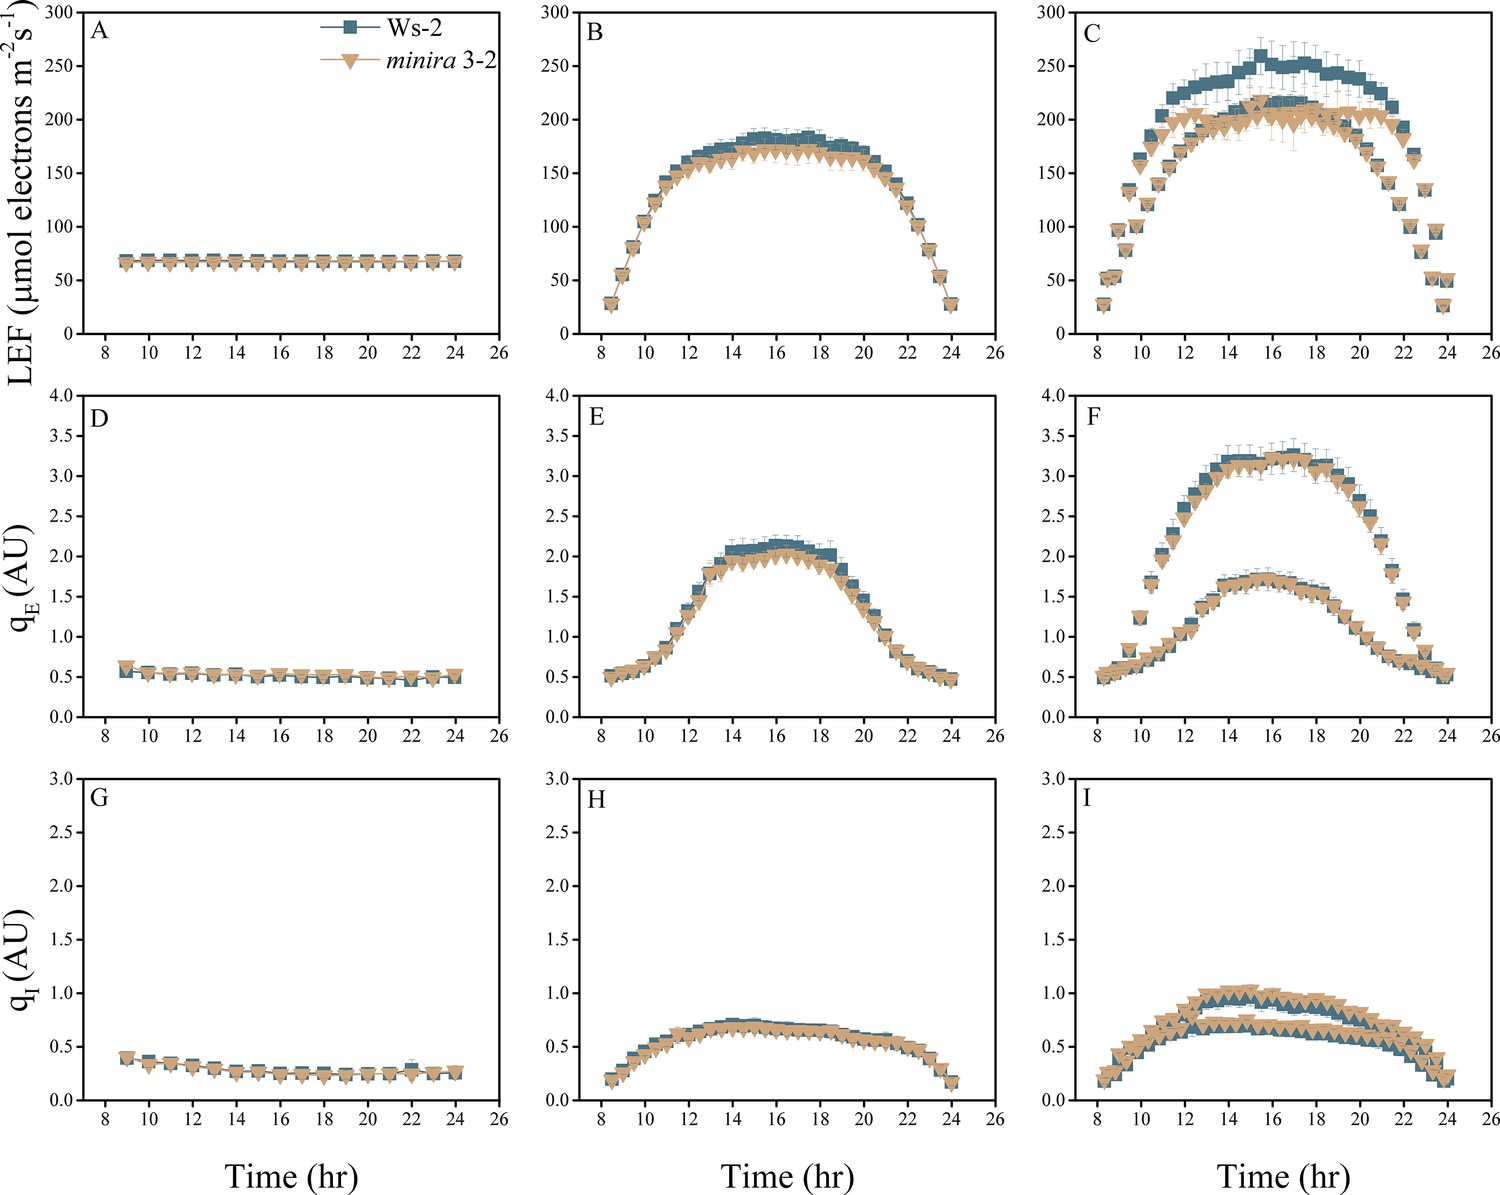
Whole plant fluorescence imaging phenotyping of minira 3–2 mutant.
For details, please refer to the legend of Figure 2—figure supplement 1.
Figure 2—figure supplement 12
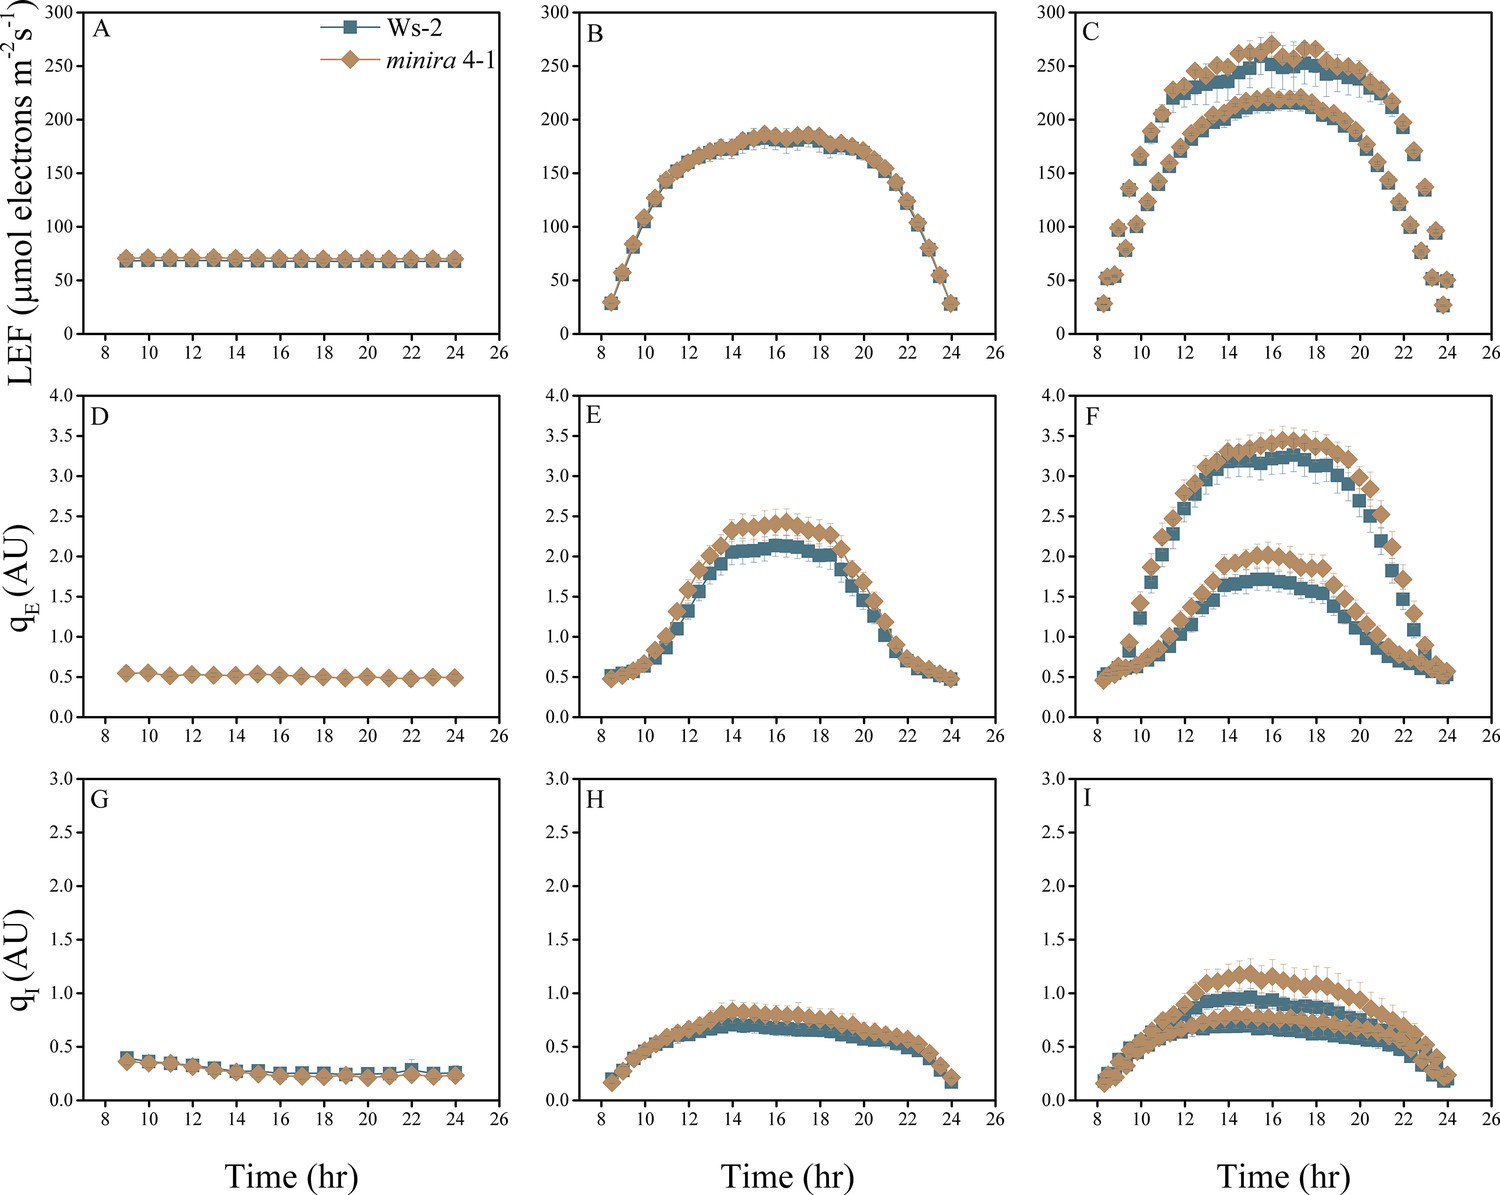
Whole plant fluorescence imaging phenotyping of minira 4–1 mutant.
For details, please refer to the legend of Figure 2—figure supplement 1.
Figure 2—figure supplement 13
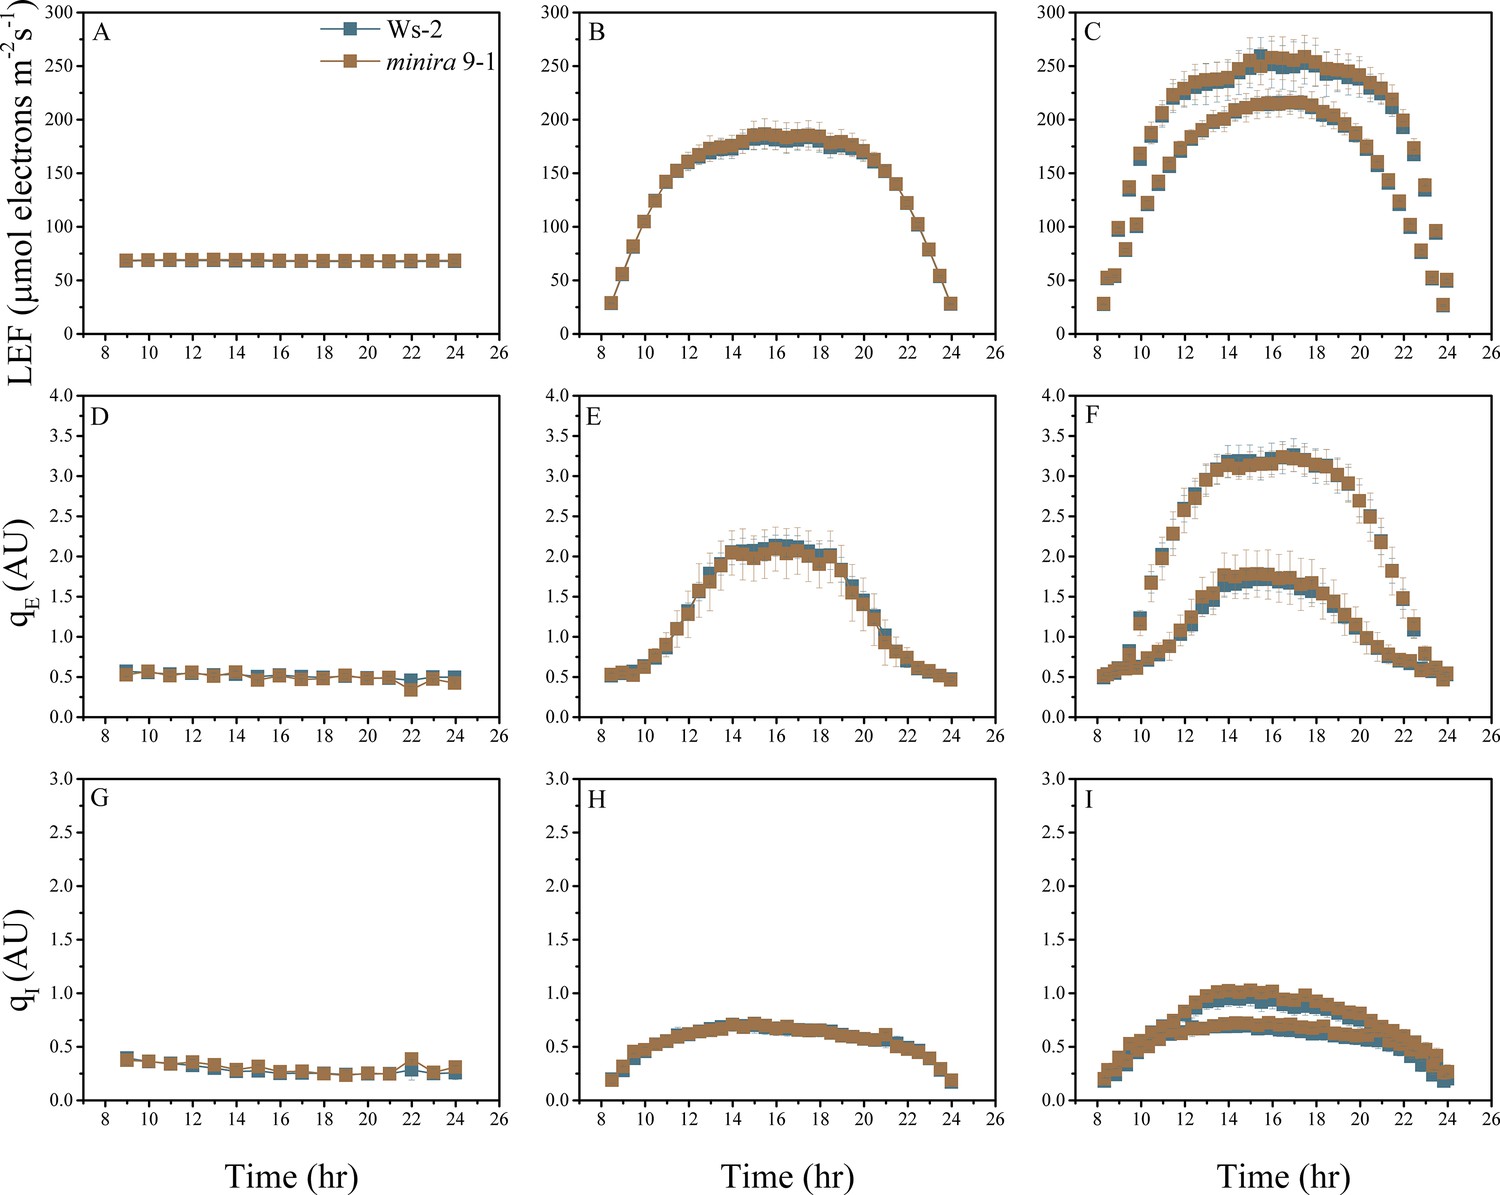
Whole plant fluorescence imaging phenotyping of minira 9–1 mutant.
For details, please refer to the legend of Figure 2—figure supplement 1.
Figure 2—figure supplement 14
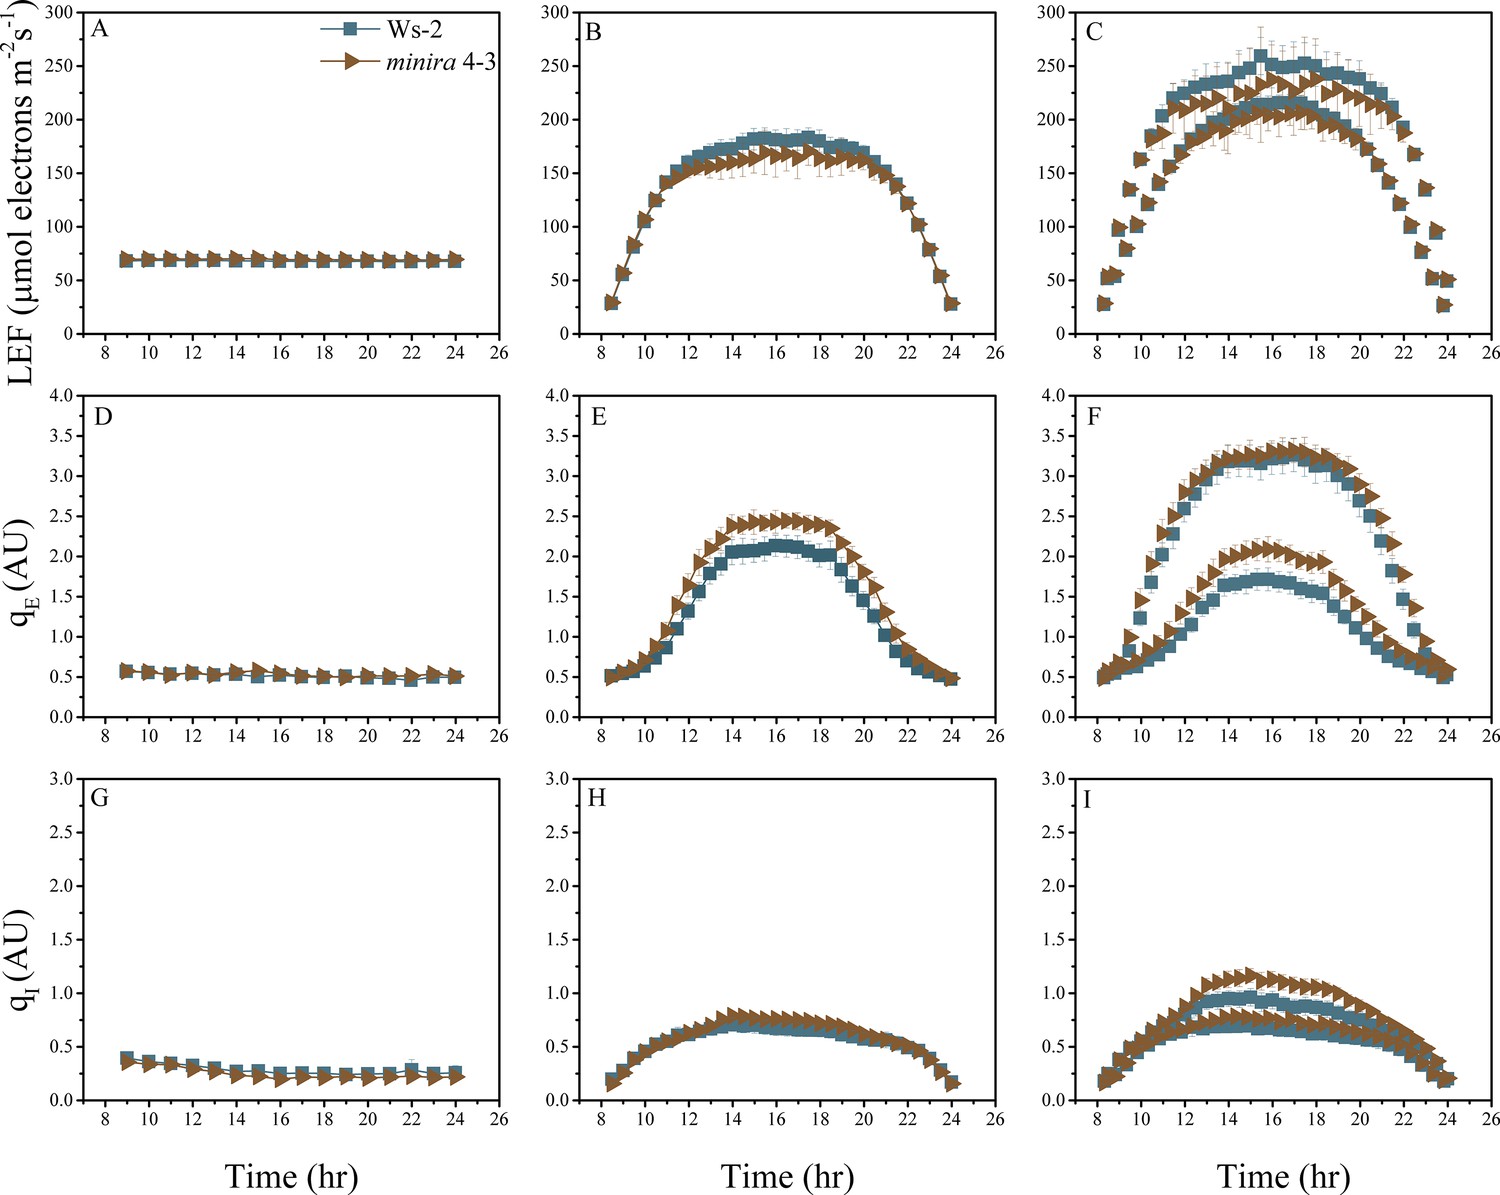
Whole plant fluorescence imaging phenotyping of minira 4–3 mutant.
For details, please refer to the legend of Figure 2—figure supplement 1.
Figure 2—figure supplement 15
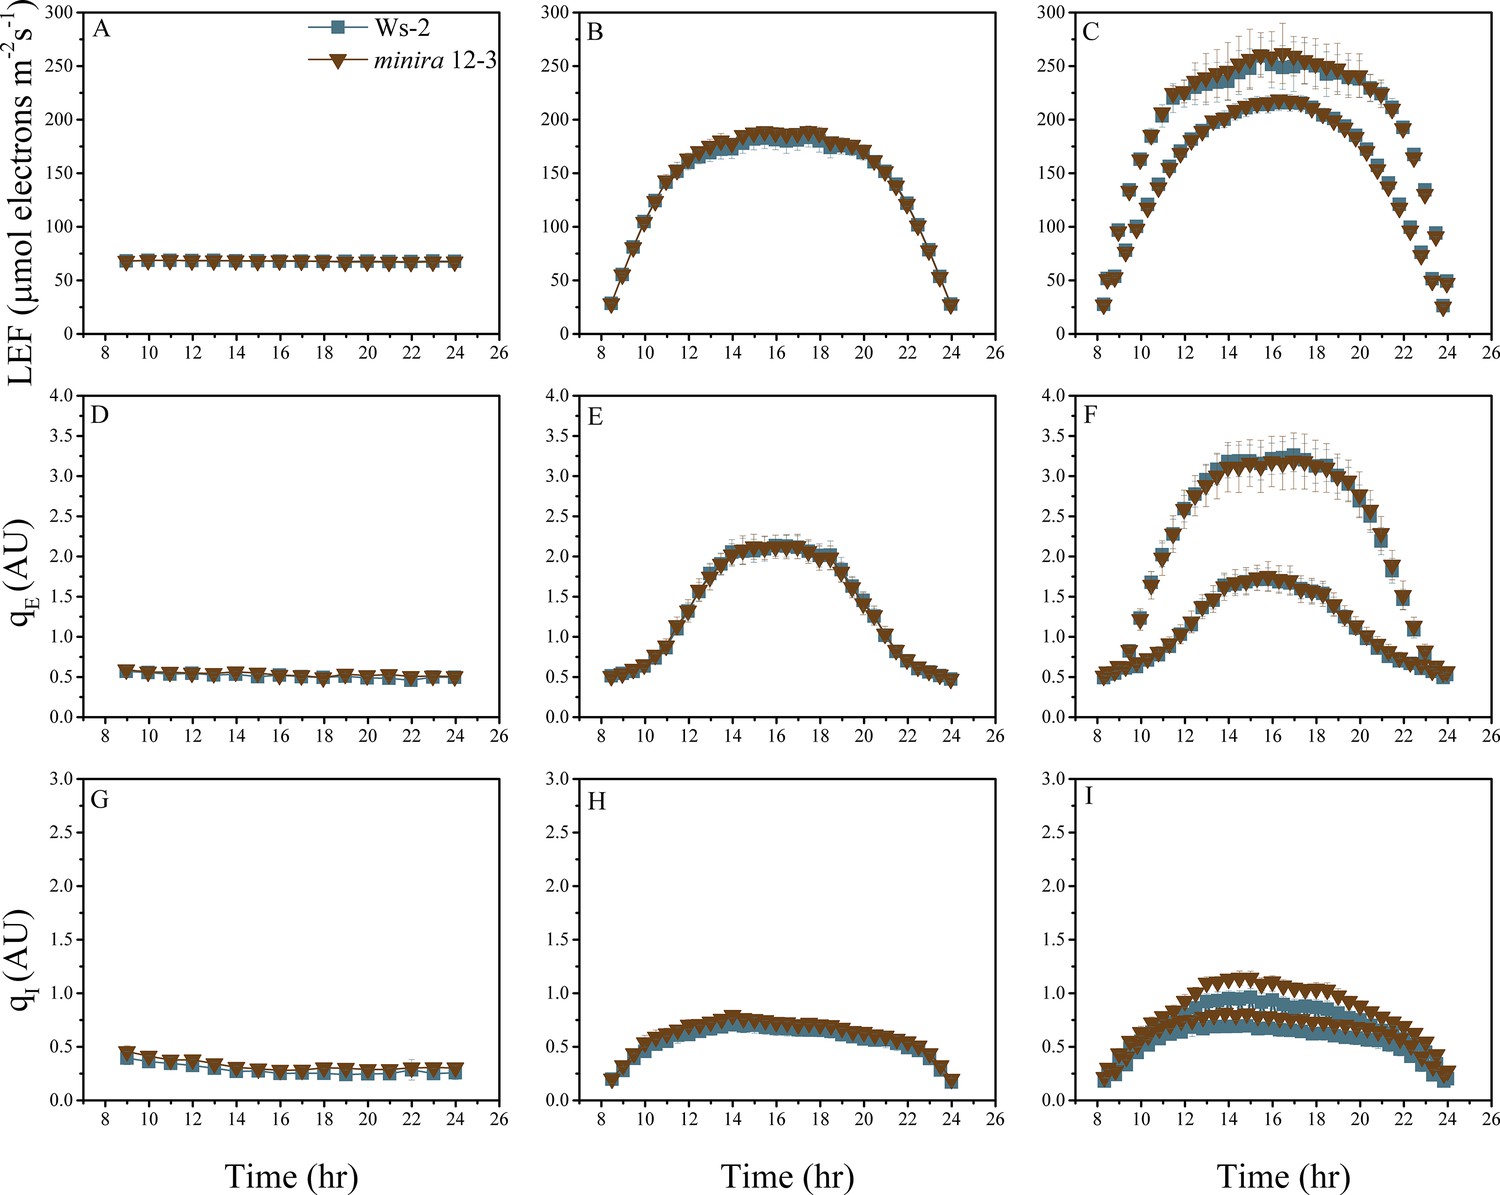
Whole plant fluorescence imaging phenotyping of minira 12–3 mutant.
For details, please refer to the legend of Figure 2—figure supplement 1.
Figure 2—figure supplement 16

Whole plant fluorescence imaging phenotyping of minira 2–2 mutant.
For details, please refer to the legend of Figure 2—figure supplement 1.
Figure 3
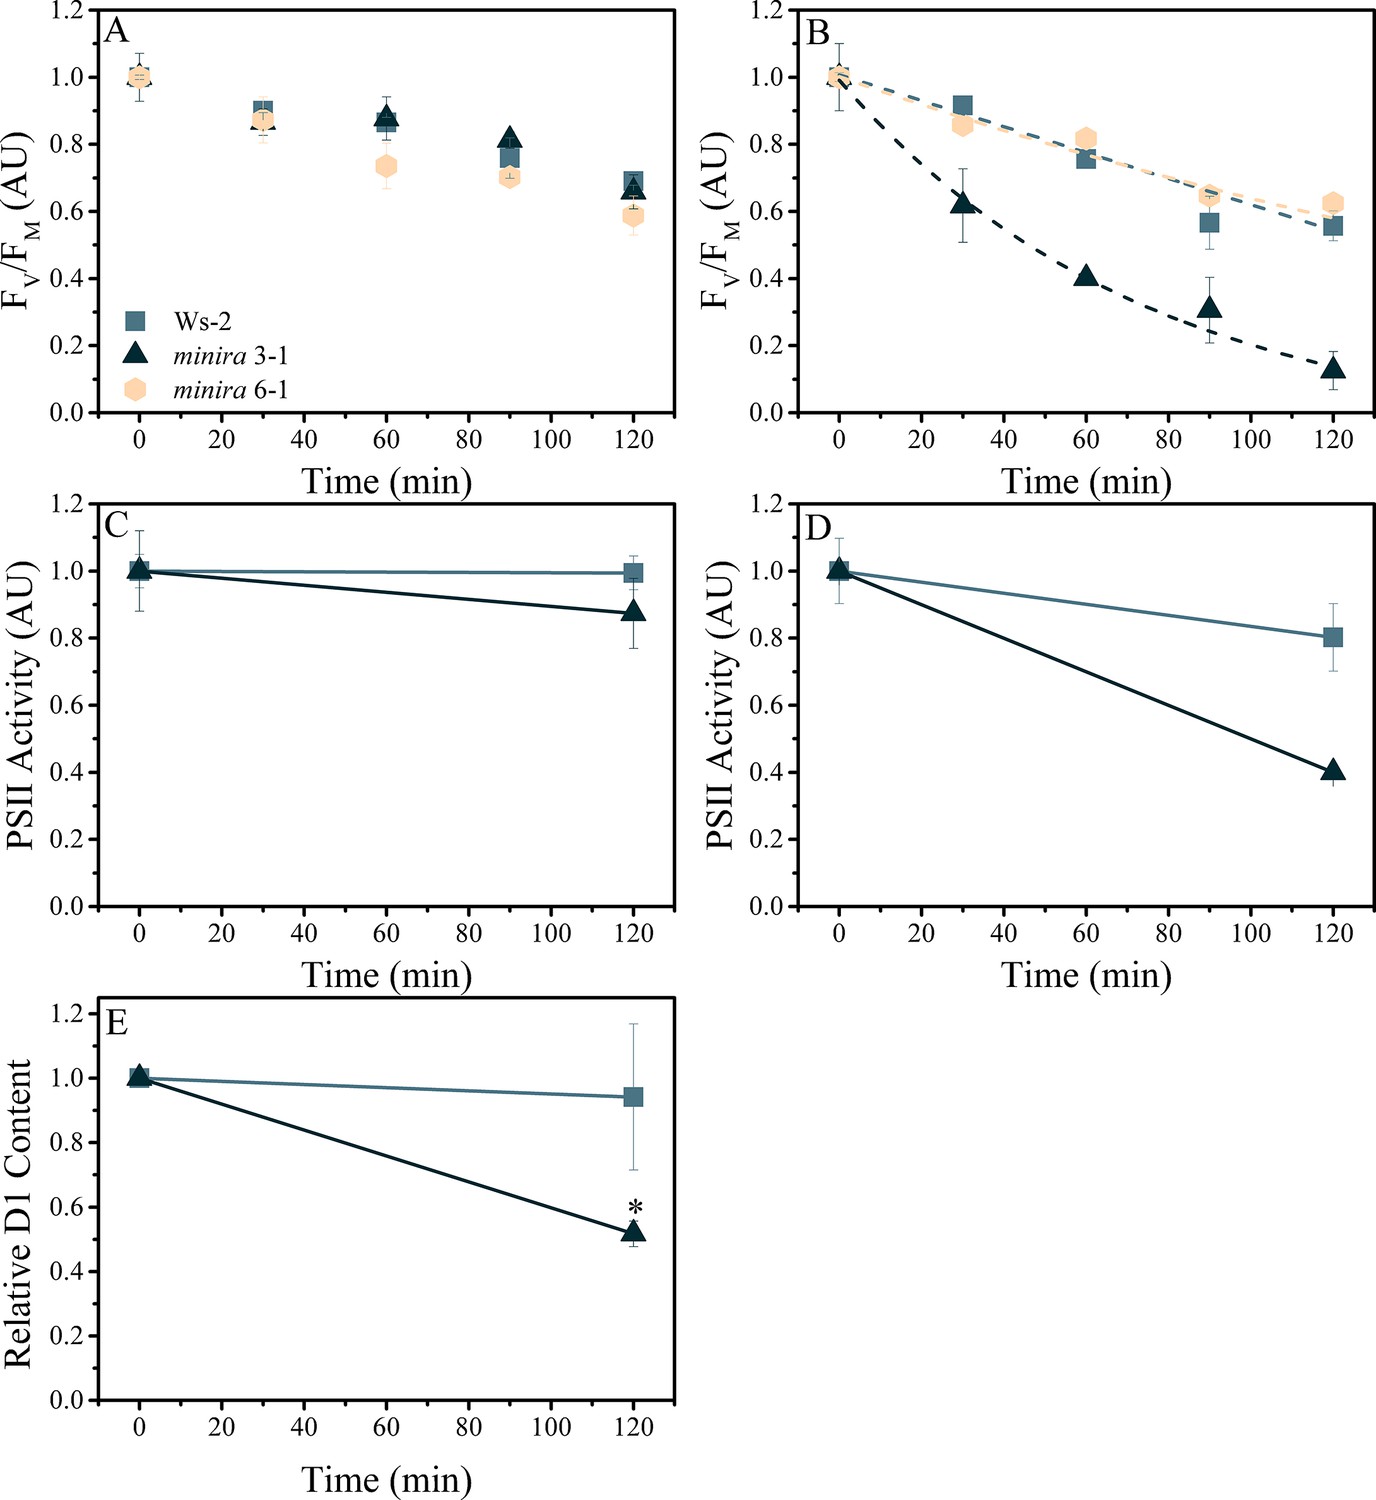
Elevated pmf leads to PSII photodamage.
Detached leaves were infiltrated with either water (A,C) or a 3 mM solution of lincomycin (B,D) and treated with 1000 μmol photons m−2s−1 red light for the times indicated. Following dark adaptation, FV/FM values were obtained (A,B) for treated leaves of wild type (square, initial FV/FM 0.75 ± 0.006 and 0.76 ± 0.012 for water and lincomycin, respectively), minira 3–1 (triangle, initial FV/FM 0.60 ± 0.07 and 0.54 ± 0.10 for water and lincomycin, respectively), and minira 6–1 (hexagon, initial FV/FM 0.72 ± 0.004 and 0.73 ± 0.01 for water and lincomycin, respectively) (mean ± s.d., n ≥ 3). Data were normalized to the initial dark-adapted FV/FM values to remove intrinsic differences between the three lines. In panel B, dashed lines represent the best fit curves for a single exponential decay. The ability of photoinhibited leaves to perform PSII charge separation was determined in Ws-2 and minira 3–1 by measuring the ECS absorbance changes following two consecutive single-turnover saturating flashes in the presence of DCMU (C,D). Leaves infiltrated with water (C, initial amplitudes of 8.88 × 10⁻⁴ ± 9.0 × 10⁻⁵ and 9.59 × 10⁻⁵ ± 3.6 × 10⁻⁵ for wild type and minira 3–1, respectively) or 3 mM lincomycin (D, initial amplitudes of 8.59 × 10⁻⁴ ± 1.2 × 10⁻⁴ and 1.63 × 10⁻⁴ ± 3.1 × 10⁻⁵ for wild type and minira 3–1, respectively) were infiltrated with DCMU following the indicated light treatment time and dark adaptation. PSII activity was determined by subtracting the ECS amplitude induced by the second flash from the ECS amplitude induced by the first flash (mean ± s.d., n ≥ 4). Loss of the PSII reaction center D1 protein over the time course of illumination in lincomycin treated wild type and minira 3–1 leaves (E). Leaves treated as in panel B were analyzed by western blot (n = 4) using an α-PsbA antibody and the 32 kDa band was quantified. Band intensities were normalized to the time zero point for each genotype within a single blot to control for differences in development intensities. Statistically significant differences (*p<0.05) from wild type were determined using a t-test.
Figure 4
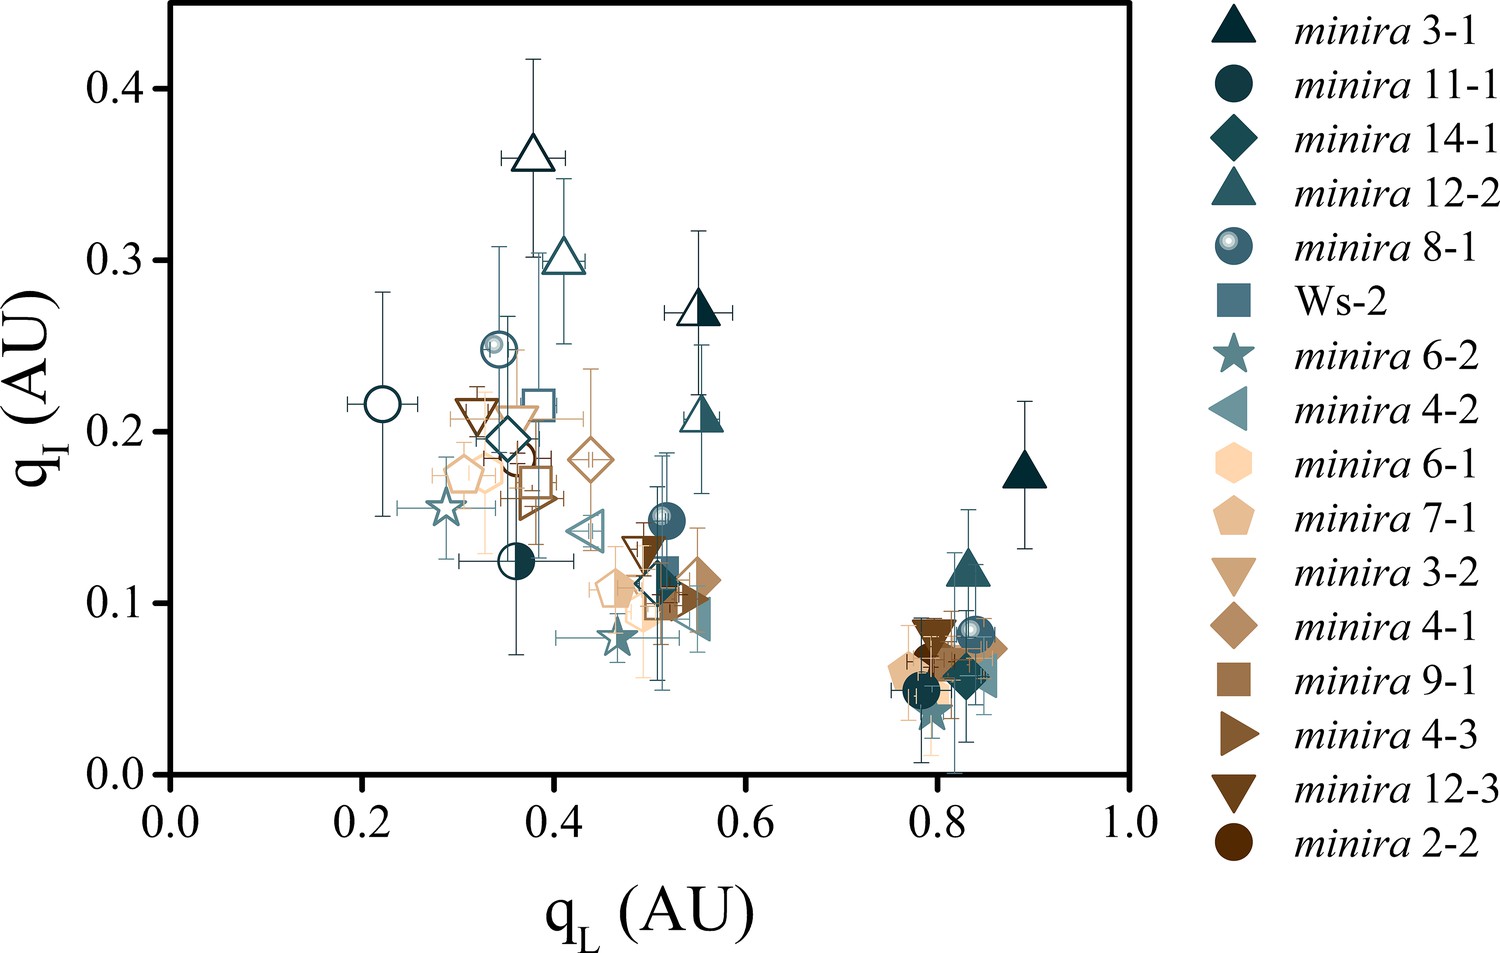
The dependence of photoinhibition on the redox state of QA.
The redox state of the primary electron acceptor QA was assayed using the qL fluorescence parameter concurrently with photoinhibitory quenching qI at 100 (solid symbols), 300 (half filled symbols), and 500 μmol photons m−2s−1 (open symbols, mean ± s.d., n = 3). Plants were exposed to at least 10 min of actinic illumination prior to qL measurement, and qI measured after 10 min of dark relaxation. While the extent of qI varies between plants, the relative redox state of QA remains similar between all plants within each actinic light intensity.
Figure 5 with 3 supplements
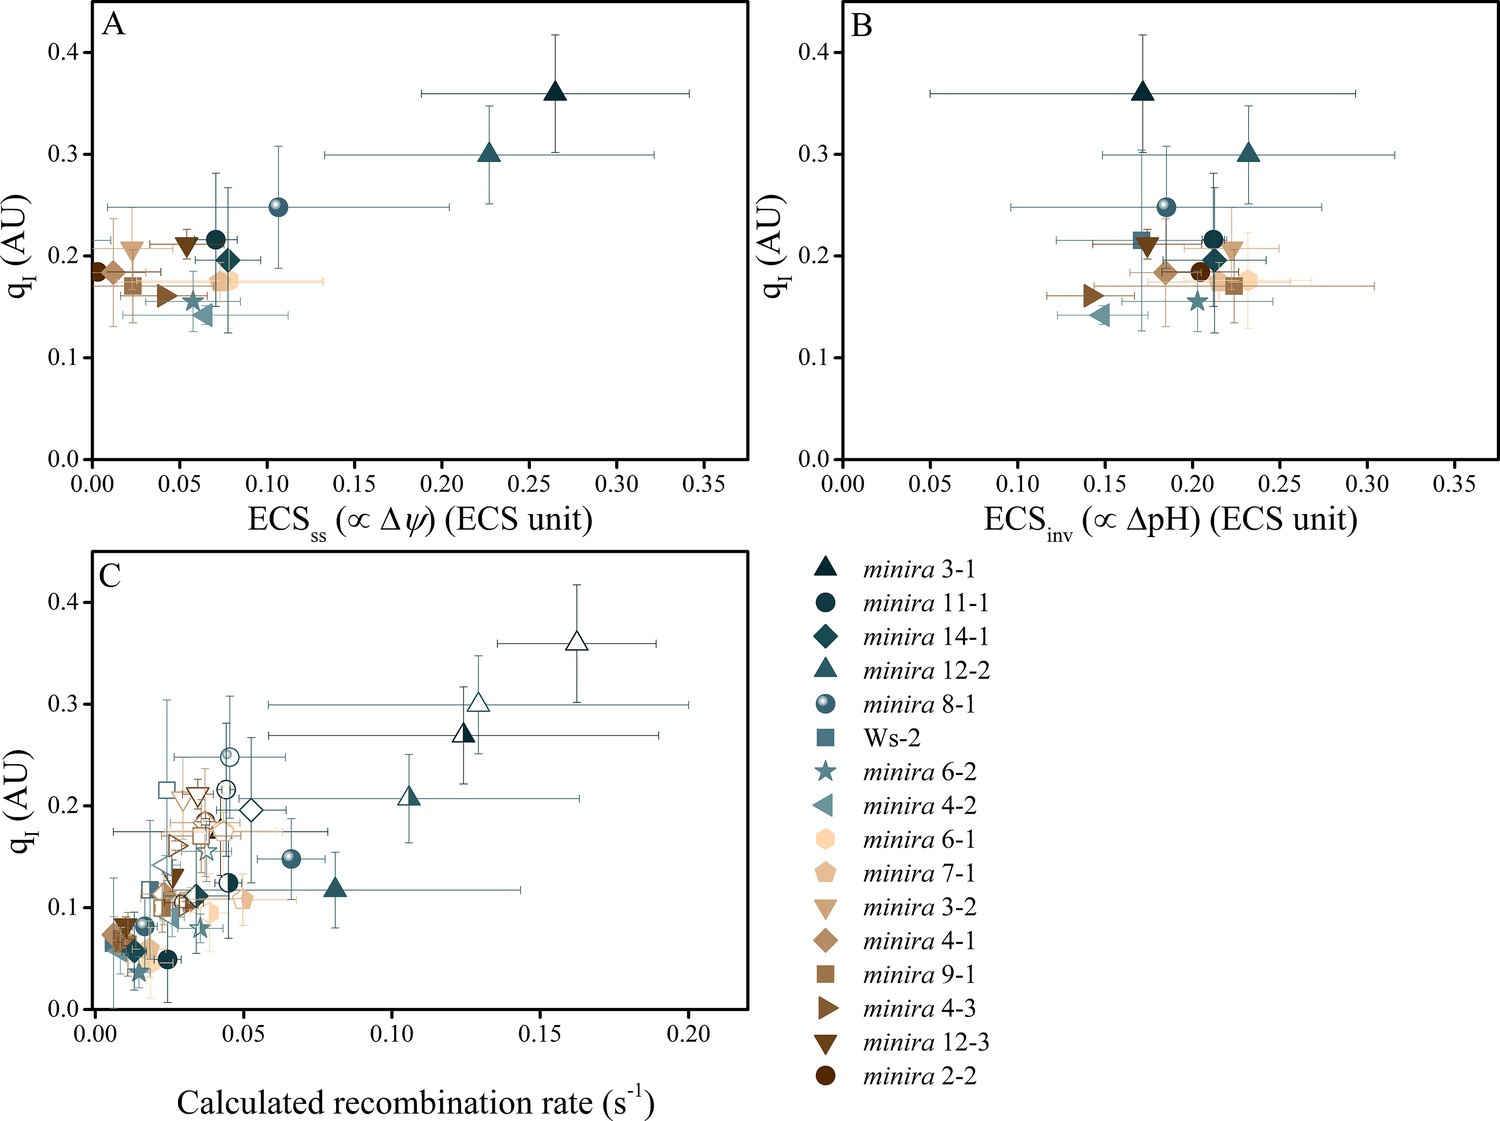
Photoinhibition is strongly correlated with Δψ but not ΔpH in minira lines.
Photoinhibition, estimated by the qI fluorescence parameter, is plotted against either the ΔpH or Δψ components of pmf, estimated by the ECSss (A) and ECSinv (B) parameters, as described in Materials and methods. Measurements shown were taken during exposure to 500 μmol photons m−2s−1 actinic light (mean ± s.d., n = 3). Two-way analysis of variance (ANOVA) of all combined data, 15 minira lines and wild type, showed a stronger correlation between qI and Δψ (F = 9.5, p=0.003) than ΔpH (F = 4.05, p=0.05). This correlation is also seen with the expected pH-dependent alterations of P700+ reduction for the observed partitioning differences from wild type (Figure 5—figure supplement 1) and an increase in the fraction of total pmf stored as Δψ at the expense of ΔpH over multiple light intensities (Figure 5—figure supplement 2). Increased storage of pmf as Δψ is also observed in tobacco ATP synthase knock-down plants (Figure 5—figure supplement 3). ECS units were defined as the deconvoluted ΔA520 μg chlorophyll−1 cm2. The influence of Δψ on the rate of PSII recombination was estimated based on the change in the equilibrium constant for the sharing of electrons between pheophytin and QA (described in Materials and methods) (C). The influence of Δψ on the calculated recombination rate taking into account the fraction of reduced QA using the equations described in Materials and methods and described in the main text. Data were obtained at 100 (solid symbols), 300 (half filled symbols), and 500 μmol photons m−2s−1 (open symbols) (mean ± s.d., n = 3).
Figure 5—figure supplement 1
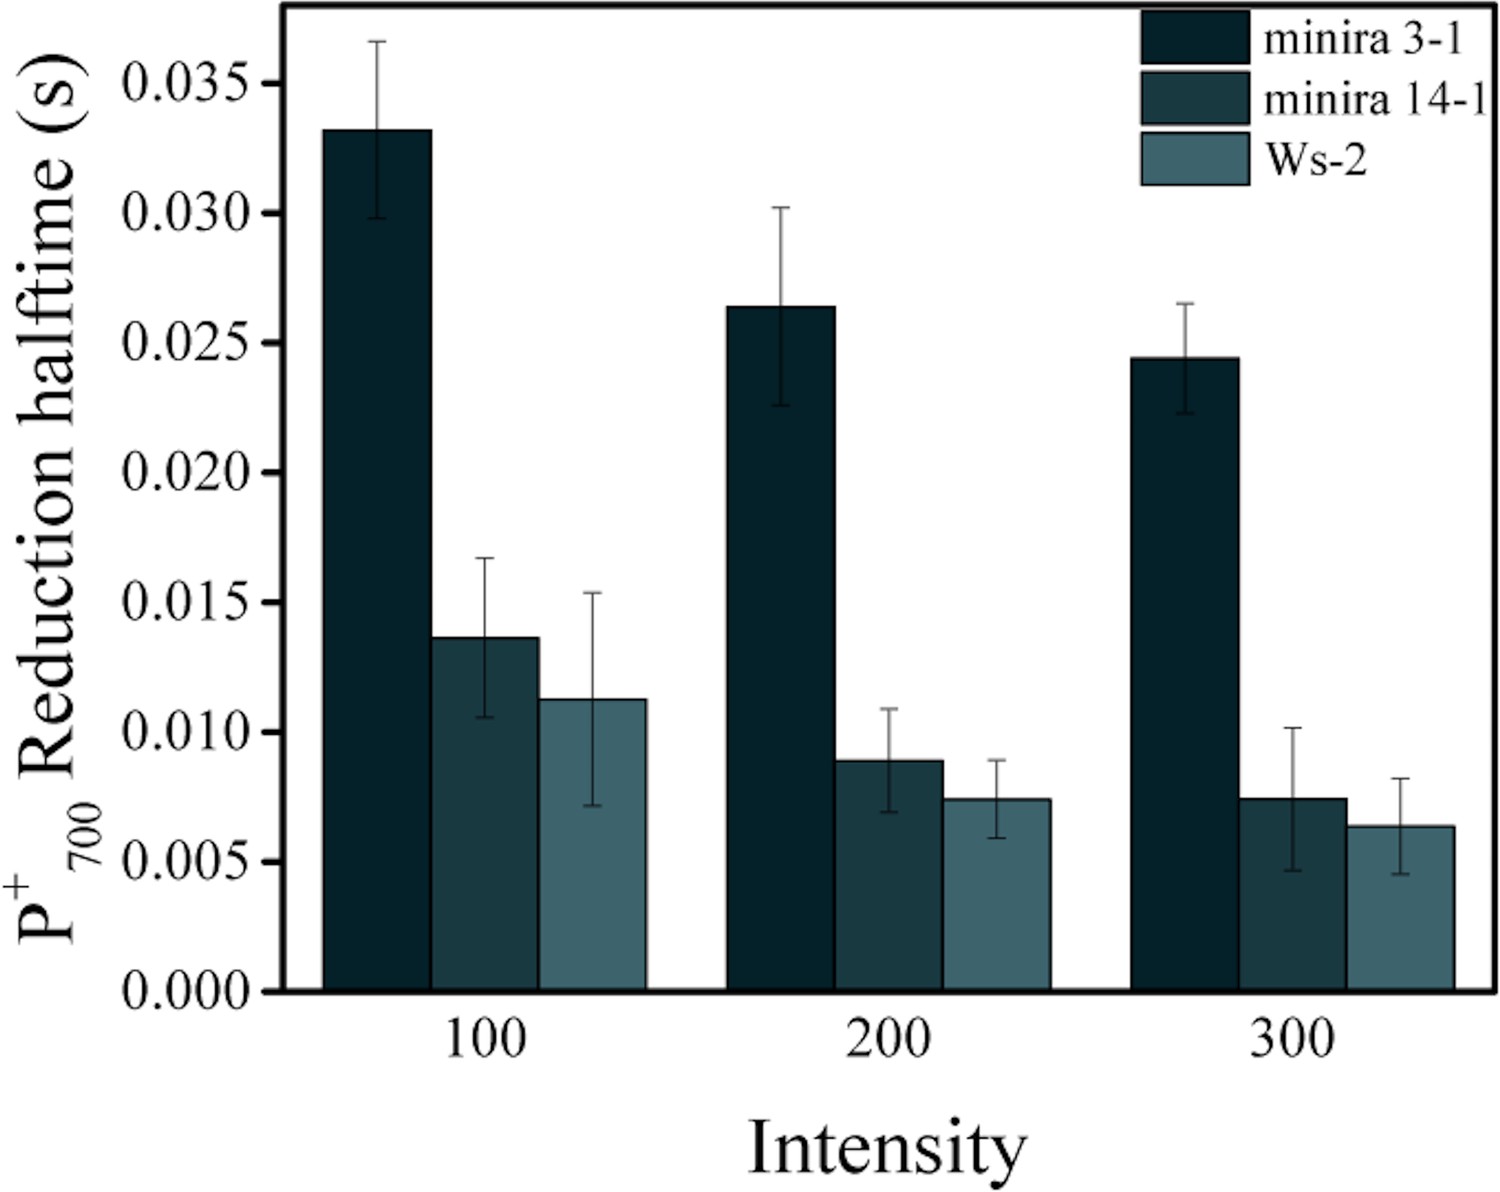
Reduction kinetics of P700+.
Light-dependent P700+ reduction half-times (mean ± s.d., n = 3) of wild type, minira 3–1 and minira 14–1 (A). Quenching of the 810 nm absorbance signal was followed during a brief dark interval and the half time of the first order decay determined at each light intensity.
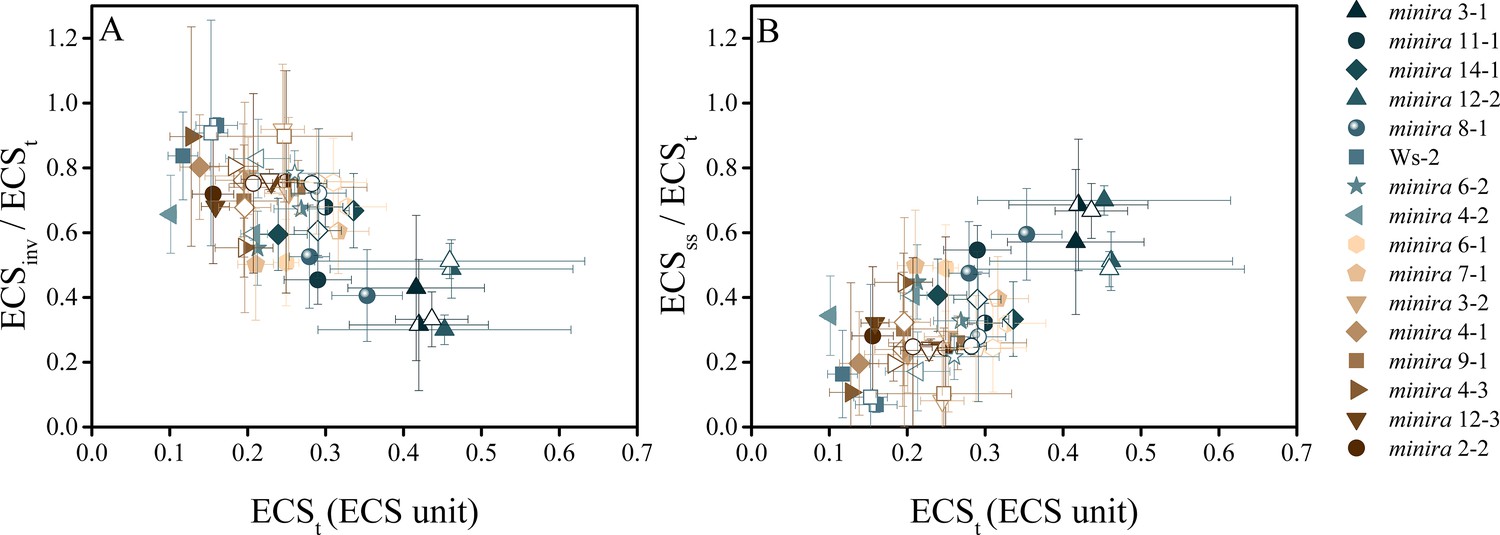
Figure 5—figure supplement 2
The electric field component of the pmf dominates under high pmf conditions.
ECS measurements were performed to determine the partitioning of the light-driven pmf between ΔpH and Δψ. Measurements were performed at 100 (solid symbols), 300 (half filled symbols), and 500 μmol photons m−2s−1 (open symbols) and the total pmf (ECSt) as well as the composition of the pmf determined as in Figure 5. As the total pmf increases, the fraction of pmf stored as ECSinv (proportional to ΔpH) (A) decreases linearly and is observed in all lines regardless of mutation, while the electric field (ECSss) (proportional to Δψ) (B) increases linearly with total pmf, becoming a large fraction of the total pmf under high pmf conditions. Symbols represent the same plant for each light intensity (mean ± s.d., n = 3). ECS units were defined as the deconvoluted ΔA520 μg chlorophyll−1 cm2.
Figure 5—figure supplement 3
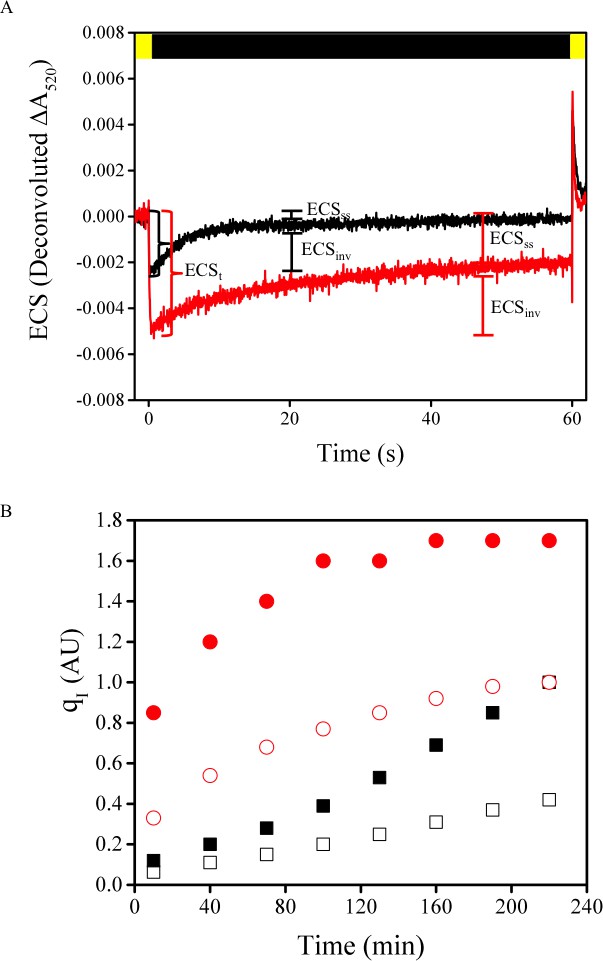
Tobacco ATPC1 antisense knockdown increase Δψ partitioning under high pmf conditions.
The partitioning of the pmf in wild type Samsun (black) and ATPC1 (red) γ-subunit antisense line were determined from the deconvoluted ECS signal at ΔA520 nm (A). Following the light-dark transition (time 0 s), the ECS amplitude drop, which is proportional to the total pmf, is larger in the ATPC1 line due to the substantial knockdown of ATP synthase complexes and an inability to efflux protons from the lumen. The inversion of the ECS signal during the dark period, proportional to the ΔpH, represents a larger fraction of the pmf in the wild type than in ATPC1, indicating an increase in Δψ storage in the higher pmf ATPC1. Light conditions are represented above the traces and indicate the light (yellow) and dark (black) intervals. Leaf discs from another ATPC1 plant and Samsun were subjected to 600 μmol photons m−2s−1 light for the indicated times in the presence of water (open symbols) or lincomycin (closed symbols). Increases in qI are more rapid in the higher pmf ATPC1 line when PSII repair is blocked with lincomycin.
Figure 6
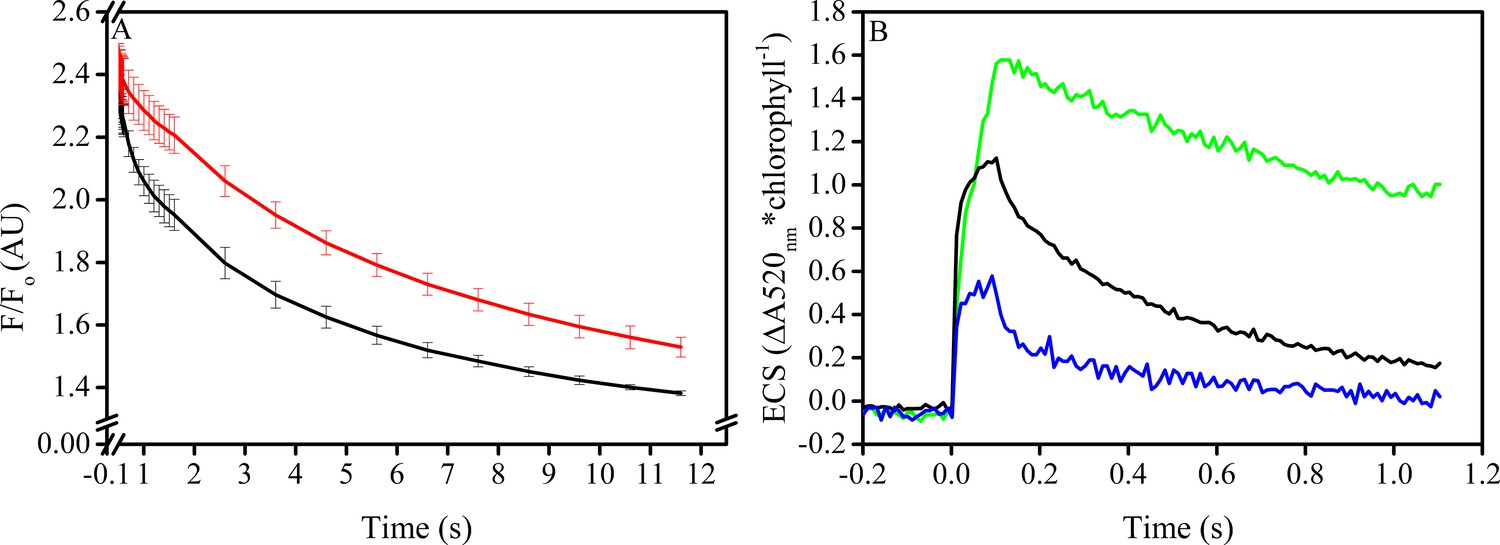
In vitro manipulation of the pmf Δψ alters PSII S2QA− recombination rates.
Isolated spinach thylakoids in the presence of 5 μM spinach ferredoxin and 10 μm sodium ascorbate were treated with 3–3,4-dichlorophenyl 1,1-dimethylurea (DCMU) to block PSII forward electron transfer, and a trans-thylakoid pmf generated utilizing decyl-ubiquinol mediated PSI cyclic electron transfer (A). Recombination from the S2QA− state was probed by observing the decrease in the high fluorescence state associated with QA− following a short (100 ms) actinic flash to dark-adapted thylakoids (black line). Depletion of the pmf, which under these conditions is stored almost exclusively as Δψ, in the presence of 25 μM gramicidin (red line) resulted in an approximate 5-fold increase in the initial rate of decay when Δψ was largest, and an overall 2-fold increase in the lifetime of the high fluorescence state. The extent of Δψ generated by the 100 ms light (B), estimated by the ECS signal measured at 520 nm and normalized to chlorophyll content. Thylakoids were assayed in the absence of inhibitors (green line), in the presence of DCMU (blue line), and in the presence of both DCMU and 50 μM decyl-ubiquinol (black line) to generate pmf through PSI turnover, corresponding to the condition used in panel A.
Figure 7 with 2 supplements
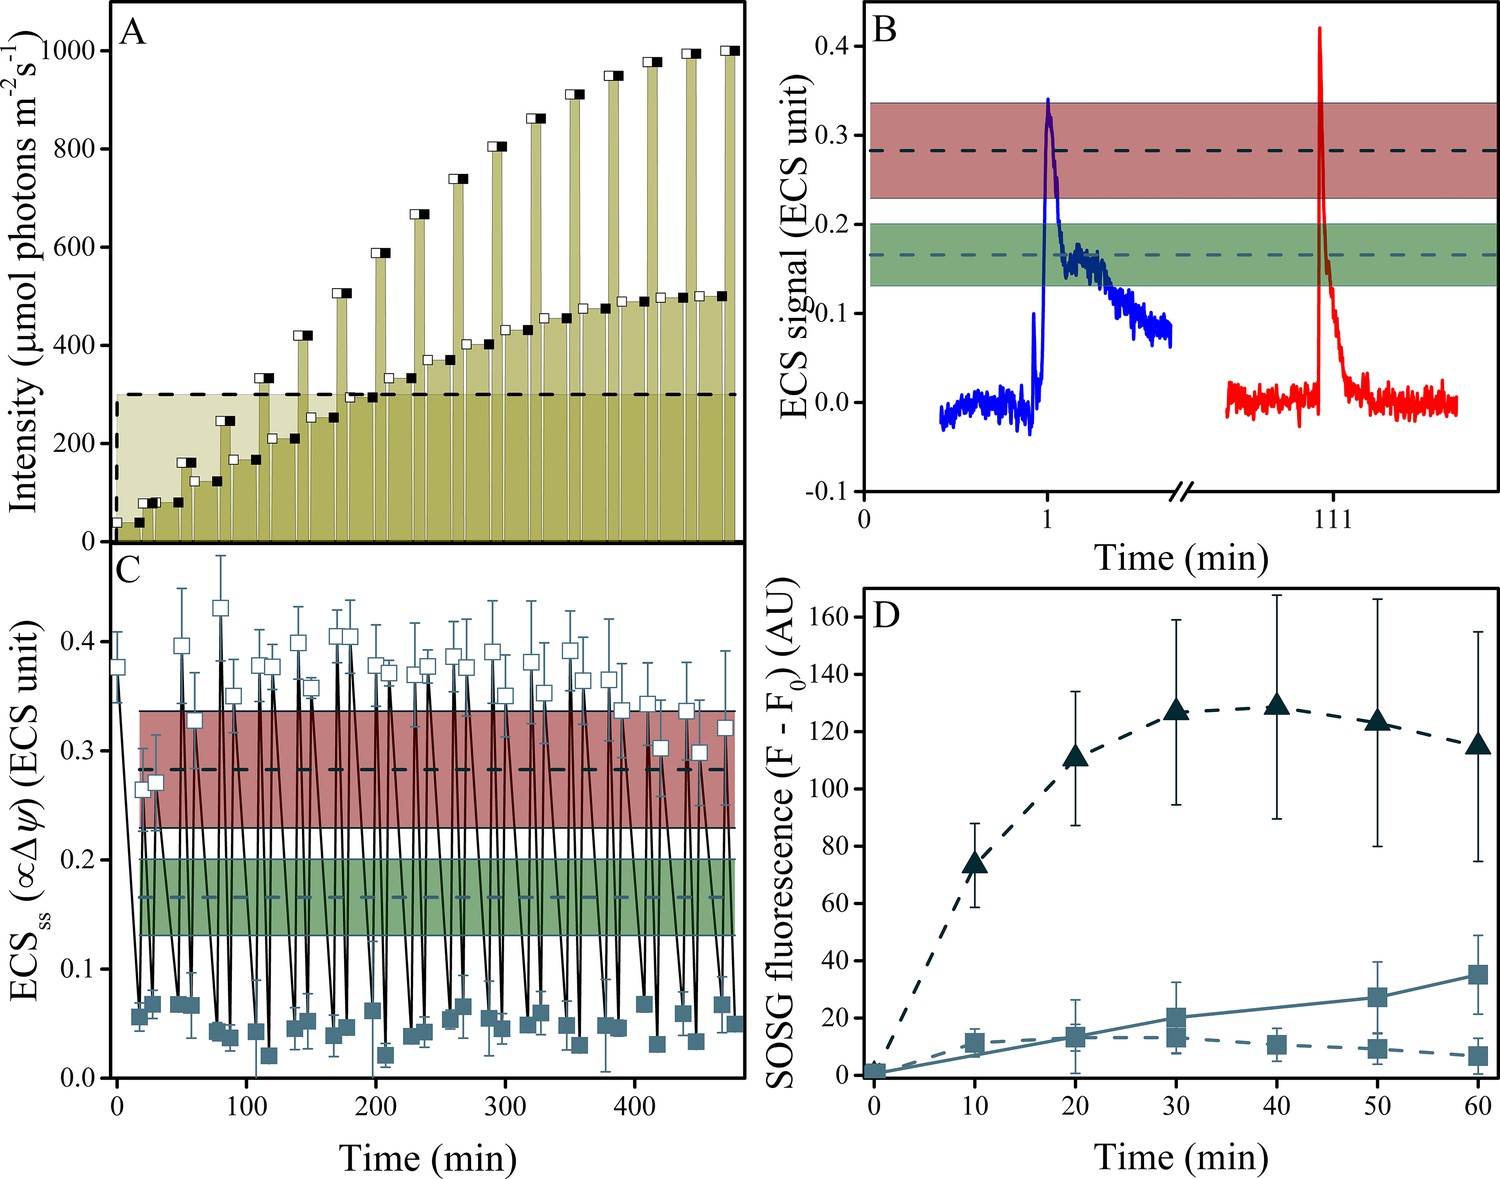
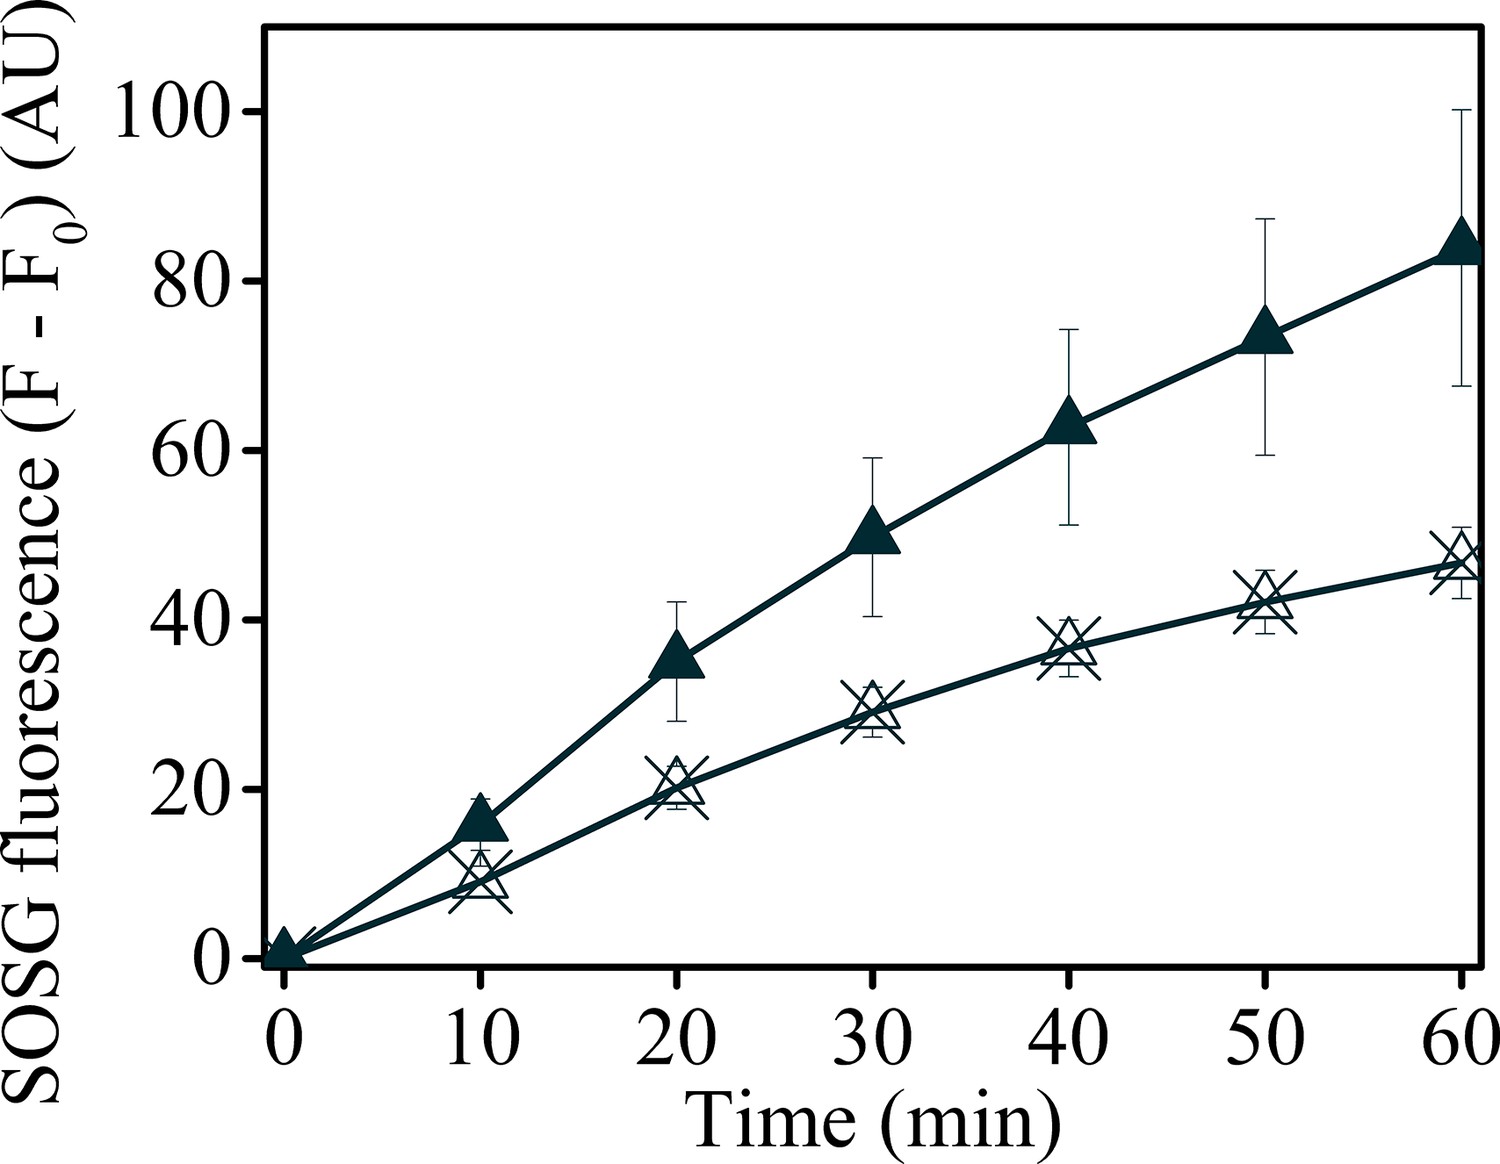
Induction of Δψ and 1O2 production under fluctuating light in wild type plants.
(A) Illumination conditions and measurement points used in the experiments. Fluctuating light conditions (replicating Figure 2 day three) are shown as connected points, with open squares representing measurements obtained 10 s after the light transition and closed squares the end of steady-state illumination. Constant illumination of 300 μmol m−2s−1 is represented as a dotted line. (B) Representative traces of the light-fluctuation induced ECS signals resulting in transient ECS 'spikes' are shown for the first fluctuation (dark to 39 μmol m−2s−1, blue) and the fluctuation from 167 to 333 μmol m−2s−1, red). A full set of ECS kinetic 'spikes' following increased light fluctuations can be found in Figure 7—figure supplement 2. The extents of light-induced Δψ in wild type (green line and shaded box, indicating mean ± s.d) and minira 3–1 (red lines and box, indicating mean ± s.d) at 300 μmol m−2s−1 are shown for comparison. (C) The extents of light-induced Δψ, estimated using the ECSss parameter over the time-course of the fluctuating light experiment, compared to those obtained under continuous illumination in wild type and minira 3–1 (green and red lines and boxes, respectively, as in Panel B). Open and closed squares correspond to the ECSss measurements taken at the timing designated in panel A. (D) Time-course of SOSG fluorescence changes for wild type (squares) and minira 3–1 (triangles) during exposure to constant 300 μmol m−2s−1 (dotted lines)and wild type leaves under the first hour of fluctuating light (solid line). A decrease in SOSG fluorescence occurs when Δψ is collapsed with the addition of the ionophore valinomycin (Figure 7—figure supplement 1). All data in A, B, and C represent mean (n ≥ 3) ± s.d. ECS units were defined as the deconvoluted ΔA520 μg chlorophyll−1 cm2.
Figure 7—figure supplement 1
Uncoupling Δψ decreases SOSG fluorescence in minira 3–1.
Minira 3–1 leaves were vacuum infiltrated with either SOSG (solid triangles) or SOSG and 50 μM valinomycin (crossed triangles) to decrease the photosynthetic Δψ. Leaves were illuminated at a constant 100 μmol m−2s−1 intensity and SOSG fluorescence detected for 60 min.
Figure 7—figure supplement 2
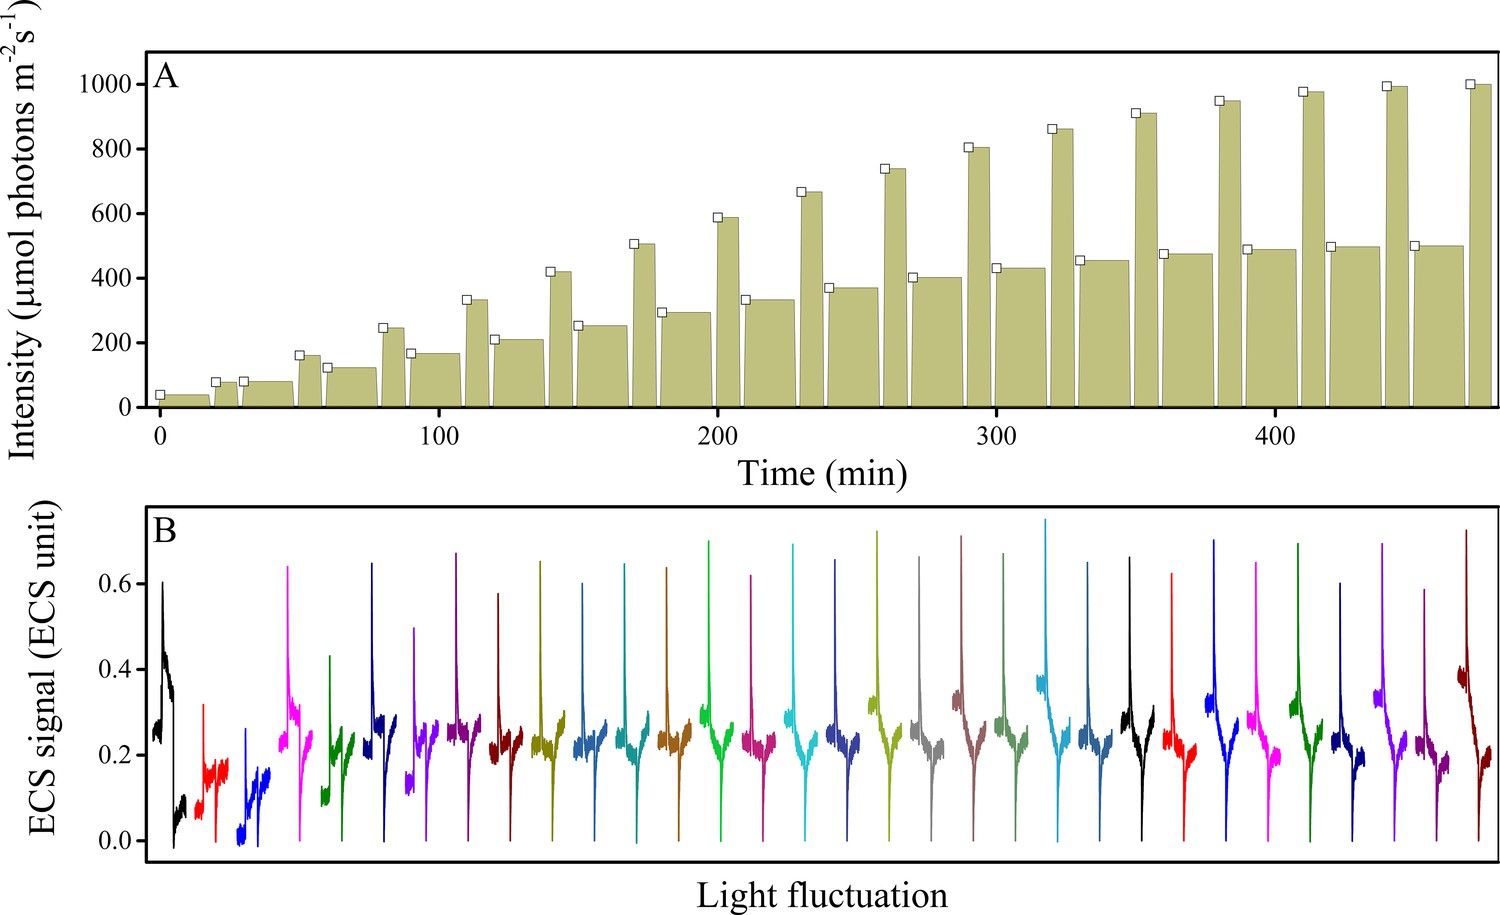
Fluctuations in light intensity result in transient ECS spikes.
Wild type plants were measured under fluctuating light (A) and the ECS measurements taken 10 s after each intensity fluctuation from lower to higher light (A, open squares). The resulting deconvoluted ΔA520 nm ECS signals show rapid, transient ECS 'spikes' induced by rapid Δψ transients before the ΔpH component can be altered (B). The upward spike represents the effect of rapidly increasing the light intensity. The downward spikes seen towards the ends of the traces reflect the transients that occur when the actinic light is switched to the lower light intensity at the end of the fluctuation. A rough estimate of the extent of the Δψ imposed by the spikes can be obtained by comparing the ECS signals with the calibration and results presented in Takizawa et al. (2007), which estimated that the Δψ imposed by a saturating, single-turnover flash to thylakoids was about 40 mV. Based on this calibration value, the extent of basal pmf formed by equilibration with ATP (i.e. the dark pmf level or pmfd) was estimated to be about 112 mV (Takizawa et al., 2007), 60 mV of which is stored in Δψ if the partitioning is 0.5. From the dark-interval relaxation kinetics of ECS under steady-state conditions (see Figure 7B and Figure 5—figure supplement 1), we then expect an additional light-driven pmf under steady-state conditions to range from 150–200 mV, and given that the fraction of this pmf stored as Δψ ranged from 0.20–0.60, we estimate a range for steady-state light-driven Δψ between 30 and 120 mV. The transient spikes in Δψ generated during light fluctuations are likely to be essentially all stored in Δψ (see main text) and range in amplitude between 60–80 mV, so that the highest amplitude Δψ imposed during these conditions likely falls in the broad range between 150–260 mV. ECS units were defined as the deconvoluted ΔA520 μg chlorophyll−1 cm2.
Figure 8
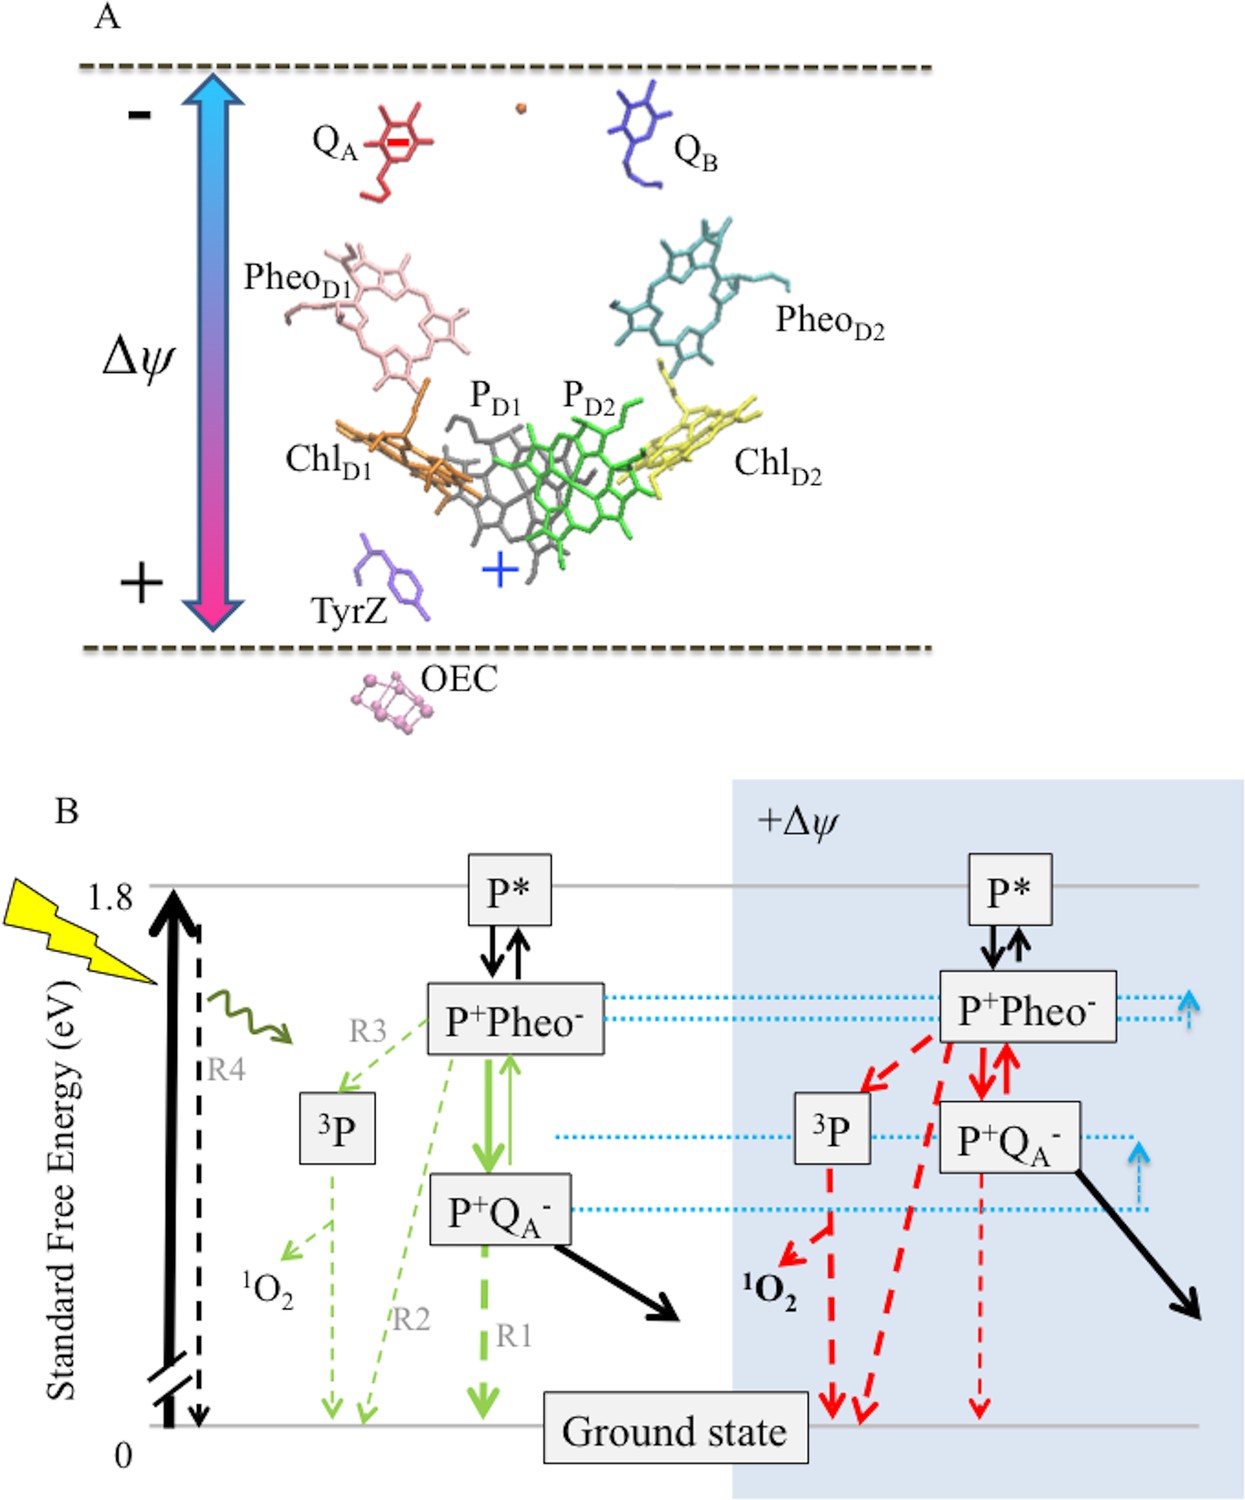
Schemes for the trans-thylakoid Δψ-induced acceleration of recombination reactions in PSII and subsequent production of 1O2.
(A) The relative positions of PSII electron transfer cofactors with respect to the electric field (double-headed arrow) imposed across the thylakoid membrane (dotted lines). The red and blue arrows indicate the Δψ-induced changes in the equilibrium constant for the sharing of electrons (−) between QA and Pheo, and electron holes (+) among P+ and the oxygen evolving complex. Excitation of PSII by light leads to formation of excited chlorophyll states (P*), the excitation is shared over the 4 chlorophylls and the 2 pheophytins. Charge separation occurs between more than one pair of pigments, so at short times the situation is not well defined, but ChlD1+Pheo D1− appears to be the dominant radical pair. Secondary electron transfer events occur forming PD1+PheoD1−, the second radical pair, which is present in nearly all centers. This radical pair is stabilized by electron transfer from Pheo− to QA forming PD1+QA−. This radical pair is further stabilized by electron transfer from D1Tyr161 (TyrZ) forming a neutral tyrosyl radical, which oxidizes the Mn cluster of the oxygen evolving complex to form the state Sn+1QA−. Finally, QA− reduces QB to form Sn+1QB-. Upon a second PSII turnover the double reduced and protonated QB plastohydroquinone becomes protonated and is exchanged with an oxidized plastoquinone from the membrane pool (black arrows). The illustration was based on crystal structure 3WU2 (Umena et al., 2011). (B) The charge separation states described above are unstable and recombination competes with the energy-storing reactions. When PD1+ is present, recombination reactions can occur by several pathways as indicated by the dashed lines: (1) direct electron transfer from QA− to P+ (R1); (2) by the back reaction to form the P+Pheo− state, which can then recombine directly (R2) or, (3) when the P+Pheo− radical pair is present as a triplet state, 3[P+Pheo−], the dominant state when formed by the back-reaction, 3[P+Pheo−] charge recombination forms 3P (R3), a long lived chlorophyll triplet that can easily interact with O2 to form 1O2; (4) complete reversal of electron transfer can also occur, repopulating P* (R4), which can return to the ground state by emitting fluorescence (luminescence) or heat. Route 3, the triplet generating pathway, is the dominant recombination route in fully functional PSII. For simplicity the 3[P+Phe-] is not distinguised from the singlet form in this scheme. A Δψ across the membrane should destabilize P+QA− relative to the other states (see dotted blue lines), affecting the rates of reactions indicated in the green versus red. A Δψ across the membrane should also destabilize P+Pheo−, but because of the smaller dielectric span across the membrane, to a lesser extent than P+QA−. Thus, the buildup of Δψ should shift the equilibrium constant for sharing electrons between QA− and Pheo, favoring the formation of Pheo− and thus increasing the rate of recombination through R3 (as well as the R2 and R4), resulting in increased production of 3P and 1O2. Destabilization of P+QA− will also increase the driving force for P+QA− recombination via R1, however this recombination is already driven by 1.4eV and it is thus likely to be in the Marcus inverted region. Thus increasing the driving force will slow recombination by this route.
Videos
Video 1
(phi2_movie_labeled_day1): Whole plant PSII quantum efficiency (ΦII) during constant illumination.
False-colored chlorophyll fluorescence images of whole plants obtained during constant, 100 μmol photons m−2 s−1 actinic illumination over a 16 hr photoperiod. Measurements and calculations were performed as described in Materials and methods. Images were false colored according to calculated values, from magenta (high) to blue (low).
Video 2
(phi2_movie_labeled_day2): Whole plant PSII quantum efficiency (ΦII) during sinusoidal illumination.
False-colored chlorophyll fluorescence images of whole plants obtained during sinusoidal actinic illumination over a 16 hr photoperiod. Measurements and calculations were performed as described in Materials and methods. Images were false colored according to calculated values, from magenta (high) to blue (low).
Video 3
(phi2_movie_labeled_day3): Whole plant PSII quantum efficiency (ΦII) during fluctuating sinusoidal illumination.
False-colored chlorophyll fluorescence images of whole plants obtained during fluctuating sinusoidal actinic illumination over a 16 hr photoperiod. Measurements and calculations were performed as described in Materials and methods. Images were false colored according to calculated values, from magenta (high) to blue (low).
Video 4
qE_movie_labeled_day1): Whole plant pH-dependent quenching (qE) during constant illumination.
False-colored chlorophyll fluorescence images of whole plants obtained during constant, 100 μmol photons m−2 s−1 actinic illumination over a 16 hr photoperiod. Measurements and calculations were performed as described in Materials and methods. Images were false colored according to calculated values, from magenta (high) to blue (low).
Video 5
(qE_movie_labeled_day2): Whole plant pH-dependent quenching (qE) during sinusoidal illumination.
False-colored chlorophyll fluorescence images of whole plants obtained during sinusoidal actinic actinic illumination over a 16 hr photoperiod. Measurements and calculations were performed as described in Materials and methods. Images were false colored according to calculated values, from magenta (high) to blue (low).
Video 6
(qE_movie_labeled_day3): Whole plant pH-dependent quenching (qE) during fluctuating sinusoidal illumination.
False-colored chlorophyll fluorescence images of whole plants obtained during fluctuating sinusoidal actinic illumination over a 16 hr photoperiod. Measurements and calculations were performed as described in Materials and methods. Images were false colored according to calculated values, from magenta (high) to blue (low).
Video 7
(qI_movie_labeled_day1): Whole plant photoinhibitory quenching (qI) during constant illumination.
False-colored chlorophyll fluorescence images of whole plants obtained during constant, 100 μmol photons m−2 s−1 actinic illumination over a 16 hr photoperiod. Measurements and calculations were performed as described in Materials and methods. Images were false colored according to calculated values, from magenta (high) to blue (low).
Video 8
(qI_movie_labeled_day2): Whole plant photoinhibitory quenching (qI) during sinusoidal illumination.
False-colored chlorophyll fluorescence images of whole plants obtained during sinusoidal actinic actinic illumination over a 16 hr photoperiod. Measurements and calculations were performed as described in Materials and methods. Images were false colored according to calculated values, from magenta (high) to blue (low).
Video 9
(qI_movie_labeled_day3): Whole plant photoinhibitory quenching (qI) during fluctuating sinusoidal illumination.
False-colored chlorophyll fluorescence images of whole plants obtained during fluctuating sinusoidal actinic illumination over a 16 hr photoperiod. Measurements and calculations were performed as described in Materials and methods. Images were false colored according to calculated values, from magenta (high) to blue (low).
Additional files
-
Supplementary file 1
Oligonucleotides used for site directed mutagenesis of atpc1.
(a) Oligonucleotide sequences utilized for adapter ligation mutagenesis. (b) Oligonucleotide sequences utilized for adapter ligation mutagenesis to introduce secondary mutations. (c) Oligonucleotide sequences utilized for splicing by overlap extension PCR. (d) Synthetic gene constructs incorporating multiple ATPC2 mutations into ATPC1.
- https://doi.org/10.7554/eLife.16921.040
-
Supplementary file 2
Timing and light intensity profiles used for chlorophyll fluorescence imaging.
(a) Timing and light profile of imaging day one. (b) Timing and light profile of imaging day two. (c) Timing and light profile of imaging day three.
- https://doi.org/10.7554/eLife.16921.041
-
Supplementary file 3
Chlorophyll content of wild-type (Ws-2) and minira leaves.
All measurements were performed on three-week old leaves following in vivo spectroscopic measurements as described in Materials and methods. Data represent the mean ± s.d. for n ≥ 3 leaves. Statistically significant differences (*p<0.05) from wild-type were determined using a t-test.
- https://doi.org/10.7554/eLife.16921.042
Download links
A two-part list of links to download the article, or parts of the article, in various formats.
Downloads (link to download the article as PDF)
Open citations (links to open the citations from this article in various online reference manager services)
Cite this article (links to download the citations from this article in formats compatible with various reference manager tools)
Limitations to photosynthesis by proton motive force-induced photosystem II photodamage
eLife 5:e16921.
https://doi.org/10.7554/eLife.16921


