Visual landmarks sharpen grid cell metric and confer context specificity to neurons of the medial entorhinal cortex
- Medical Faculty of Heidelberg University, Germany
- German Cancer Research Center, Germany
Figures
Figure 1 with 1 supplement
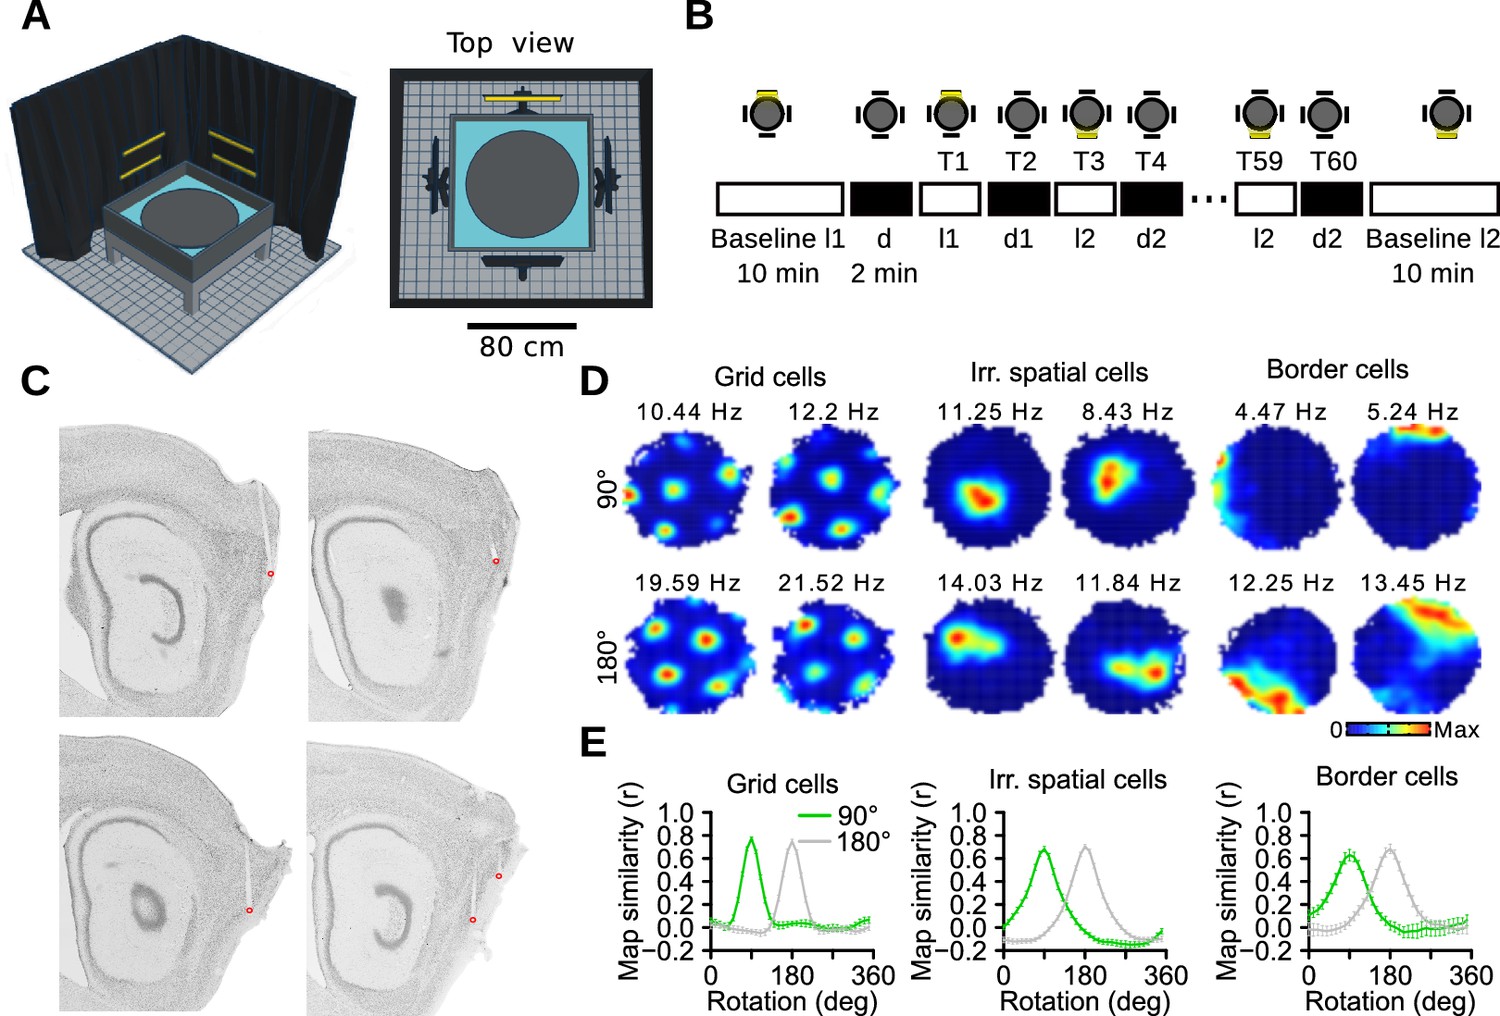
Recording protocol and cue control of MEC spatial representations.
(A) Schematic of the recording apparatus. Left: Side perspective. An elevated circular arena was located within a square box filled with water. Note that half of the black curtain and two light panels were omitted for better visualization. Right: Top view. Four LED panels were positioned outside the box at 90° to each other. (B) Recording protocol. Two lights out of four were selected at the beginning of each recording session (l1 and l2). The protocol started and ended with a 10-min baseline, one with each light (Baseline l1 and Baseline l2). In between were 60 2-min trials (T), alternating between light and dark trials. The presentation of the two lights (l1 and l2) followed a random sequence. Only one light could be switched on at any time. (C) Sagittal brain sections showing the location of the recording sites (red dots) in the MEC. (D) Examples of firing rate maps of two grid cells (left, one cell on each row), two irregular spatially selective neurons (middle) and two border cells (right) during trials with l1 and l2. Top and bottom rows contained cells recorded with l1 and l2 being at 90° and 180° to each other, respectively. The numbers above the firing rate maps are the peak firing rates. (E) Correlations between l1 and l2 maps after rotating l2 maps in 10° steps, plotted separately for sessions with 90° and 180° between l1 and l2.
-
Figure 1—source data 1
Histological results of the mice recorded on the circular arena.
Each page of the document shows the brain sections with tetrode tracks of one hemisphere. Arrows point to the tetrode tracks and asterisks indicate the tetrode tips. Different colors were assigned to different tetrodes.
- https://doi.org/10.7554/eLife.16937.003
-
Figure 1—source data 2
Location of the tetrode tips in each hemisphere for recordings done on the circular arena.
* Extensive cortical damage; tetrodes from this hemisphere were not considered as MEC tetrodes in the analysis. ** Histological results unavailable.
- https://doi.org/10.7554/eLife.16937.004
Figure 1—figure supplement 1
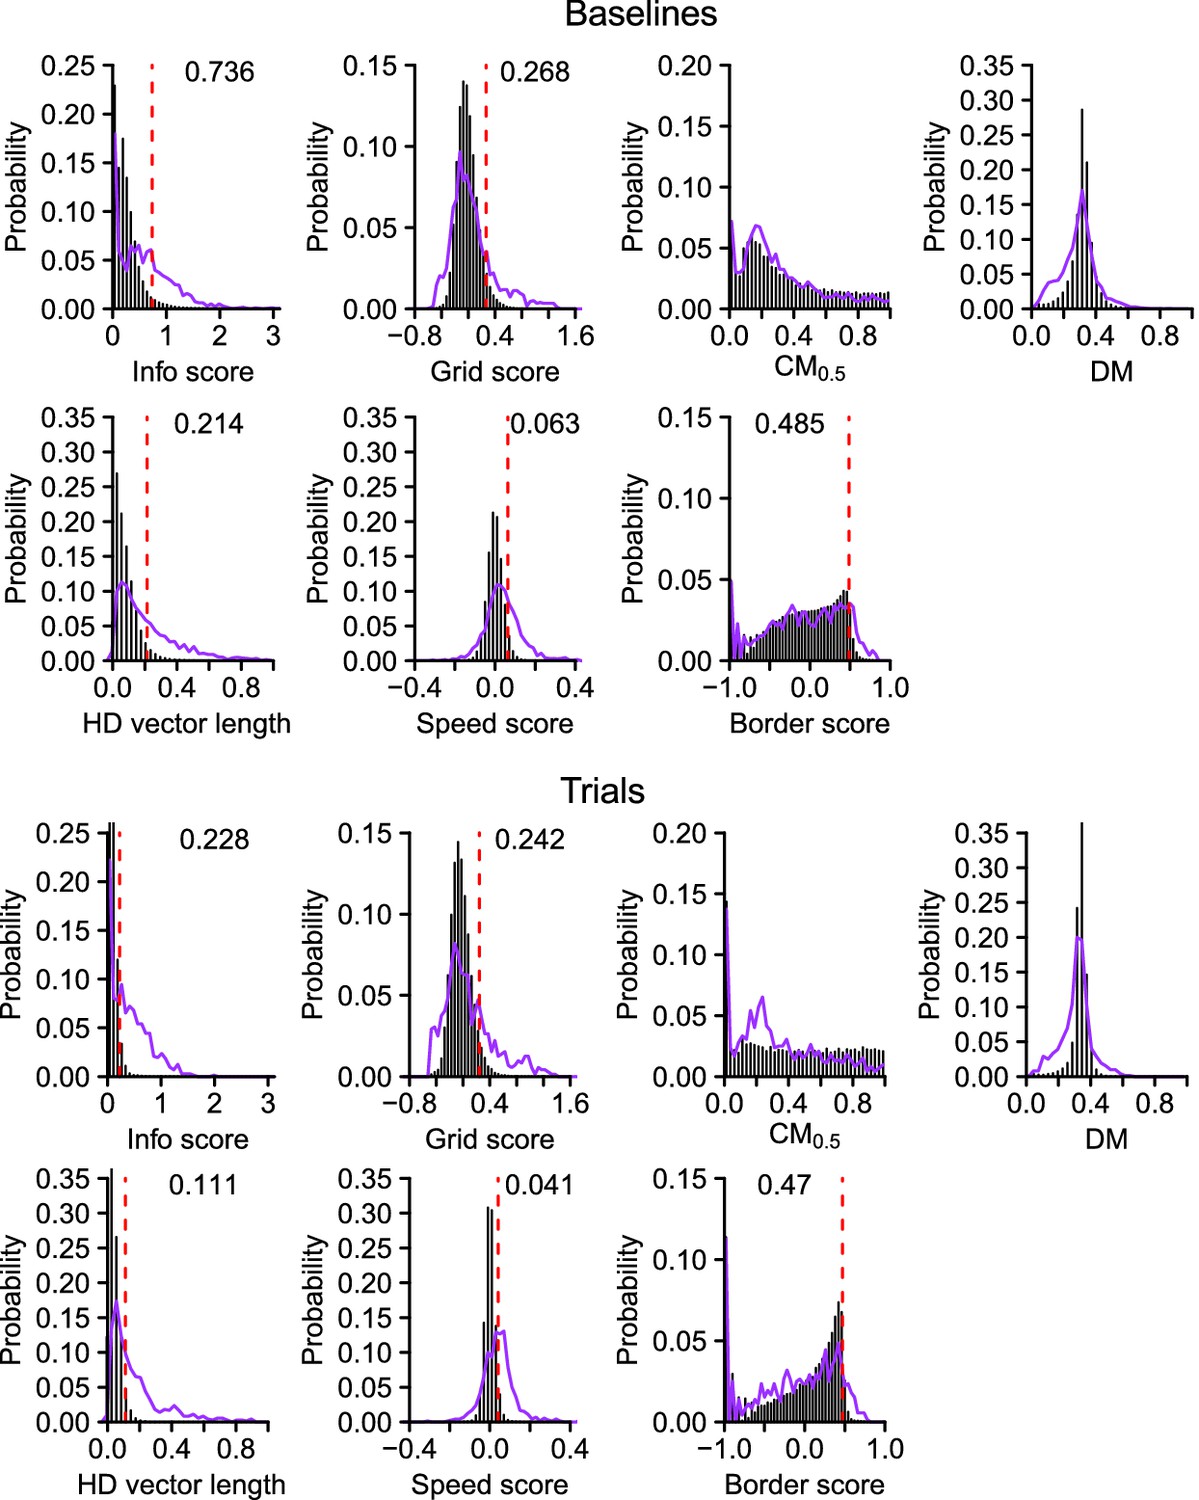
Spatial scores used to identify spatially selective neurons.
Observed (purple line) and surrogate (vertical black bars) distributions of the spatial scores during the baselines and trials. The 95th percentile is indicated by a red dotted line. The number next to the red line is the 95th percentile.
Figure 2 with 1 supplement
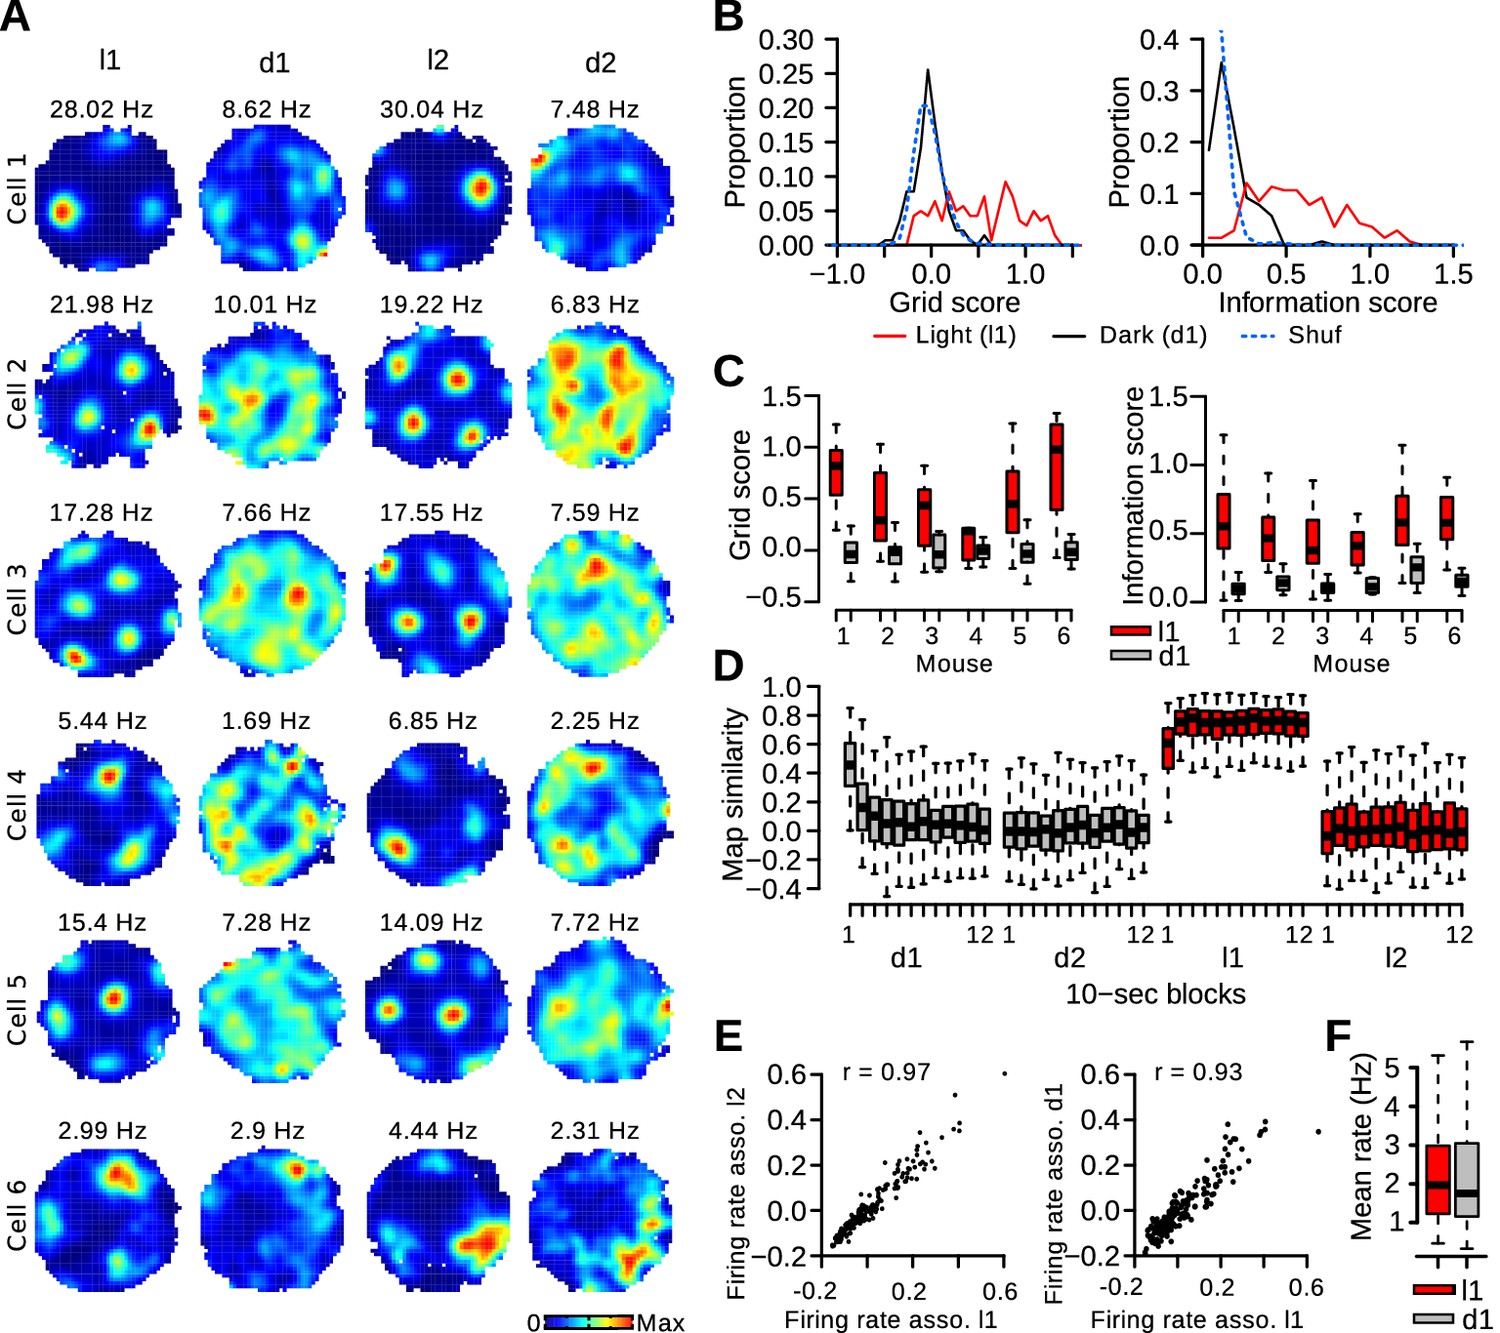
Rapid degradation of grid cell periodicity in absence of visual landmarks.
(A) Firing maps of 6 grid cells during light and dark trials. (B) Distribution of grid and information scores of grid cells during l1 and d1 trials. The dotted blue line represents the surrogate (Shuf) distribution. (C) Grid and information scores during l1 and d1 trials for individual mice with at least 5 recorded grid cells. (D) Map similarity between 10-s block maps and l1 maps (left column in panel A). (E) Left: Firing rate associations of pairs of grid cells during l1 and l2 trials. Right: Firing rate associations of pairs of grid cells during l1 and d1 trials. (F) Mean firing rate of grid cells.
Figure 2—figure supplement 1
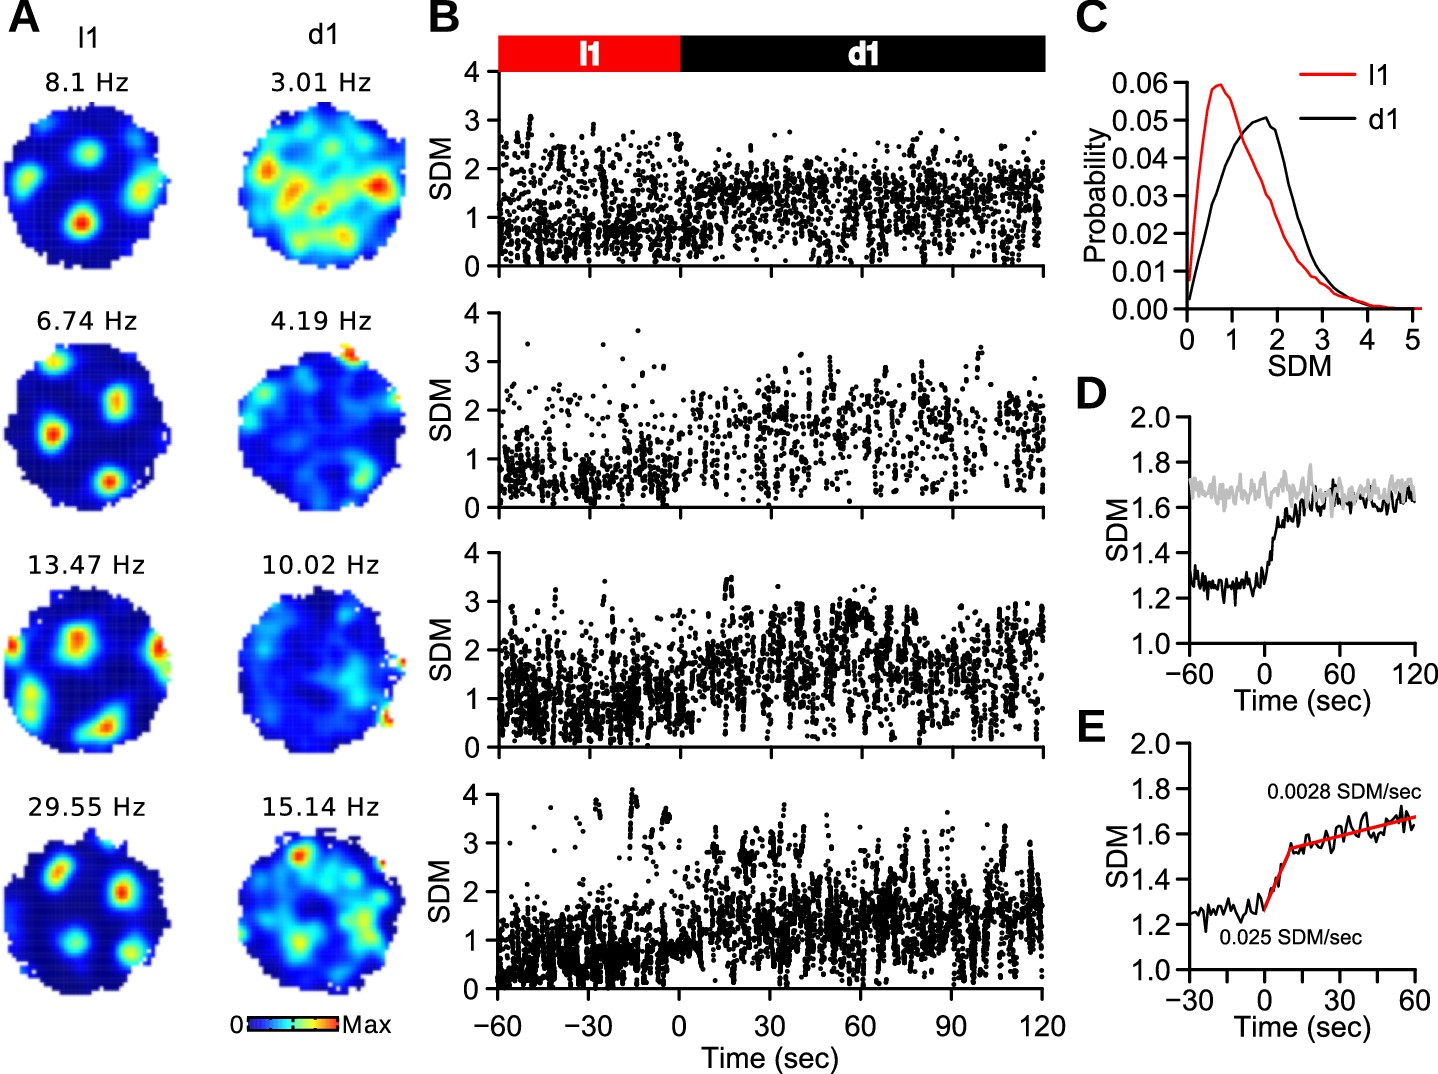
Spike distance metric (SDM) during light and dark trials.
(A) Firing rate maps of 4 grid cells during l1 and d1 trials. (B) SDM for the spikes of the 4 grid cells shown in A. Time 0 represents the light-dark transitions between l1 and d1 trials. (C) Distribution of SDM of grid cell spikes for the last 60 s of l1 trials and the entire d1 trials. SDM scores were larger during dark trials (Wilcoxon signed rank test, n l1 = 282102 spikes, n d1 = 557570 spikes, w = 5.670310, p<10−16). (D) Mean SDM (black line) as a function of time (1-s time windows). 0 represents the light-dark transitions between l1 and d1 trials. The gray line indicates mean SDM after shifting the spike times by at least 20 s before recalculating the spike locations. (E) Mean SDM as a function of time from the light-dark transition. The regression lines for SDM scores between 0 and 10 s and between 10 and 60 s are shown in red. The numbers within the graph indicate the slopes of the two regression lines.
Figure 3
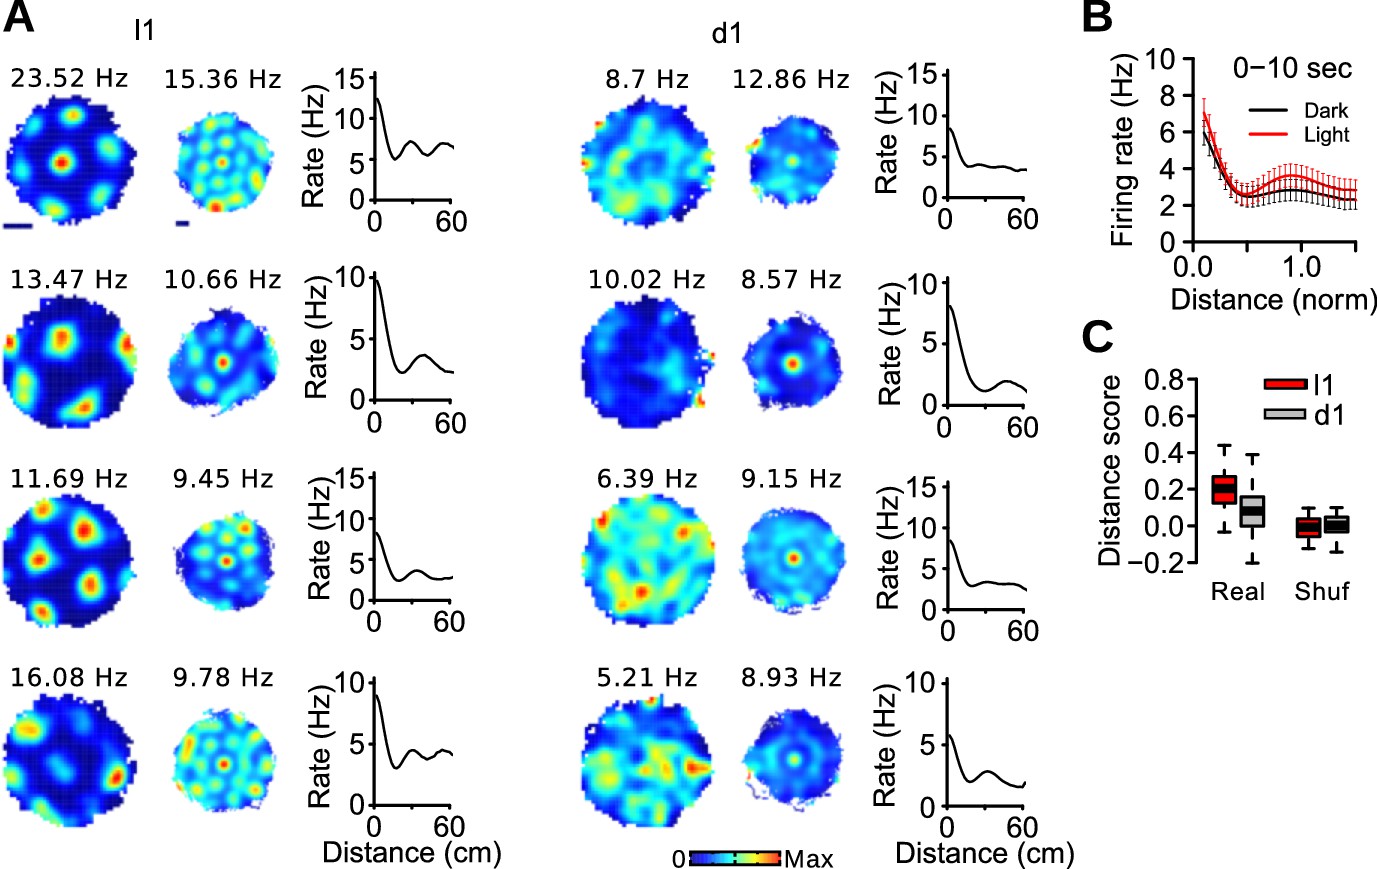
Distance coding in grid cells.
(A) Examples of firing rate maps, spike-triggered firing maps and distance tuning curves of 4 grid cells during light and dark trials. The scale bars for firing maps represent 20 cm. (B) Mean distance tuning curves of grid cells. Distance was normalized to the spacing of each grid cell. (C) Distance score of grid cells during l1 and d1 trials for real and surrogate (Shuf) data.
Figure 4
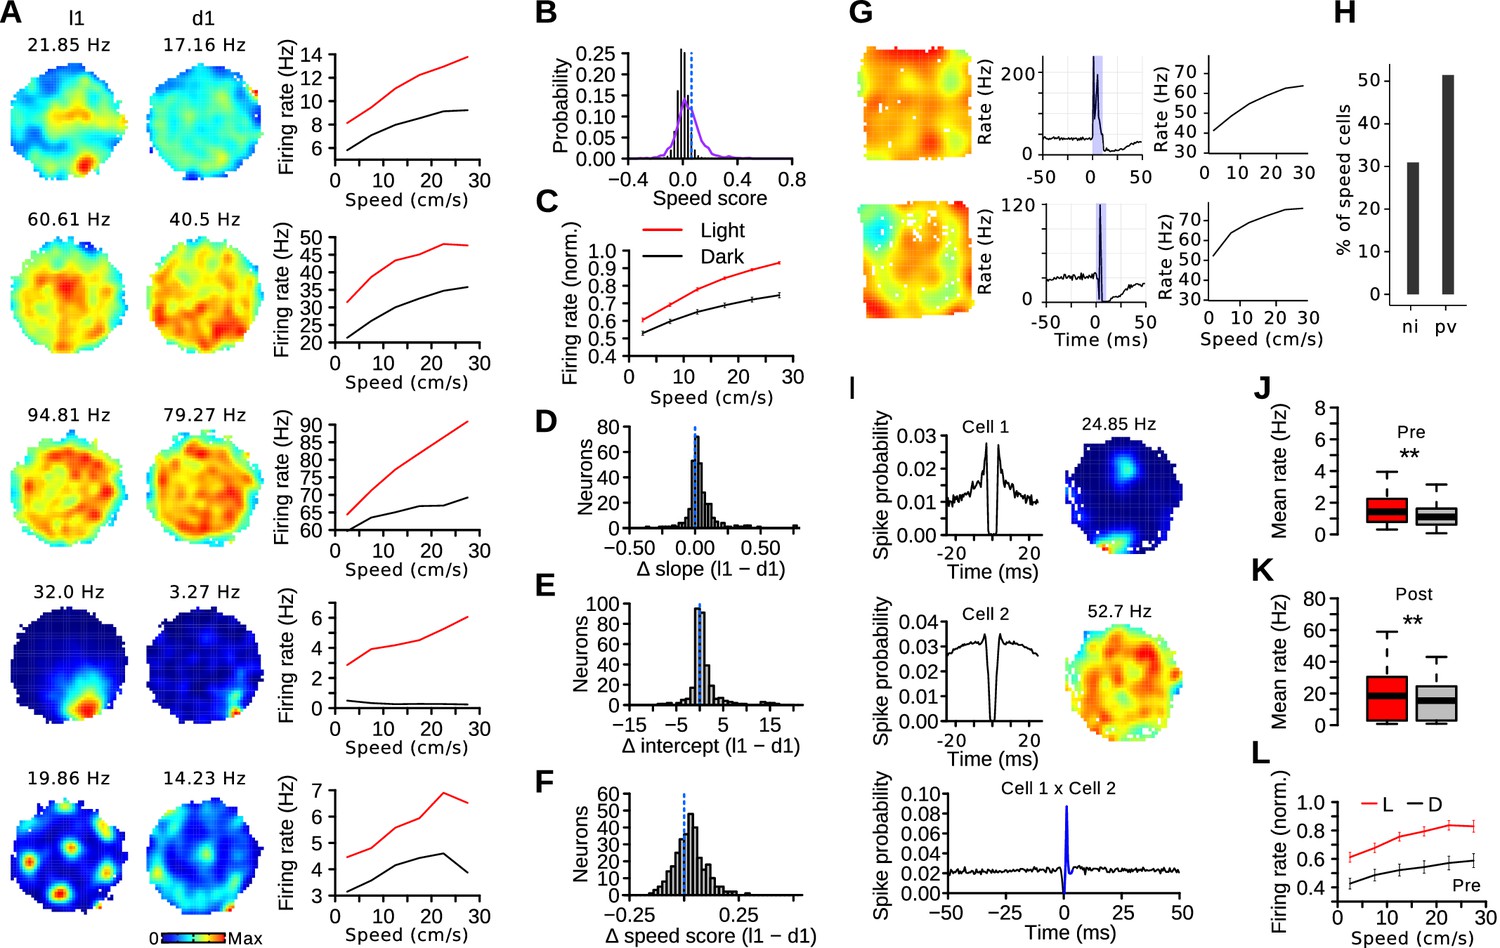
Visual stimuli alter the MEC speed code.
(A) Examples of firing rate maps and speed tuning curves during light and dark trials for cells with a significant speed score. (B) Real (purple line) and surrogate (solid black bars) distributions of speed scores from MEC neurons. The dotted blue line indicates the threshold for statistical significance. (C) Mean normalized firing rate (± s.e.m) of speed-modulated cells as a function of running speed during l1 and d1 trials. (D, E and F) Difference of speed-rate slopes, intercepts and speed scores of speed-modulated cells during l1 and d1 trials. The dotted lines indicates chance levels. (G) Firing rate map, response to laser stimulation and speed tuning curve of two PV-expressing neurons. (H) Percentage of speed-modulated cells in PV-expressing neurons (pv) and in non-identified MEC neurons (ni). (I) Example of a putative excitatory connection involving a post-synaptic speed cell. Left: spike-time autocorrelations of putative pre- (top) and post-synaptic (middle) neurons. Right: firing rate maps during light trials. Bottom: spike-time crosscorrelation of the two neurons. The blue color indicates the peak detection period. (J) Mean firing rate during light and dark trials of putative presynaptic neurons with excitatory interactions with a speed cell. (K) Mean firing rate during light and dark trials of speed cells receiving putative excitatory connections from a local neuron. (L) Mean firing rate (± s.e.m) as function of running speed of putative presynaptic neurons with excitatory interactions with a speed cell. **p<0.01.
Figure 5
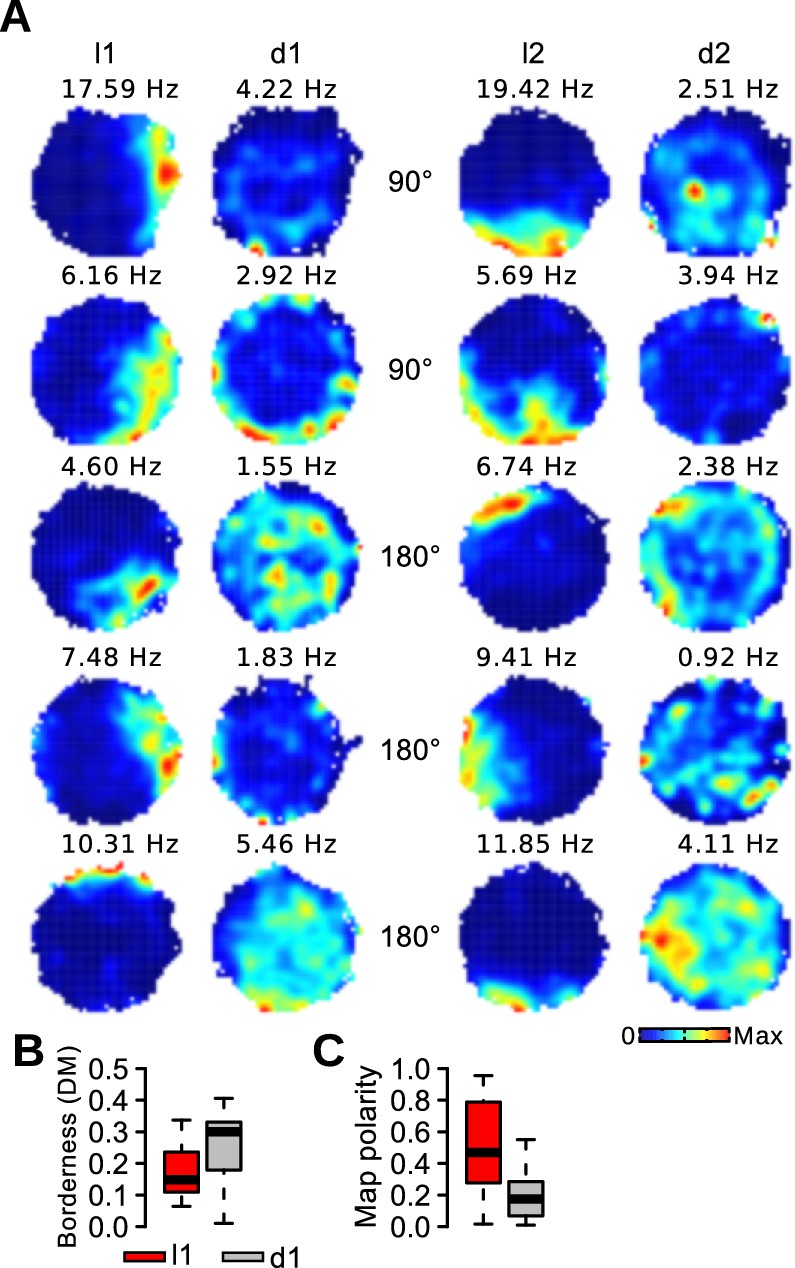
Impairment of border representation in darkness.
(A) Firing maps of 5 border cells during light and dark trials. (B) Borderness (DM) of the firing rate maps of border cells during light and dark trials. (C) Polarity of the firing rate maps of border cells during light and dark trials.
Figure 6
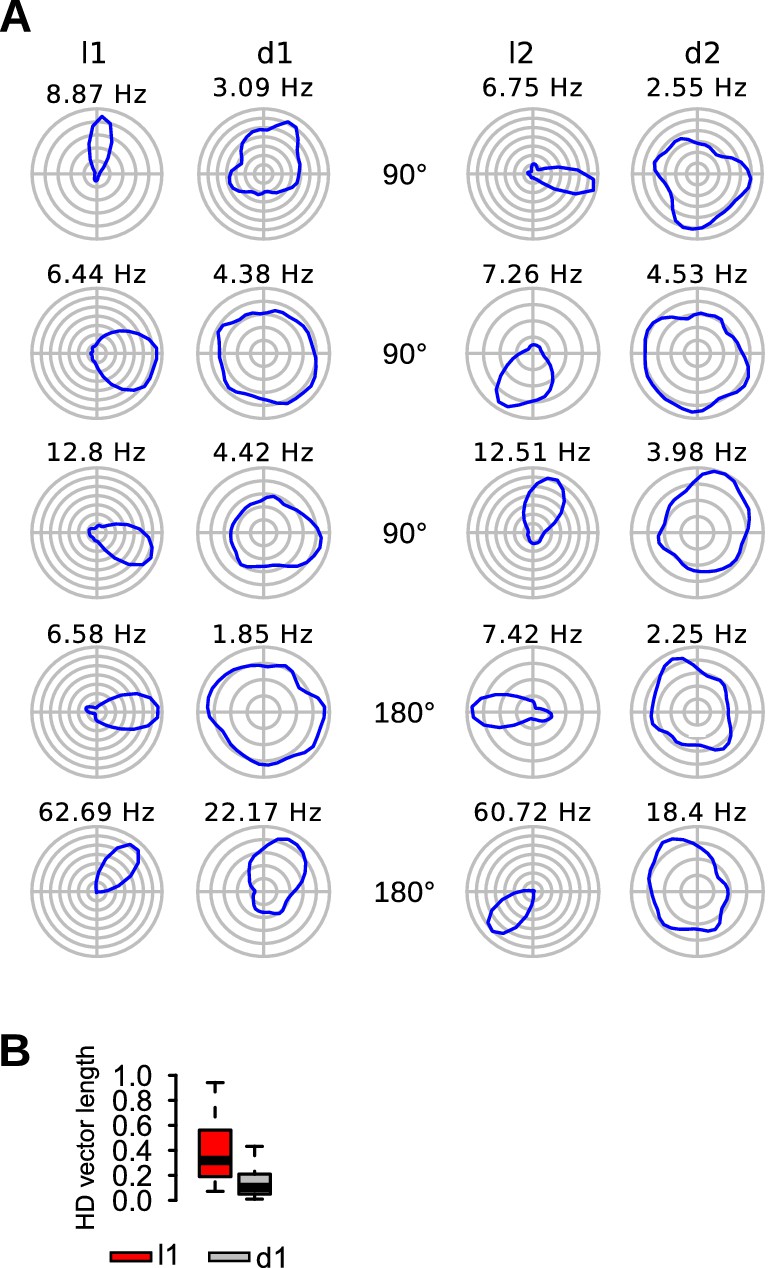
Reduced head-direction selectivity in darkness.
(A) Firing maps of 5 head-direction cells during light and dark trials. (B) Head-direction vector length of head-direction cells during l1 and d1 trials.
Figure 7
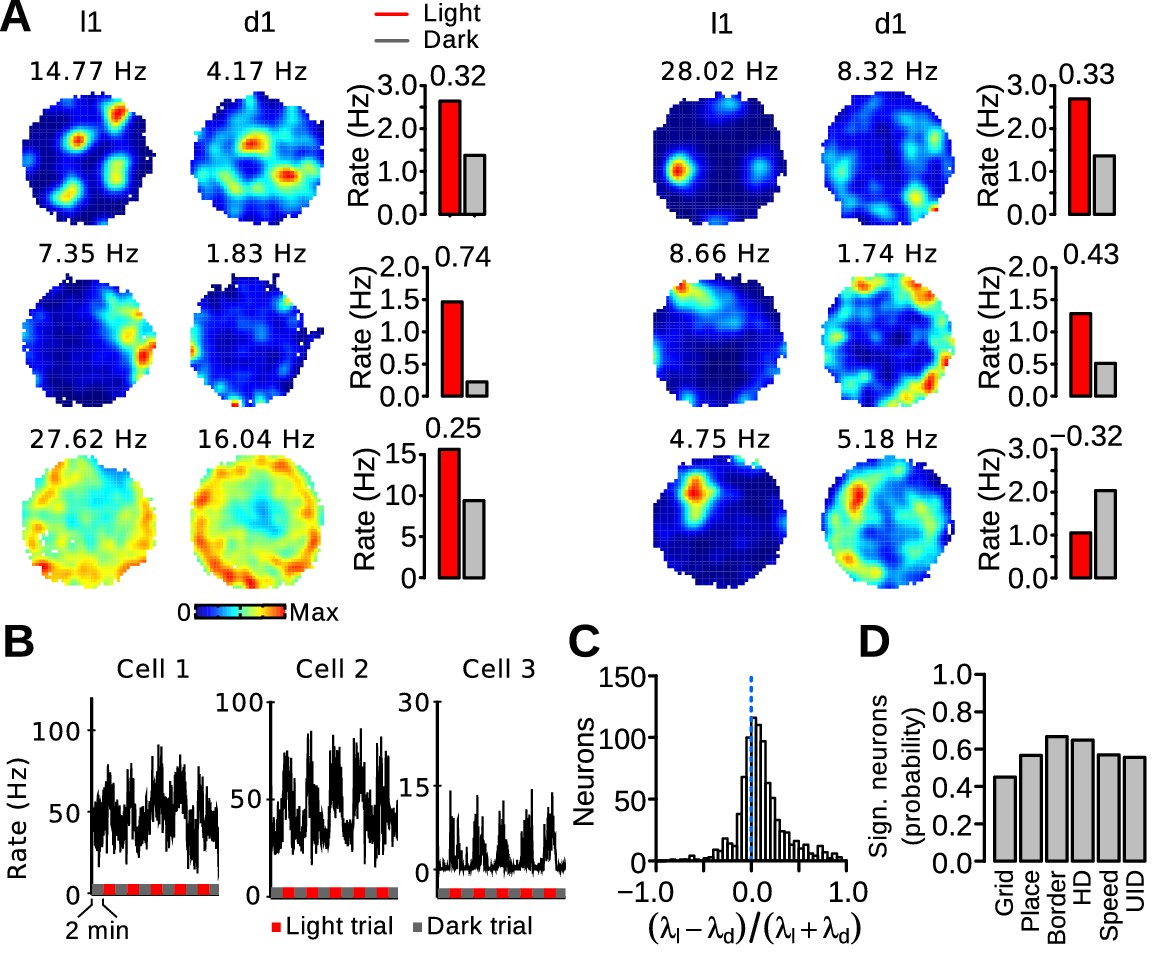
Firing rate changes of MEC neurons between light and dark trials.
(A) Firing maps and mean firing rates during light and dark trials for 6 neurons. The number above each bar plot is the rate discrimination index. (B) Examples of instantaneous firing rates of 3 neurons during light and dark trials (smoothing kernel width s.d = 900 ms). (C) Distribution of the rate discrimination indices for all recorded neurons (including putative interneurons). Most neurons had a positive discrimination index, indicating higher firing rates during light trials. The dotted line indicates chance level. (D) Proportion of neurons with a significant rate change between light and dark trials in different functionally defined cell types (Grid: grid cells, Place: irregular spatially selective cells, Border: border cells, HD: head-direction cells, Speed: speed-modulated cells, UID: unidentified cells).
Figure 8
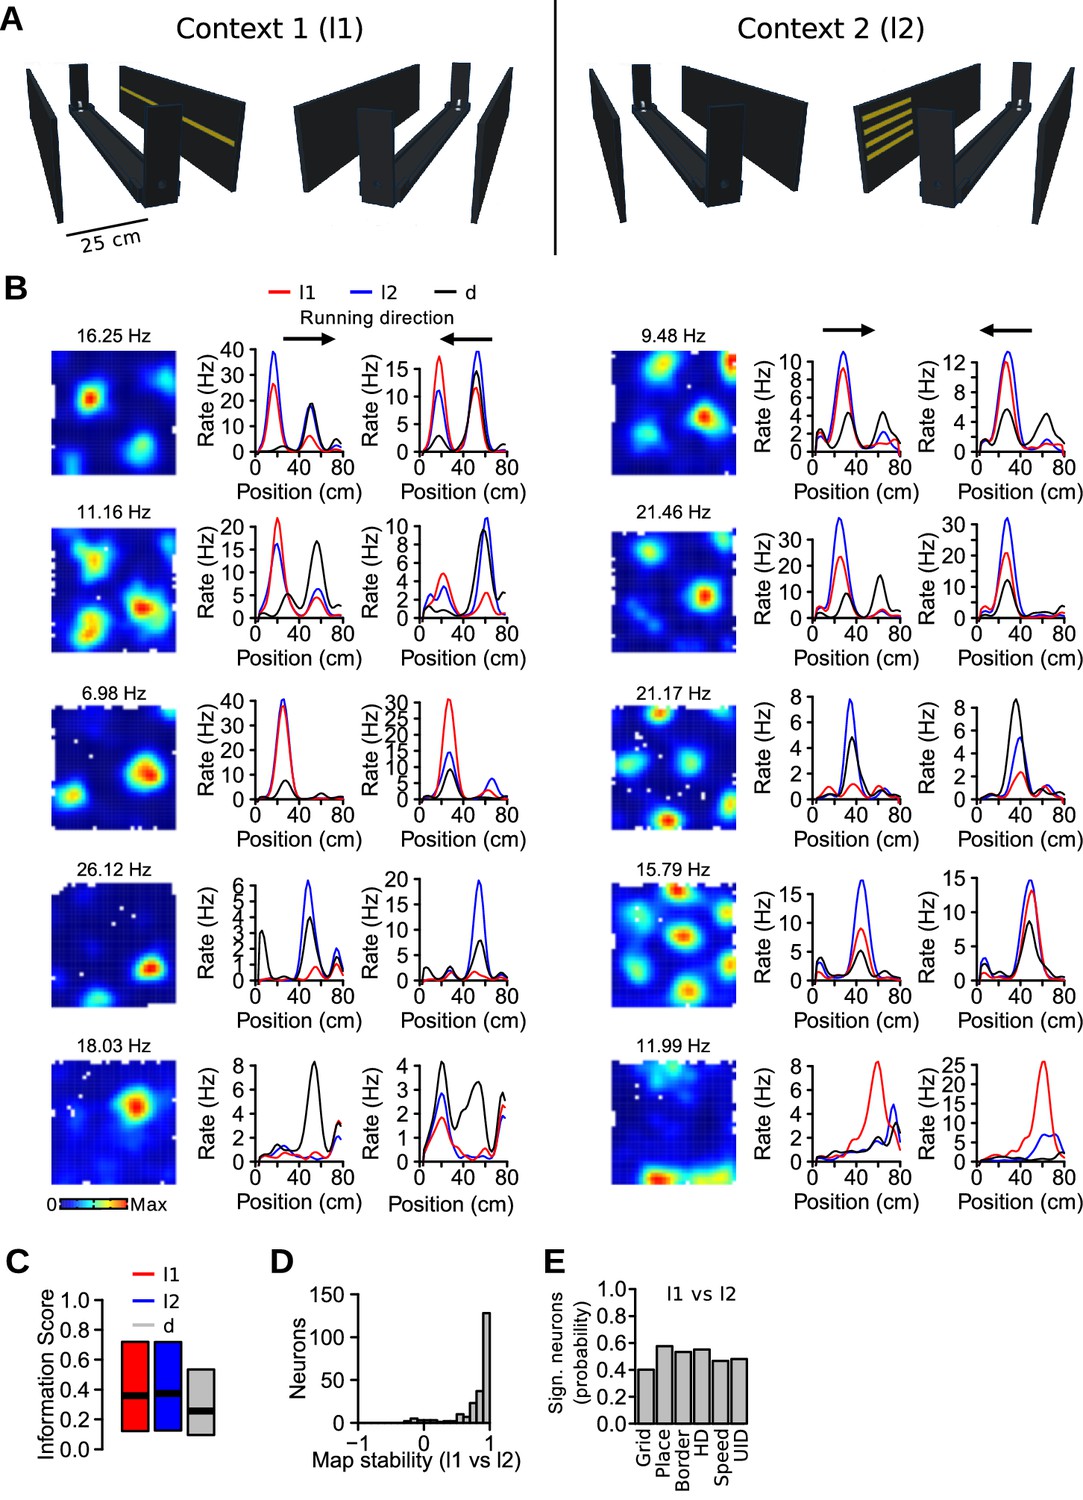
Nonmetric contextual visual cues affect firing rates of MEC neurons in a 1D environment.
(A) Schematic of the linear track and side walls. The linear track was flanked by two side walls on which LED arrays were attached. In the first context (l1, left), a single row of LEDs on one wall was turned on. In the other context (l2, right), 4 shorter rows of LEDs on the opposite wall were turned on. All LEDs were turned off during dark (d) trials. (B) Example of neurons with firing rate changes between the different conditions. First column, firing rate maps in the square open field. Next two columns, linear firing rate maps for the 3 conditions, plotted separately for each running direction. Note that the range of the y-axes varies. (C) Spatial information scores (median, first and third quartiles) in the 3 conditions. (D) Stability of linear firing rate maps (correlation coefficient) between l1 and l2 conditions. (E) Proportion of neurons with a significant rate change between l1 and l2 across functionally defined cell types (Grid: grid cells, Place: irregular spatially selective cells, Border: border cells, HD: head-direction cells, Speed: speed-modulated cells, UID: unidentified cells).
-
Figure 8—source data 1
Histological results of the mice recorded on the linear track.
Each page of the document shows the brain sections with tetrode tracks of one hemisphere. Arrows point to the tetrode tracks and asterisks indicate the tetrode tips. Different colors were assigned to different tetrodes.
- https://doi.org/10.7554/eLife.16937.014
-
Figure 8—source data 2
Location of the tetrode tips in each hemisphere for recordings done on the linear track.
* One tetrode tip was located in the postsubiculum.
- https://doi.org/10.7554/eLife.16937.015
Download links
A two-part list of links to download the article, or parts of the article, in various formats.
Downloads (link to download the article as PDF)
Open citations (links to open the citations from this article in various online reference manager services)
Cite this article (links to download the citations from this article in formats compatible with various reference manager tools)
Visual landmarks sharpen grid cell metric and confer context specificity to neurons of the medial entorhinal cortex
eLife 5:e16937.
https://doi.org/10.7554/eLife.16937


