Arabidopsis FORGETTER1 mediates stress-induced chromatin memory through nucleosome remodeling
- University of Potsdam, Germany
- Max-Planck-Institute for Molecular Plant Physiology, Germany
Figures
Figure 1 with 3 supplements
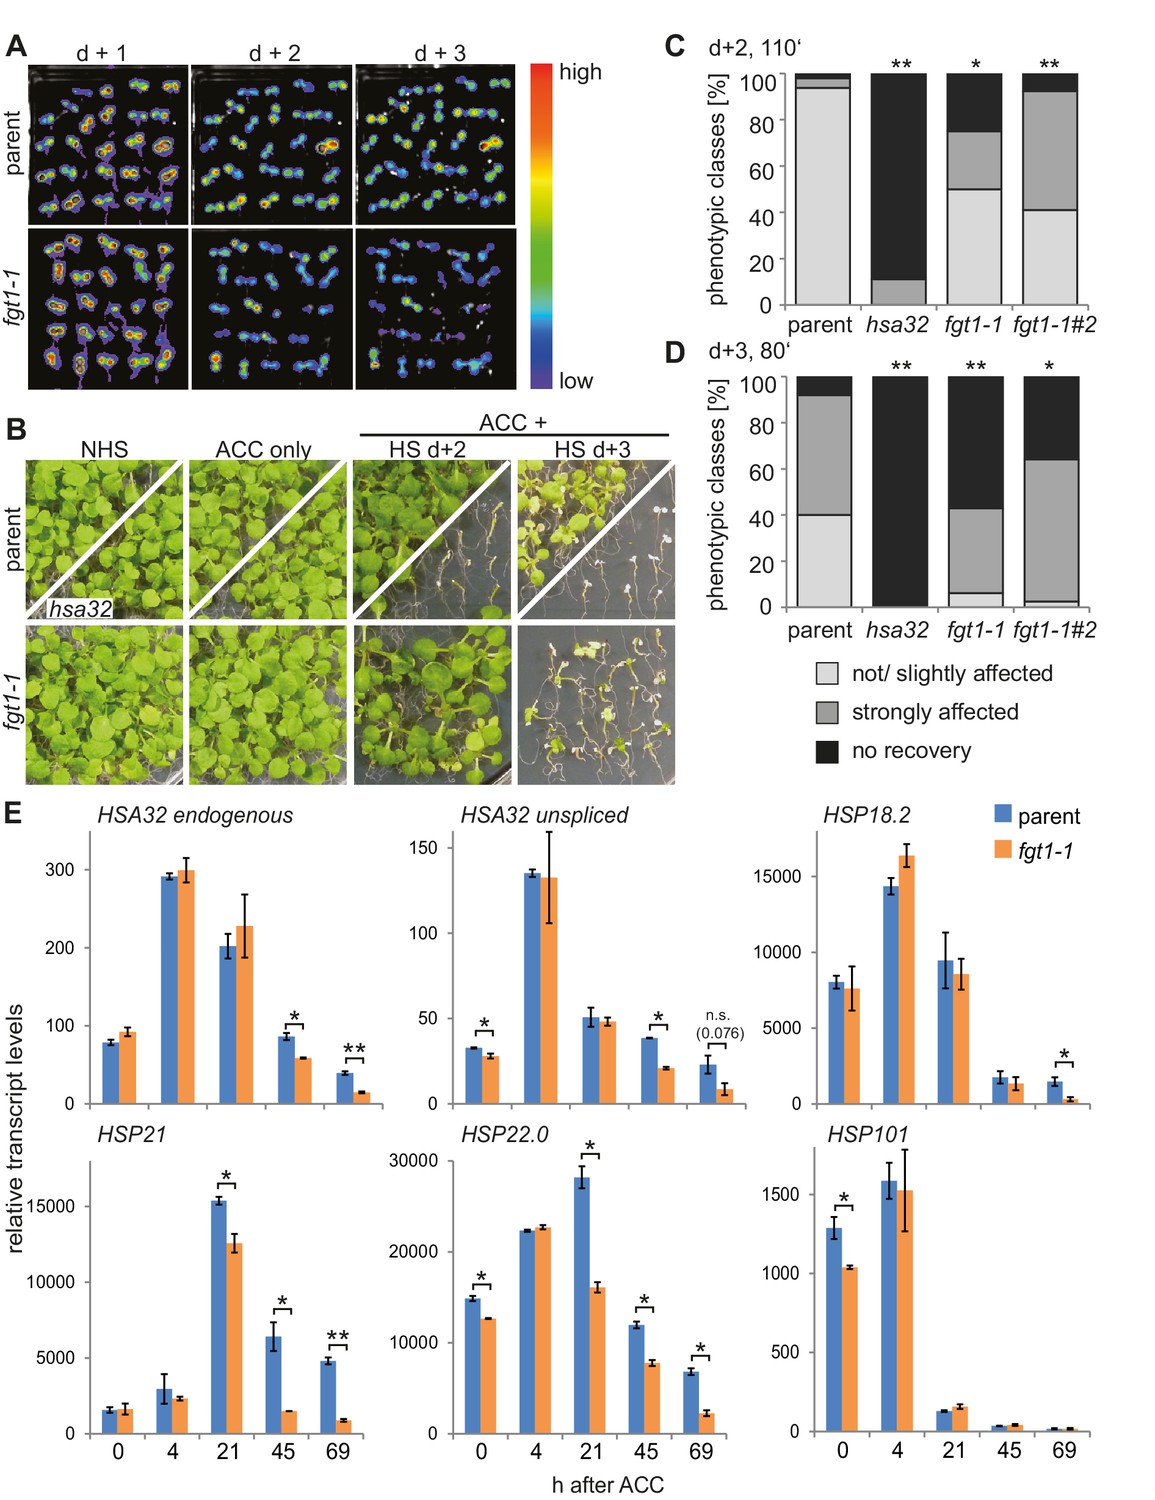
FGT1 is required for HS memory and sustained induction of memory genes in A. thaliana.
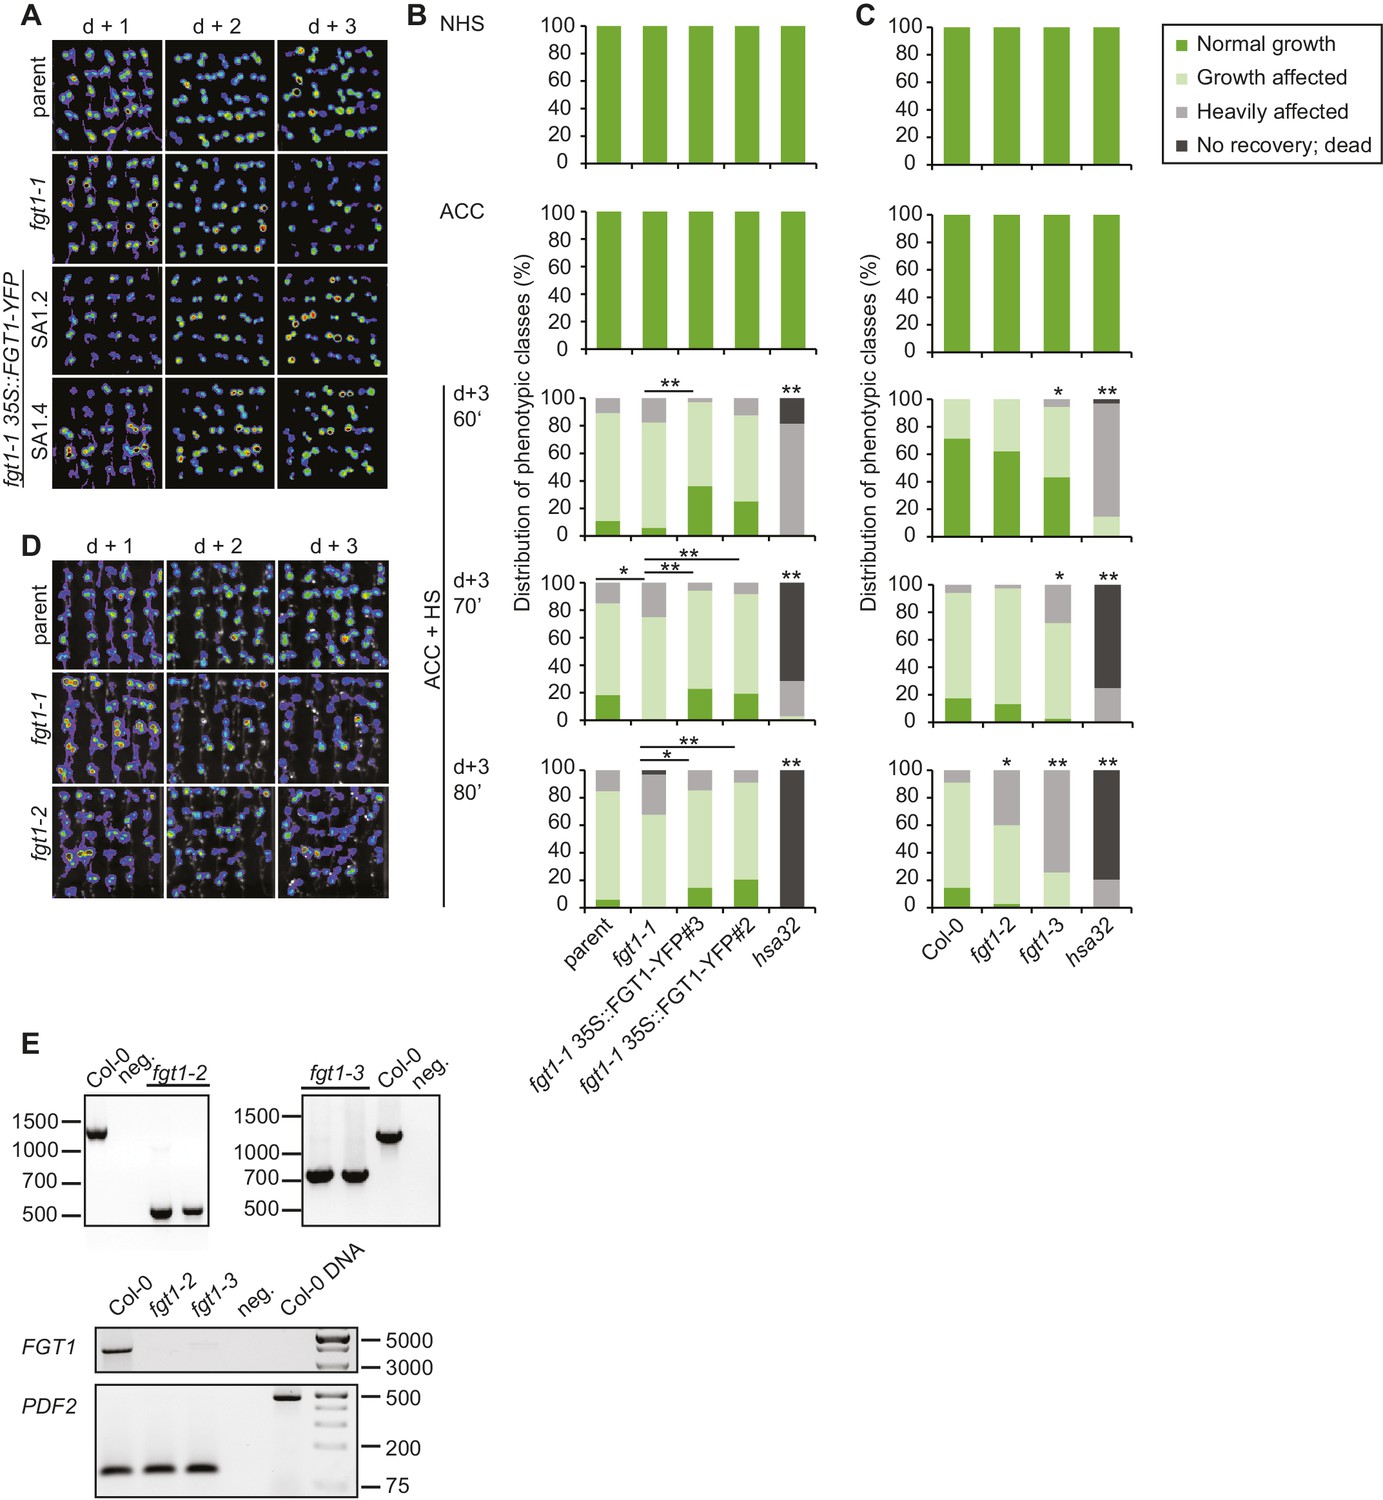
(A) fgt1-1 displays normal induction but reduced maintenance of pHSA32::HSA32-LUC expression. Bioluminescence of fgt1-1 or the parent assayed 1, 2, or 3 d after an acclimatizing HS (ACC). The color scale of relative LUC activity is shown. (B) fgt1-1 is impaired in HS memory at the physiological level. Seedlings of the indicated genotypes (cf. fgt1-1#2 in C–D) were acclimatized 4 d after germination and treated with a tester HS 2 or 3 d later. Pictures were taken after 14 d of recovery. (C–D) Quantification of the data shown in (B). The fgt1-1 lines represent independent backcrosses. Data are averaged over at least two independent assays (n>36). Fisher’s exact test, *p<0.05; **p<0.001. (E) Transcript levels of HS memory genes after ACC decline prematurely in fgt1-1. Expression values were normalized to the reference At4g26410 and the corresponding no-HS control (NHS). Data are averages and SE of two biological replicates. *p<0.05; **p<0.01 (Student’s t test).
Figure 1—figure supplement 1
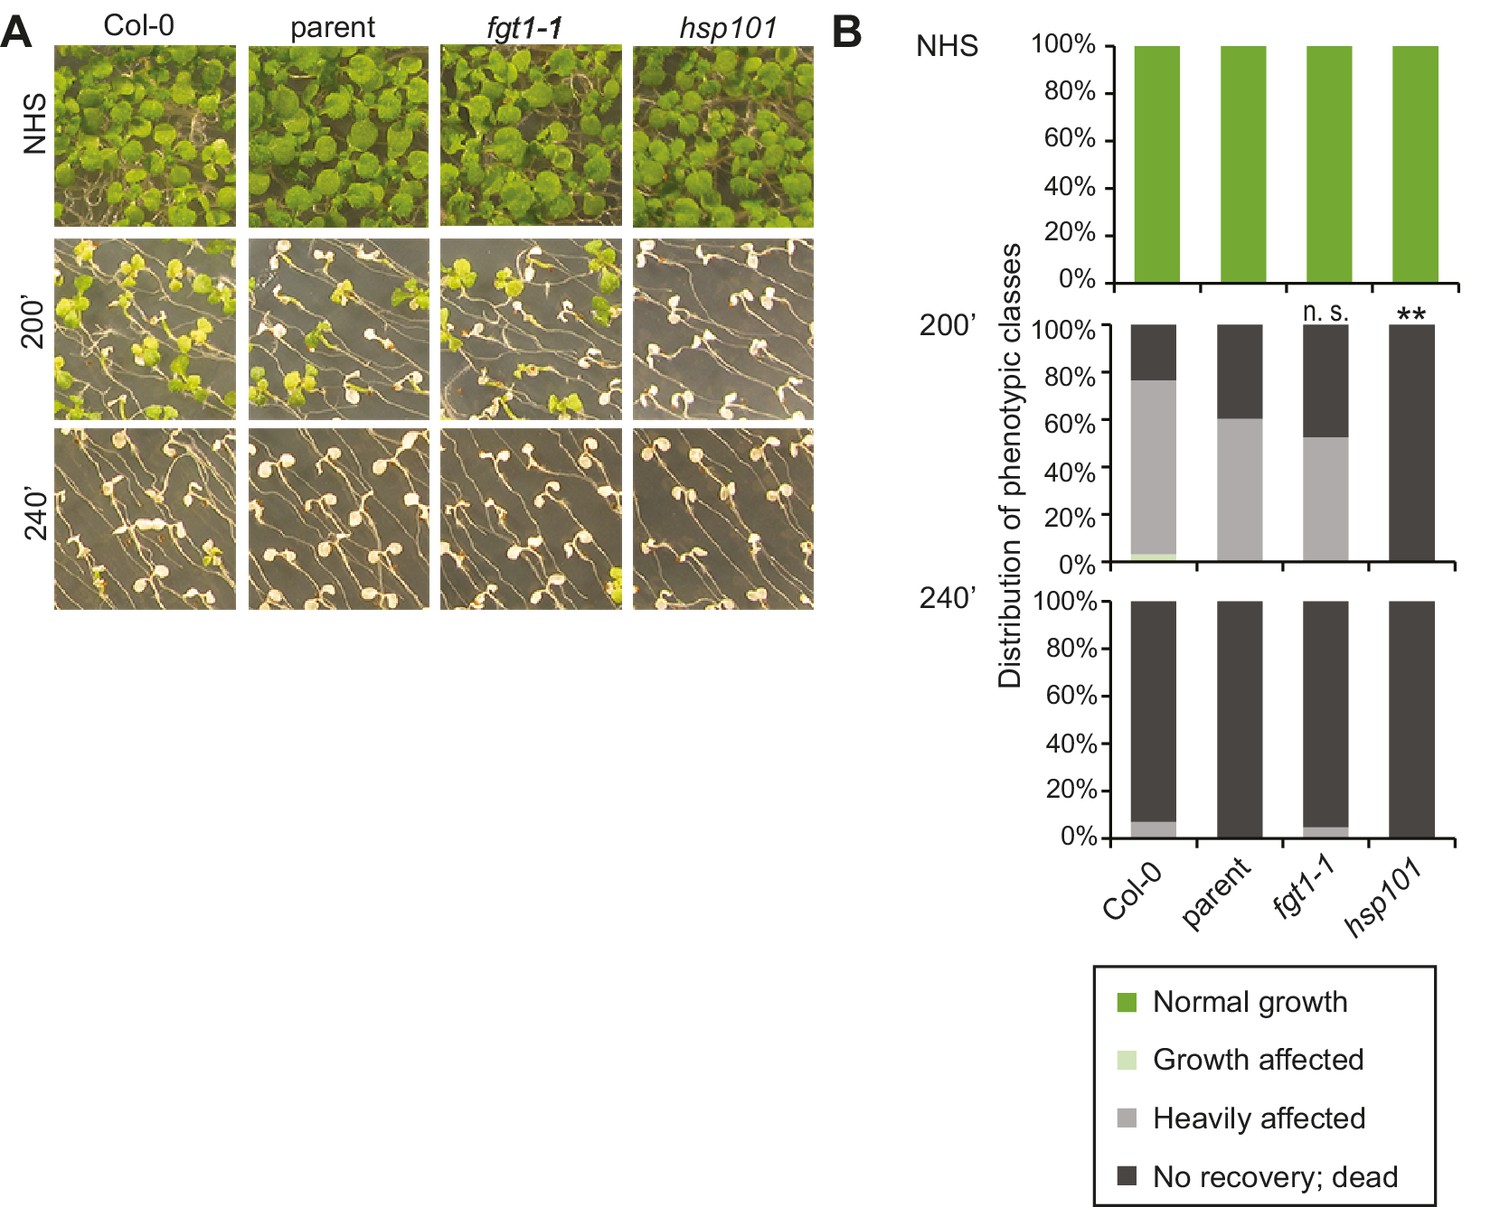
fgt1-1 is not affected in the acquisition of thermotolerance.
(A) Acquisition of thermotolerance in Col-0, parent, fgt1-1 and the HS response-deficient hsp101 was assayed by treating 5 d-old seedlings at 37°C for 60 min, recovery for 90 min at 22°C, followed by 44°C for the indicated times. Pictures were taken 13 d after heat treatments. All plants of one treatment were grown on the same plate. One representative of at least three biological replicates is shown. (B) Quantification of the data shown in (A). Seedlings were categorized 13 d after heat treatments. Fisher’s exact test, **p<0.001; n>30.
Figure 1—figure supplement 2

fgt1-1 has normal basal thermotolerance.
Basal thermotolerance in parent, fgt1-1, and hsp101 was assayed by incubating 4 d-old seedlings for the indicated times at 44°C. Pictures were taken 14 d after HS. All plants of one treatment were grown on the same plate. One representative of at least three biological replicates is shown.
Figure 1—figure supplement 3
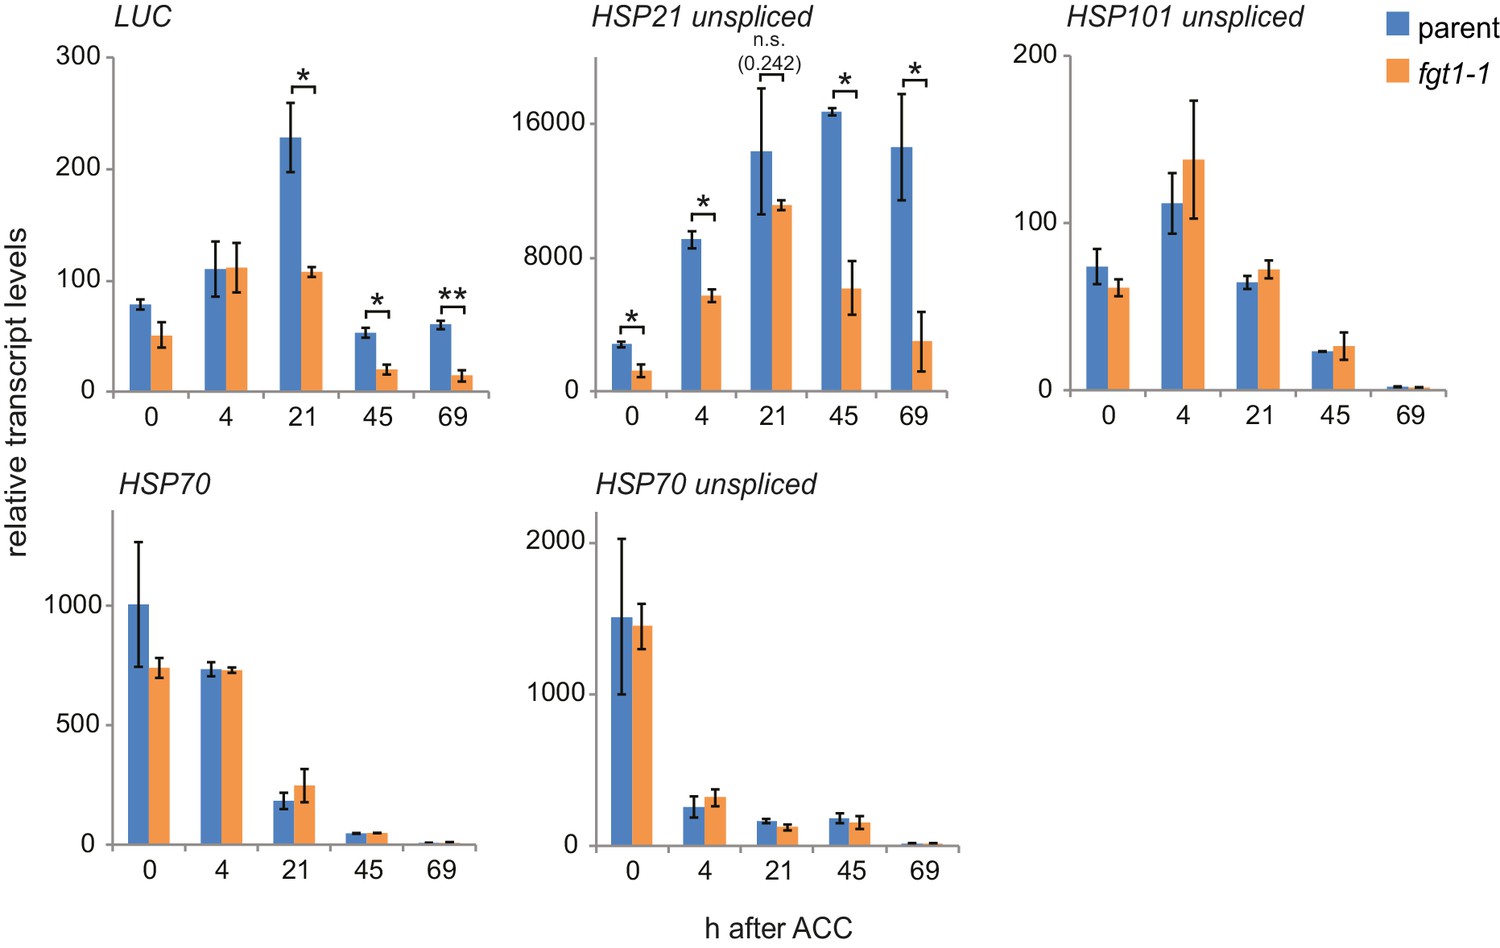
Additional qRT-PCR analyses of HS genes.
Transcript levels of the indicated genes (unspliced where indicated) were determined by qRT-PCR. Expression values were normalized to the reference At4g26410 and the corresponding no-HS control (NHS). Data are averages and SE of two biological replicates. *p<0.05; **p<0.01 (Student’s t test).
Figure 2 with 3 supplements
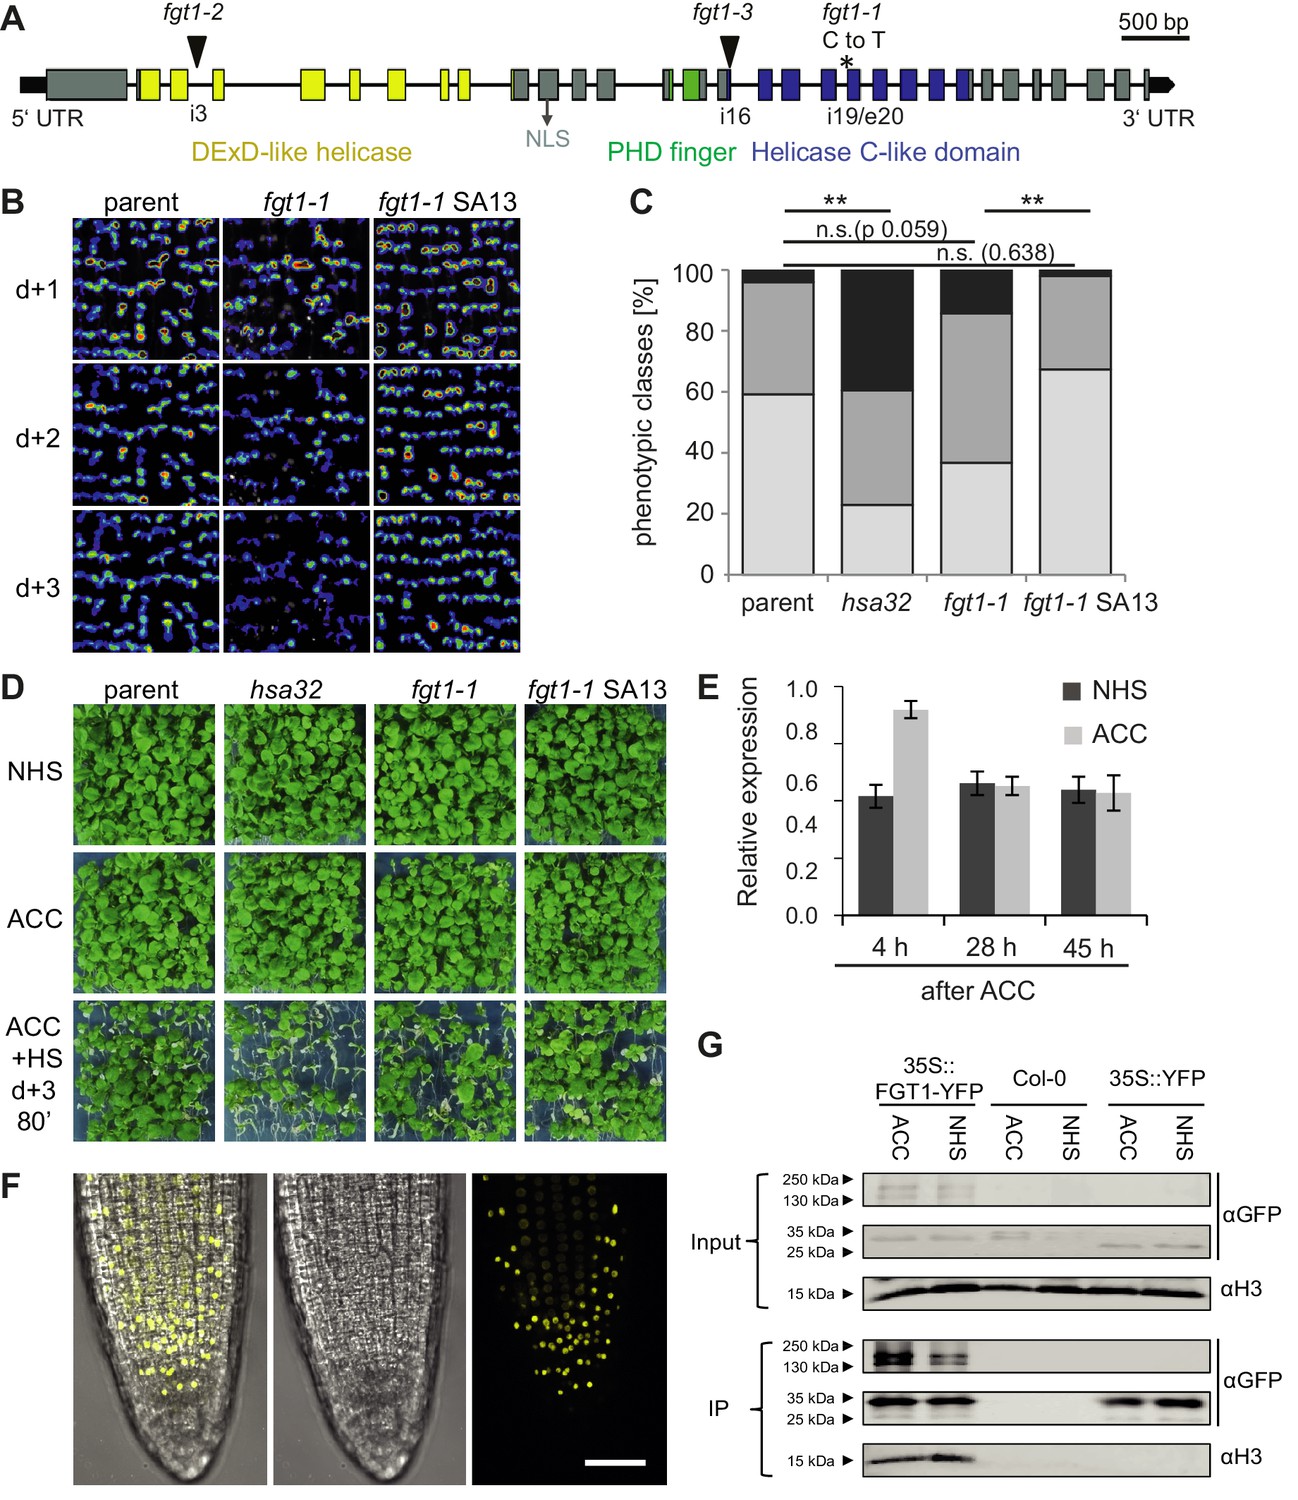
FGT1 encodes the A. thaliana orthologue of Drosophila Sno and binds histones.
(A) Gene model of FGT1 (At1g79350) with domains and location of mutations; exons (grey and colored bars); black line, intron. fgt1-1 has a C to T mutation at the splice acceptor site of intron 19/exon 20. (B–D) Complementation of fgt1-1 by a genomic FGT1 fragment (SA13). (B) pHSA32::HSA32-LUC-derived bioluminescence of indicated genotypes assayed 1, 2, or 3 d after ACC. (C,D) Seedlings of the indicated genotypes were acclimatized 5 d after germination and received a tester HS 3 d later. (C) Quantification; n = 48–49, Fisher’s exact test, **p<0.01. (D) Representative picture taken after 14 d recovery. (E) FGT1 transcript levels increase transiently after ACC. Relative FGT1 transcript levels were determined by qRT-PCR and normalized to At4g26410. Errors are SE of two biological replicates. (F) FGT1 is localized to the nucleus in 3 d-old seedling roots. 35S::FGT1-YFP transgenic seedlings were imaged for YFP fluorescence. Left, overlay; middle, bright field; right, YFP fluorescence. Scale bar, 40 µm. (G) FGT1 binds histone H3 in vivo. Nuclear protein extracts of transgenic 35S::FGT1-YFP, 35S::YFP and non-transgenic Col-0 seedlings harvested 28 h after the indicated treatments were immuno-precipitated with anti-GFP antibody. Co-purification of histone H3 was assessed by immunoblotting.
Figure 2—figure supplement 1
Complementation of the fgt1-1 mutant phenotype during HS memory.
(A) pHSA32::HSA32-LUC-derived bioluminescence of the parent, fgt1-1, fgt1-1 35S::FGT1-YFP (two independent transgenic lines) was assayed 1, 2, or 3 d after an acclimatizing HS (ACC). Blue indicates low LUC activity, red indicates high activity (cf. Figure 1A). The signal threshold was adjusted to the signal of the parental line. (B) Complementation of the fgt1-1 mutant by 35S::FGT1-YFP at the physiological level. 5 d-old seedlings of the indicated genotypes were acclimatized and received a tester HS of the indicated length 3 d later. Seedlings were categorized after 10 d recovery at normal growth temperatures. Asterisks indicate (Fisher’s exact test) *p<0.05; **p <0.01; n. s., not significant; n = 32–38. (C) fgt1-2 and fgt1-3 display reduced HS memory at the physiological level. The assay was performed as described in (B). (D) fgt1-2 displays reduced pHSA32::HSA32-LUC-derived bioluminescence after ACC. The assay was performed as described in (A). (E) Characterization of fgt1-2 and fgt1-3 mutants. Top panel: Genotyping using 3-primer PCR confirms mutants are homozygous for the T-DNA insertion. Bottom panel: FGT1 expression as determined by semi-quantitative RT-PCR in the indicated genotypes.
Figure 2—figure supplement 2
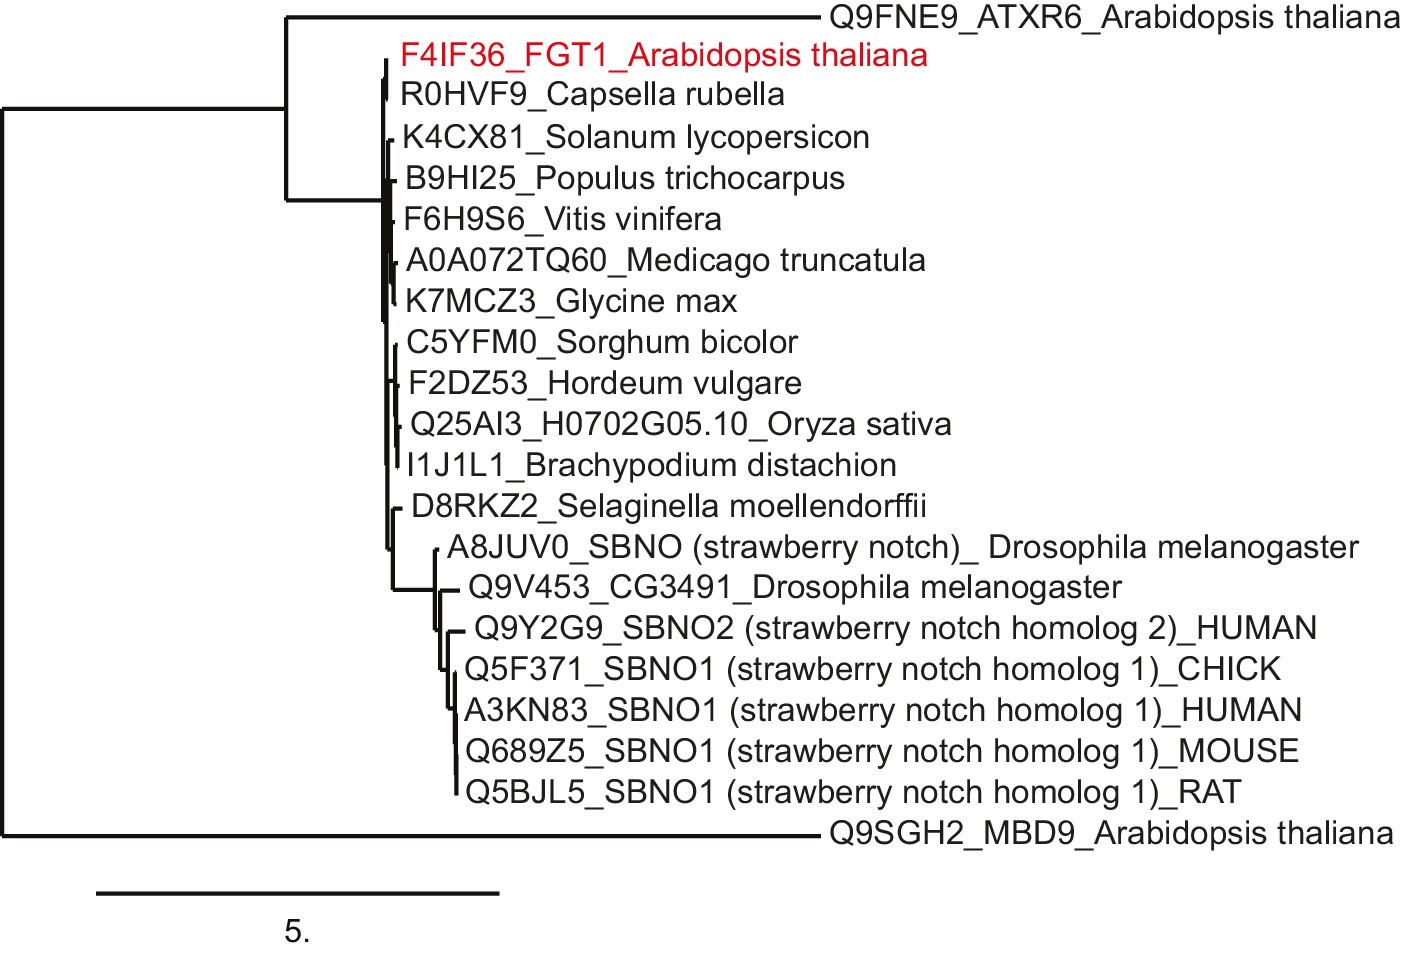
FGT1 is highly conserved and encodes the SNO/SBNO orthologue of A. thaliana.
Phylogenetic tree generated using the www.phylogeny.fr website with the preset 'one-click' settings. Sno/SBNO/FGT1 sequences were identified using BLAST searches with the full-length FGT1 protein. A. thaliana MDB9 and ATXR6 were used as outgroups as they displayed the highest hits from A. thaliana in a BLAST against full-length FGT1.
Figure 2—figure supplement 3
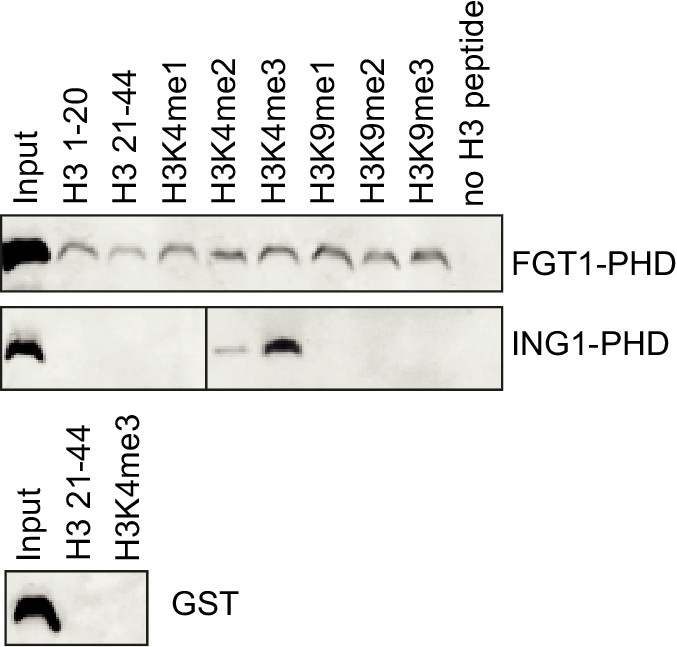
The PHD domain of FGT1 binds to histone H3 in vitro.
Recombinant FGT1PHD-GST was immunoprecipitated with Flag-tagged histone peptides and detected by anti-GST immunoblotting. ING1PHD-GST and GST were used as controls.
Figure 3 with 1 supplement
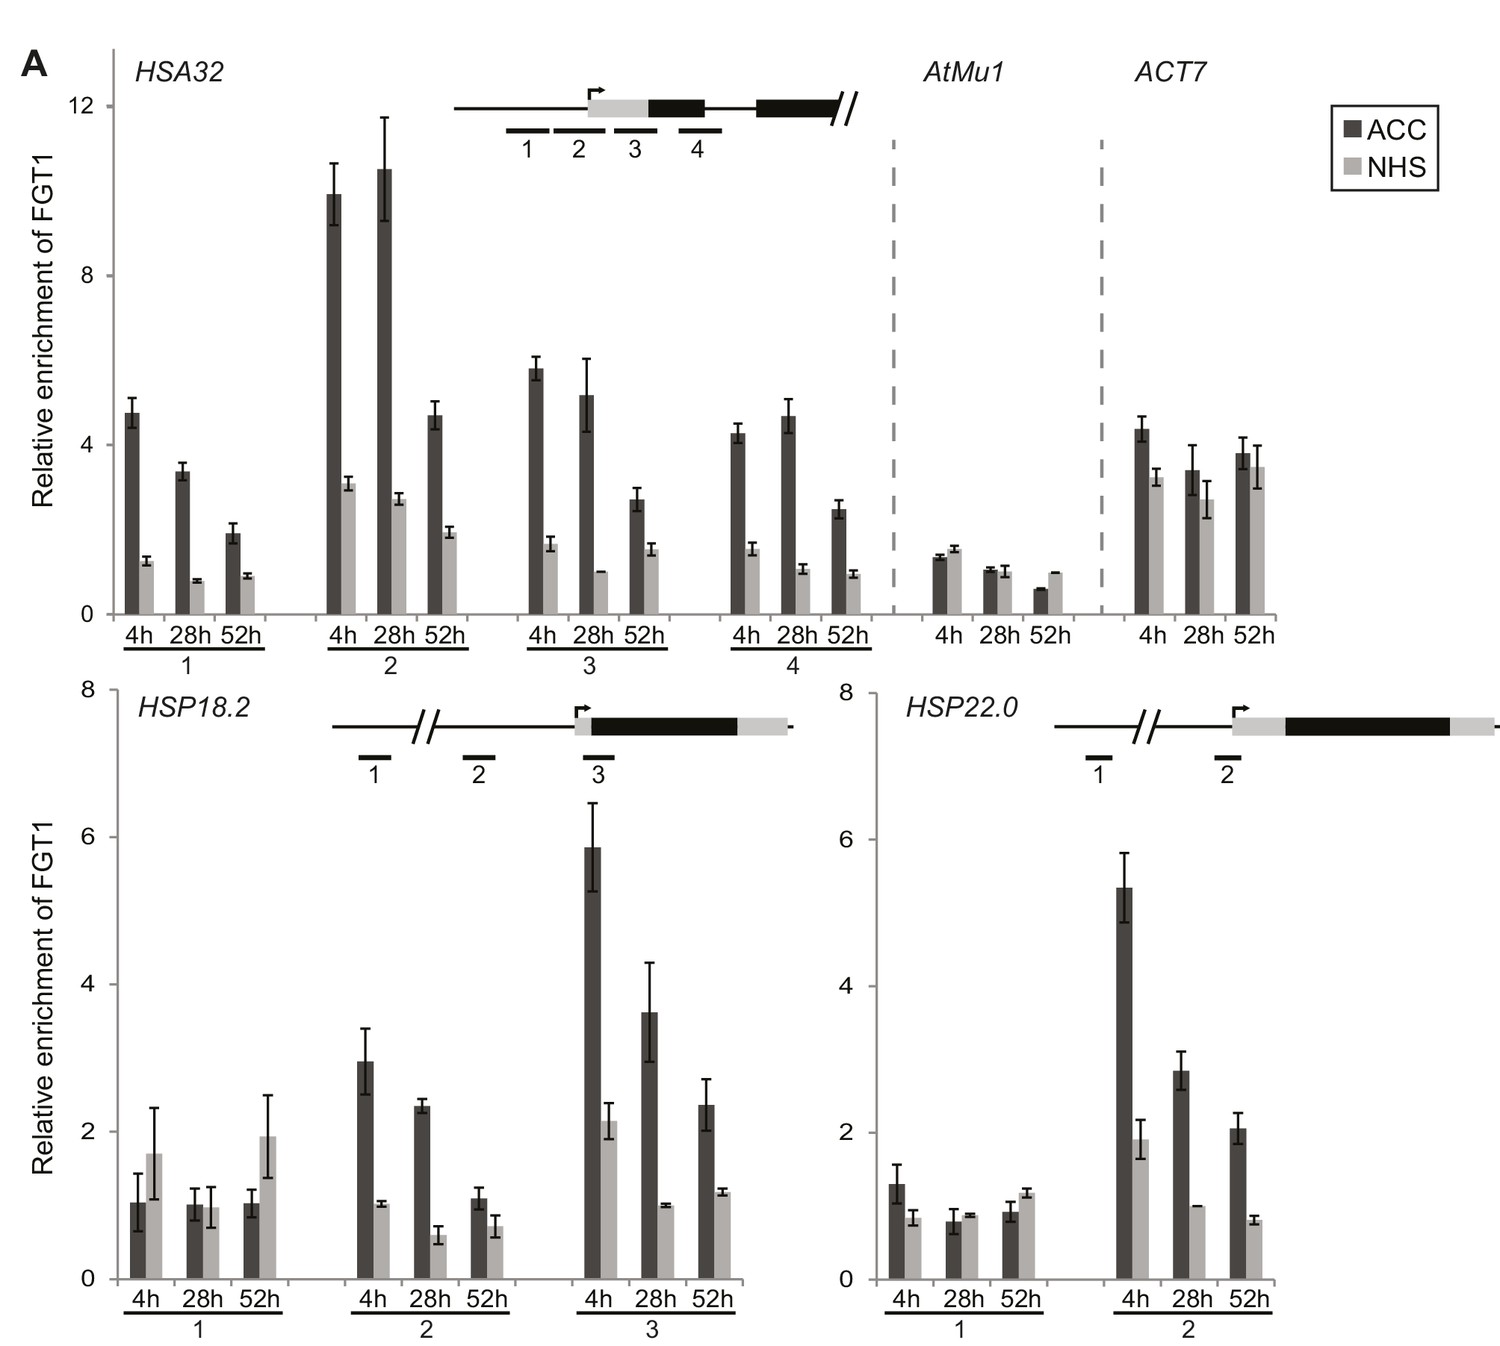
FGT1 binds memory-associated genes in a HS-dependent manner.
FGT1 binds to HSA32, HSP18.2 and HSP22.0. ChIP-qPCR on 35S::FGT1-YFP seedlings was performed 4, 28 or 52 h after an acclimatizing HS (ACC) or no HS (NHS). As controls, the active gene ACT7 or the inactive transposon AtMu1 were used. Schematics show regions analyzed relative to TSS. HSA32 1–4: −175, −75, +57, +194 bp. HSP18.2 1–3: −1068, −367, +32 bp. HSP22.0 1–2: −3000, −60 bp; ACT7: +55 bp. AtMu1: -175 bp relative to ATG. Amplification values were normalized to input and region 2HSA32 at 28 h NHS (HSA32, AtMu1 and ACT7), region 2HSP18.2 at 28 h NHS or region 3HSP22.0 at 28 h NHS, respectively. Data are averages of at least three biological replicates. Error bars indicate SE.
Figure 3—figure supplement 1
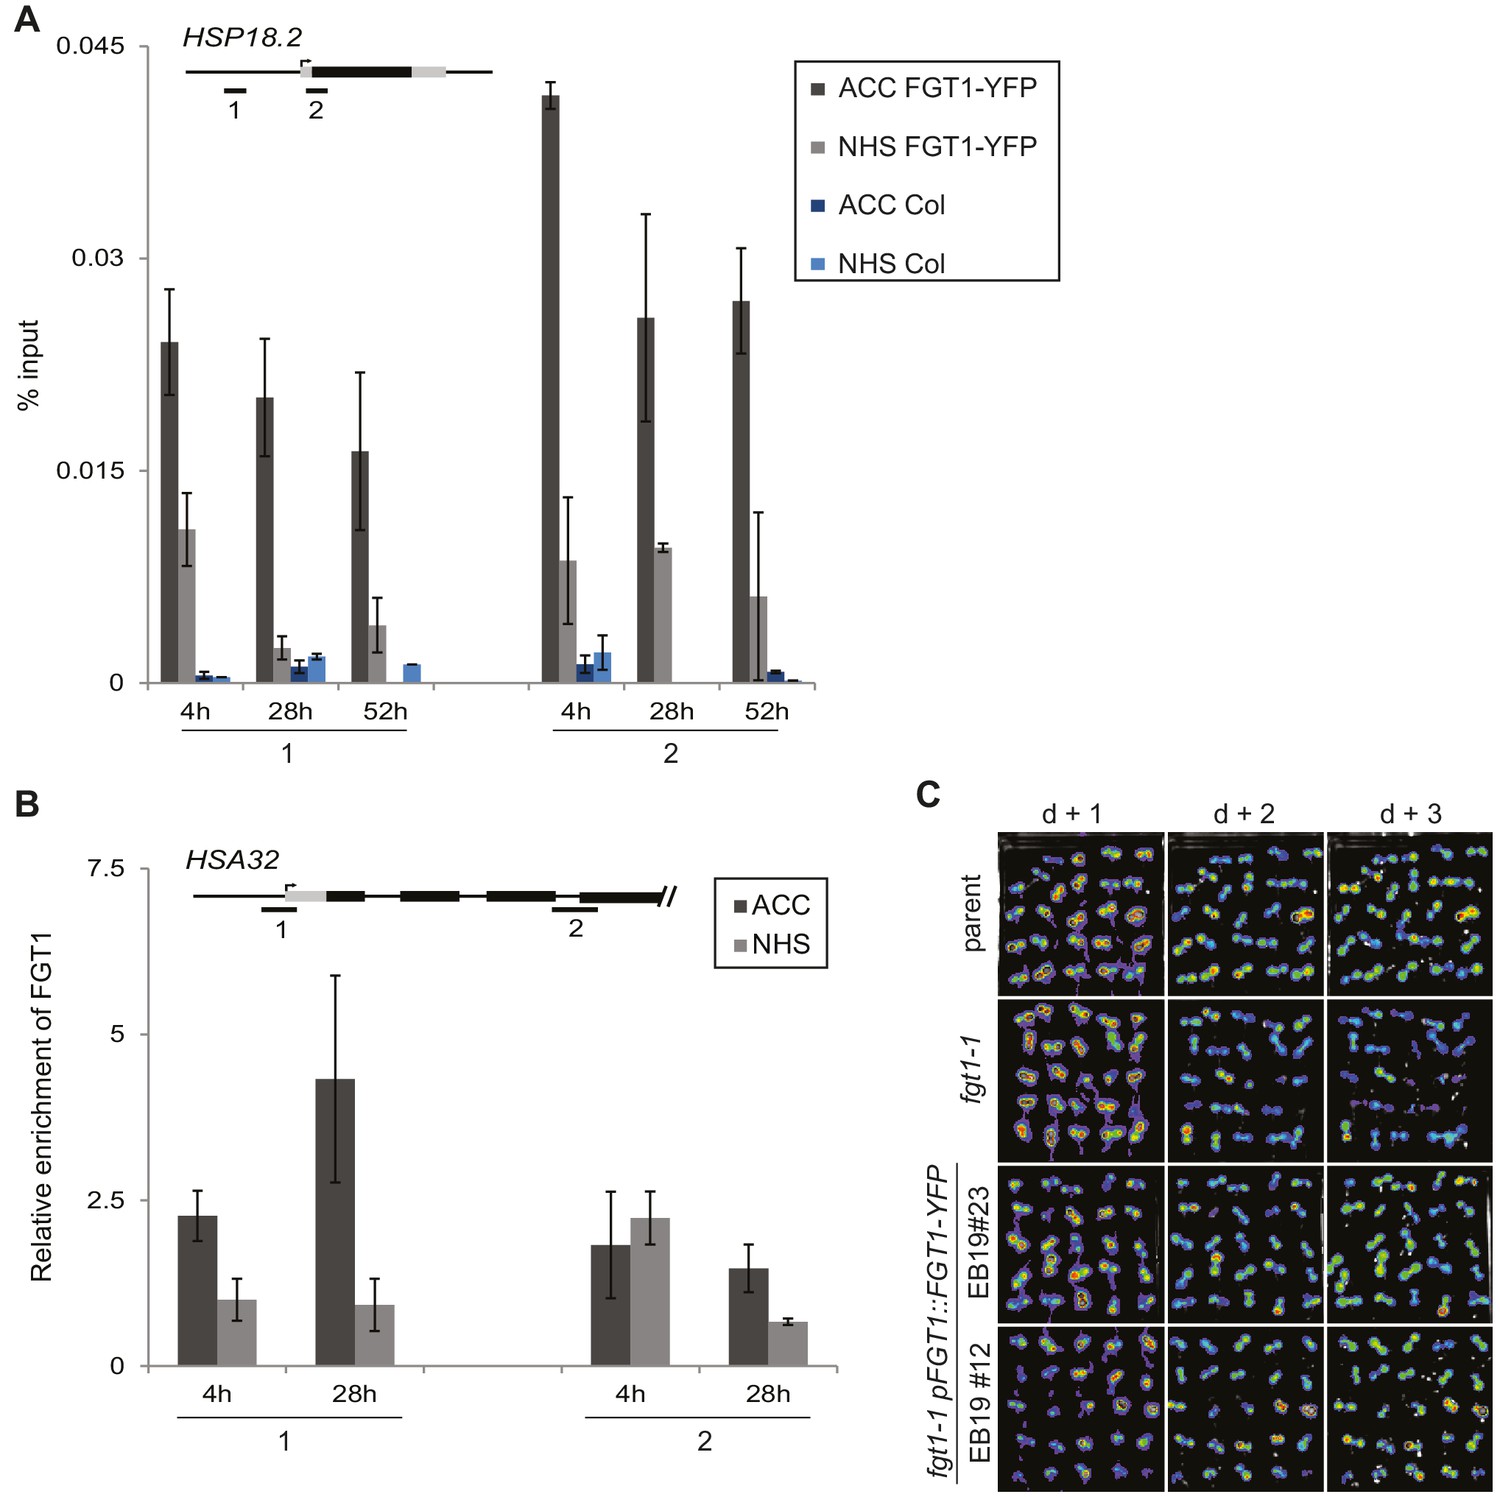
FGT1-YFP expressed from the endogenous promoter binds to HSA32.
(A) FGT1-YFP derived from 35S::FGT1-YFP binds the HSP18.2 locus already before HS as determined by ChIP-qPCR on 35S::FGT1-YFP or Col-0 seedlings. 4 d-old seedlings were subjected to an acclimatizing HS (ACC), or no HS (NHS). ChIP-qPCR was performed at the indicated times after the treatments. Schematic shows positions of regions analyzed. Data show one representative experiment. Error bars are SD of three technical replicates. (B) FGT1-YFP expressed from the FGT1 promoter binds to HSA32 as determined by ChIP-qPCR. FGT1 enrichment around the TSS of HSA32 (region 1) increases after ACC and remains elevated for at least 28 h. Amplification values were normalized to input and the region 2 at 28 h NHS. Error bars are SE of two biological replicates. (C) The pFGT1::FGT1-YFP transgene complements the HSA32-LUC phenotype of fgt1-1. HSA32::LUC-derived bioluminescence of the indicated genotypes was assayed 1, 2, or 3 d after an acclimatizing HS. Blue indicates low LUC activity, red indicates high activity (cf. Figure 1A). The signal threshold was adjusted to the signal of the parental line.
Figure 4 with 1 supplement
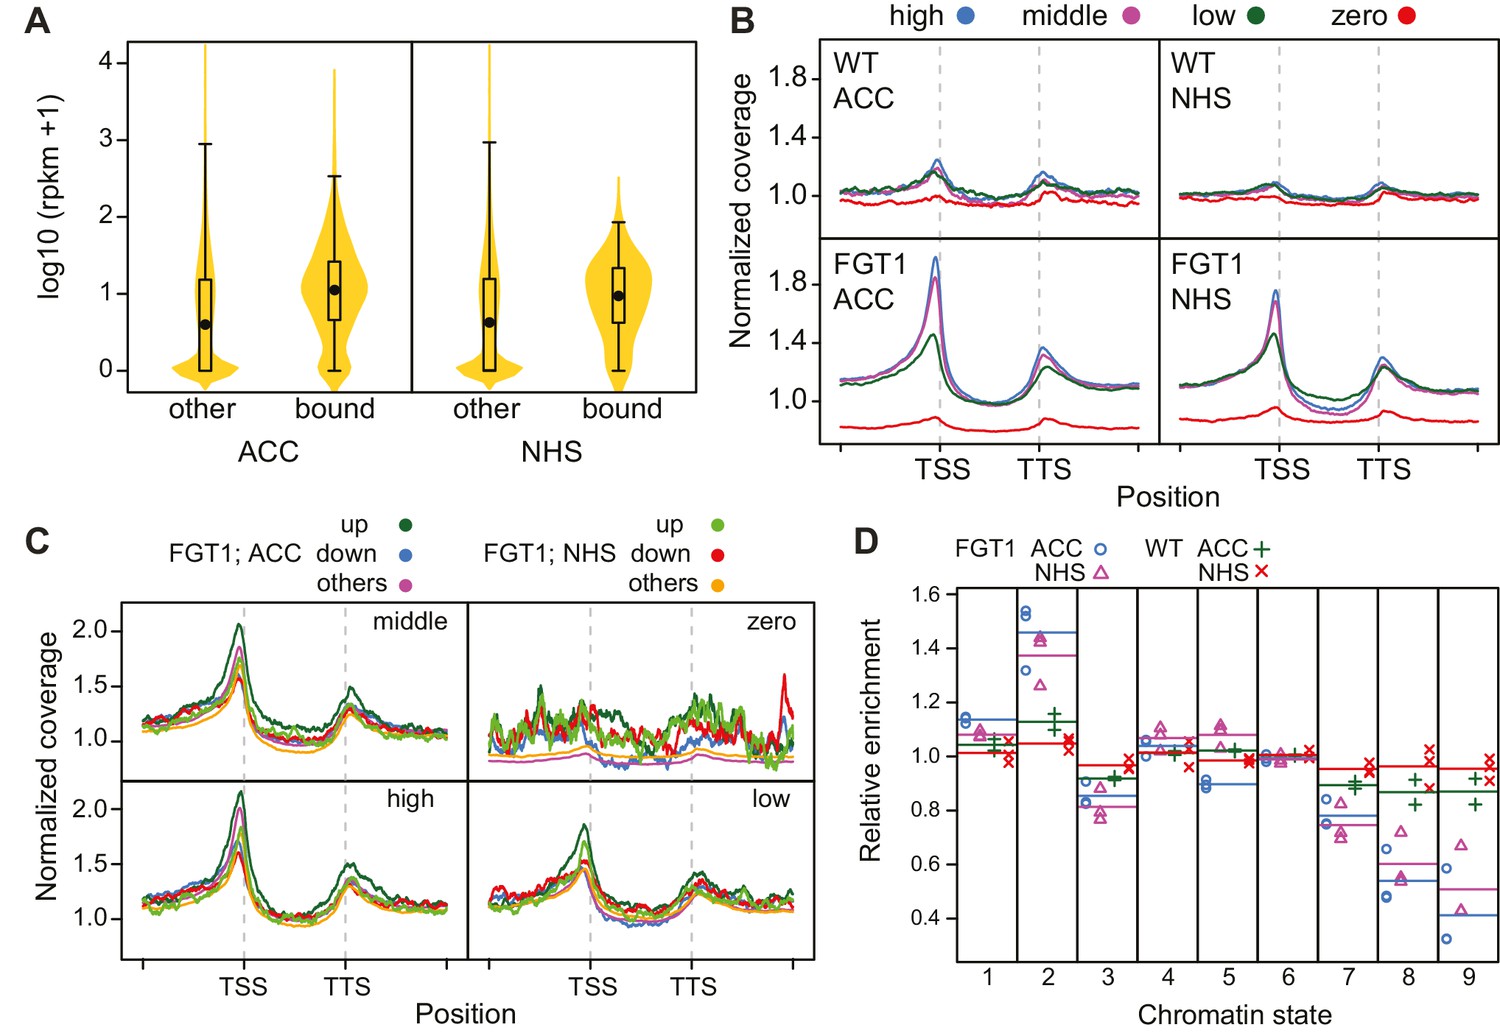
FGT1 globally binds expressed genes upstream of the TSS.
(A) FGT1-associated genes (ChIP-seq peaks) are more highly expressed than other genes. Violin plot indicates expression levels of FGT1-bound genes compared to all other genes (Figure 4—figure supplement 1). Expression data were taken from (Gan et al., 2011). (B) Normalized global read coverages of ACC or NHS FGT1-YFP or wild-type control samples as determined by ChIP-seq. Genes were categorized into not expressed genes and equally sized groups of highly, moderately and lowly expressed genes (Gan et al., 2011). Coverage profiles include 2 kb up- and downstream of the TSS and TTS, respectively. Genic regions were normalized to a standard length. (C) Normalized read coverages of HS-responsive genes from ACC or NHS FGT1-YFP. The panels show global analysis of genes in the respective expression class (cf. B) according to their expression pattern 4 h after ACC (Stief et al., 2014) in wild type (up, down, others). (D) FGT1 is enriched in chromatin state 2 (Sequeira-Mendes et al., 2014). Relative enrichment of FGT1-bound sequences or WT control after ACC or NHS in different chromatin states indicated depletion of FGT1 in heterochromatin (states 8, 9) and enrichment in state 2 (promoter and intergenic regions, open chromatin). Lines denote average of replicates.
Figure 4—figure supplement 1

Coverage profiles of ChIP-seq peaks bound by FGT1 28 h after ACC or NHS.
Comparison of normalized coverage profiles of FGT1-bound peak genes identified by peak calling (942 genes for FGT1 ACC and 60 genes for FGT1 NHS) and all other genes in FGT1 ChIP-seq samples from ACC and NHS conditions. Coverage profiles were calculated 2 kb up- and downstream of the TSS and TTS, respectively. The length of the genic regions was normalized.
Figure 5
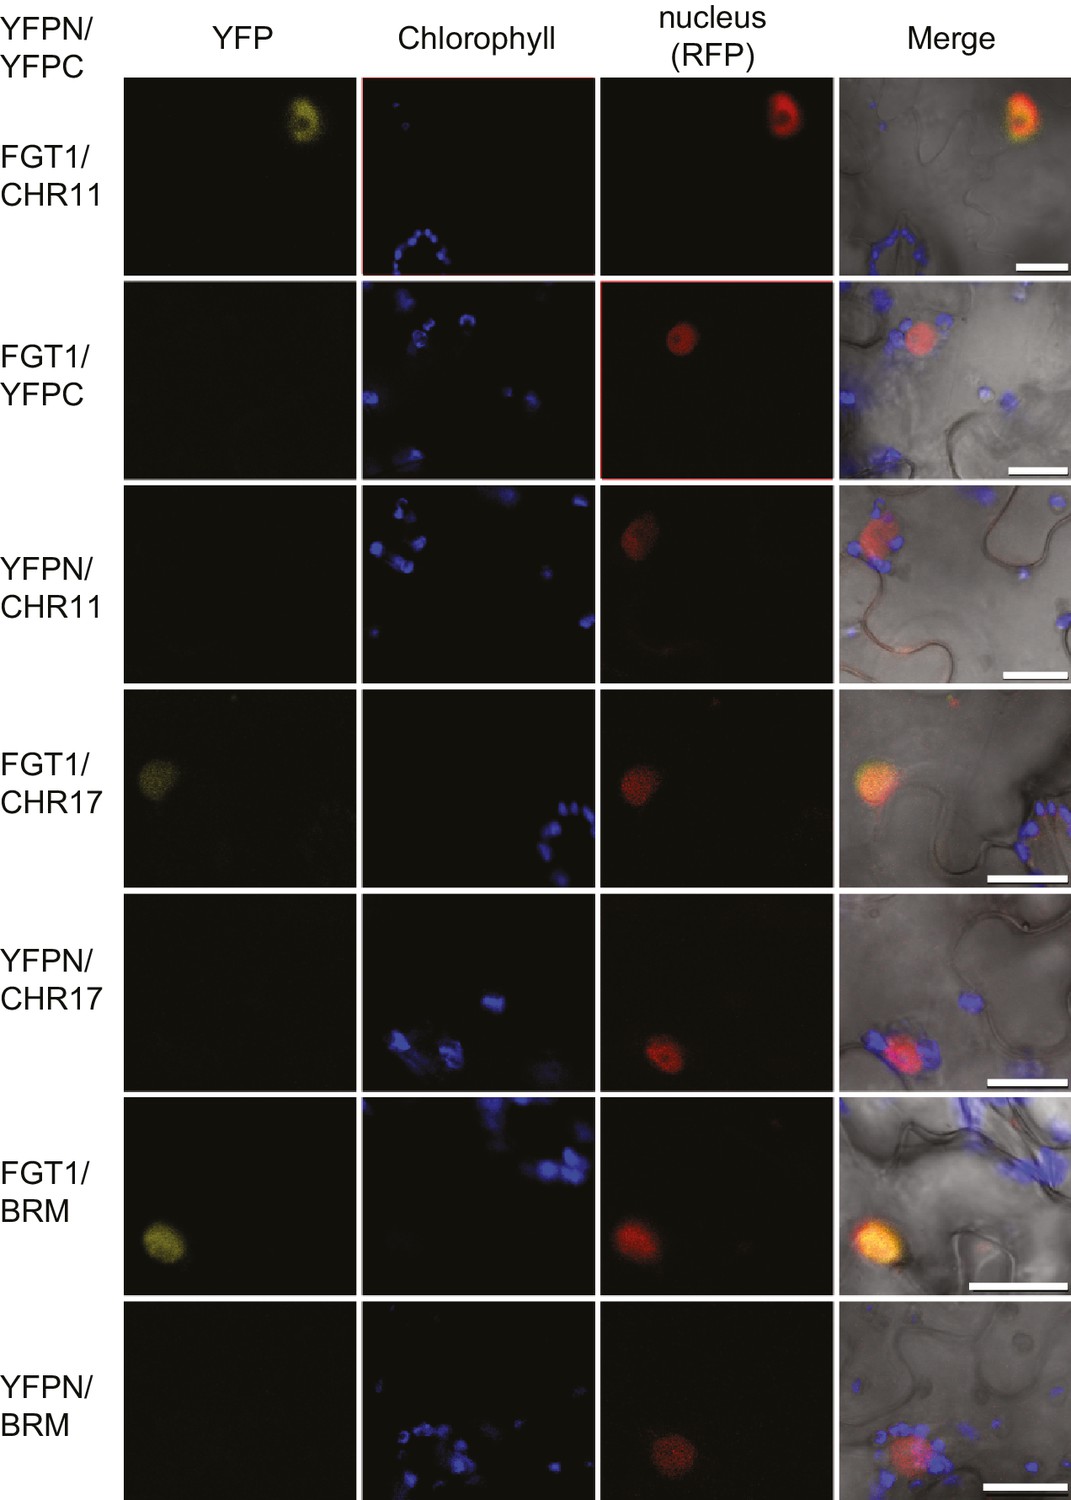
FGT1 interacts in vivo with SWI/SNF (BRM) and ISWI (CHR11, CHR17) chromatin remodeling proteins.
Bimolecular Fluorescence Complementation confirms the interaction of FGT1 and CHR11, CHR17 or BRM in the nucleus of tobacco leaf cells. The indicated constructs were co-transformed and analyzed 2 d later with an LSM710 confocal microscope. YFP, BiFC signal in the YFP spectrum; RFP, signal from co-expressed nuclear RFP-fusion protein. Size bar, 20 µm.
Figure 6 with 3 supplements
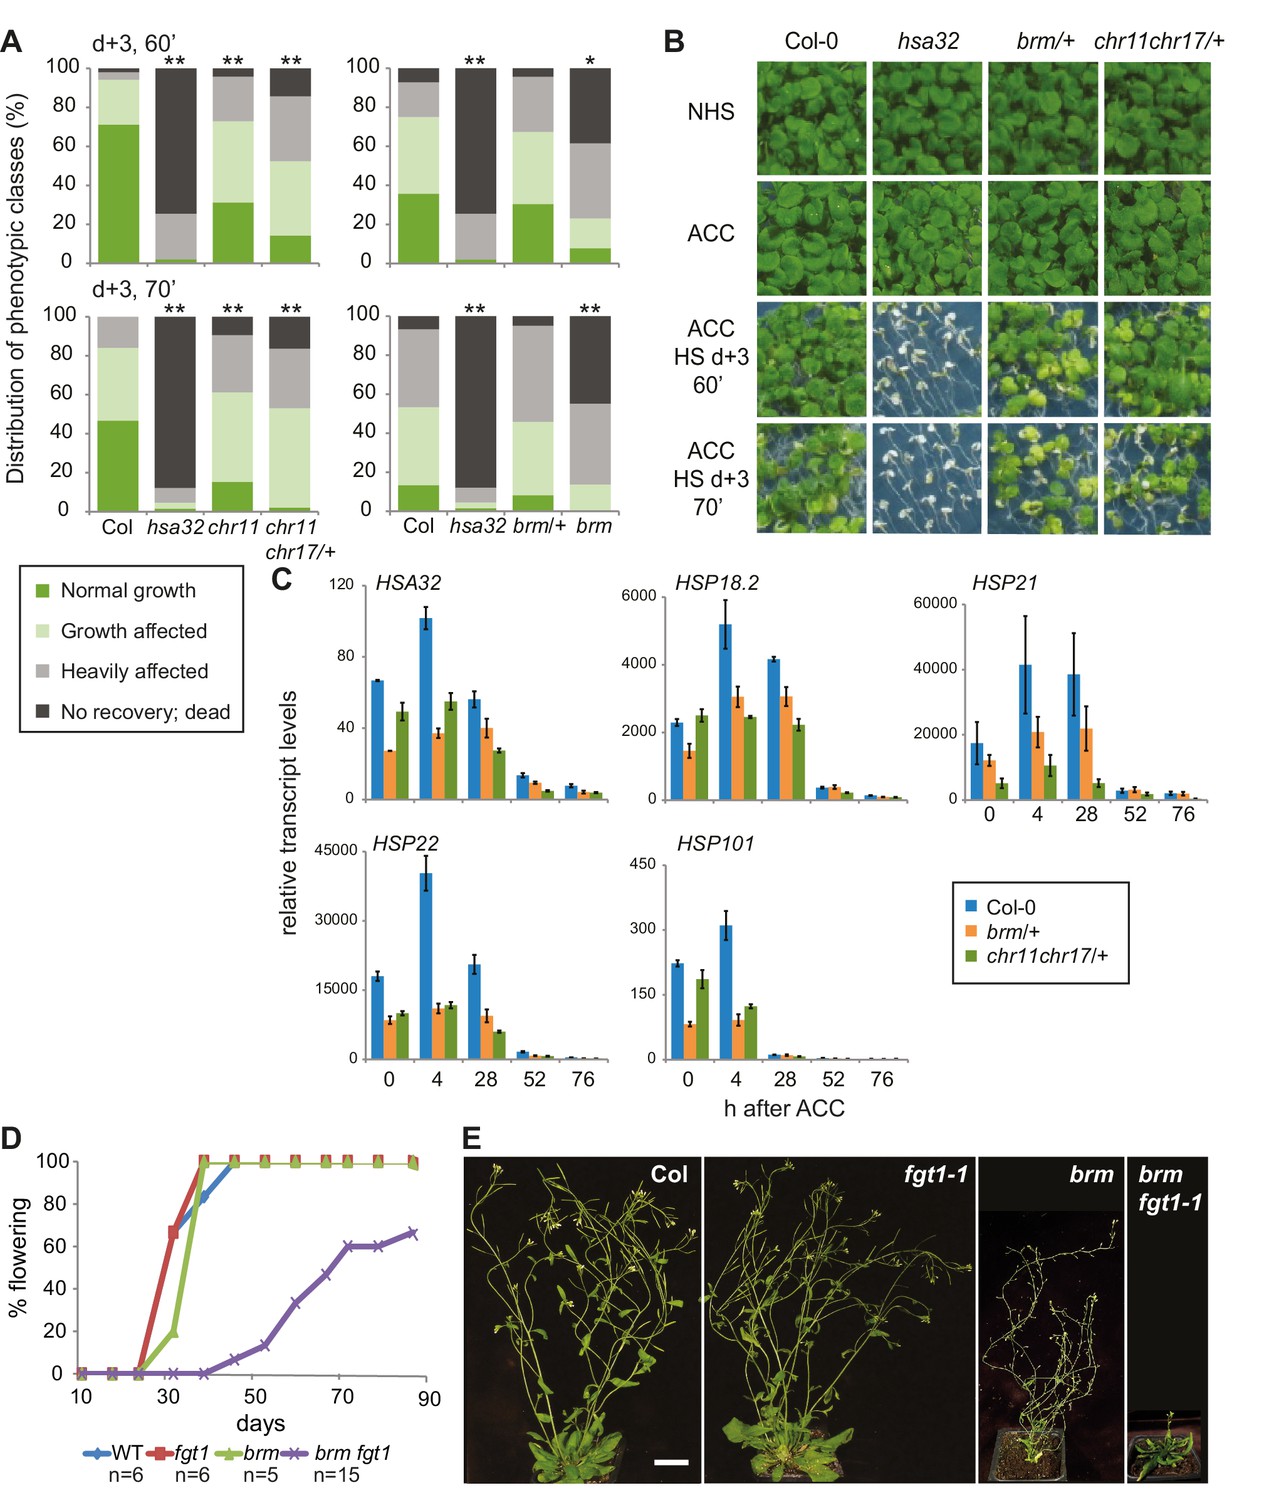
The ISWI and BRM chromatin remodelers are required for HS memory and BRM interacts genetically with FGT1.
(A) chr11/chr11, chr11/chr11 chr17/+ and brm-1 mutants show reduced HS memory. Seedlings of the indicated genotypes were acclimatized 5 d after germination and treated with a tester HS 3 d later. hsa32 was included as a control. Individual seedlings were phenotypically categorized 14 d after ACC and genotyped by PCR. Data are averaged over at least two independent assays, Fisher’s exact test, *p<0.05, **p<0.001; n>28. (B) Representative picture of the data shown in (A) taken 14 d after ACC. (C) Transcript levels of HS-inducible genes after ACC are reduced in brm-1/+ and chr11/chr11 chr17/+-segregating lines compared to Col-0. Transcript levels were normalized to At4g26410 and the corresponding NHS sample. Data are averages and SE of at least three biological replicates. (D, E) The brm-1 fgt1-1 double mutant is delayed in growth and development in long-day conditions. (D) Flowering time in days to first open flower. Genotypes were isolated from a segregating population. The percentage of flowering plants is plotted against the days of growth. (E) Representative individuals of the indicated genotypes grown for 51 d (Col-0, fgt1-1) or 67 d (brm-1, brm-1 fgt1-1). Size bar, 2 cm.
Figure 6—figure supplement 1
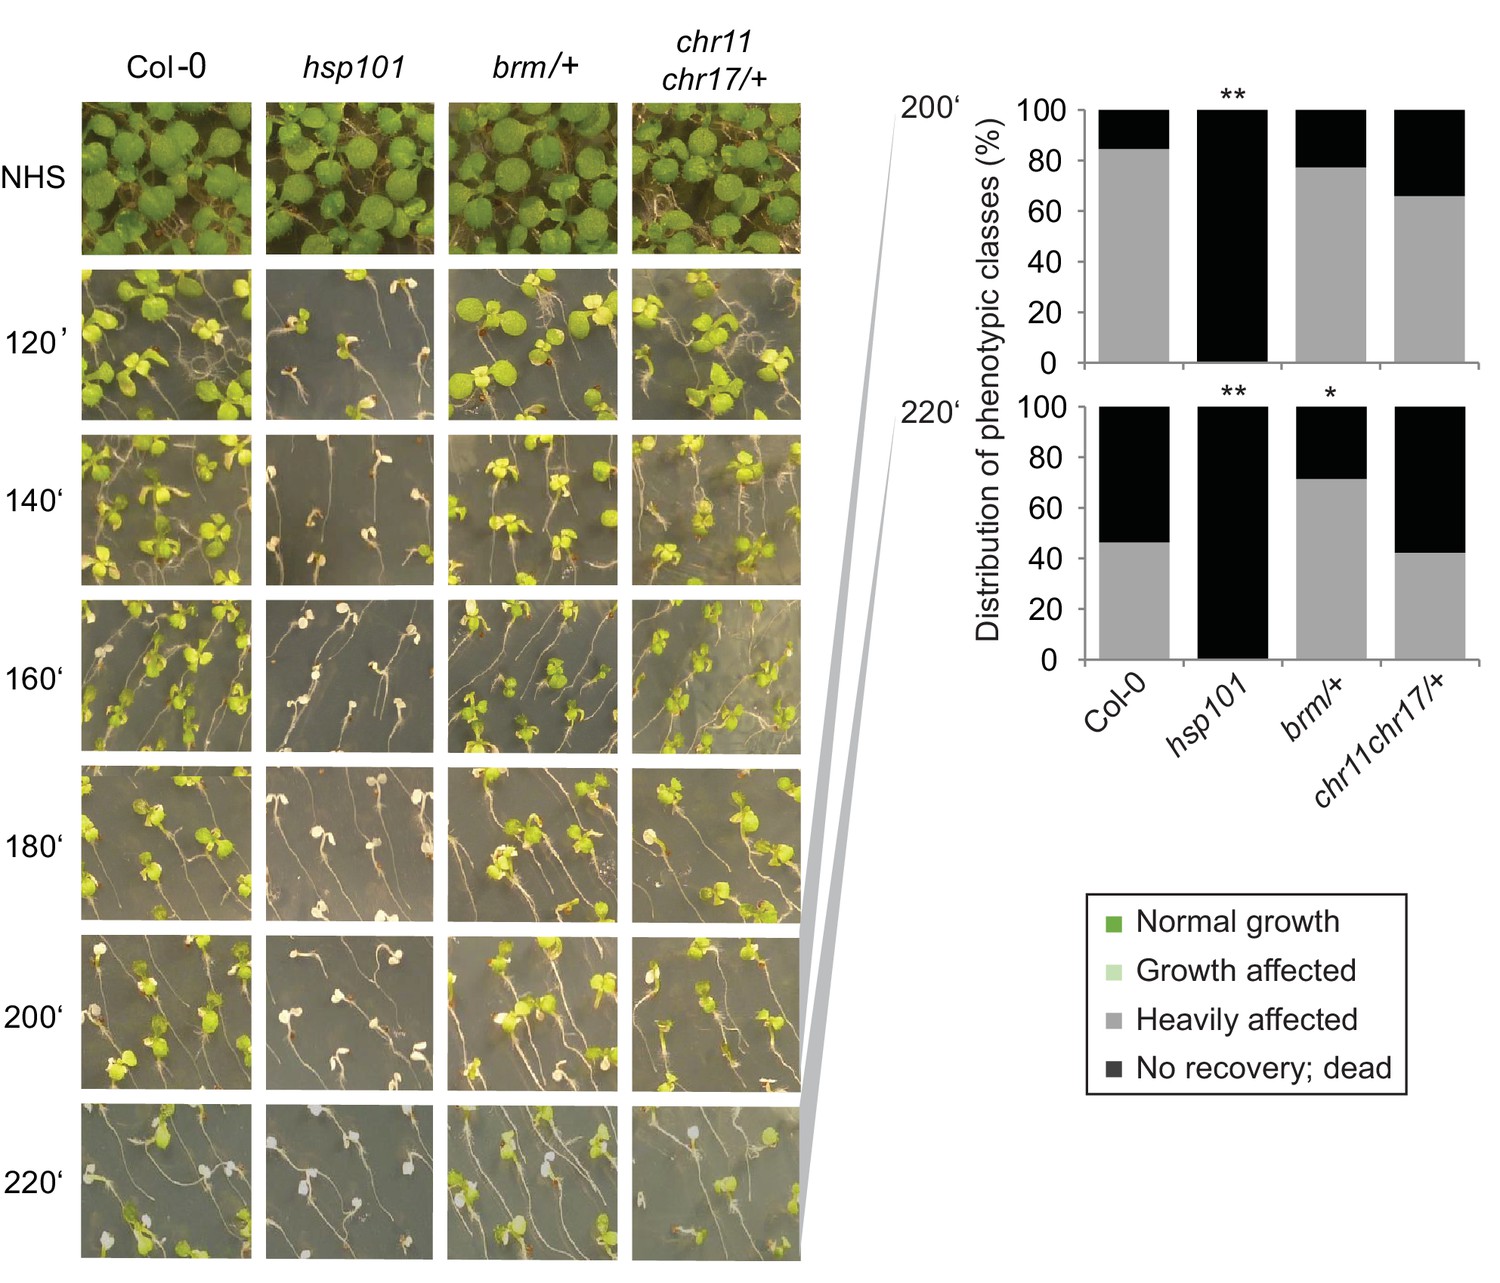
CHR11, CHR17 and BRM are not required for the acquisition of thermotolerance.
Acquisition of thermotolerance is unaffected in chr11/chr11 chr17/+- and brm-1/+ -segregating families, respectively. Acquisition of thermotolerance in Col-0, hsp101, chr11/chr11 chr17/+ and brm-1/+ was assayed by treating seedlings 4 d after germination at 37°C for 60 min, 90 min at 22°C, followed by 44°C for the indicated times. For chr11/chr11 chr17/+ and brm1/+ segregating families were used due to the sterility of the homozygous (double) mutants. Pictures were taken 14 d after heat treatment. All plants of one treatment were grown on the same plate. One representative of at least three biological replicates is shown. The quantification is based on n = 25–49 individuals for each genotype. Asterisks indicate (Fisher’s exact test) *p<0.05; **p<0.01.
Figure 6—figure supplement 2
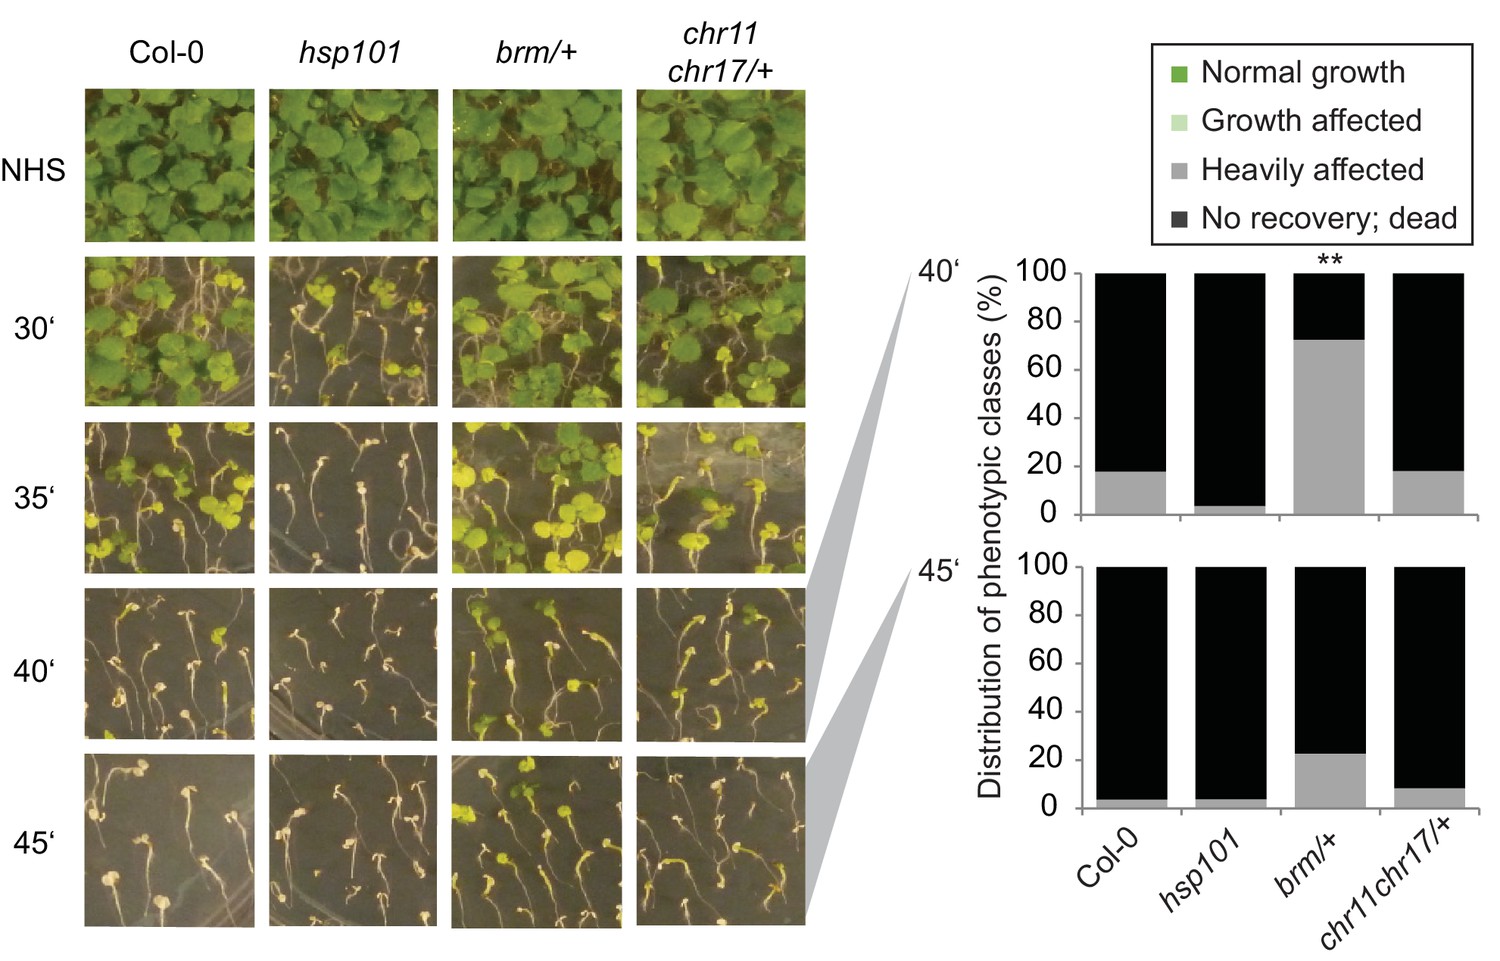
CHR11, CHR17 and BRM are not required for basal thermotolerance.
Basal thermotolerance is unaffected in chr11/chr11 chr17/+ and brm-1/+. Basal thermotolerance in Col-0, hsp101, and segregating families of chr11/chr11 chr17/+ and brm-1/+, respectively, was assayed by incubating seedlings at 44°C for the indicated times for 4 d after germination. For chr11/chr11 chr17/+ and brm-1/+ segregating families were used due to the sterility of the homozygous mutants. Pictures were taken 14 d after HS. All plants of one treatment were grown on the same plate. One representative of at least three biological replicates is shown. The quantification is based on n=26–55 individuals for each genotype. Asterisks indicate (Fisher’s exact test) **p <0.01.
Figure 6—figure supplement 3

Seedling phenotype of the brm-1 fgt1-1 double mutant.The brm-1 fgt1-1 double mutant displays delayed development at the seedling stage.
Representative pictures of seedlings of the indicated genotypes grown side-by-side were imaged after the indicated days of growth in long-day conditions. Scale bars: grey, 0.25 cm; white, 1 cm. Arrows indicate the shoot meristem region of the seedlings. Growth and development of brm-1 fgt1-1 is delayed compared to brm-1 (and Col and fgt1-1).
Figure 7 with 1 supplement
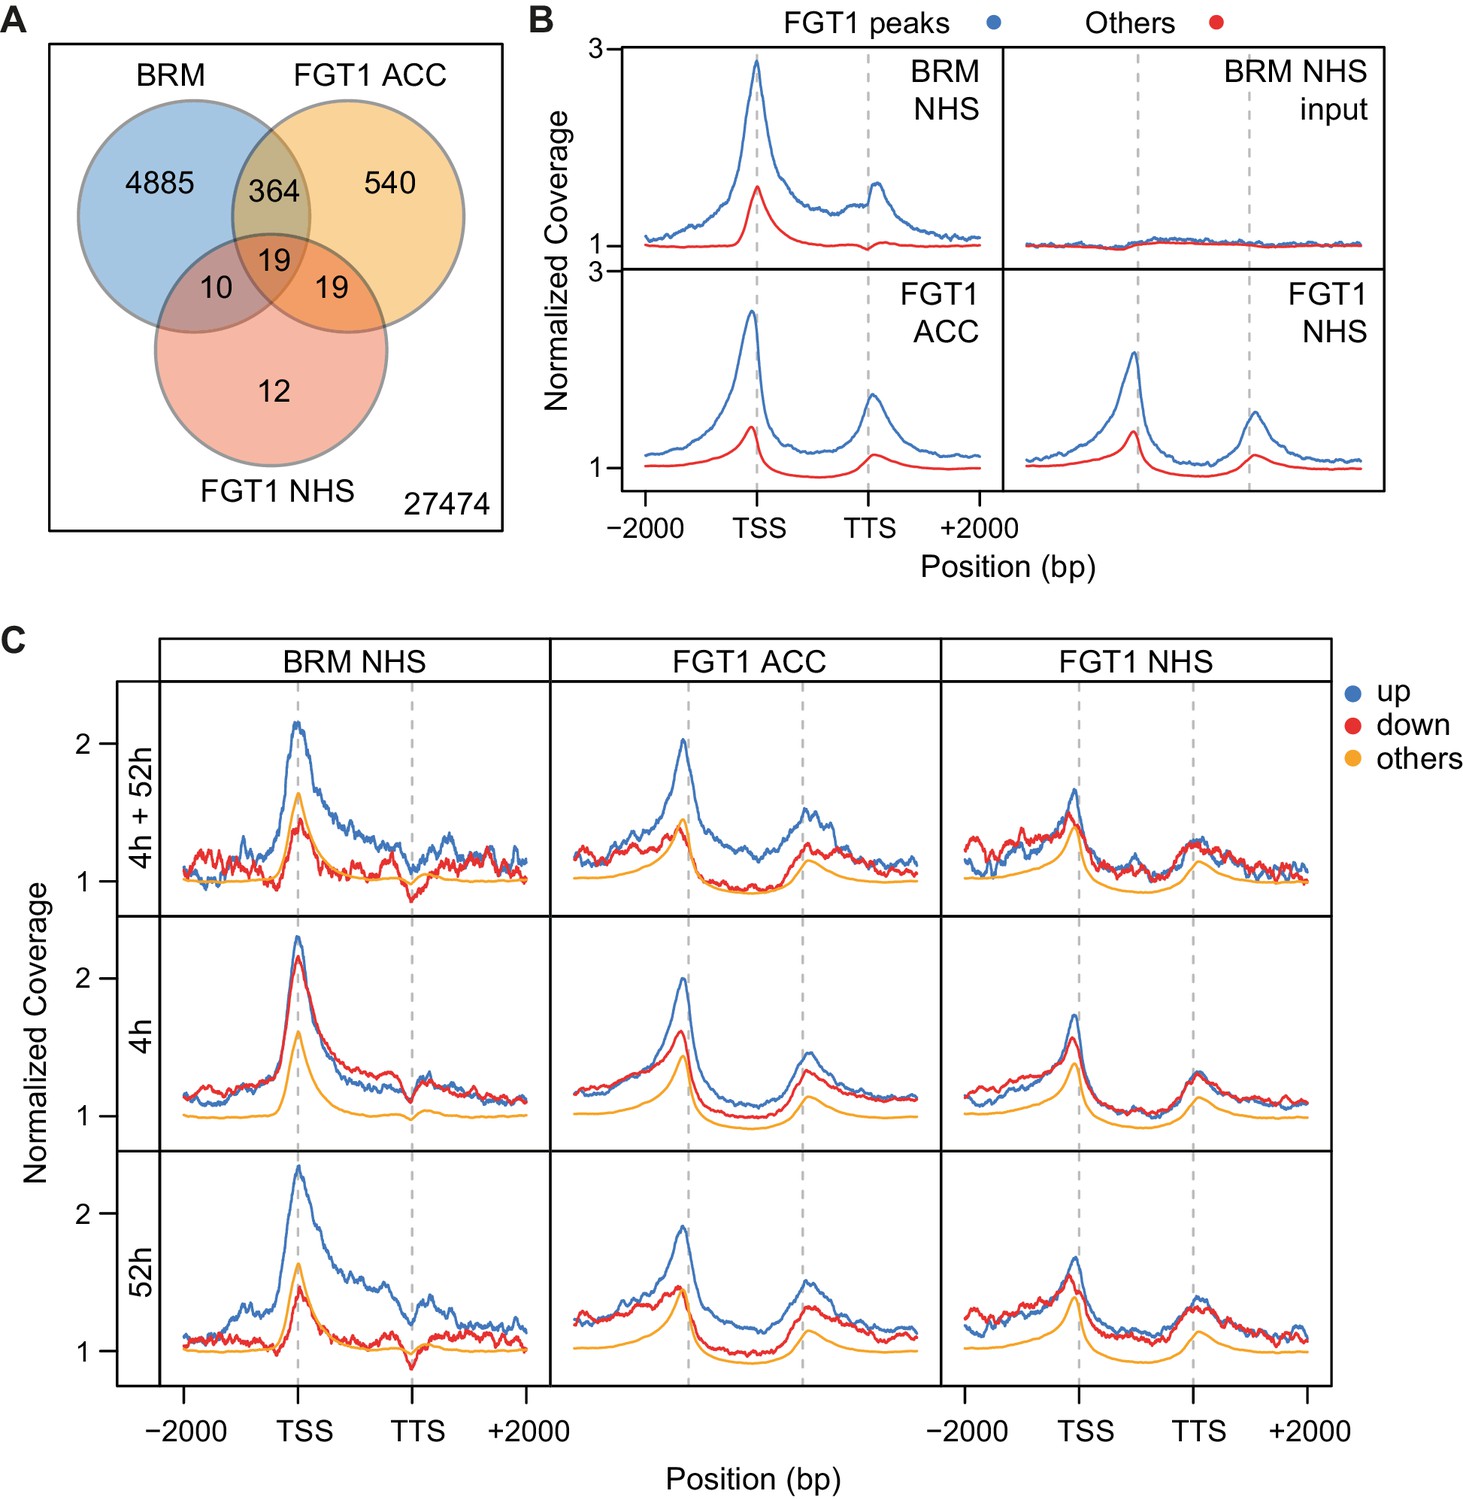
BRM and FGT1 show overlapping genomic targeting at HS-responsive genes.
(A) BRM and FGT1 target genes overlap highly significantly. FGT1 ACC and NHS peak overlapping genes were compared to BRM identified peaks (Li et al., 2016). The number of overlapping genes is represented and their significance was estimated by Fisher test (BRM vs. FGT1 NHS p<10−8, BRM vs. FGT1 ACC p<10−76). (B) BRM is enriched at FGT1 target genes and shows a similar coverage profile as FGT1. Normalized coverage profiles of BRM are displayed for FGT1 ACC peak genes and all other genes. FGT1 panels correspond to those in Figure 4—figure supplement 1. (C) Before HS, BRM binds preferentially to HS memory genes and late HS-induced genes in a pattern similar to FGT1. BRM and FGT1 are strongly enriched at HS memory genes (4 h + 52 h up, top panel, blue line). Normalized read coverages of BRM, FGT1 ACC and FGT1 NHS of genes with changed (up, down, other) expression at 4 and/or 52 h after ACC (Stief et al., 2014) are displayed.
Figure 7—figure supplement 1
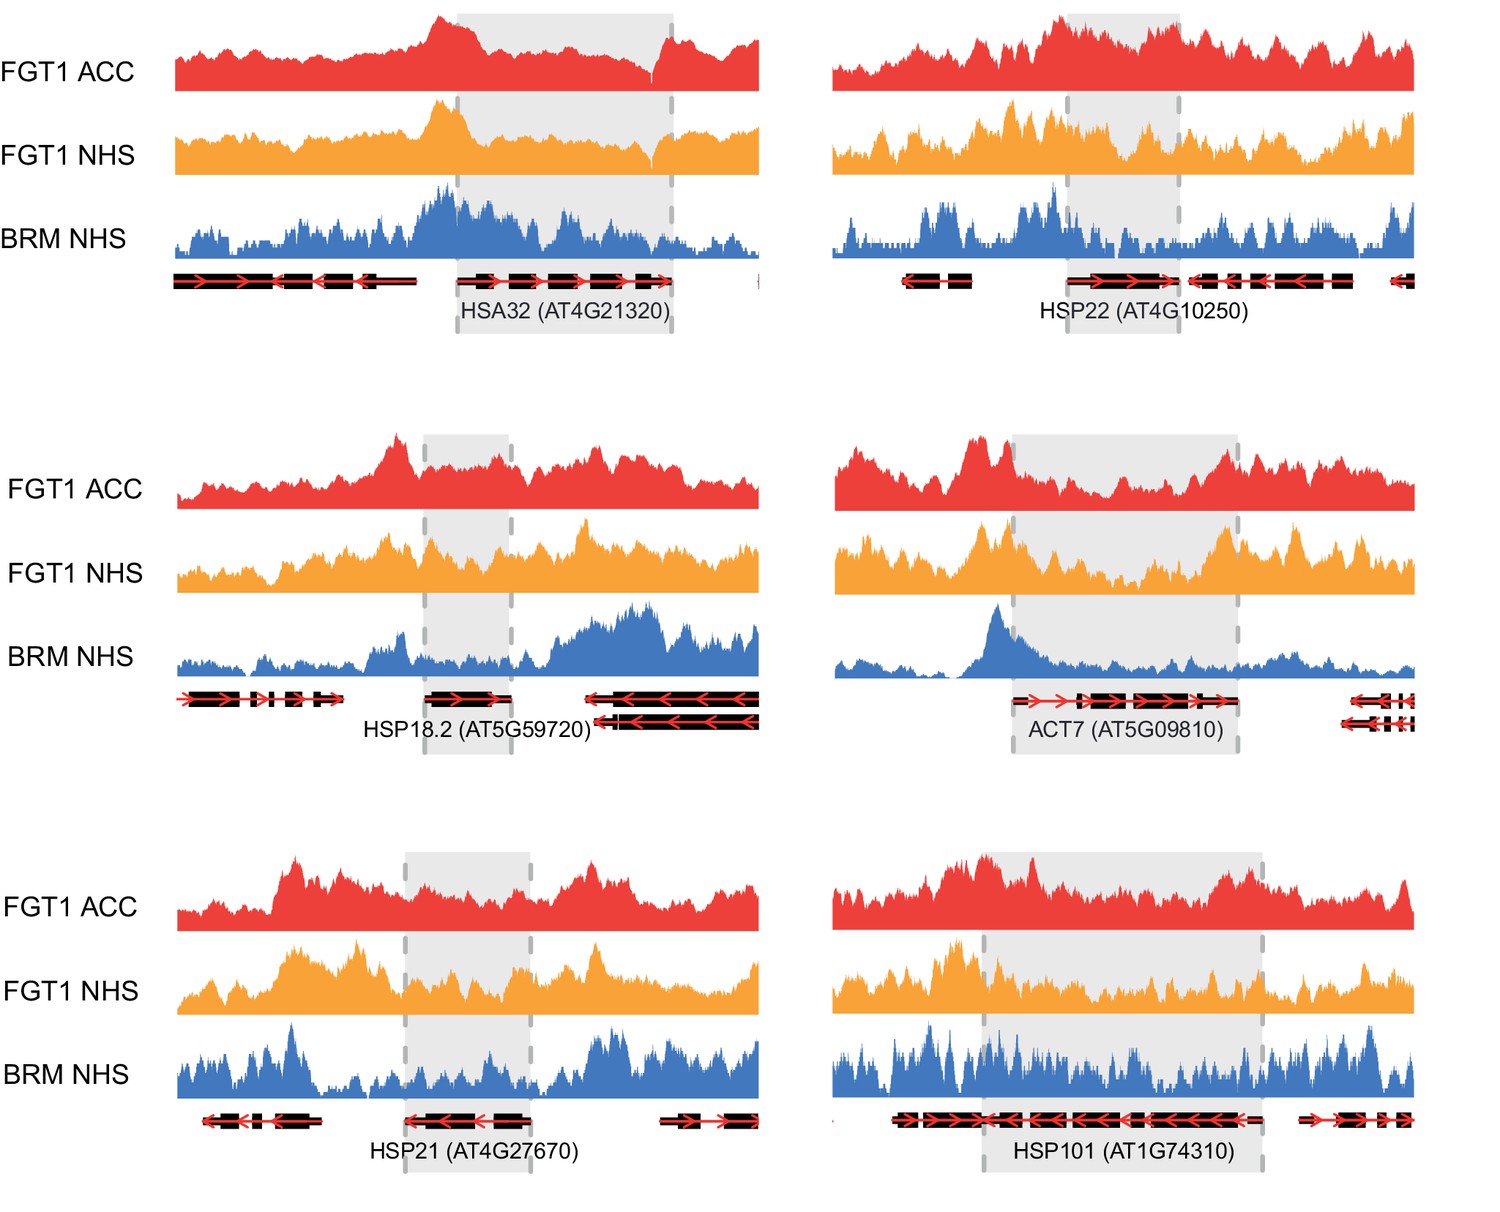
Genome browser views of BRM and FGT1 ChIP-seq reads.
Genome browser views of HSA32, HSP18.2, HSP21, HSP22.0, HSP101 and ACT7 of read coverages from FGT1 ACC, FGT1 NHS and BRM ChIP-seq experiments. The transcribed region of the indicated genes is marked in grey.
Figure 8 with 2 supplements
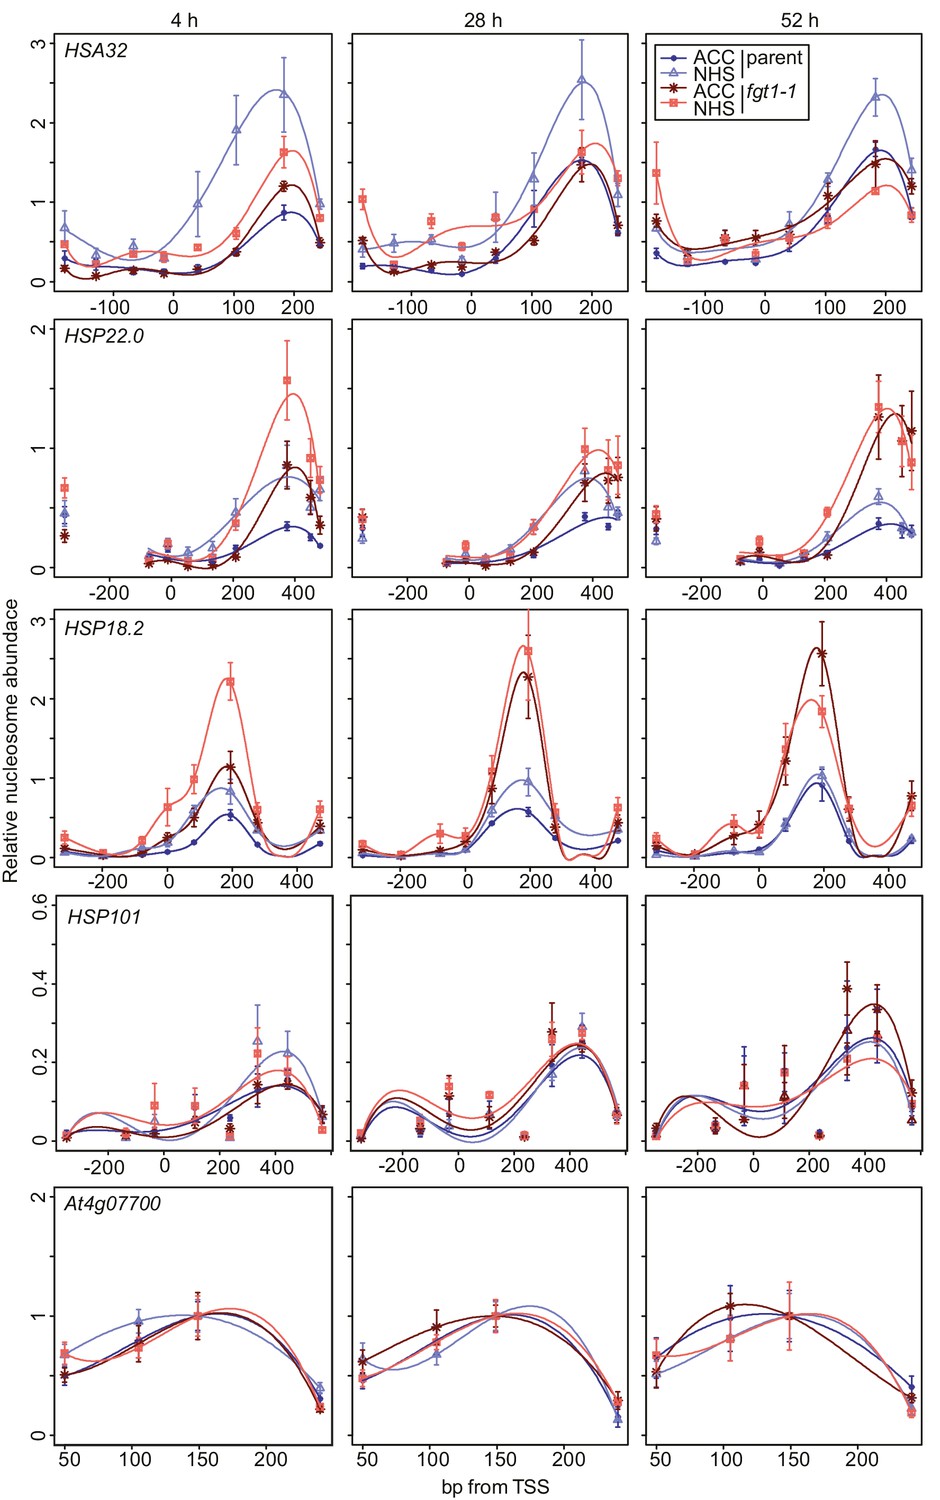
FGT1 is required for nucleosome occupancy and nucleosome recovery after HS at memory genes.
FGT1 is required for proper nucleosome organization around the TSS of memory genes before HS and is required to maintain low nucleosome occupancy during the memory phase. Chromatin dynamics at HSA32, HSP22.0, HSP18.2, HSP101 and At4g07700 at 4, 28, or 52 h after acclimatizing HS (ACC) or no HS (NHS) in the parent (blue) or fgt1-1 (red), respectively. Nucleosome occupancy was determined by MNase-qPCR. Data shown are averages of at least three biological replicates and SE.
Figure 8—figure supplement 1
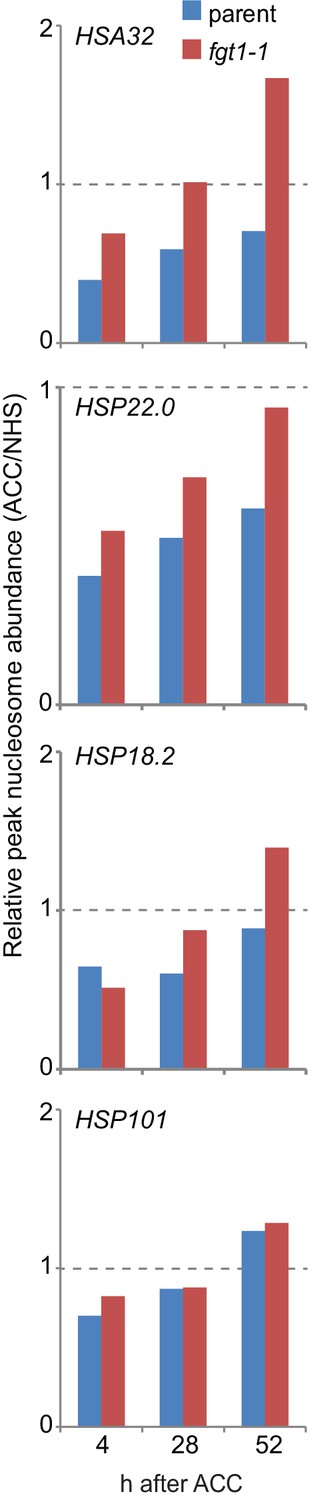
Nucleosome recovery after ACC is delayed in fgt1-1.
Nucleosomes of memory genes but not HSP101 recover faster in fgt1-1 to pre-HS levels. Nucleosome abundance of ACC-treated samples relative to NHS samples was calculated for the position with the highest signal based on the data shown in Figure 8.
Figure 8—figure supplement 2
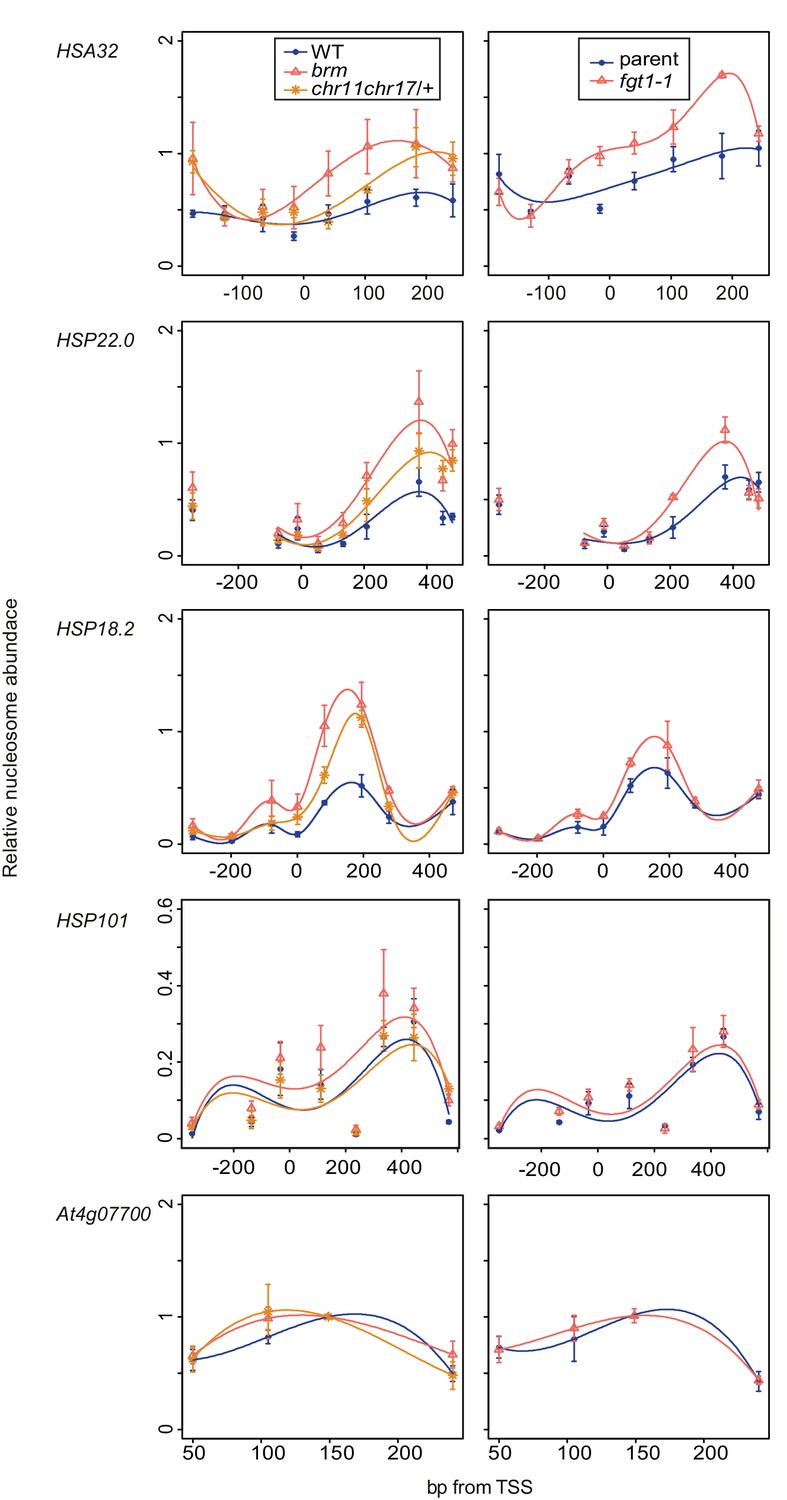
Nucleosome remodeler mutants and fgt1 show similar nucleosome occupancy defects of memory genes but not HSP101.
Nucleosome occupancy was determined by MNase-qPCR at the indicated genes on rosette leaves of 35 d-old Col-0, brm-1, chr11 chr17/+, parent and fgt1-1. Data shown are averages of three biological replicates and SE.
Figure 9
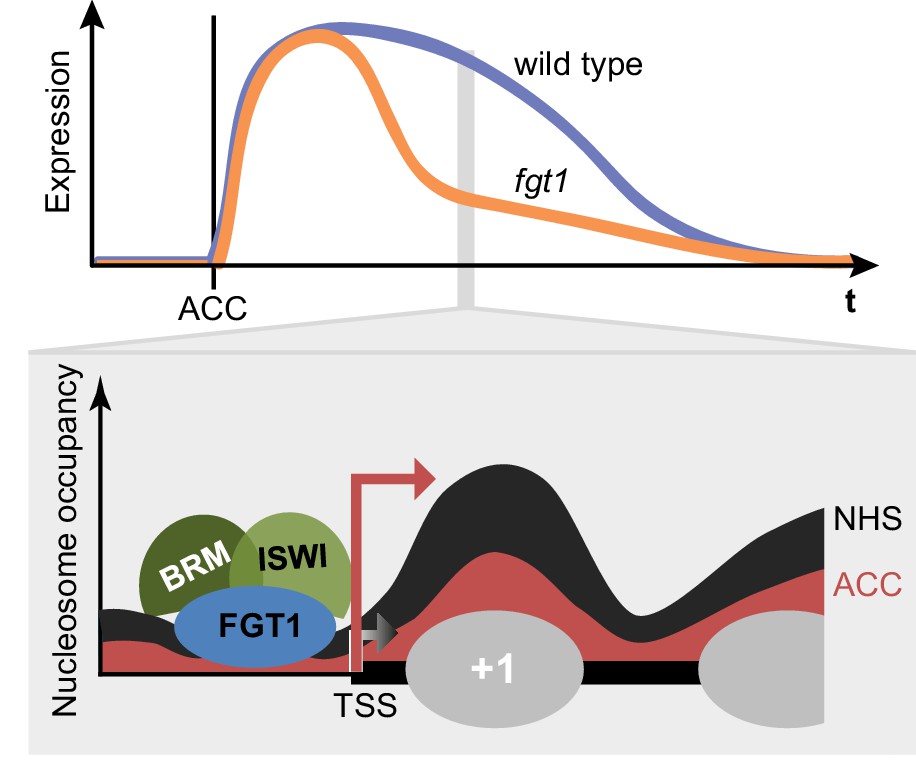
FGT1 interacts with chromatin remodelers and affects nucleosome dynamics during transcription and HS memory.
Top: Schematic representation of HS memory gene expression in wild type and fgt1 after acclimatizing HS (ACC). Loss of FGT1 causes loss of sustained gene induction. Bottom: FGT1 interacts with ISWI and BRM remodelers near the TSS to maintain low nucleosome occupancy. In the absence of FGT1, nucleosome recovery is accelerated. Profiles were drawn based on the data obtained for HSA32. Angled arrows indicate transcriptional activity.
Tables
Table 1
FGT1 interacts with chromatin remodeling proteins in vivo. FGT1-interacting proteins identified by native co-immunoprecipitation followed by mass spectrometry (nHPLC-MS/MS) from 5 d-old 35S::FGT1-YFP seedlings subjected to ACC or NHS 28 h before sampling. Col-0 and 35S::YFP were used as controls. The data represent the number of unique peptides found in the indicated experiments.
| Background | Treatment | Exp | Number of peptides | ||||||||
|---|---|---|---|---|---|---|---|---|---|---|---|
| FGT1 | CHR11/ CHR17 | Chr11 | Chr17 | BRM | SWI3a | SWI3b | SWI3d | SWP73b | |||
| 35S::FGT1-YFP | ACC | 1 | 58 | 4 | 1 | - | - | - | - | - | - |
| 2 | 56 | 12 | 3 | 2 | 2 | 3 | 1 | 1 | 3 | ||
| 3 | 43 | 11 | - | - | 2 | - | - | - | - | ||
| NHS | 1 | 33 | 2 | - | - | - | - | - | - | 1 | |
| 2 | 52 | 11 | 4 | 2 | 1 | 4 | - | - | 3 | ||
| 3 | 51 | 4 | - | - | - | - | - | - | - | ||
| Col-0 | ACC | 1-3 | - | - | - | - | - | - | - | - | - |
| NHS | 1-3 | - | - | - | - | - | - | - | - | - | |
| 35S::YFP | NHS | 1-3 | - | - | - | - | - | - | - | - | - |
Additional files
-
Supplementary file 1
Sequences of oligonucleotides used in this study.
- https://doi.org/10.7554/eLife.17061.027
Download links
A two-part list of links to download the article, or parts of the article, in various formats.
Downloads (link to download the article as PDF)
Open citations (links to open the citations from this article in various online reference manager services)
Cite this article (links to download the citations from this article in formats compatible with various reference manager tools)
Arabidopsis FORGETTER1 mediates stress-induced chromatin memory through nucleosome remodeling
eLife 5:e17061.
https://doi.org/10.7554/eLife.17061


