Drosophila Nanos acts as a molecular clamp that modulates the RNA-binding and repression activities of Pumilio
- University of Michigan, United States
- National Institutes of Health, United States
- University of Texas at Dallas, United States
- University of Minnesota, United States
Figures
Figure 1 with 1 supplement
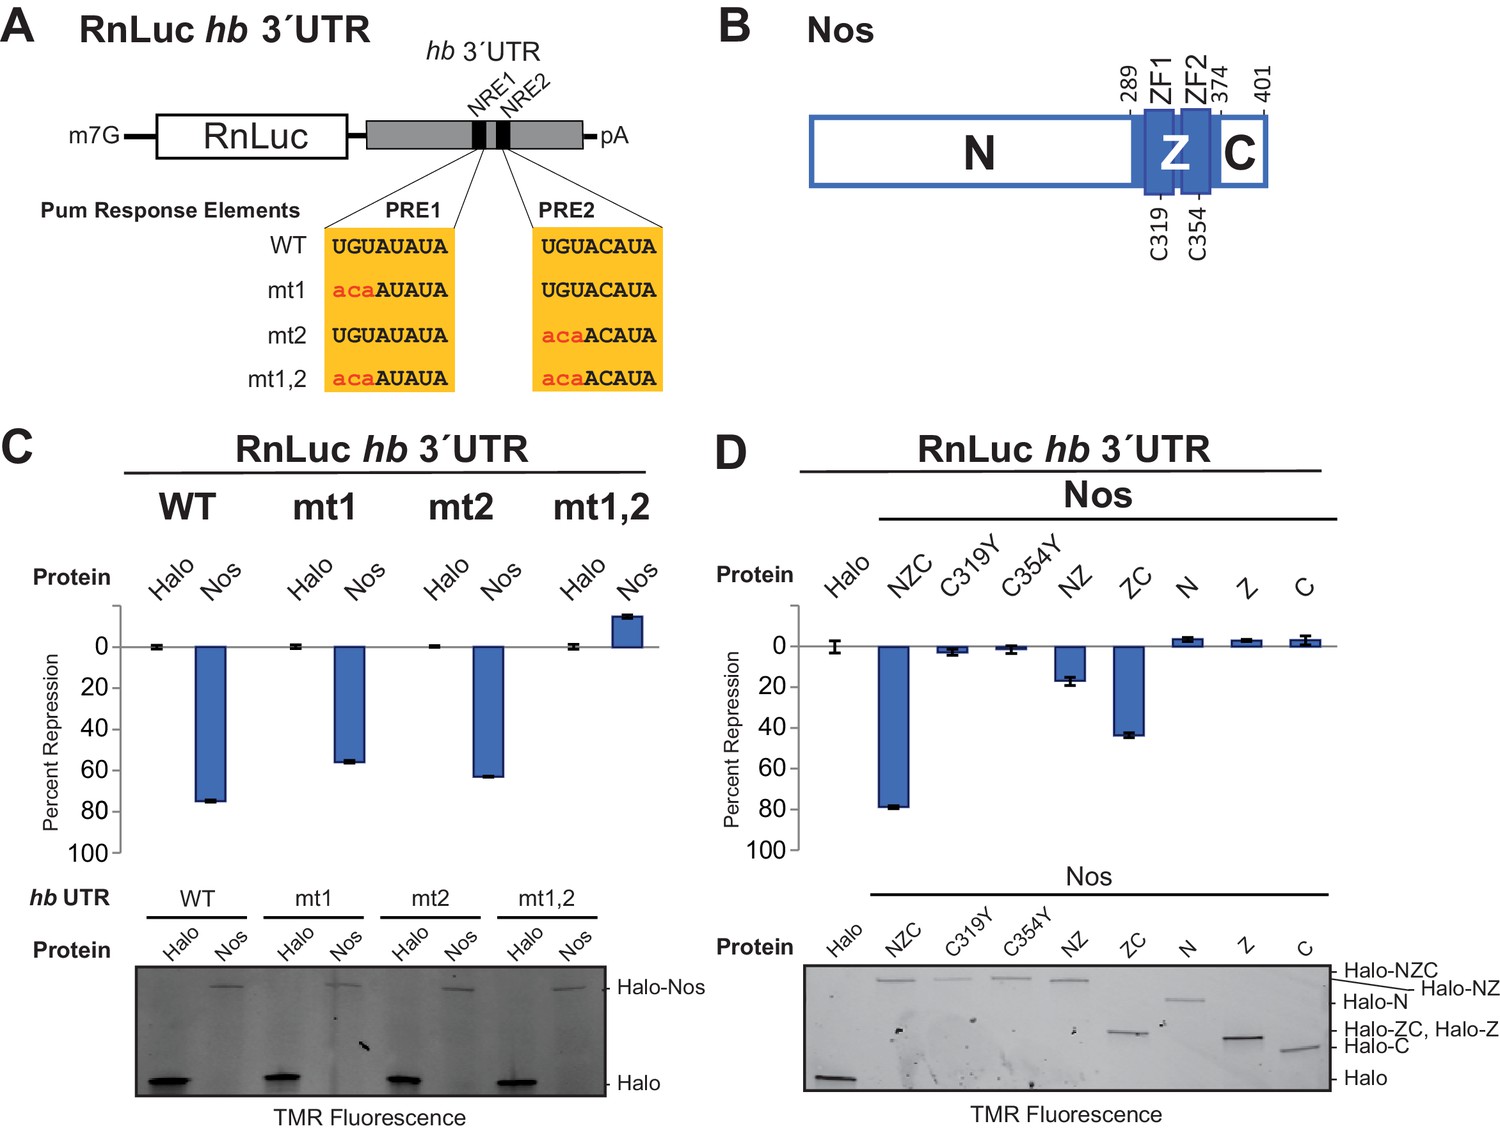
The Zn finger and C-terminal regions of Nanos collaborate with Pumilio to repress target protein and mRNA expression.
(A) Diagram of Renilla Luciferase (RnLuc) reporters including the hb 3´UTR. WT PRE1 and PRE2 sequences, located within NRE1 and NRE2, respectively, and mutant PRE sequences (mt1, mt2, and mt1,2) are shown. (B) Diagram of Nos protein. Amino acid residue boundaries of the N-terminal region (N), central region (Z, blue) including ZFs, and C-terminal extension (C) are indicated. (C) Nos-enhanced repression via the hb PREs. Reporter assays were performed in D.mel-2 cells. Percent repression values are graphed for RnLuc WT and mt hb 3´UTR reporter expression with negative control Halo-tag alone (Halo) and full length Halo-Nos test proteins. (D) The Nos Z and C-terminal regions together retain efficient repression activity. Percent repression values are graphed for RnLuc hb 3´UTR WT reporter expression with negative control Halo and Halo-Nos variants are shown. For panels C and D, mean and standard error of the mean (SEM) values from quadruplicate experiments are shown. Expression of test proteins was visualized by tetramethylrhodamine (TMR) fluorescent labeling of the Halo-tag fusion proteins. Statistical analysis of the data is reported in Figure 1―source data 1.
-
Figure 1—source data 1
Values and statistical analysis of luciferase reporter assays.
The average value of the relative response ratio of Renilla to Firefly luciferase activities (Rn/FF), average percent repression values (%Repress), and Standard Errors of the Mean (SEM) are listed for each condition in the experiments (from four technical replicates, n = 4). The p-values (p-val) resulting from two-tailed t-tests between each measurement and the indicated control are represented in bold (significant) or italics (not significant). Experimental values derived from the same experiment are outlined in boxes.
- https://doi.org/10.7554/eLife.17096.004
Figure 1—figure supplement 1
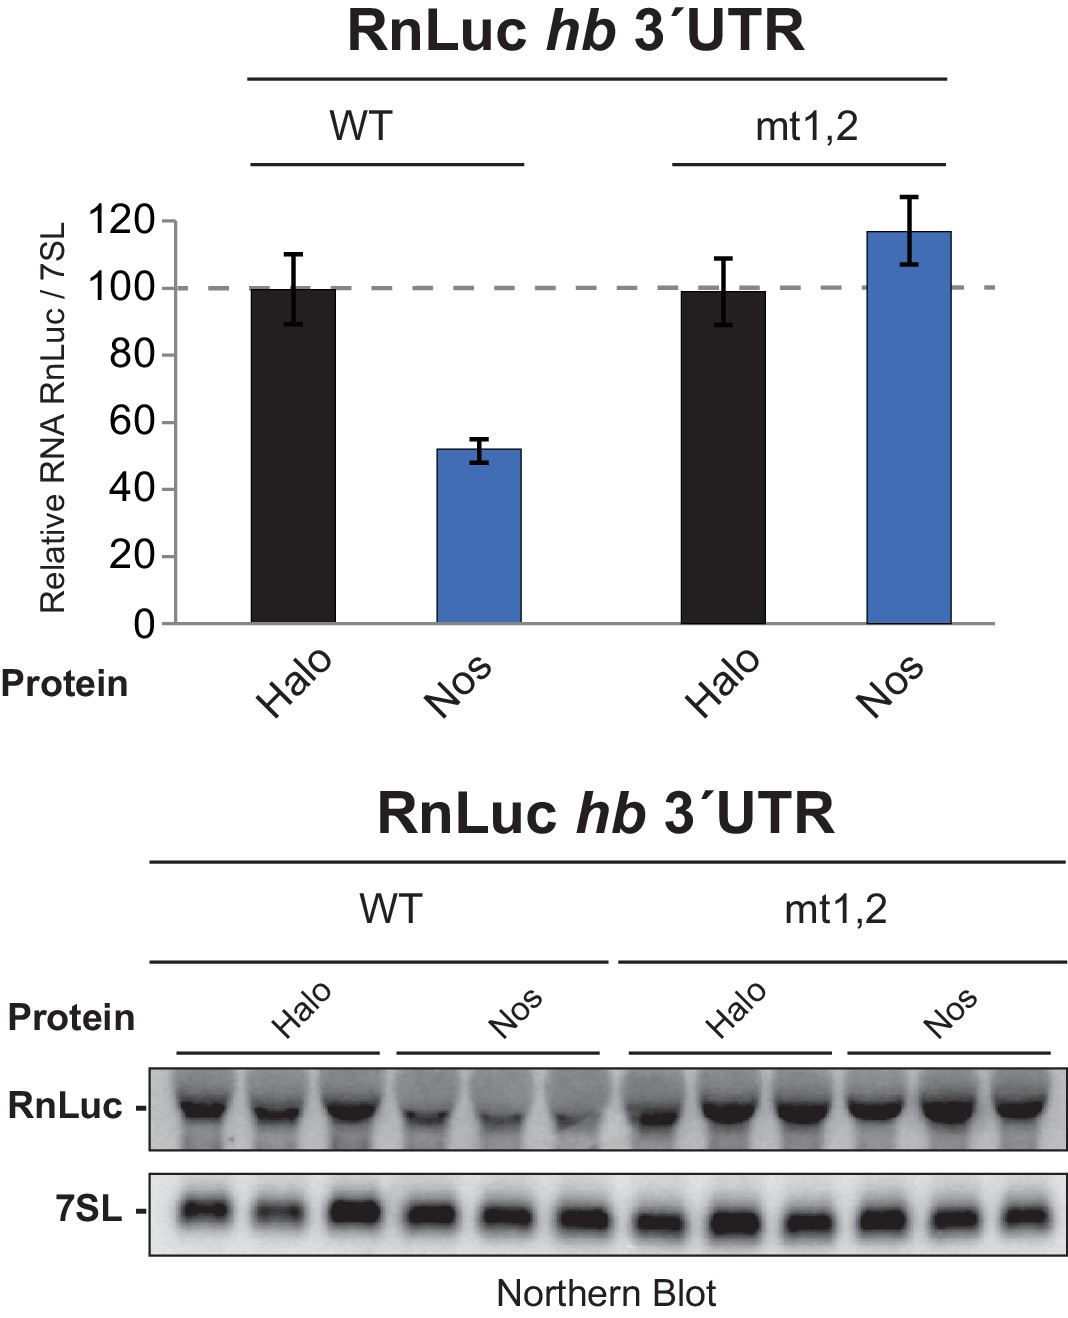
Nos reduces hb 3´UTR reporter mRNA level in a PRE-dependent manner.
Quantitation of Northern blot detection of the indicated RnLuc hb 3´UTR reporter mRNAs and the 7SL RNA, as a loading control, from total RNA purified from D.mel−2 cells expressing negative control Halo-tag alone (Halo) or Halo-Nos and the indicated reporter. For each condition, RNA was analyzed from three individually transfected cell cultures. Mean and SEM values from the triplicate samples are shown. A dotted line indicates the level of WT 3´UTR reporter mRNA in cells transfected with negative control Halo. Statistical analysis of the data is reported in Figure 1―figure supplement 1—source data 1.
-
Figure 1—figure supplement 1—source data 1
Values and statistical analysis of Northern blot of luciferase reporter mRNAs.
Quantitation of the Northern blot in Figure 1—figure supplement 1 was performed and the average ratio of Renilla luciferase mRNA to 7SL RNA internal control (Rn/7SL) was calculated to normalize expression values (Normed, n = 3). Standard Error of the Mean (SEM) is reported for each measurment. The p-values (p-val) resulting from two-tailed t-tests between each measurement and the indicated control are represented in bold (significant) or italics (not significant).
- https://doi.org/10.7554/eLife.17096.006
Figure 2 with 3 supplements
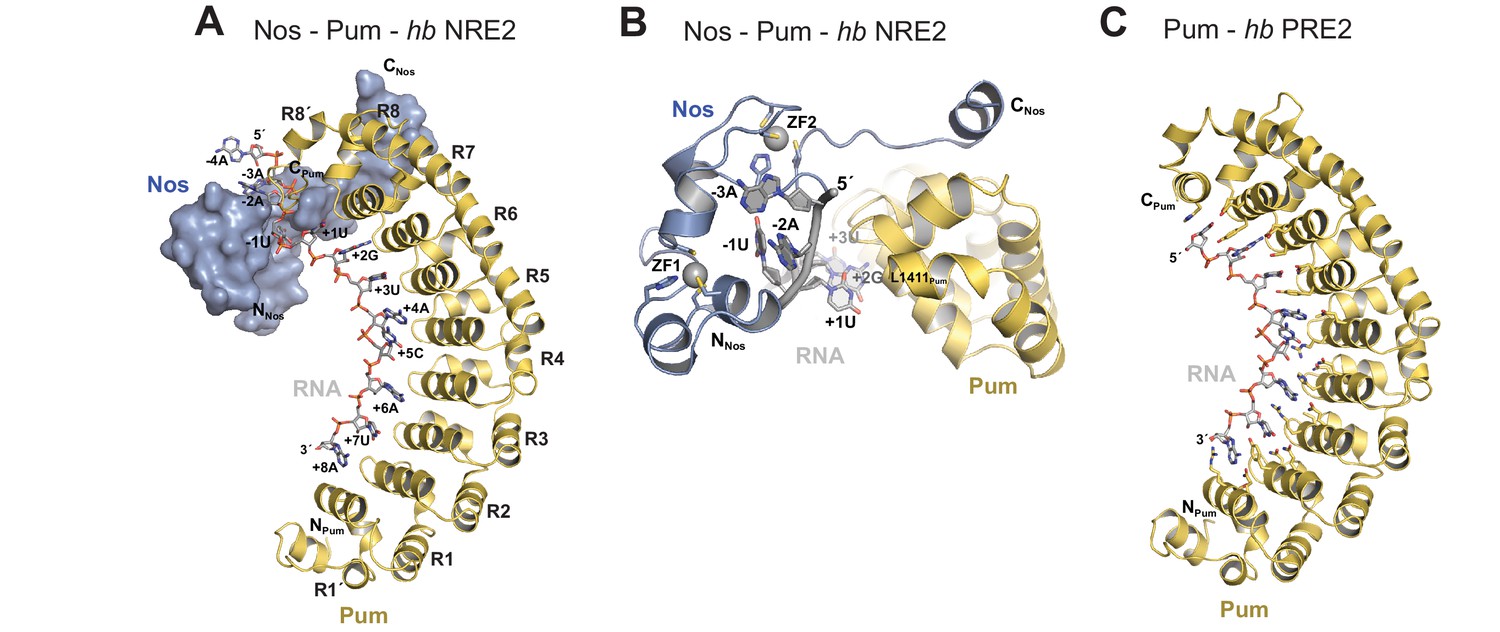
Nanos embraces Pumilio and hb RNA to stabilize the ternary complex.
(A) Crystal structure of a Drosophila Nos-Pum-hb NRE2 RNA ternary complex. Pum is shown as a ribbon diagram (yellow), Nos is shown as a surface representation (blue) and hb NRE2 RNA is shown as a stick model colored by atom type. N- and C-termini of proteins and 5´ and 3´ ends of the RNA are labeled. Pum repeats R1 to R8 and pseudo repeats R1´ and R8´ are indicated. (B) View of the Nos-Pum-hb NRE2 RNA ternary complex down the long axis of Pum. Pum (yellow) and Nos (blue) are shown as ribbon diagrams, and hb NRE2 is shown as a cartoon backbone with RNA bases. Zn atoms are shown as grey spheres. The C-terminus of Pum was truncated to L1411 to allow visualization of Nos-RNA interaction. (C) Ribbon diagram of a crystal structure of a Drosophila Pum binary complex with the PRE2 from hb NRE2.
Figure 2—figure supplement 1
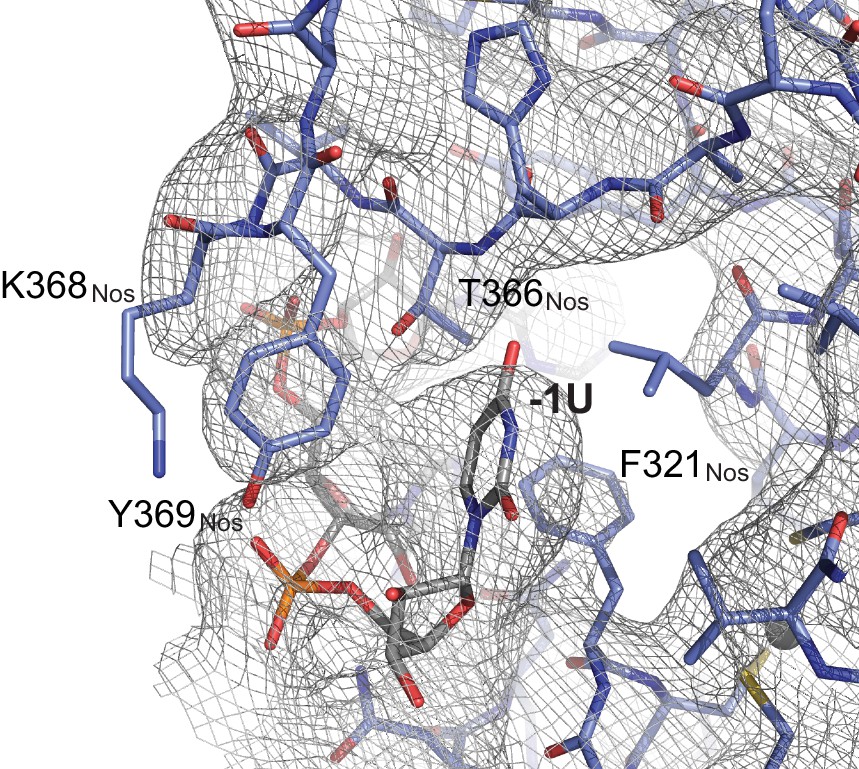
Representative electron density map of the Nos-Pum-hb NRE2 complex.
A 2Fo-Fc composite omit map contoured at 1.2 σ is shown superimposed with the Nos-Pum-hb NRE2 RNA structure at the binding pocket for the −1U. Carbon atoms are blue for Nos and grey for RNA.
Figure 2—figure supplement 2
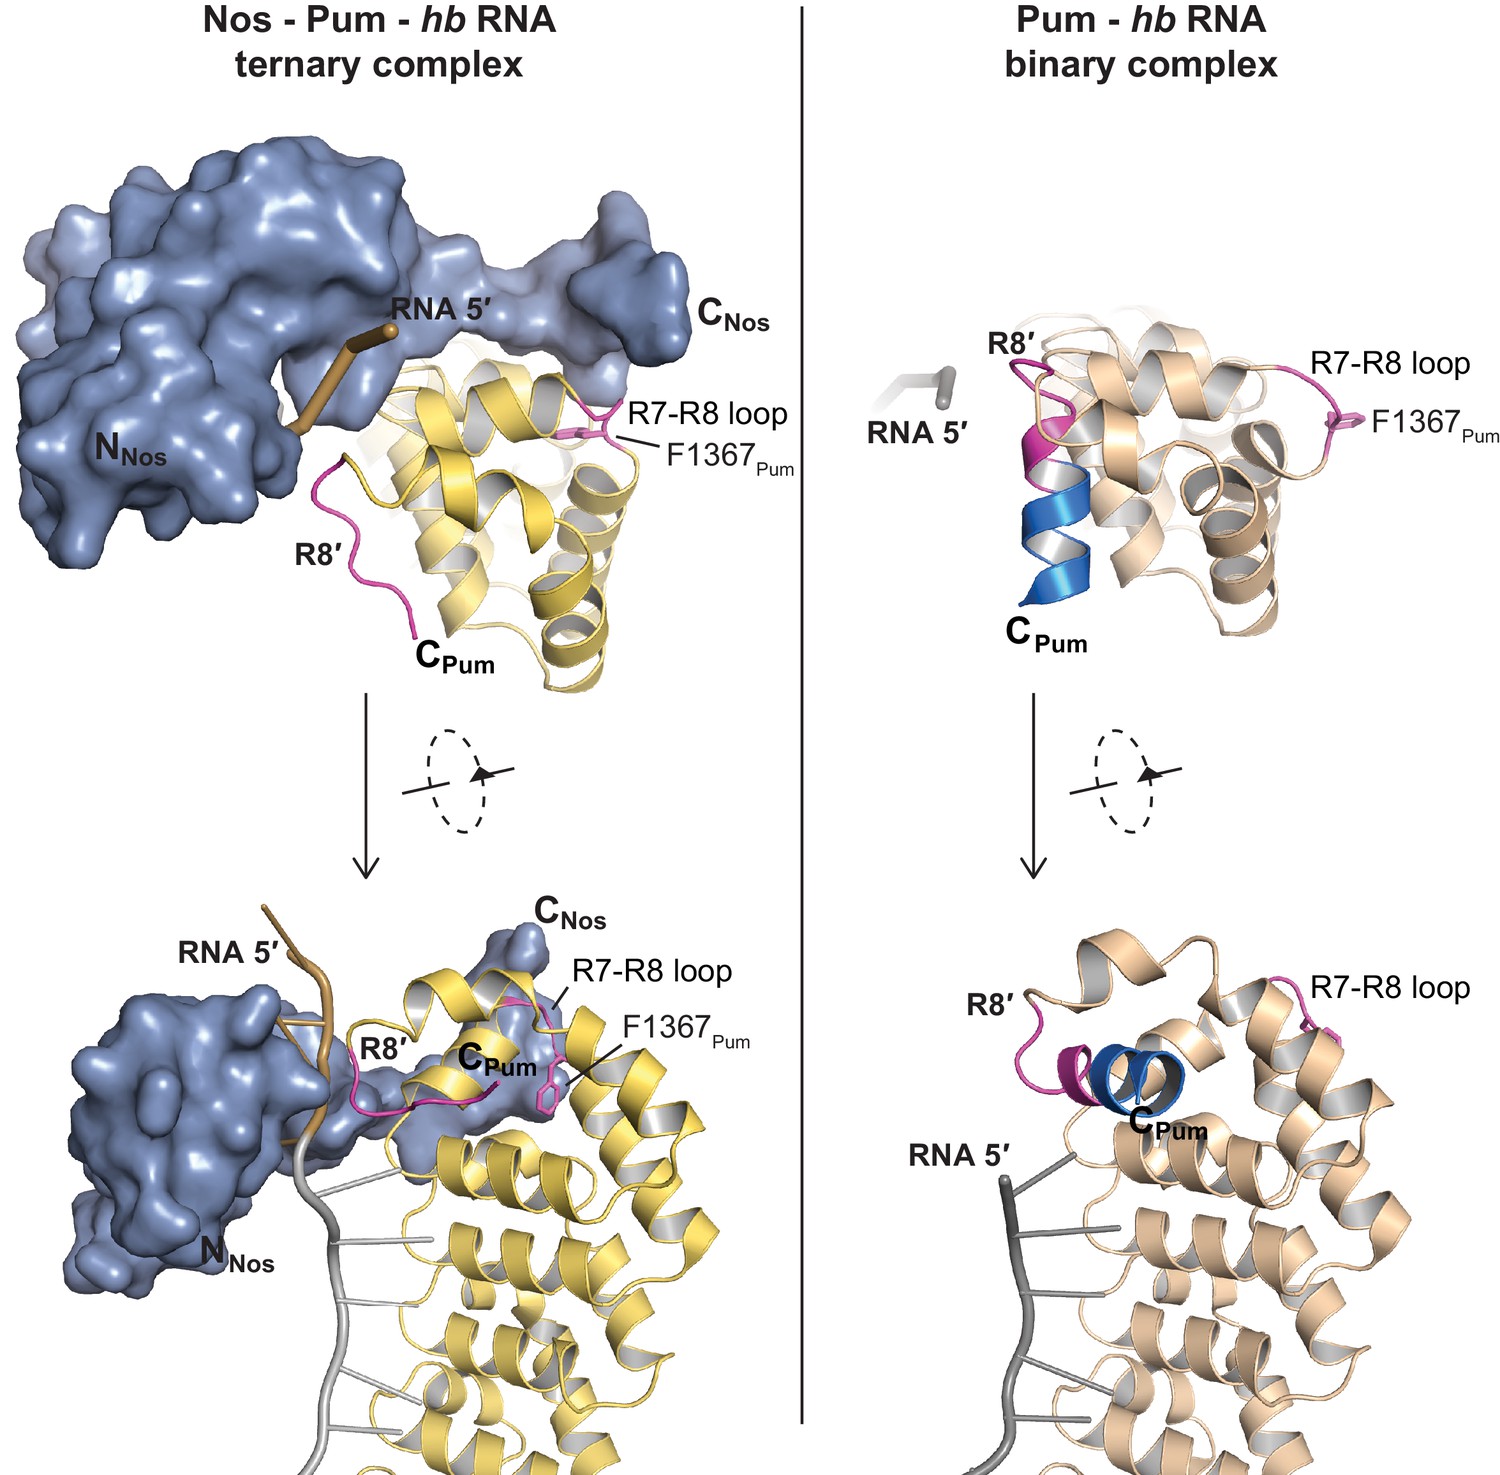
Nanos induces localized structural changes in Pum upon formation of the Nos-Pum-hb NRE2 RNA ternary complex.
A loop between repeats R7-R8 of Pum (R7-R8 loop) undergoes conformational changes to promote Nos-Pum interactions. The terminal helix of Repeat 8′ (R8′) also changes conformation to interact with the RNA. Crystal structures of Nos – Pum – hb NRE2 RNA ternary and Pum – hb PRE2 RNA binary complexes are shown side-by-side. Pum is shown as a ribbon diagram for both the ternary (yellow) and binary (tan) complexes. Regions that undergo structural changes are shown in magenta and C-terminal residues of Pum that are disordered in the ternary complex are colored turquoise. Nos is shown as a surface representation, colored blue. RNA is pictured as a cartoon backbone with grey PRE and brown Nanos Binding Site regions.
Figure 2—figure supplement 3
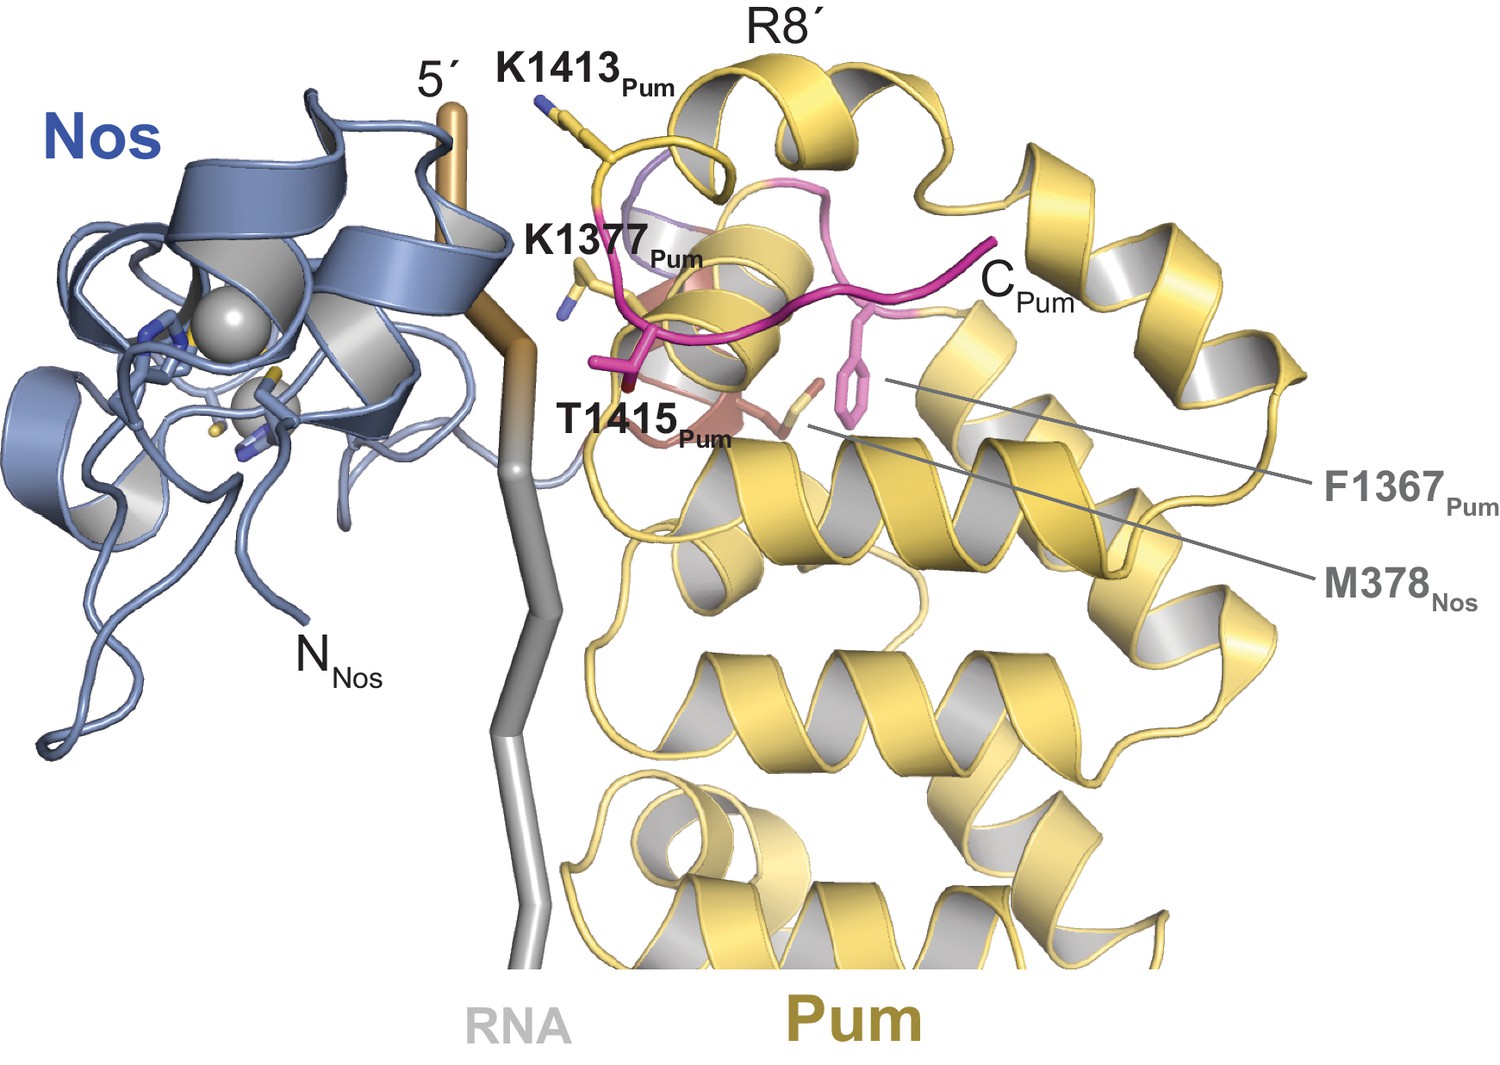
Crystal structure of Nos – Pum – hb NRE2 RNA ternary complex highlights key Pum-RNA and Nos-Pum contacts.
The C-terminal helix of Pum unfolds to promote ternary complex formation, forming additional contacts with the RNA. Important Nos and Pum residues are indicated, although electron density for most side chains is incomplete. The R7-R8 loop region of Pum, containing the indicated residue F1367, changes conformation to contact the Nos C-terminal helix, including residue M378. Pum is shown as a ribbon diagram (yellow). Regions that undergo structural changes are shown in magenta. Nos is shown as a ribbon diagram, colored blue. RNA is pictured as a cartoon backbone with grey PRE and brown Nanos Binding Site regions.
Figure 3 with 1 supplement
Nanos increases the binding affinity of Pumilio for hunchback RNA.
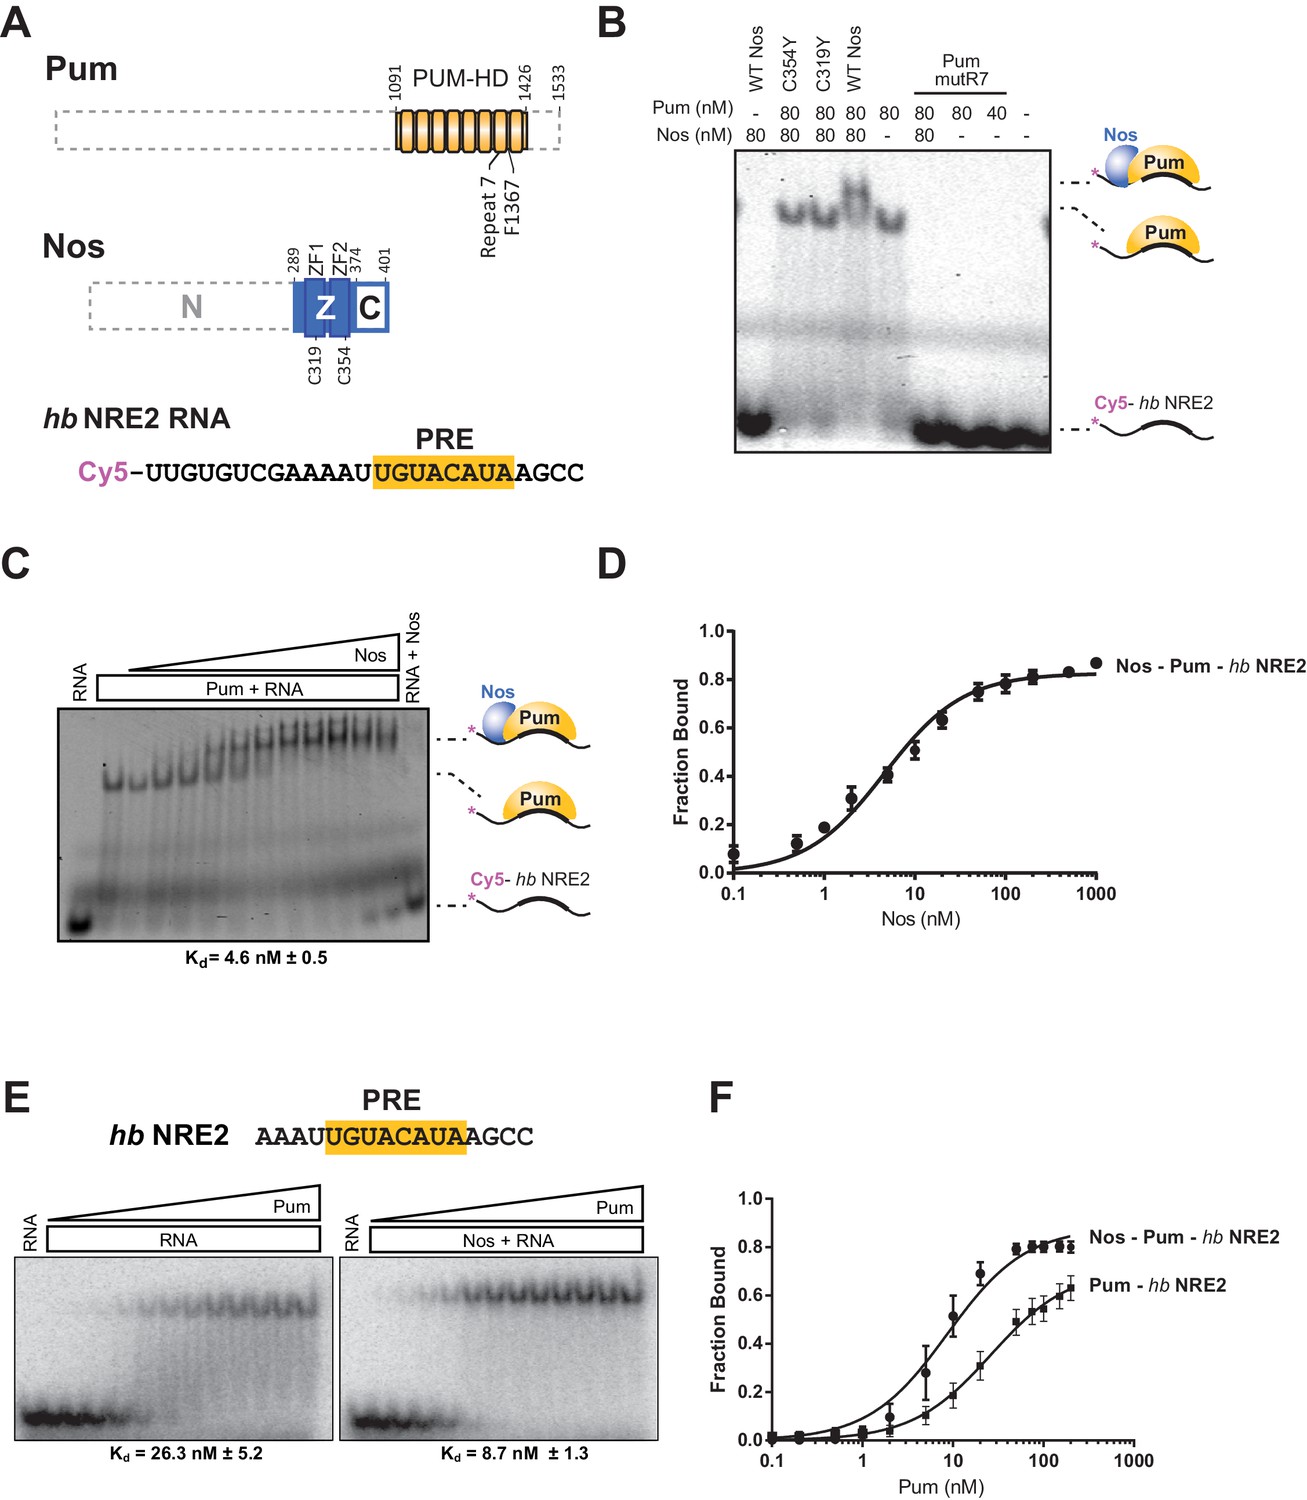
(A) Diagram of recombinant proteins and RNA ligand used for EMSAs. The amino acid residue boundaries of the Pum RNA-binding domain (PUM-HD, yellow) are represented relative to full-length Pum. For simplicity, we refer to the PUM-HD as Pum. The Z and C regions are shown in the context of full-length Nos. Dashed lines outline regions excluded from the recombinant proteins used for EMSAs. The RNA sequence of the Cy5-labeled hb NRE2 is shown with the PRE sequence highlighted (yellow). (B) A representative EMSA with hb NRE2 RNA is shown. Nos and Pum test protein concentrations are indicated above the gel. (C) A representative EMSA measuring binding of Nos to the Pum – hb NRE2 complex. Nos was titrated into binding reactions with a constant concentration of Pum (100 nM). The mean observed dissociation constant (Kd) with standard deviation (SD) from triplicate experiments is shown below the gel. (D) Graph of fraction bound for Nos-Pum-hb NRE2 complex in response to Nos concentration. Mean and standard error of the mean (SEM) values from triplicate EMSAs are plotted. (E) Representative EMSAs measuring binding to hb NRE2 RNA, performed at the same time under identical conditions, titrating Pum in the presence or absence of Nos. The mean Kd with SD from triplicate experiments is shown below the gel. (F) Graph of fraction bound of Nos-Pum-hb NRE2 and Pum – hb NRE2 complexes in response to Pum concentration. Mean and SEM values from triplicate EMSAs are plotted.
Figure 3—figure supplement 1

Recombinant purified Pum and Nos test proteins.
Coomassie blue-stained SDS-polyacrylamide gel loaded with equivalent amounts of purified recombinant Pum and Nos WT and mutant test proteins used for the EMSAs. Molecular weights of protein markers are shown on the left.
Figure 4
Interactions between Nanos and Pumilio are necessary for repression.
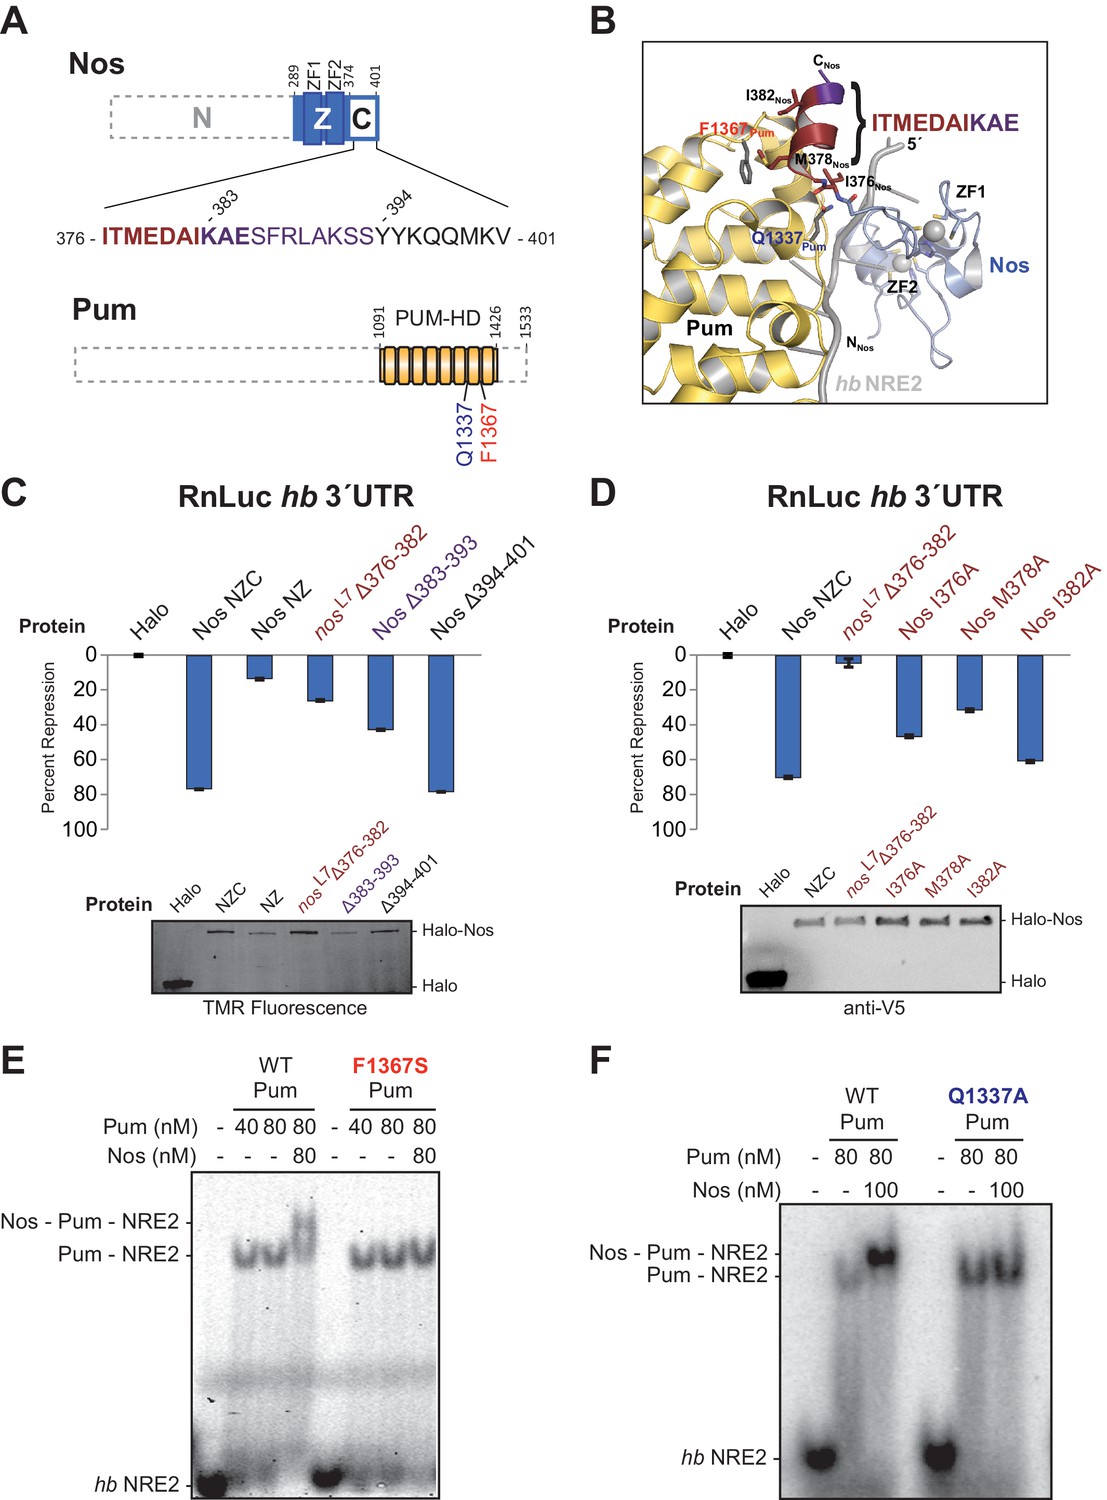
(A) Diagrams of Nos and Pum proteins highlighting residues involved in protein-protein interaction. The amino acid sequence of the C-terminal region of Nos is shown. Residues 376–382 that are deleted in the nosL7 fly mutant, a strong allele for defective abdominal segmentation, are colored red, and residues 383–393 are colored purple. Residues that form the Nos C-terminal α helix are in boldface. (B) View of the interface between Nos (blue with red and purple C-terminal region) and Pum (yellow). Interacting residues in Nos and Pum are shown in stick representation, and the hb NRE2 RNA is shown as a cartoon representation. (C and D) Percent repression values are graphed for the RnLuc WT hb 3´UTR reporter with negative control Halo-tag alone (Halo) and variants of Halo-Nos test proteins. Nos test proteins included full-length Nos (NZC), a truncation of the C-terminal region (NZ), deletions (Δ) of the indicated amino acids and specific amino acid substitutions in the context of full-length Nos. Labels are colored as in panels A and B. Mean and SEM values from quadruplicate samples are shown. Expression of test proteins was visualized by TMR fluorescent labeling or anti-V5 western blotting of the Halo-tag fusion proteins. Statistical analysis of the data is reported in Figure 4―source data 1. (E and F) Representative EMSAs comparing ternary complex formation by WT Pum or the mutant F1367S Pum (panel D) or the mutant Q1337A Pum (panel E).
-
Figure 4—source data 1
Values and statistical analysis of luciferase reporter assays.
The average value of the relative response ratio of Renilla to Firefly luciferase activities (Rn/FF), average percent repression values (%Repress), and Standard Errors of the Mean (SEM) are listed for each condition in the experiments (from four technical replicates, n = 4). The p-values (p-val) resulting from two-tailed t-tests between each measurement and the indicated control are represented in bold (significant) or italics (not significant). Experimental values derived from the same experiment are outlined in boxes.
- https://doi.org/10.7554/eLife.17096.015
Figure 5
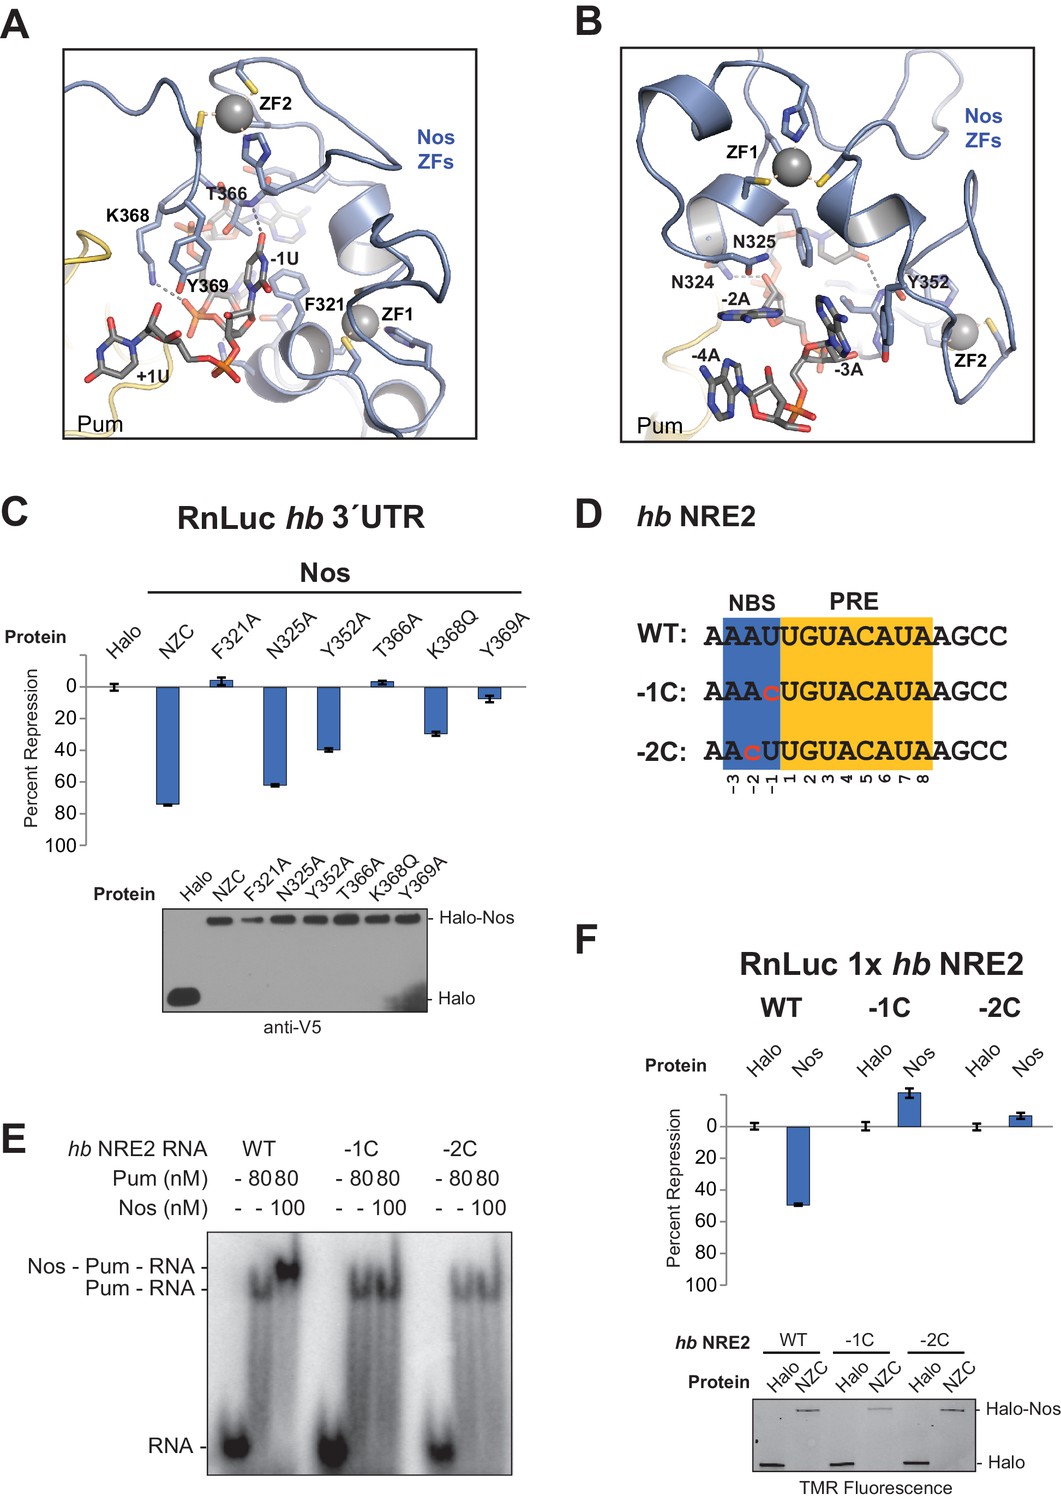
Nanos Zn finger interaction with RNA extends the RNA-binding site and is critical for repression.
(A) Interaction of Nos ZFs with the -1U of hb NRE2. In addition to the base contacts noted in the text, the OH group of Y369Nos and the NH2 group of K368Nos interact with the phosphate group of −1U. (B) Interaction of Nos ZFs with the −2A and −3A nucleotides. In panels A and B, important interactions between nucleotide and amino acid residues are shown. Zn atoms are shown as grey spheres with coordination by CCHC residues indicated by yellow dashed lines. (C) Percent repression values are graphed for the RnLuc WT hb 3´UTR reporter expression with negative control Halo-tag alone (Halo) and Halo-tag fusions of WT Nos or mutant Nos. Mutated residues are shown in panels A and B. Protein expression was confirmed by western blotting for the V5 epitope tag on each test protein. Statistical analysis of the data is reported in Figure 5―source data 1. (D) Sequences of hb NRE2 derivatives tested in EMSA (panel E) and reporter expression assay (panel F). The PRE core and the Nos binding site (NBS), derived from the crystal structure, are colored yellow and blue, respectively. Nucleotide changes in each RNA relative to the WT hb NRE2 sequence are marked by red lowercase letters. (E) Representative EMSA measuring ternary complex formation using indicated combinations of Nos and Pum with the RNA ligands shown in panel D. (F) Percent repression values for RnLuc reporters bearing a minimal 3´UTR containing a single hb NRE2 element or its mutant variants (panel D) with Halo or Halo-Nos are shown. Expression of test proteins was visualized by TMR fluorescent labeling of the Halo-tag fusion proteins. For panels C and F, mean and SEM values from quadruplicate samples are shown.
-
Figure 5—source data 1
Values and statistical analysis of luciferase reporter assays.
The average value of the relative response ratio of Renilla to Firefly luciferase activities (Rn/FF), average percent repression values (%Repress), and Standard Errors of the Mean (SEM) are listed for each condition in the experiments (from four technical replicates, n = 4). The p-values (p-val) resulting from two-tailed t-tests between each measurement and the indicated control are represented in bold (significant) or italics (not significant). Experimental values derived from the same experiment are outlined in boxes.
- https://doi.org/10.7554/eLife.17096.017
Figure 6 with 5 supplements
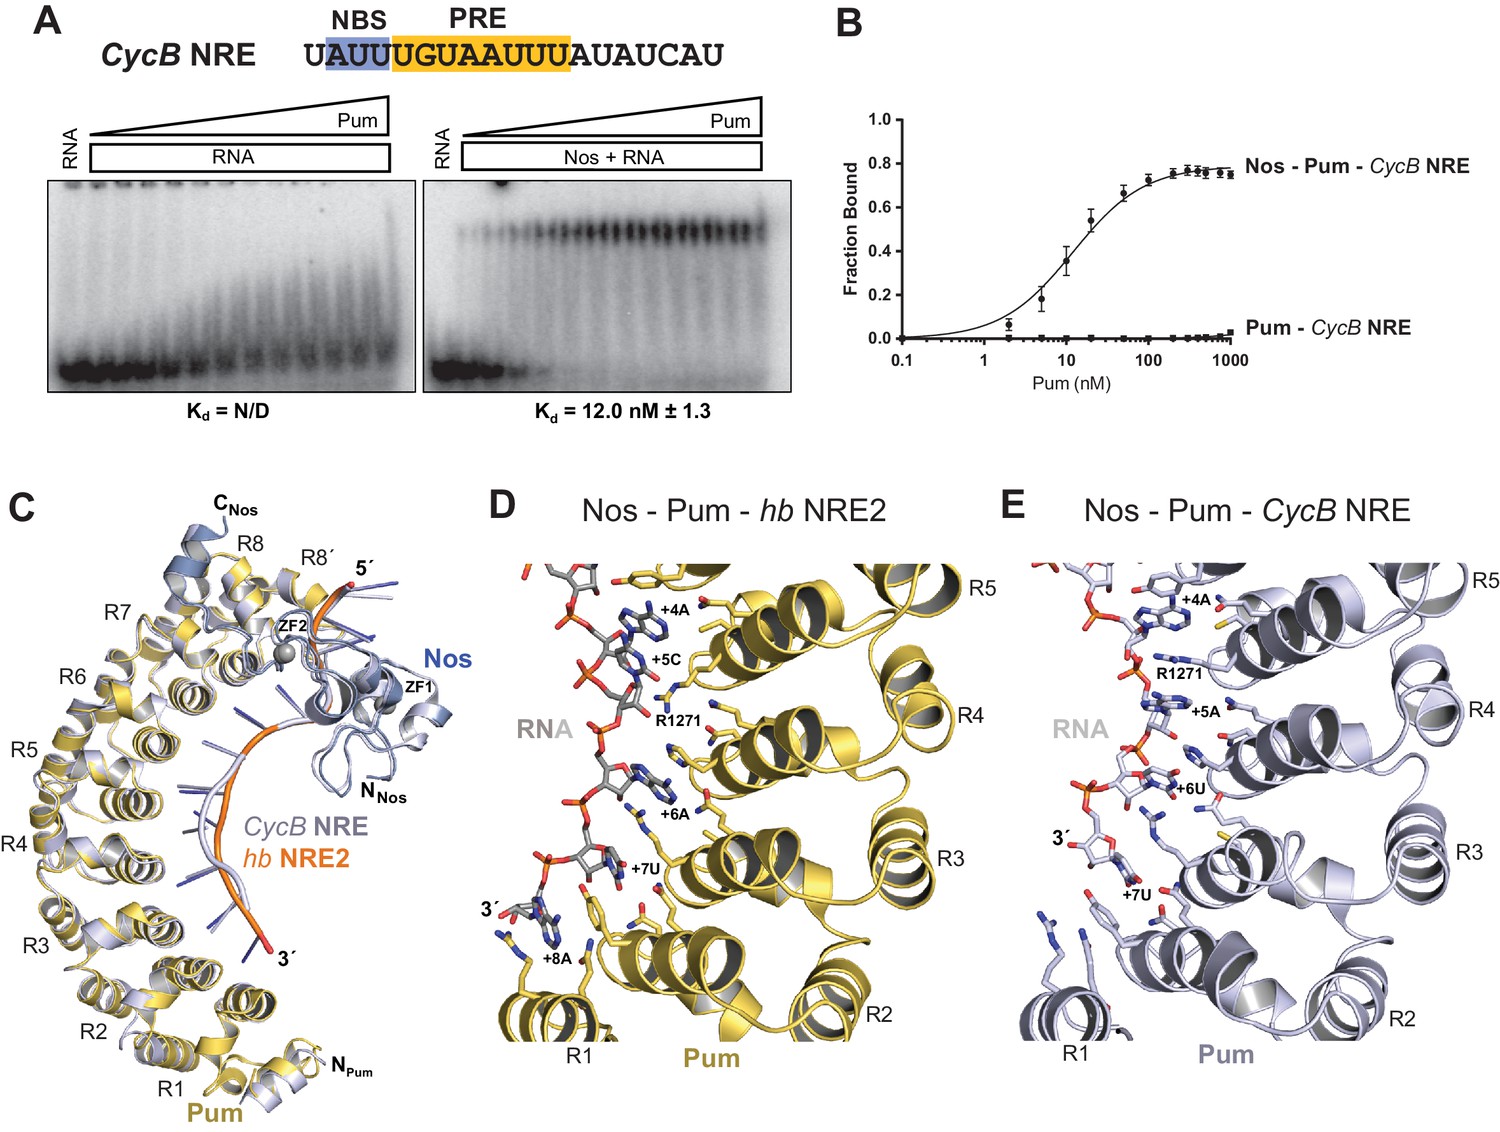
Nanos alters Pumilio RNA-binding specificity.
(A) A representative EMSA with increasing concentrations of Pum in the presence or absence of Nos, performed with radiolabeled CycB NRE RNA shown at the top. The PRE and the NBS are highlighted in yellow and blue, respectively. The mean observed Kd values with SD from triplicate experiments are shown below the gel. (B) Graph of fraction bound for complexes in panel A. Mean and SEM values from triplicate EMSAs are plotted. (C) Superposition of crystal structures of ternary complexes of Pum and Nos with hb NRE2 RNA (yellow protein with orange RNA) and CycB NRE RNA (light blue protein and RNA). Nos is represented as a blue ribbon diagram. Zn atoms are shown as grey spheres. (D) Interaction of Pum with nucleotides 4–8 of hb NRE2 RNA ternary complex. (E) Interaction of Pum with nucleotides 4–7 of CycB NRE RNA within the Nos-Pum-CycB NRE RNA ternary complex.
Figure 6—figure supplement 1
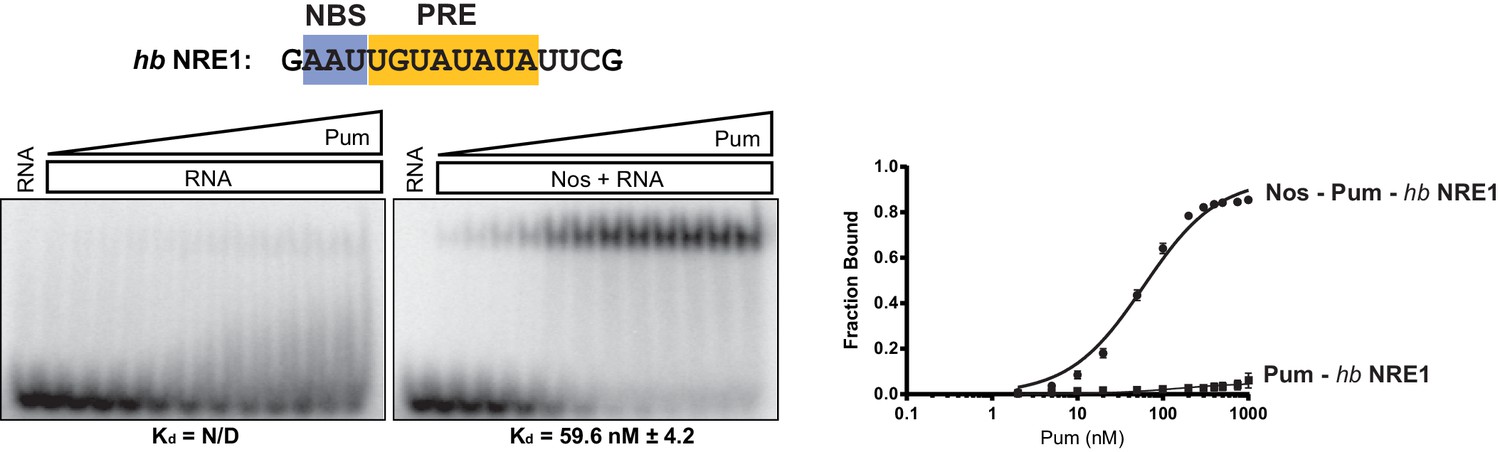
Nos promotes ternary complex formation with Pum and the hb NRE1 RNA.
Representative EMSA with increasing concentrations of Pum in the presence or absence of Nos. Radiolabeled RNA sequence used is shown at the top. The PRE and NBS sequences are highlighted in yellow and blue, respectively. The mean observed dissociation constant (Kd) with SD from triplicate experiments is shown below the gel. Graphs of the fraction bound of Nos-Pum-NRE and Pum–NRE complexes in response to titration of Pum. Mean and SEM values from triplicate EMSA experiments are plotted.
Figure 6—figure supplement 2
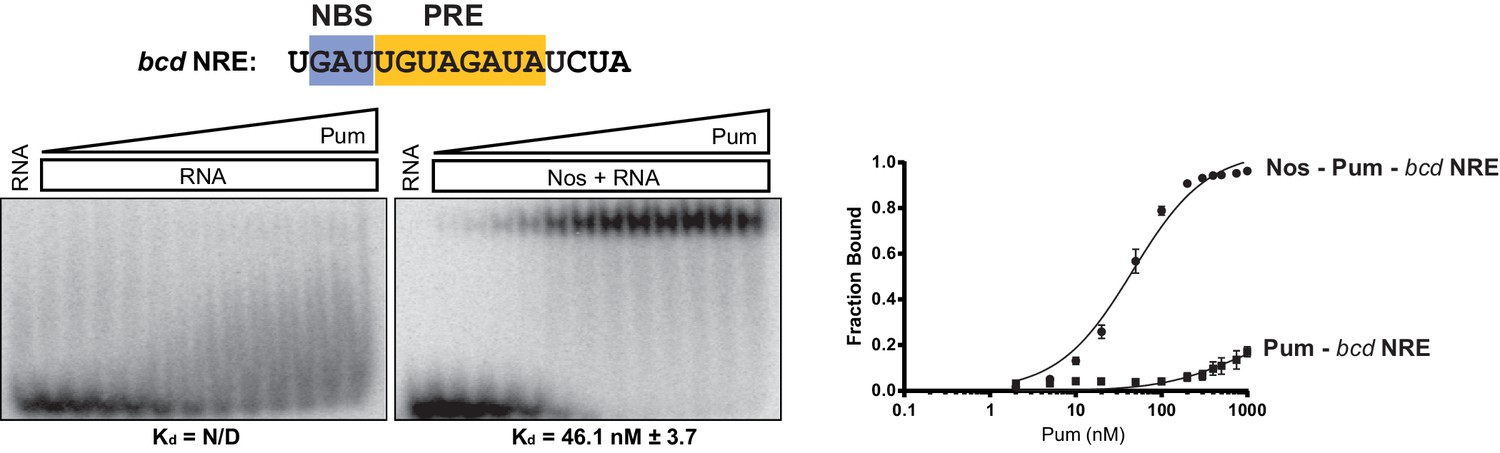
Nos promotes ternary complex formation with Pum and the bcd NRE RNA.
Representative EMSA with increasing concentrations of Pum in the presence or absence of Nos. Radiolabeled RNA sequence used is shown at the top. The PRE and NBS sequences are highlighted in yellow and blue, respectively. The mean observed dissociation constant (Kd) with SD from triplicate experiments is shown below the gel. Graphs of the fraction bound of Nos-Pum-NRE and Pum–NRE complexes in response to titration of Pum. Mean and SEM values from triplicate EMSA experiments are plotted.
Figure 6—figure supplement 3
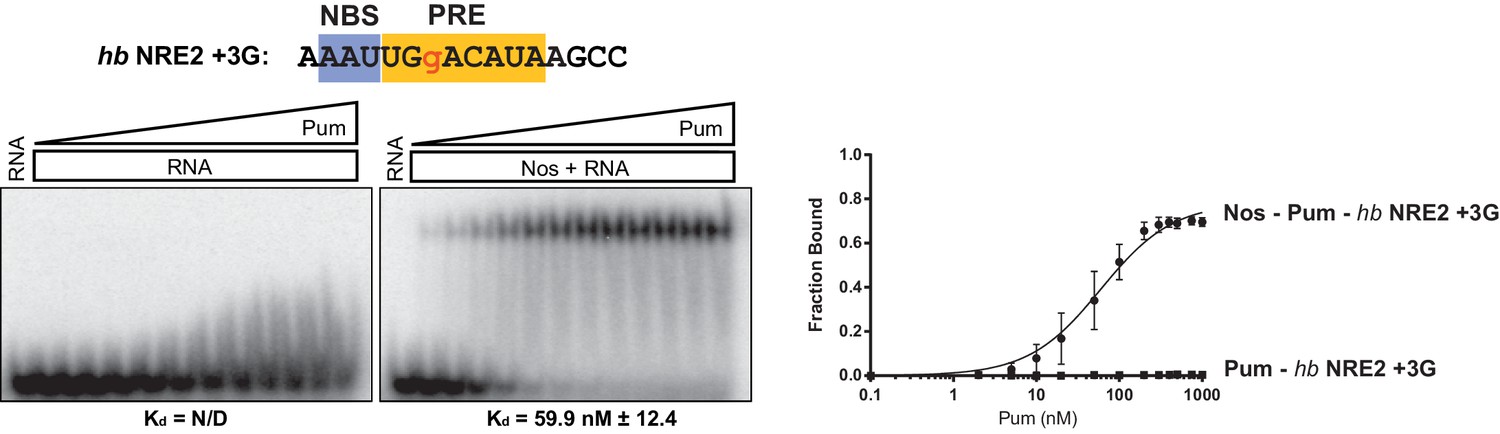
Nos promotes ternary complex formation with Pum and the hb NRE2 +3G RNA.
Representative EMSA with increasing concentrations of Pum in the presence or absence of Nos. Radiolabeled RNA sequence used is shown at the top. The PRE and NBS sequences are highlighted in yellow and blue, respectively, whereas mutated positions are in lowercase red letters. The mean observed dissociation constant (Kd) with SD from triplicate experiments is shown below the gel. Graphs of the fraction bound of Nos-Pum-NRE and Pum–NRE complexes in response to titration of Pum. Mean and SEM values from triplicate EMSA experiments are plotted.
Figure 6—figure supplement 4
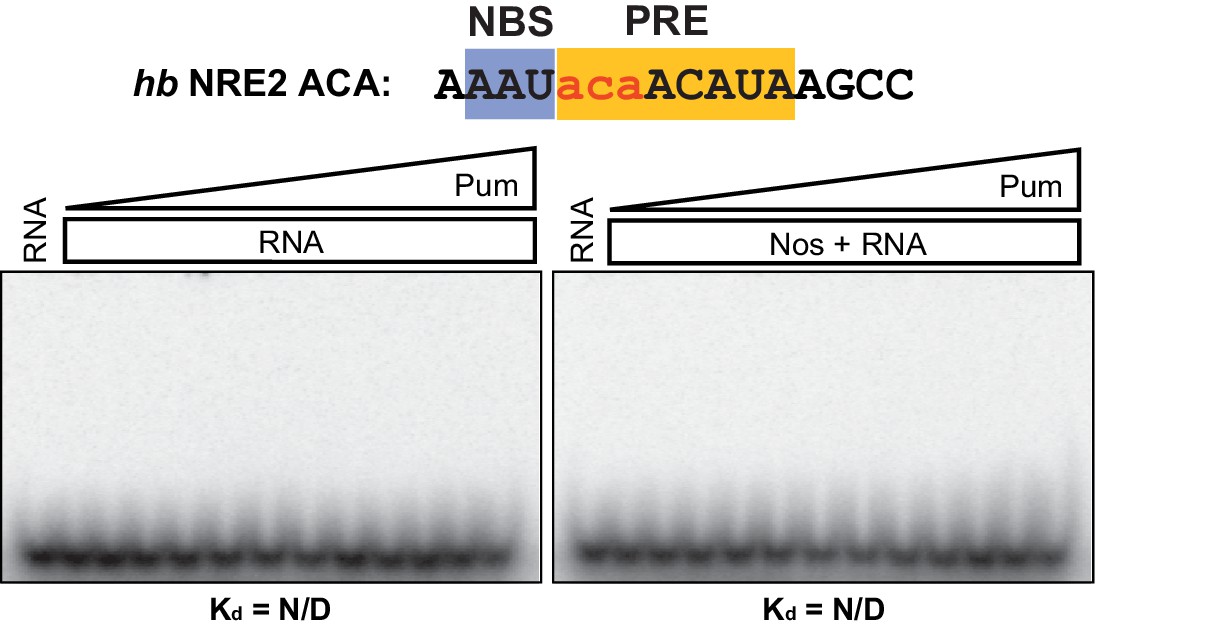
Nos and Pum do not bind the mutant hb NRE2 RNA.
Representative EMSAs with increasing concentrations of Pum in the presence or absence of Nos. Radiolabeled RNA sequence used is shown at the top. The PRE and NBS sequences are highlighted in yellow and blue, respectively, whereas mutated positions are in lowercase red letters. N/D indicates that a Kd was not determined.
Figure 6—figure supplement 5
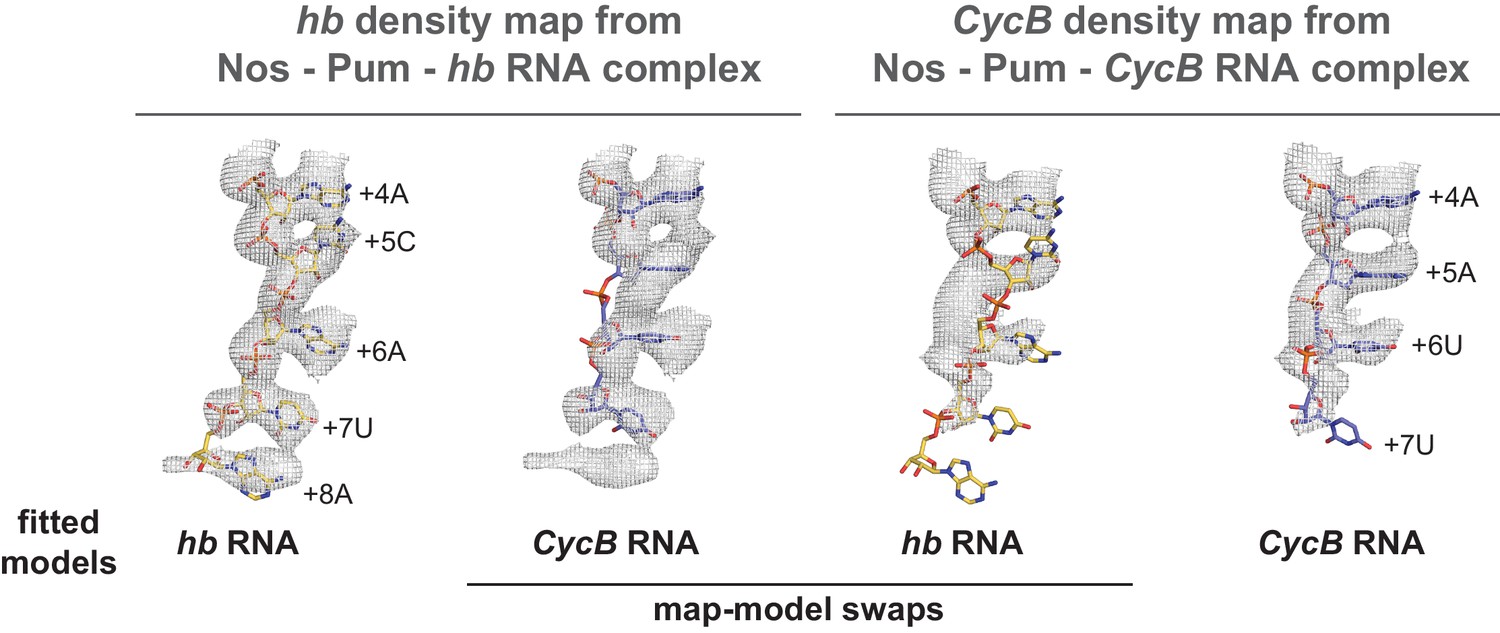
hb and CycB RNAs form different conformations in complex with Pum and Nos.
Crystal structures of hb and CycB RNAs from ternary complexes with Pum and Nos are shown superimposed with 2Fo-Fc electron density maps contoured at 1.2 σ. The models fit well with their respective maps (hb RNA:hb map or CycB RNA:CycB map), but fit poorly when superimposed with the alternate map (hb RNA:CycB map or CycB RNA:hb map).
Figure 7 with 4 supplements
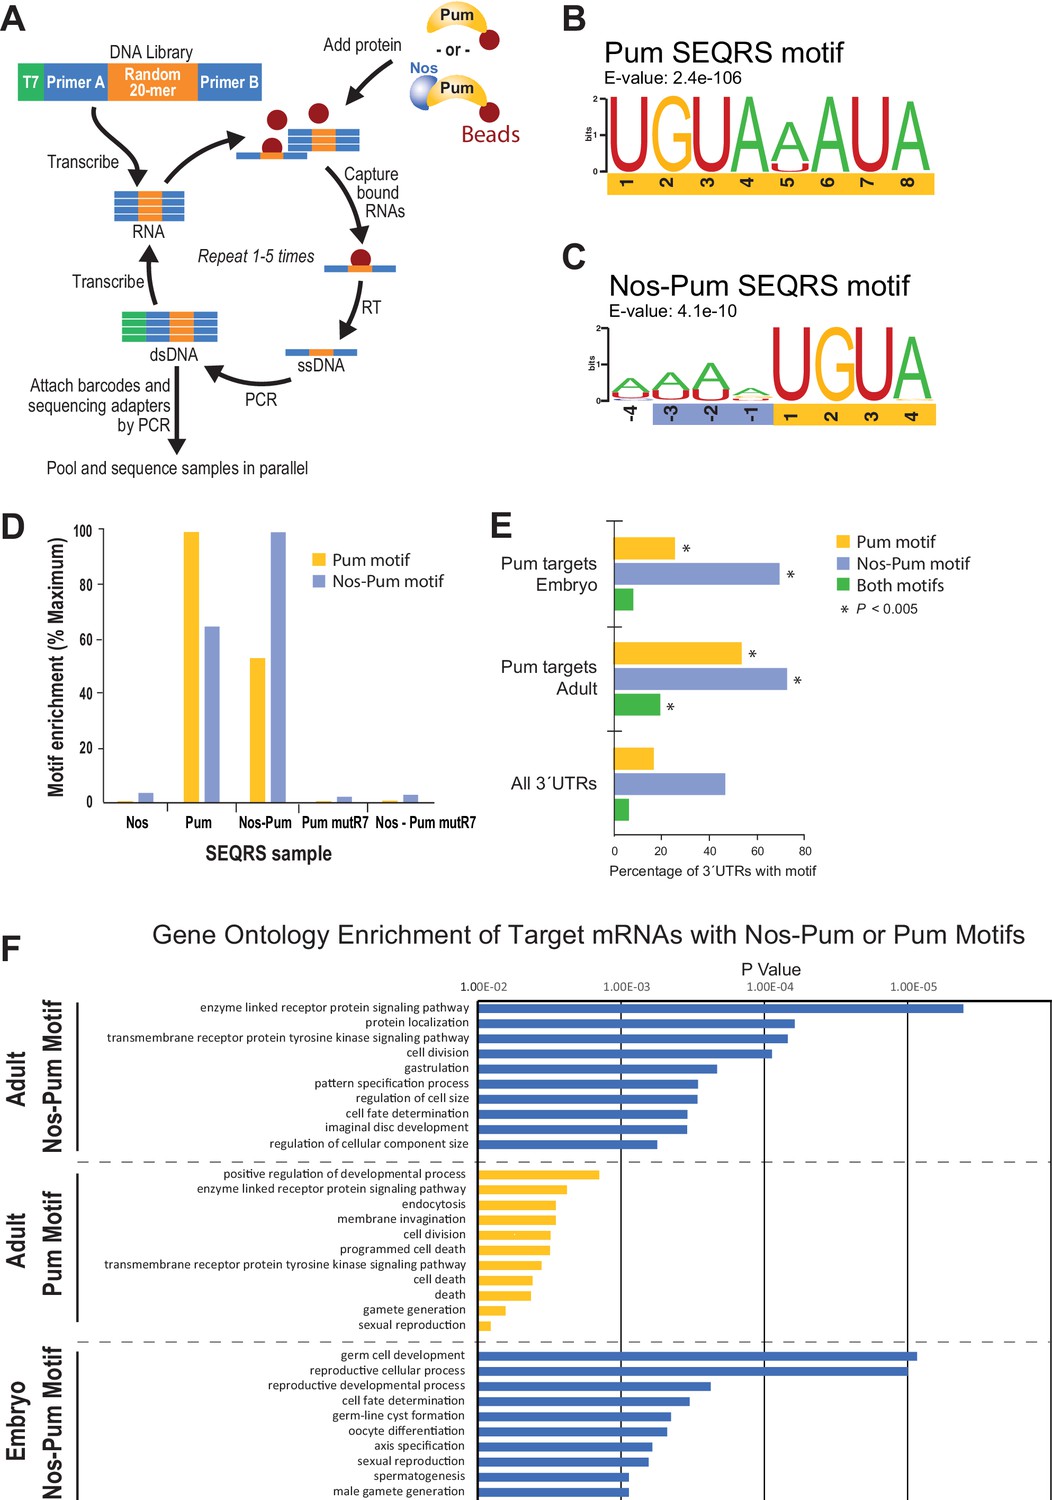
SEQRS analysis of Nos and Pum reveals specificity of RNA-binding activities.
(A) Diagram of the SEQRS procedure. (B) Motif from SEQRS analysis of Pum. (C) Motif from SEQRS analysis of Nos-Pum complex. (D) The Nos-Pum and Pum motifs are preferentially enriched by their corresponding samples relative to three negative control conditions. These controls are Nos alone, an RNA-binding defective Pum mutR7, or Nos combined with Pum mutR7. Sequences are reported in Figure 7—source data 2. (E) Enrichment of Pum and Nos-Pum binding sites in 3´UTRs bound by Pum in vivo (Gerber et al., 2006), relative to 3´UTRs of all annotated Drosophila mRNAs. P values were determined using a chi-squared test. Test values are provided in Figure 7—source data 2. (F) Gene ontology enrichment of target mRNAs from Drosophila adults or embryos with Nos-Pum or Pum motifs. The ten most significantly enriched terms are shown for each category of target mRNA, ranked according to P-values. Complete tables of the gene ontology enrichment analysis is provide in Figure 7—source data 1.
-
Figure 7—source data 1
Related to Figure 7F.
Gene ontology enrichment results for Pum targets from Drosophila adults and embryos that contain SEQRS-derived Pum motif, Nos-Pum motif, or both motifs. (A) Target gene lists used in gene ontology analysis. (B) Gene ontology enrichment analysis of target mRNAs from adults that contain the Nos-Pum motif. (C) Gene ontology enrichment analysis of target mRNAs from adults that contain the Pum motif. (D) Gene ontology enrichment analysis of target mRNAs from adults that contain the Nos-Pum and Pum motif. No categories were significantly enriched. (E) Gene ontology enrichment analysis of target mRNAs from embryos that contain the Nos-Pum motif. (F) Gene ontology enrichment analysis of target mRNAs from embryos that contain the Pum motif. No categories were significantly enriched. (G) Gene ontology enrichment analysis of target mRNAs from embryos that contain both the Nos-Pum and Pum motif. No categories were significantly enriched.
- https://doi.org/10.7554/eLife.17096.025
-
Figure 7—source data 2
Related to Figure 7A–E.
SEQRS sequences for Pum and Nos-Pum ternary complex and statistical analysis of motif enrichment in target mRNA 3´UTRs. (A) 20-mer sequences corresponding to the random region of the SEQRS library are reported for two replicates designated as A or B. (B) Top 100 enriched sequences for Pum and Nos-Pum complex. (C) Motif enrichment data and statistics for Pumilio target mRNAs from Drosophila embryos and adults based on Gerber et al, 2006. Sequences were obtained following five rounds of selection.
- https://doi.org/10.7554/eLife.17096.026
Figure 7—figure supplement 1

Comparison of the reproducibility of two replicates of Pum SEQRS.
Scatter plots of all possible 8-mer sequences following five rounds of selection. R2 values are based on linear regression analysis.
Figure 7—figure supplement 2

Comparison of sequences selected in SEQRS for Pum and the Nos-Pum complex.
Scatter plots of all possible 8-mer sequences following five rounds of selection. Orange data points indicate sequences corresponding to (a) hb NRE1, (b) bcd NRE, (c) CycB NRE, and (d) the hb NRE2. R2 values are based on linear regression analysis.
Figure 7—figure supplement 3
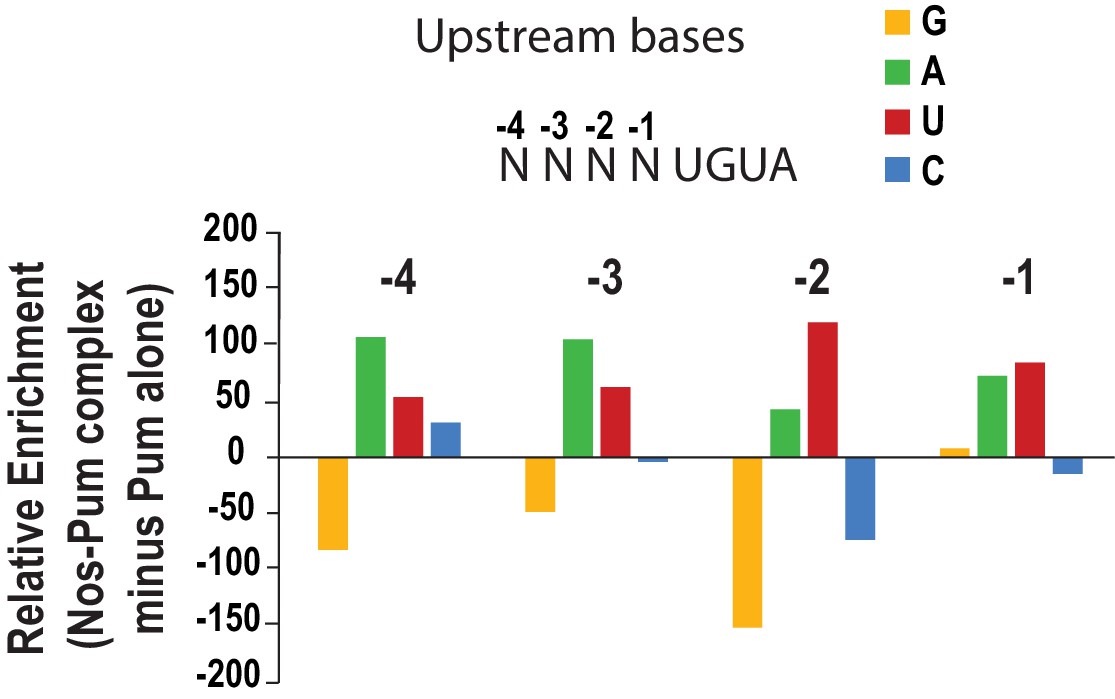
Analysis of upstream nucleotides enriched in SEQRS by Nos in the ternary complex relative to Pum alone.
Relative enrichment values for sequences matching the pattern 5´-NNNNUGUA for the Nos-Pum complex were calculated after subtraction of the sequences bound by Pum alone.
Figure 7—figure supplement 4
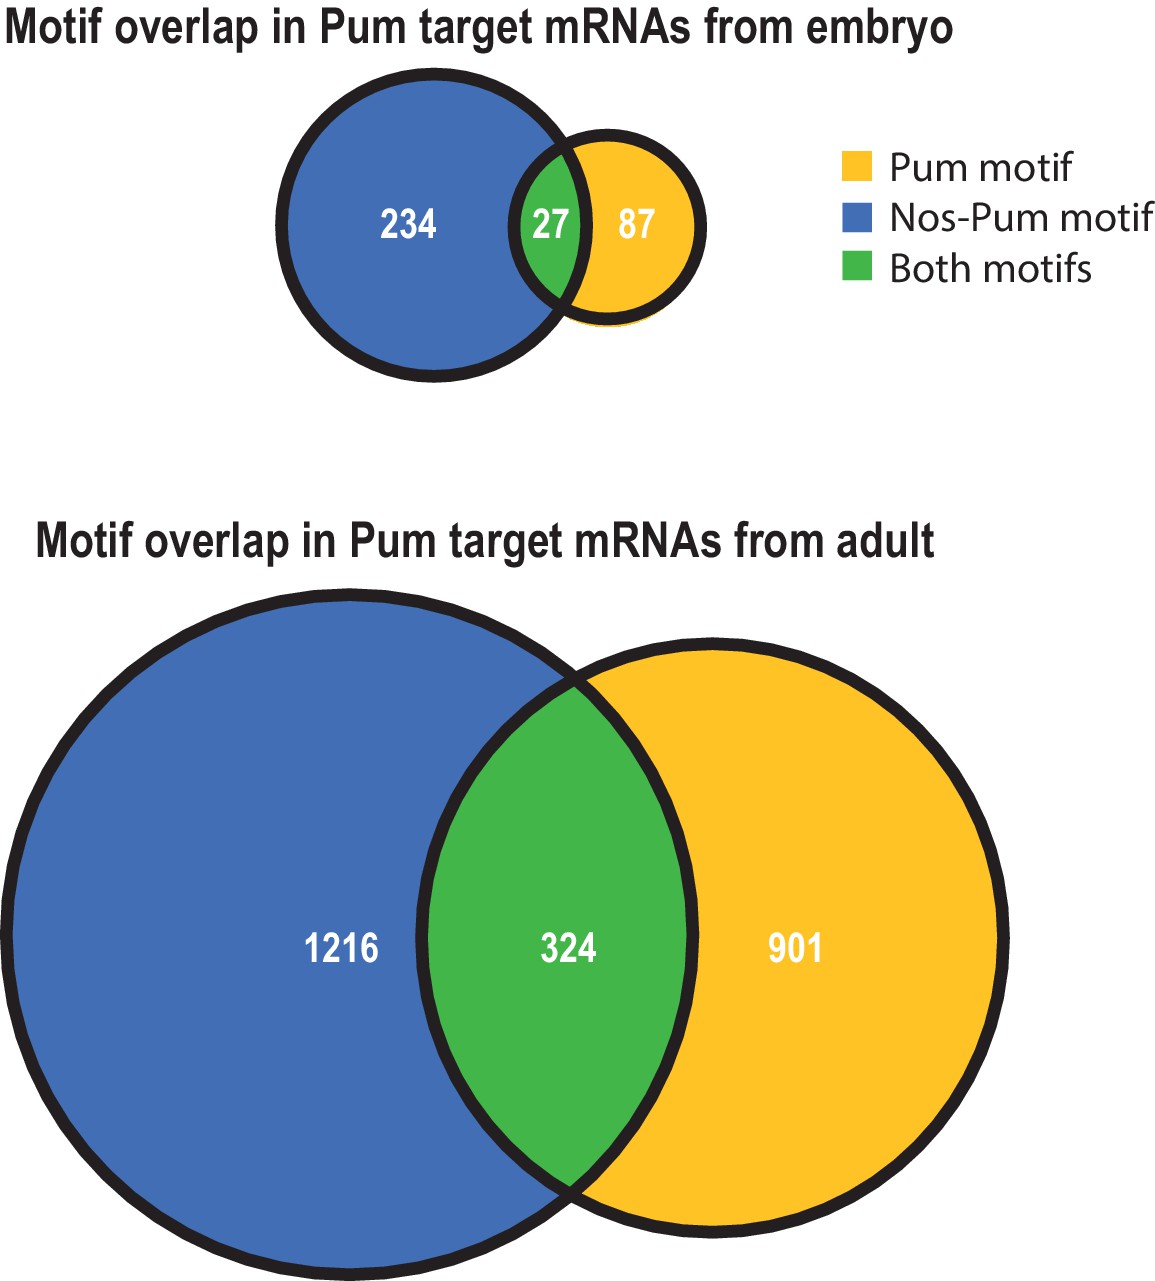
Venn diagrams reveal differences in the extent of motif overlap in Pum bound transcripts in embryo (above) versus adult (below) (Gerber et al., 2006).
https://doi.org/10.7554/eLife.17096.030
Figure 8
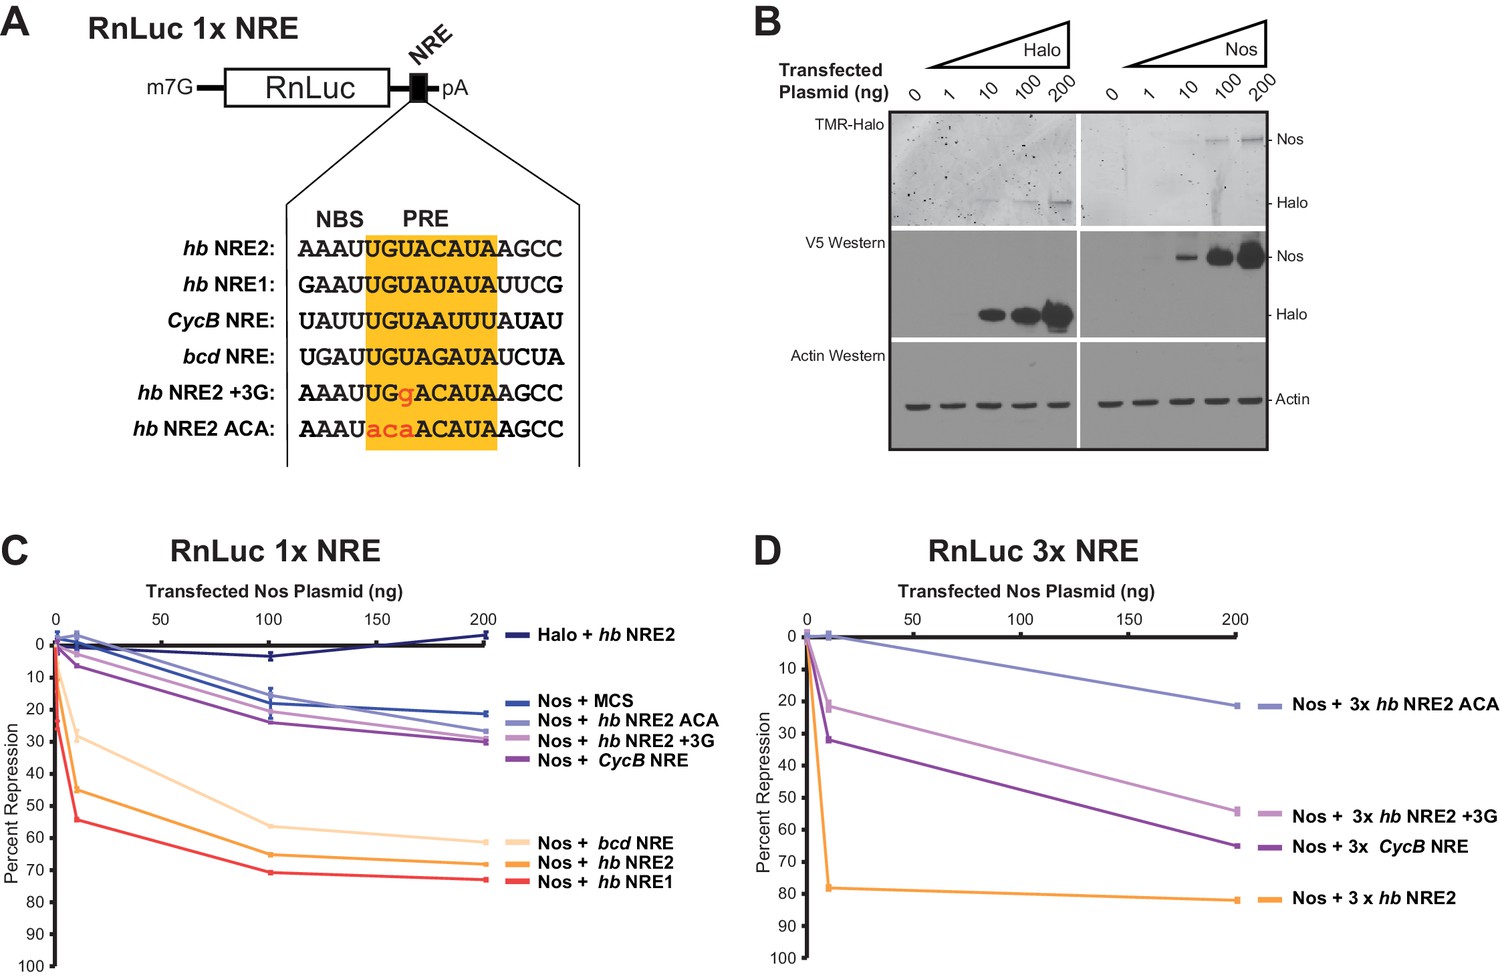
Nanos expands the Pumilio mRNA target repertoire in cells.
(A) Diagram of the RnLuc 1x NRE reporters with minimal 3´UTRs containing WT or mutant (+3G and ACA) hb NRE2 sequences, the hb NRE1 sequence, or NRE sequences from the Cyclin B (CycB) and bicoid (bcd) mRNAs. The PRE sequence is yellow, whereas mutated positions are in lowercase red letters. (B) Dose-dependent expression of Halo-tag (Halo) and Halo-Nos in cells from transfected Nos plasmid was detected by fluorescent labeling with TMR (top panel) and western blotting with anti-V5 antibody (middle panel). As a loading control, actin was detected by western blotting (bottom panel). (C) Percent repression values are graphed for the variant RnLuc 1x NRE reporters with increasing amounts of transfected Nos or negative control Halo. (D) Percent repression values are graphed for the indicated RnLuc 3x NRE reporters with increasing amounts of transfected Nos expression plasmid. For Panels C and D, mean and SEM values from quadruplicate samples are shown. Statistical analysis of the data is reported in Figure 8―source data 1.
-
Figure 8—source data 1
Values and statistical analysis of luciferase reporter assays.
The average value of the relative response ratio of Renilla to Firefly luciferase activities (Rn/FF), average percent repression values (%Repress), and Standard Errors of the Mean (SEM) are listed for each condition in the experiments (from 4 technical replicates, n = 4). The p-values (p-val) resulting from two-tailed t-tests between each measurement and the indicated control are represented in bold (significant) or italics (not significant). Experimental values derived from the same experiment are outlined in boxes.
- https://doi.org/10.7554/eLife.17096.032
Figure 9
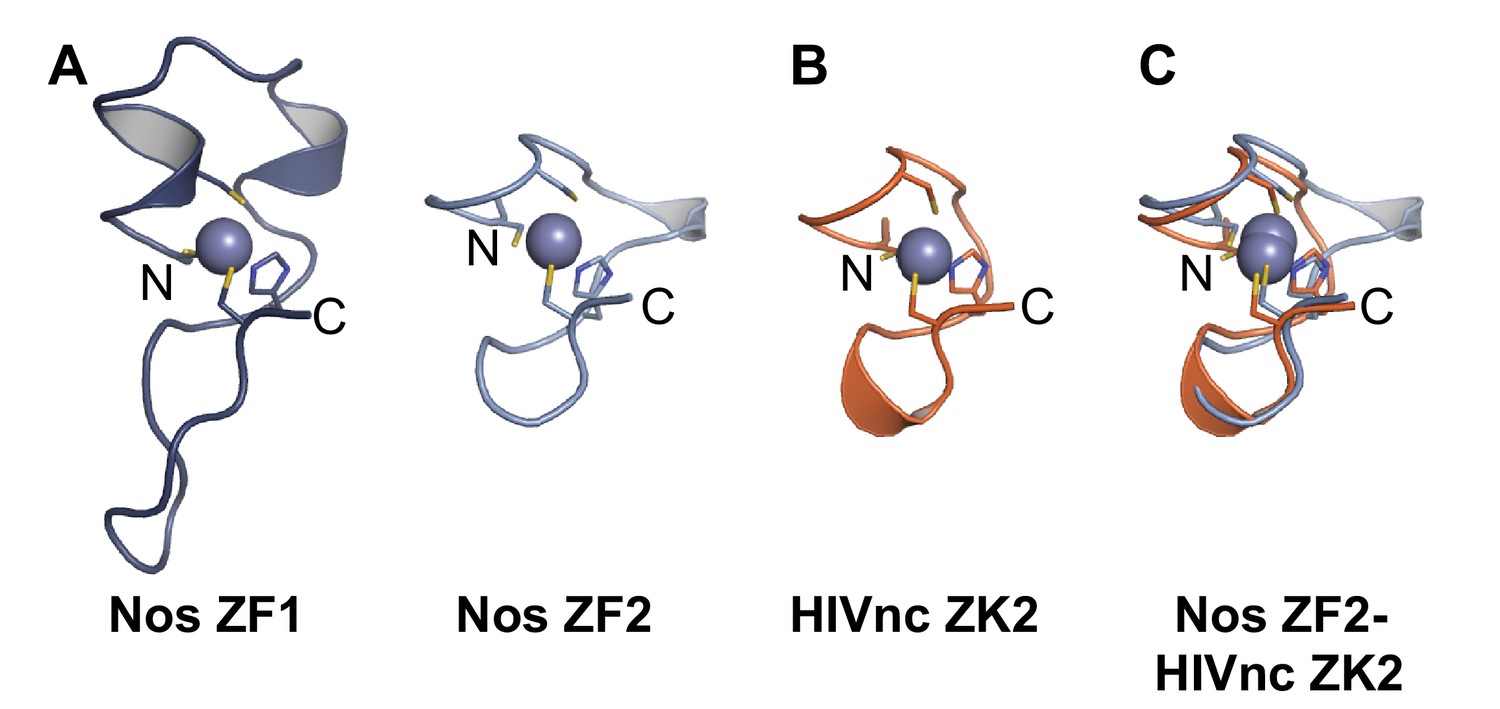
Nanos Zn finger 2 is structurally homologous to HIV nucleocapsid protein Zn knuckles.
(A) Ribbon diagrams of Nos ZFs 1 and 2. The Nos ZFs follow the same structural topology, but ZF1 has longer loops than ZF2 that are N- and C-terminal to the Zn-coordinating histidine residue. (B) Ribbon diagram of HIV nucleocapsid (HIVnc) protein Zn knuckle (ZK) 2. The solution structures of HIV ZK1 and ZK2 are similar (rmsd 0.72 Å, 136 atoms). (C) Superposition of Nos ZF2 and HIVnc ZK2 (rmsd 1.2 Å, 88 atoms).
Tables
Table 1
Data collection and refinement statistics.
| Pum-RNA | Pum-Nos-hb RNA | Pum-Nos-cycB RNA | ||
|---|---|---|---|---|
| PDB ID | 5KLA | 5KL1 | 5KL8 | |
| Data collection | ||||
| Space group | C2 | P6522 | P6522 | |
| Cell dimensions | a, b, c (Å) | 194.9, 29.5, 62.0 | 137.0, 137.0, 221.4 | 135.1, 135.1, 220.4 |
| a, b, g (°) | 90.0, 101.2, 90.0 | 90.0, 90.0, 120.0 | 90.0, 90.0, 120.0 | |
| Resolution (Å) | 50-1.14 (1.16-1.14) | 50-3.70 (3.83-3.70) | 50-4.00 (4.12-4.00) | |
| Rsym | 0.045 (0.387) | 0.128 (0.747) | 0.143 (0.779) | |
| I / σI | 36.9 (2.7) | 19.1 (2.8) | 13.0 (3.6) | |
| Completeness (%) | 99.7 (97.4) | 99.3 (93.2) | 99.3 (100.0) | |
| Redundancy | 4.2 (2.4) | 11.3 (11.0) | 8.9 (8.7) | |
| Refinement | ||||
| Resolution (Å) | 34.46 - 1.14 | 38.3 - 3.70 | 39.0 - 4.00 | |
| No. reflections | 127077 | 13562 | 10715 | |
| Rwork / Rfree (%) | 16.0 / 17.4 | 26.4 / 30.0 | 28.3 / 31.2 | |
| No. atoms | ||||
| Protein | 5532 | 3194 | 3021 | |
| RNA | 253 | 252 | 226 | |
| Water / Solvent | 401 | 0 | 0 | |
| B-factors | ||||
| Protein | 29.0 | 175.5 | 208.6 | |
| RNA | 20.5 | 150.4 | 183.4 | |
| Water / Solvent | 34.9 | - | - | |
| R.m.s deviations | ||||
| Bond lengths (Å) | 0.007 | 0.003 | 0.002 | |
| Bond angles (°) | 0.950 | 0.605 | 0.508 | |
-
*Values in parentheses are for highest-resolution shell.
Download links
A two-part list of links to download the article, or parts of the article, in various formats.
Downloads (link to download the article as PDF)
Open citations (links to open the citations from this article in various online reference manager services)
Cite this article (links to download the citations from this article in formats compatible with various reference manager tools)
Drosophila Nanos acts as a molecular clamp that modulates the RNA-binding and repression activities of Pumilio
eLife 5:e17096.
https://doi.org/10.7554/eLife.17096


