Combined ALK and MDM2 inhibition increases antitumor activity and overcomes resistance in human ALK mutant neuroblastoma cell lines and xenograft models
- Novartis Institutes for BioMedical Research, United States
- Novartis Institutes for BioMedical Research, Switzerland
- Genomics Institute of the Novartis Research Foundation, United States
Figures
Figure 1
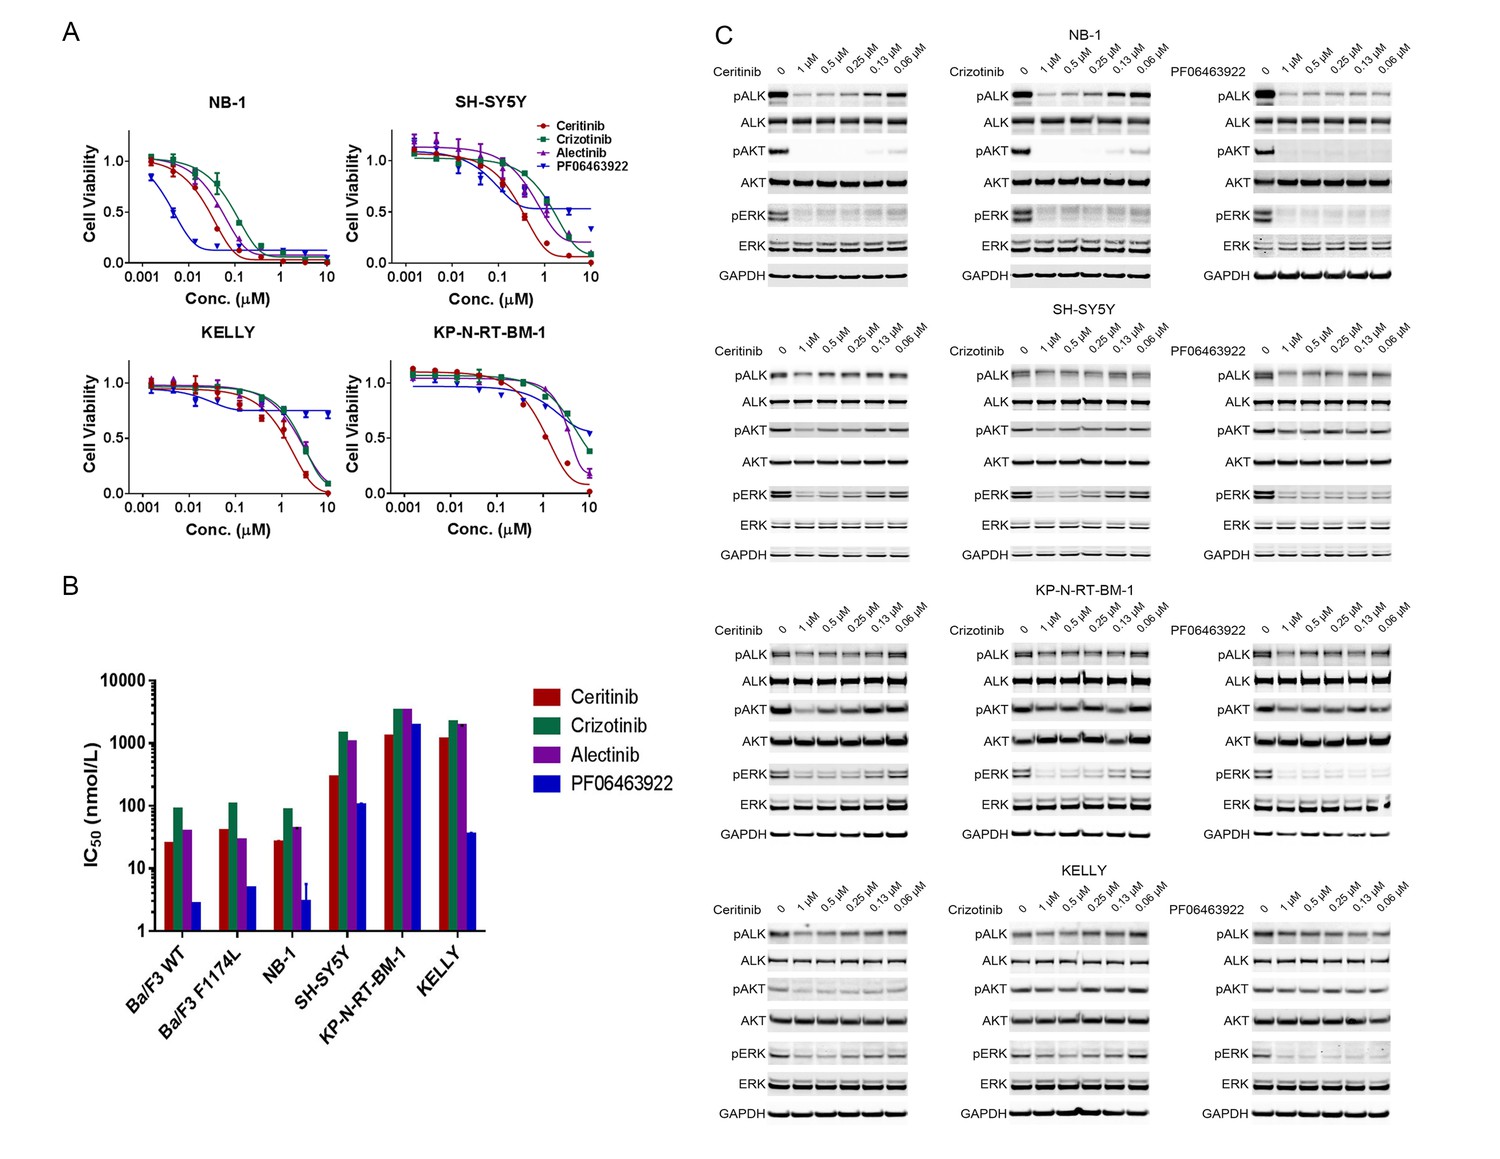
ALK inhibitors inhibit or partially inhibit the proliferation of neuroblastoma cell lines harboring ALK aberrations.
(A) Dose response curves of ALK-amplified or ALK mutant neuroblastoma cell lines exposed to the ALK inhibitors ceritinib, crizotinib, alectinib and PF06463922. Relative cell growth was quantified using CellTiter-Glo on day 6. Data are shown as mean ± SEM from three biological replicates. (B) IC50 values of ceritinib, crizotinib, alectinib and PF06463922 across Ba/F3 cells expressing wild-type or F1174L-mutated EML4-ALK and neuroblastoma cell lines harboring ALK aberrations. The data of Ba/F3 cells were reported by Zou and colleagues (28). (C) Inhibition of ALK autophosphorylation and downstream signaling by ceritinib, crizotinib and PF06463922 in ALK-amplified or ALK mutant neuroblastoma cell lines. Cells were harvested after treatment for 4 hr with the indicated compounds at different concentrations. Whole cell lysates were analyzed by Western blotting to detect the levels of ALK, AKT and ERK proteins and their phosphorylation.
Figure 2
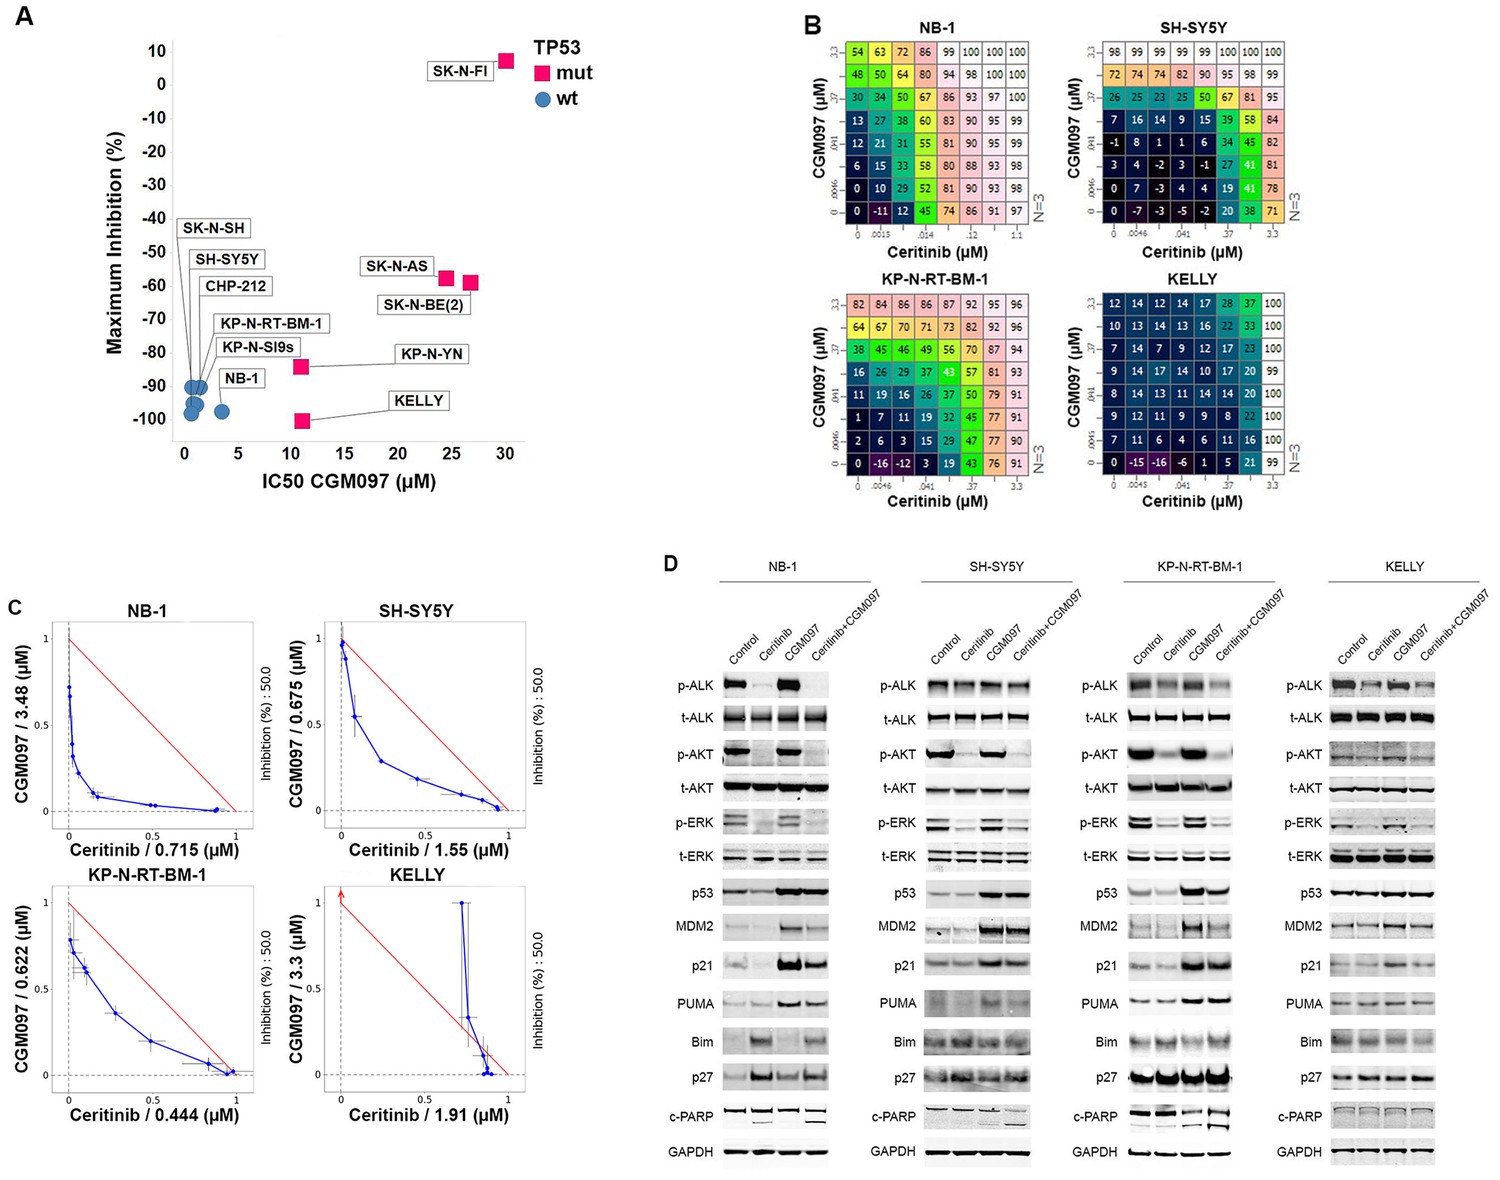
Combination of ceritinib with CGM097 leads to increased antitumor activity in TP53 wild-type neuroblastoma cell lines harboring ALK aberrations.
(A) Sensitivity of a panel of TP53 wild-type and mutant neuroblastoma cell lines to CGM097 treatment for 72 hr. Maximum percentages of inhibition are on the y-axis, and IC50 values are on the x-axis. (B) Growth effects of combining ceritinib and CGM097 in ALK-amplified or ALK mutant neuroblastoma cells. In each grid, the effects correspond to increasing doses of CGM097 on the y-axis and increasing doses of ceritinib on the x-axis. All remaining points on the grid display the results of the combination of the two inhibitors that correspond to the single-agent concentrations denoted on the two axes. Values are displayed as percentage of inhibition based on comparisons made with the Day 3 untreated controls. (C) Isobologram analysis of the data in (B). Doses of CGM097 are on the y-axis, and ceritinib on the x-axis. The red straight line in each panel defines all the pairs of doses of ceritinib and CGM097 that lead to 50% of proliferation inhibition from simple additivity. The points on the blue curve represent the actual doses of ceritinib and CGM097, when combined, to achieve 50% of inhibition. The blue curves of the TP53 wild-type cell lines bow under the red lines, indicating the combination of ceritinib and CGM097 is synergistic. (D) Enhanced apoptosis as evidenced by increased levels of cleaved PARP in TP53 wild-type neuroblastoma cells with ALK amplification or mutation when treated with ceritinib in combination with CGM097. Cells were incubated with DMSO, 1 µM ceritinib, 2 µM CGM097 and 1 µM ceritinib plus 2 µM CGM097 for 16 hr.
Figure 3
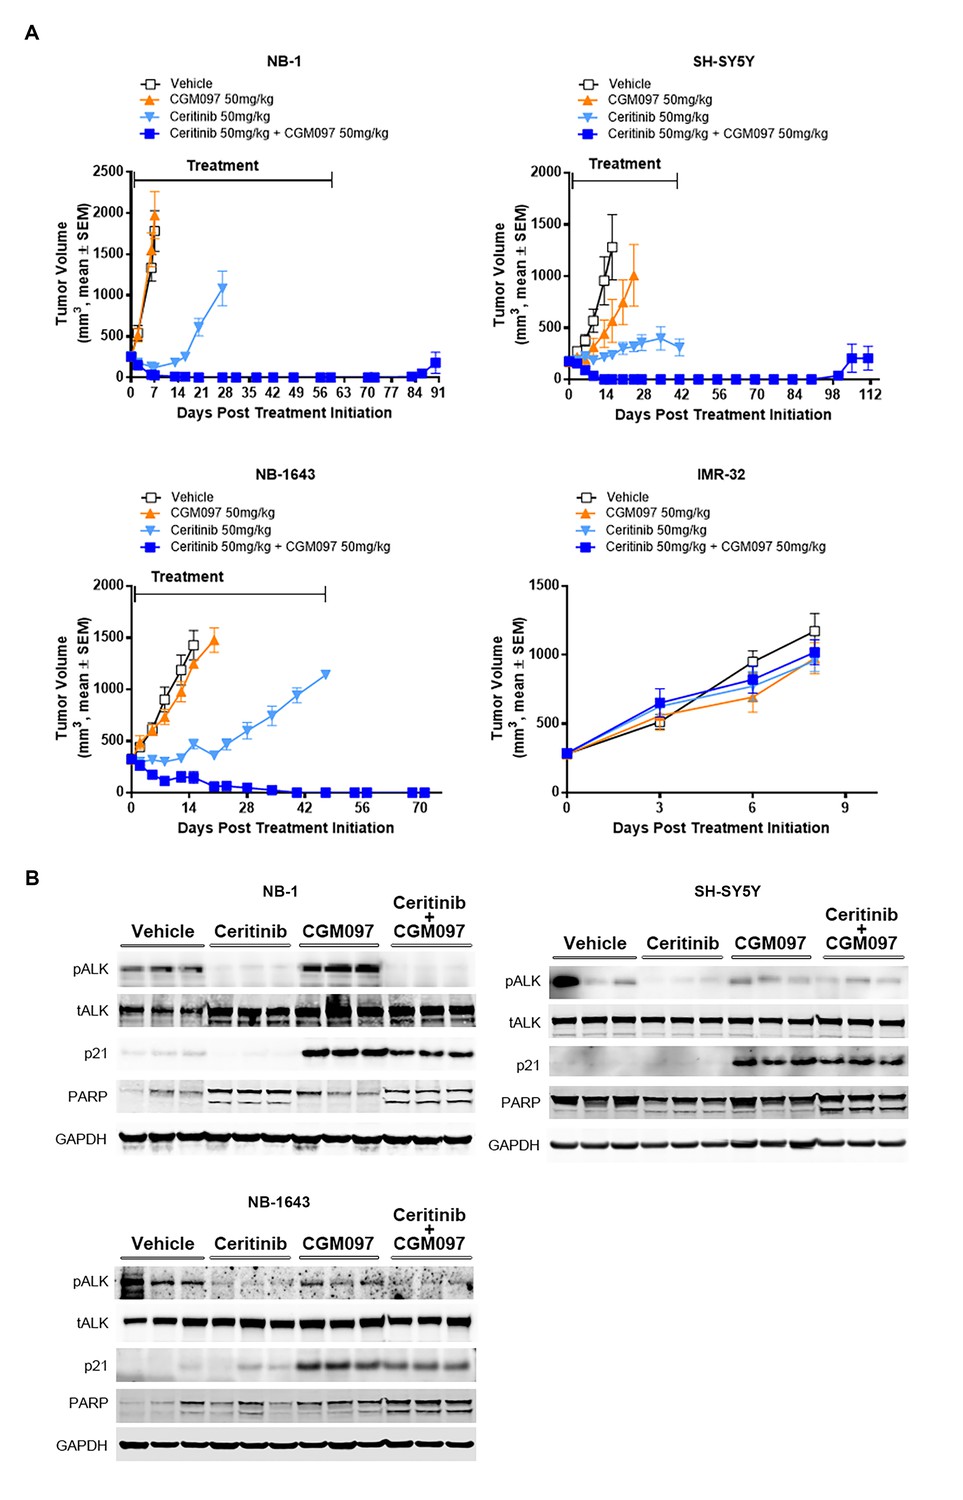
Combination of ceritinib with CGM097 leads to increased antitumor activity in TP53 wild-type neuroblastoma xenograft tumors harboring ALK aberrations.
(A) The improved in vivo efficacy in the NB-1, SH-SY5Y and NB-1643 xenograft mouse models that harbor wild-type TP53 and ALK aberrations when ceritinib was combined with CGM097 and lack of antitumor activity of this combination in the IMR-32 xenograft tumors that harbor wild-type TP53 and ALK. The neuroblastoma cell lines NB-1, SH-SY5Y and IMR-32 were implanted into the flanks of nude mice and NB-1643 in SCID mice. Animals were randomized into four groups when the average tumor volume was 200–300 mm3 and received vehicle, ceritinib (50 mg/kg), CGM097 (50 mg/kg) or both inhibitors in combination. Combination of ceritinib with CGM097 was withdrawn on day 60 and day 45 for NB-1 and SH-SY5Y, respectively, to allow tumor regrowth. Tumor dimensions and body weights were measured at the time of randomization and twice weekly thereafter for the study duration. Average tumor volume and SEM are shown as a function of time. (B) Inhibition of phospho-ALK, induction of p21 and increased levels of cleaved PARP in NB-1, SH-SY5Y and NB-1643 xenograft tissues treated with ceritinib in combination with CGM097. Animals were treated with vehicle, ceritinib (50 mg/kg), CGM097 (50 mg/kg) or both inhibitors in combination for 3 days. Tumor tissues were recovered 4 hr after the last dose treatment and analyzed by Western blotting.
-
Figure 3—source data 1
Details of human neuroblastoma cell line xenograft studies.
- https://doi.org/10.7554/eLife.17137.006
Figure 4

The transcription of ribosomal proteins and the protein level of MYCN are increased in NB-1 ceritinib-resistant tumors.
(A) Upregulation of transcription of ribosomal protein components in NB-1 ceritinib-resistant tumors. RPS and RPL genes encode proteins of the small and large ribosomal subunits, respectively. The lower panel is identical to the upper panel except that the upregulated genes are labeled with their gene symbols. NB-1 tumors that progressed under treatment with 50 mg/kg ceritinib and NB-1 tumors treated with vehicle as shown in Figure 3A were analyzed by RNA-Seq. Gene expression levels quantified by FPKM are shown as the average from two individual tumors in each group. FPKM, Fragments Per Kilobase of transcript per Million fragments mapped. (B) Upregulation of MYCN protein in NB-1 ceritinib-resistant tumors. Tissues of NB-1 tumors that progressed during treatment with 50 mg/kg ceritinib and NB-1 tumors treated with vehicle as shown in Figure 3A were recovered and analyzed by Western blot analysis. Veh, vehicle-treated tumors. Res, ceritinib-resistant tumors.
Figure 5 with 2 supplements
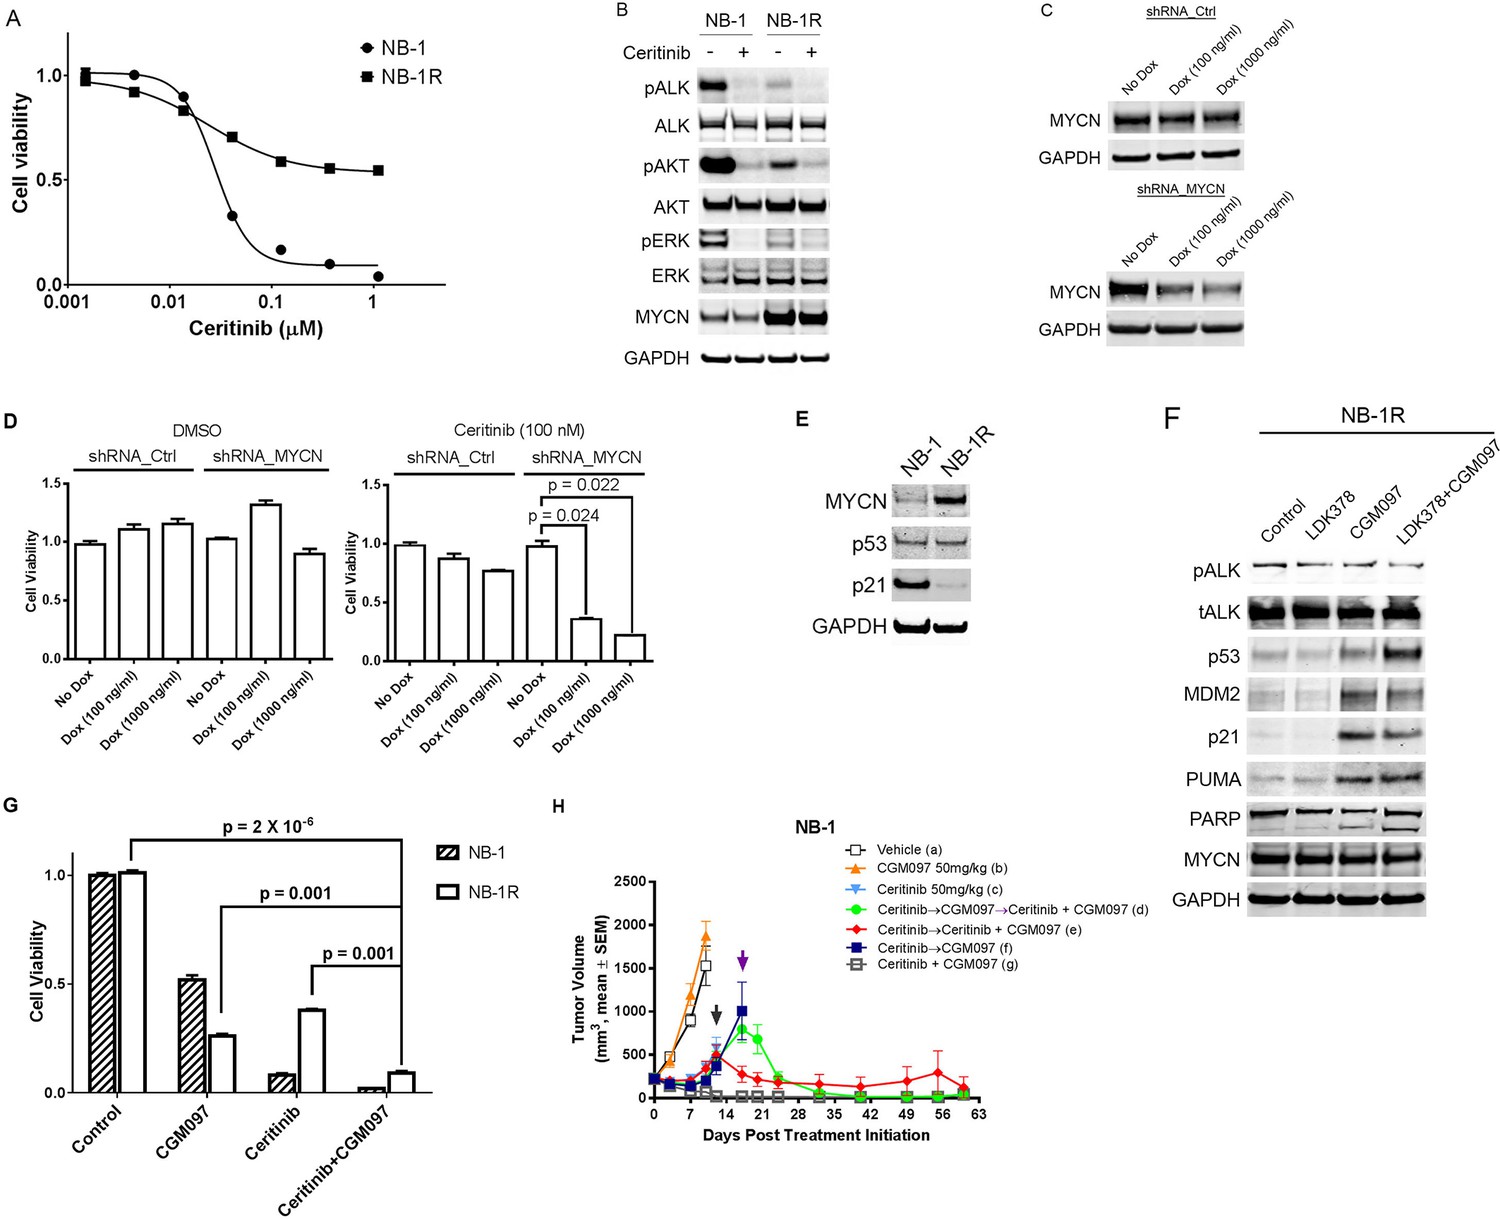
CGM097 restores ceritinib sensitivity in NB-1 cells that develop resistance to ceritinib as a result of increased level of MYCN.
(A) Decreased sensitivity of NB-1R cells to ceritinib in vitro. NB-1R cells were derived from NB-1 cells by growing them in 200 nM ceritinib for 3 weeks. (B) Upregulation of MYCN in NB-1R cells. NB-1 parental and resistant cells were treated with ceritinib for 2 hr, and cell extracts were immunoblotted to detect the indicated proteins. (C) Downregulation of MYCN by a doxycycline-inducible MYCN-specific shRNA in NB-1R cells. Lentiviral doxycycline-inducible vectors containing non-target control sequence or shRNA against MYCN were introduced into NB-1R cells. The cells were exposed to doxycycline at increased concentrations for 7 days, and cell extracts were immunoblotted with MYCN antibodies. Dox, Doxycycline. (D) Restored sensitivity of NB-1R cells to ceritinib by knocking down the expression of MYCN. Doxycycline-inducible control and MYCN-specific shRNAs were introduced into NB-1R cells. The cells were treated with DMSO or 0.2 µM ceritinib in the presence or absence of doxycycline for 14 days. Relative cell growth was quantified using the CellTiter-Glo assay. Data are shown as mean ± SEM from three biological replicates. (E) Downregulation of p21 in NB-1R cells. Cell lysates of parental and resistant cells were immunoblotted to detect the indicated proteins. (F) Restored level of p21 in NB-1R cells treated with CGM097. NB-1R cells were treated for 16 hr with 0.2 µM ceritinib alone, 1 µM CGM097 alone, or the two compounds in combination. Cells were harvested after the treatments, and cell lysates were analyzed by Western blotting. (G) Increased anti-proliferative activity of ceritinib in combination with CGM097 in NB-1R cells. NB-1 parental and NB-1R cells were treated with 0.2 µM ceritinib alone, 1 µM CGM097 alone, or the two compounds in combination for 6 days. Relative cell growth was quantified using the CellTiter-Glo assay. Data are shown as mean ± SEM from three biological replicates. (H) Restored ability of ceritinib to inhibit ceritinib-resistant NB-1 tumor growth when it was combined with CGM097 in vivo. Animals were randomized into treatment groups following NB-1 cell implantation when the average tumor volume was ~ 220–250 mm3, and treatments were initiated. On day 10, mice in vehicle and CGM097-treated groups were taken down. On day 12, tumors in mice treated with 50 mg/kg ceritinib progressed, and they were randomized into the following groups: (1) ceritinib treatment was terminated and CGM097 treatment was started at the time point indicated by black arrow (dark blue curve), (2) ceritinib treatment was terminated and CGM097 treatment was started at the time point indicated by black arrow, and then treatment with ceritinib and CGM097 combination was started at the time point indicated by purple arrow (green curve), (3) ceritinib treatment was terminated and ceritinib and CGM097 combination treatment was started at the time point indicated by black arrow (red curve). All these treatments ended on day 60. Average tumor volume and SEM are shown as a function of time.
-
Figure 5—source data 1
Details of human NB-1 cell line xenograft studies.
- https://doi.org/10.7554/eLife.17137.009
Figure 5—figure supplement 1
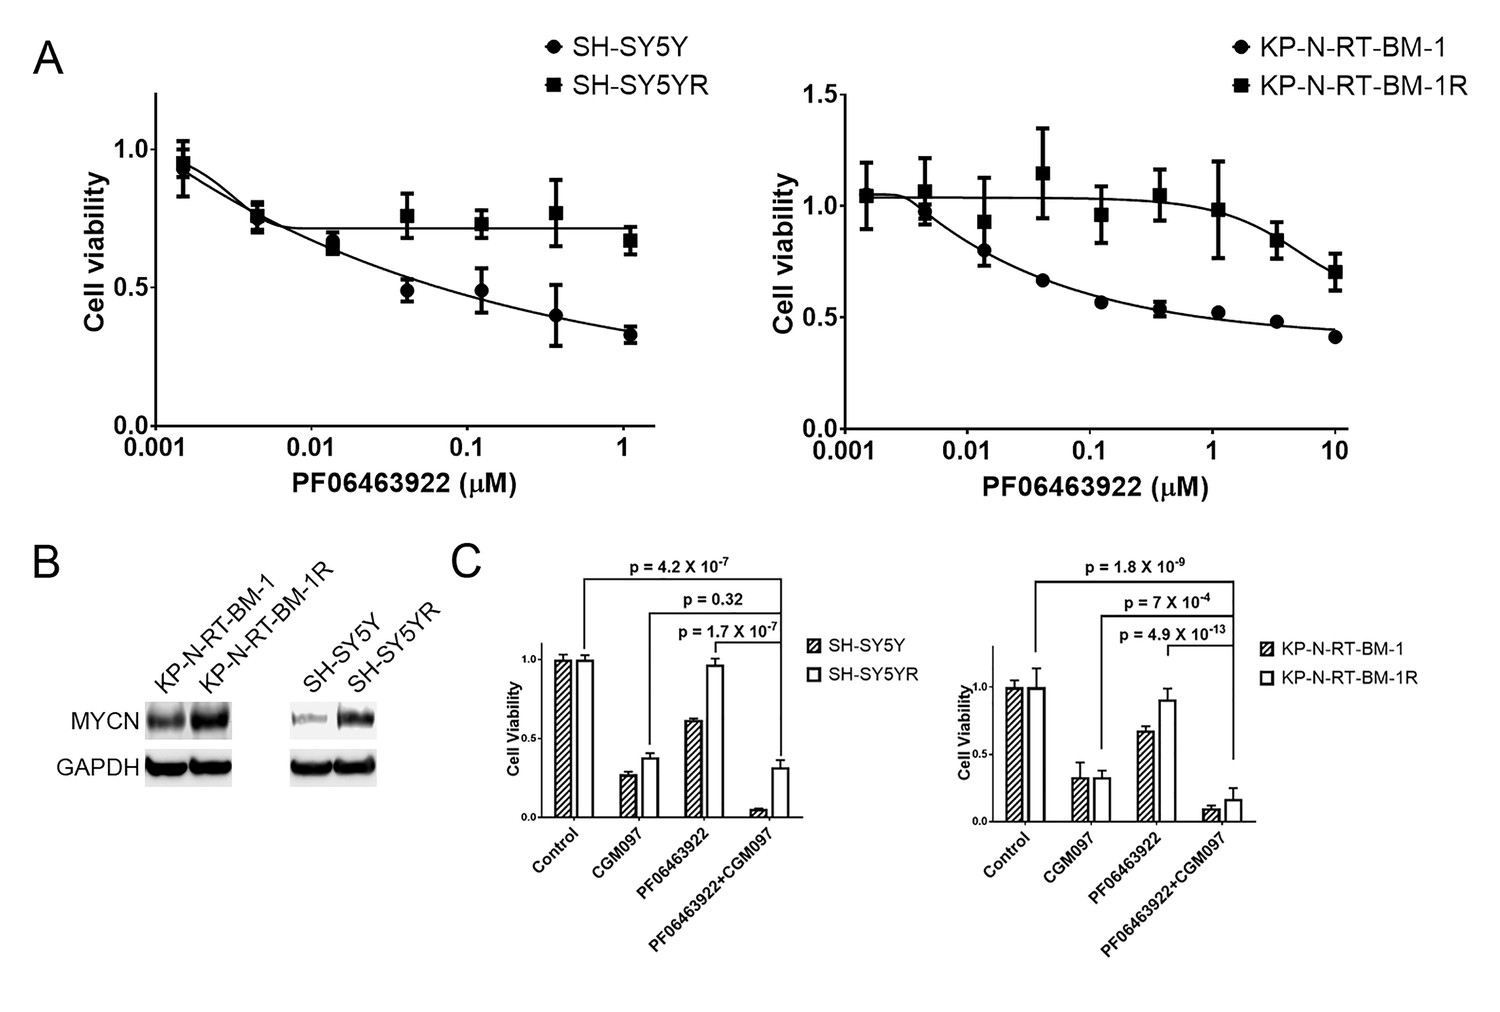
MYCN is upregulated in SH-SY5Y and KP-N-RT-BM-1 cells that are resistant to PF06463922 and CGM097 overcomes PF06463922 resistance.
(A) Decreased sensitivity of SH-SY5YR and KP-N-RT-BM-1R cells to PF06463922. SH-SY5YR and KP-N-RT-BM-1R cells were derived from their parental cells by growing them in 1 µM PF06463922 for 3 to 4 months. (B) Upregulation of MYCN in SH-SY5YR and KP-N-RT-BM-1R cells. Extract of SH-SY5Y and KP-N-RT-BM-1 parental and resistant cells were immunoblotted to detect the indicated proteins. (C) Increased anti-proliferative activity of PF06463933 in combination with CGM097 in SH-SY5YR and KP-N-RT-BM-1R cells. SH-SY5Y and KP-N-RT-BM-1 parental and resistant cells were treated with 1 µM PF06463922 alone, 1 µM CGM097 alone, or the two compounds in combination for 6 days. Relative cell growth was quantified using the CellTiter-Glo assay. Data are shown as mean ± SEM from five to ten biological replicates.
Figure 5—figure supplement 2
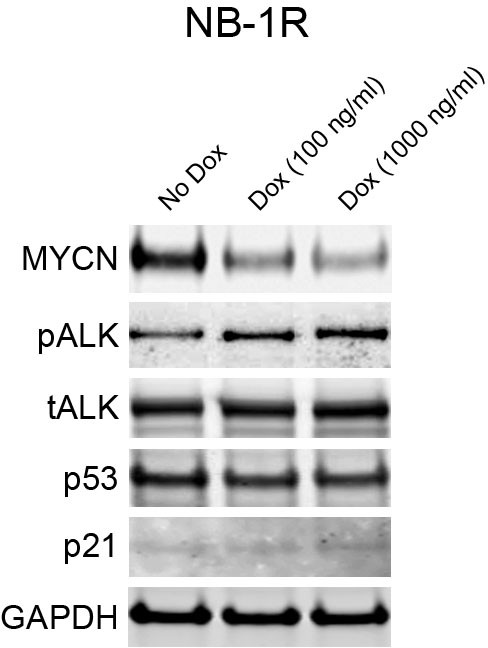
Downregulation of MYCN increases the level of phospho-ALK in NB-1R cells.
Lentiviral doxycycline-inducible vectors containing shRNA against MYCN were introduced into NB-1R cells. The cells were exposed to doxycycline at increased concentrations for 3 days, and cell extracts were immunoblotted to detect the indicated proteins. Dox, Doxycycline.
Tables
Table 1
ALK-amplified, ALK-mutant and ALK wild-type neuroblastoma cell lines of varying TP53 and MYCN status.
| Cell line | ALK status | MYCN status | TP53 status |
|---|---|---|---|
| NB-1 | Amp | Amp | Wt |
| SH-SY5Y | F1174L | Non-Amp | Wt |
| KP-N-RT-BM-1 | F1174L | Amp | Wt |
| NB-1643 | R1275Q | Amp | Wt |
| IMR-32 | Wt | Amp | Wt |
| KELLY | F1174L | Amp | Mut |
-
Amp, amplified; Non-Amp, non-amplified; Wt, wild type; Mut, mutant
Additional files
-
Supplementary file 1
Gene expression levels in NB-1 xenograft tumors.
NB-1 tumors that progressed under treatment with 50 mg/kg ceritinib and NB-1 tumors treated with vehicle as shown in Figure 3A were analyzed by RNA-Seq. Gene expression was quantified by FPKM. FPKM, Fragments Per Kilobase of transcript per Million fragments mapped.
- https://doi.org/10.7554/eLife.17137.012
-
Source code 1
R code for the statistical analysis shown in Figure 5D.
- https://doi.org/10.7554/eLife.17137.013
-
Source code 2
R code for the statistical analysis shown in Figure 5G.
- https://doi.org/10.7554/eLife.17137.014
-
Source code 3
R code for the statitical analysis shown in Figure 5—figure supplement 1.
- https://doi.org/10.7554/eLife.17137.015
Download links
A two-part list of links to download the article, or parts of the article, in various formats.
Downloads (link to download the article as PDF)
Open citations (links to open the citations from this article in various online reference manager services)
Cite this article (links to download the citations from this article in formats compatible with various reference manager tools)
Combined ALK and MDM2 inhibition increases antitumor activity and overcomes resistance in human ALK mutant neuroblastoma cell lines and xenograft models
eLife 6:e17137.
https://doi.org/10.7554/eLife.17137


