Satb2 determines miRNA expression and long-term memory in the adult central nervous system
- Medical University of Innsbruck, Austria
- University of Innsbruck, Austria
- Technical University Braunschweig, Germany
- AG Neuroinflammation and Neurodegeneration (NIND), Germany
- German Center for Neurodegenerative Diseases, Germany
Figures
Figure 1 with 2 supplements
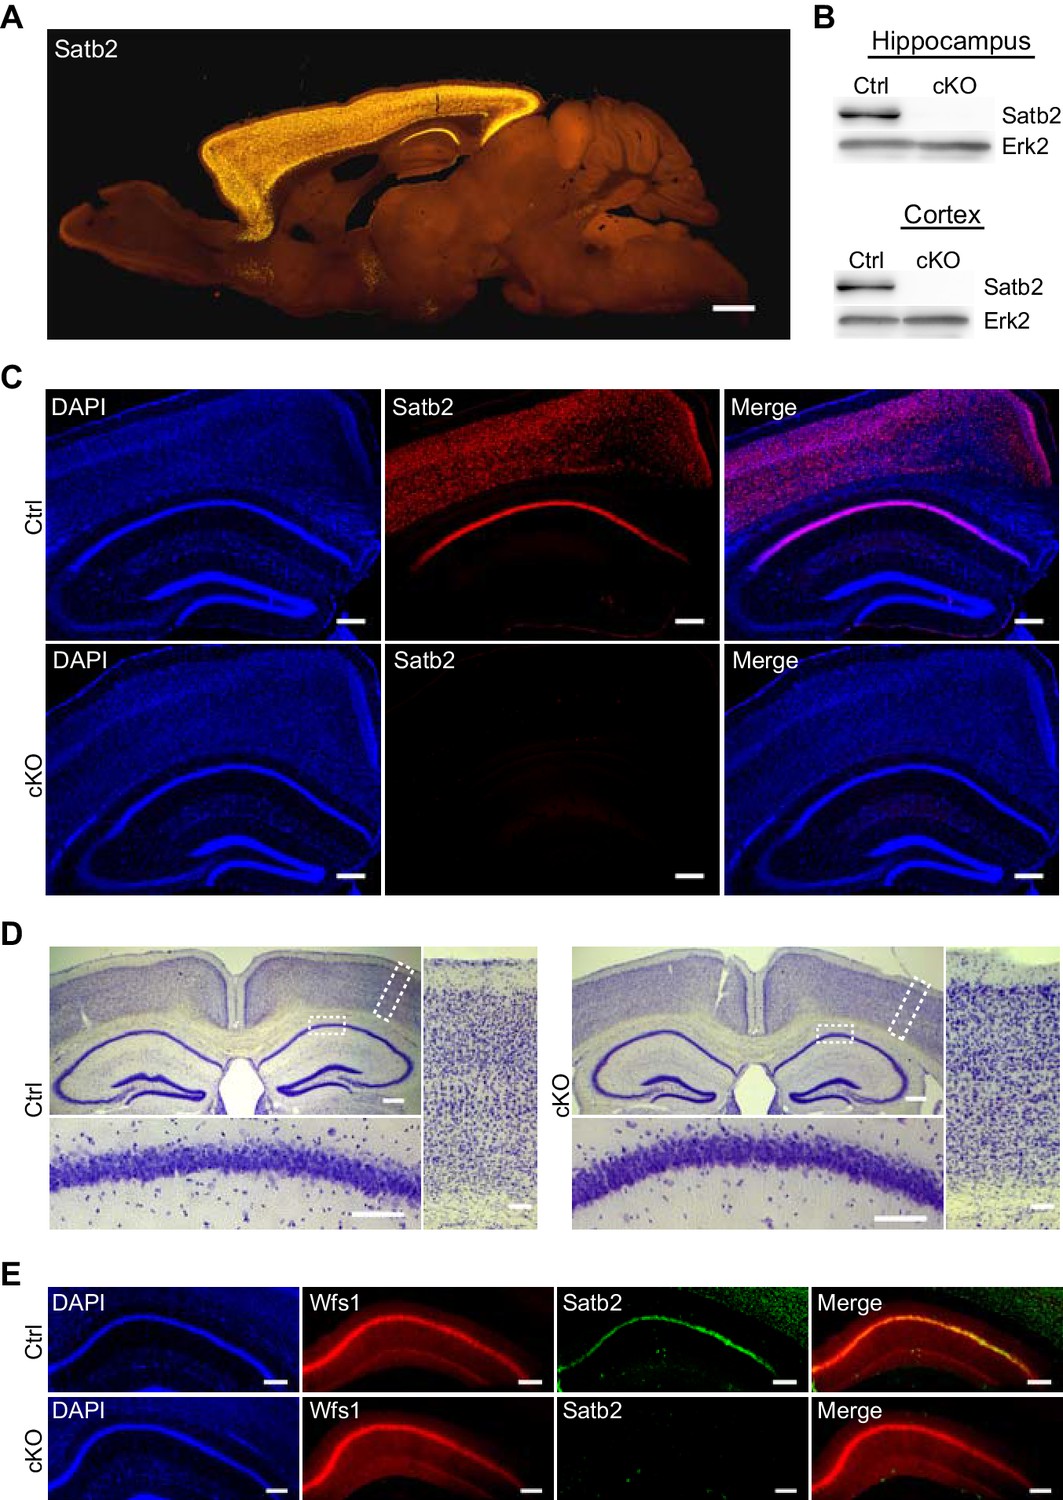
Characterization of Satb2 conditional mutants.
(A) Satb2 is mainly expressed in the adult forebrain. Immunostaining for Satb2 of sagittal brain sections from adult mice. Scale bar: 1000 μm. (B) Immunobloting analysis of the Satb2 protein level in cortical or hippocampal lysates from adult Satb2 cKO mice (cKO) or Satb2flox/flox mice (Ctrl). Erk2 was used as loading control. Representative images are shown. (C) Satb2 immunostaining of coronal brain sections from 3-month old Satb2 cKO mice or Satb2flox/flox littermate controls. Nuclei were counterstained with DAPI. Representative images are shown. Scale bar: 200 μm. (D) Nissl-stained coronal brain sections from 3-month old Satb2 cKO mice and littermate controls, demonstrating normal gross brain morphology of Satb2 cKO animals. Scale bar: 200 μm. High magnification views of boxed areas reveal the normal cyto-architecture of the cortex and hippocampus of Satb2 cKO mice. Representative images are shown. Scale bar: 50 μm. (E) Immunohistochemical labeling against the CA1 specific marker Wfs1 in hippocampus of Satb2 cKO mice and littermate controls reveals normally developed hippocampal CA1 area in Satb2 mutants. Nuclei were counterstained with DAPI. Representative images are shown. Scale bar: 150 μm.
Figure 1—figure supplement 1

Satb2 is expressed in the cortex and hippocampus of both Satb2 conditional mutants and littermate controls at postnatal day 15.
Immunostaining for Satb2 of coronal brain sections from juvenile, postnatal day 15 Satb2 cKO mice (cKO) and Satb2flox/flox littermate controls (Ctrl). Nuclei were counterstained with DAPI. Representative images are shown. Scale bar: 200 μm.
Figure 1—figure supplement 2
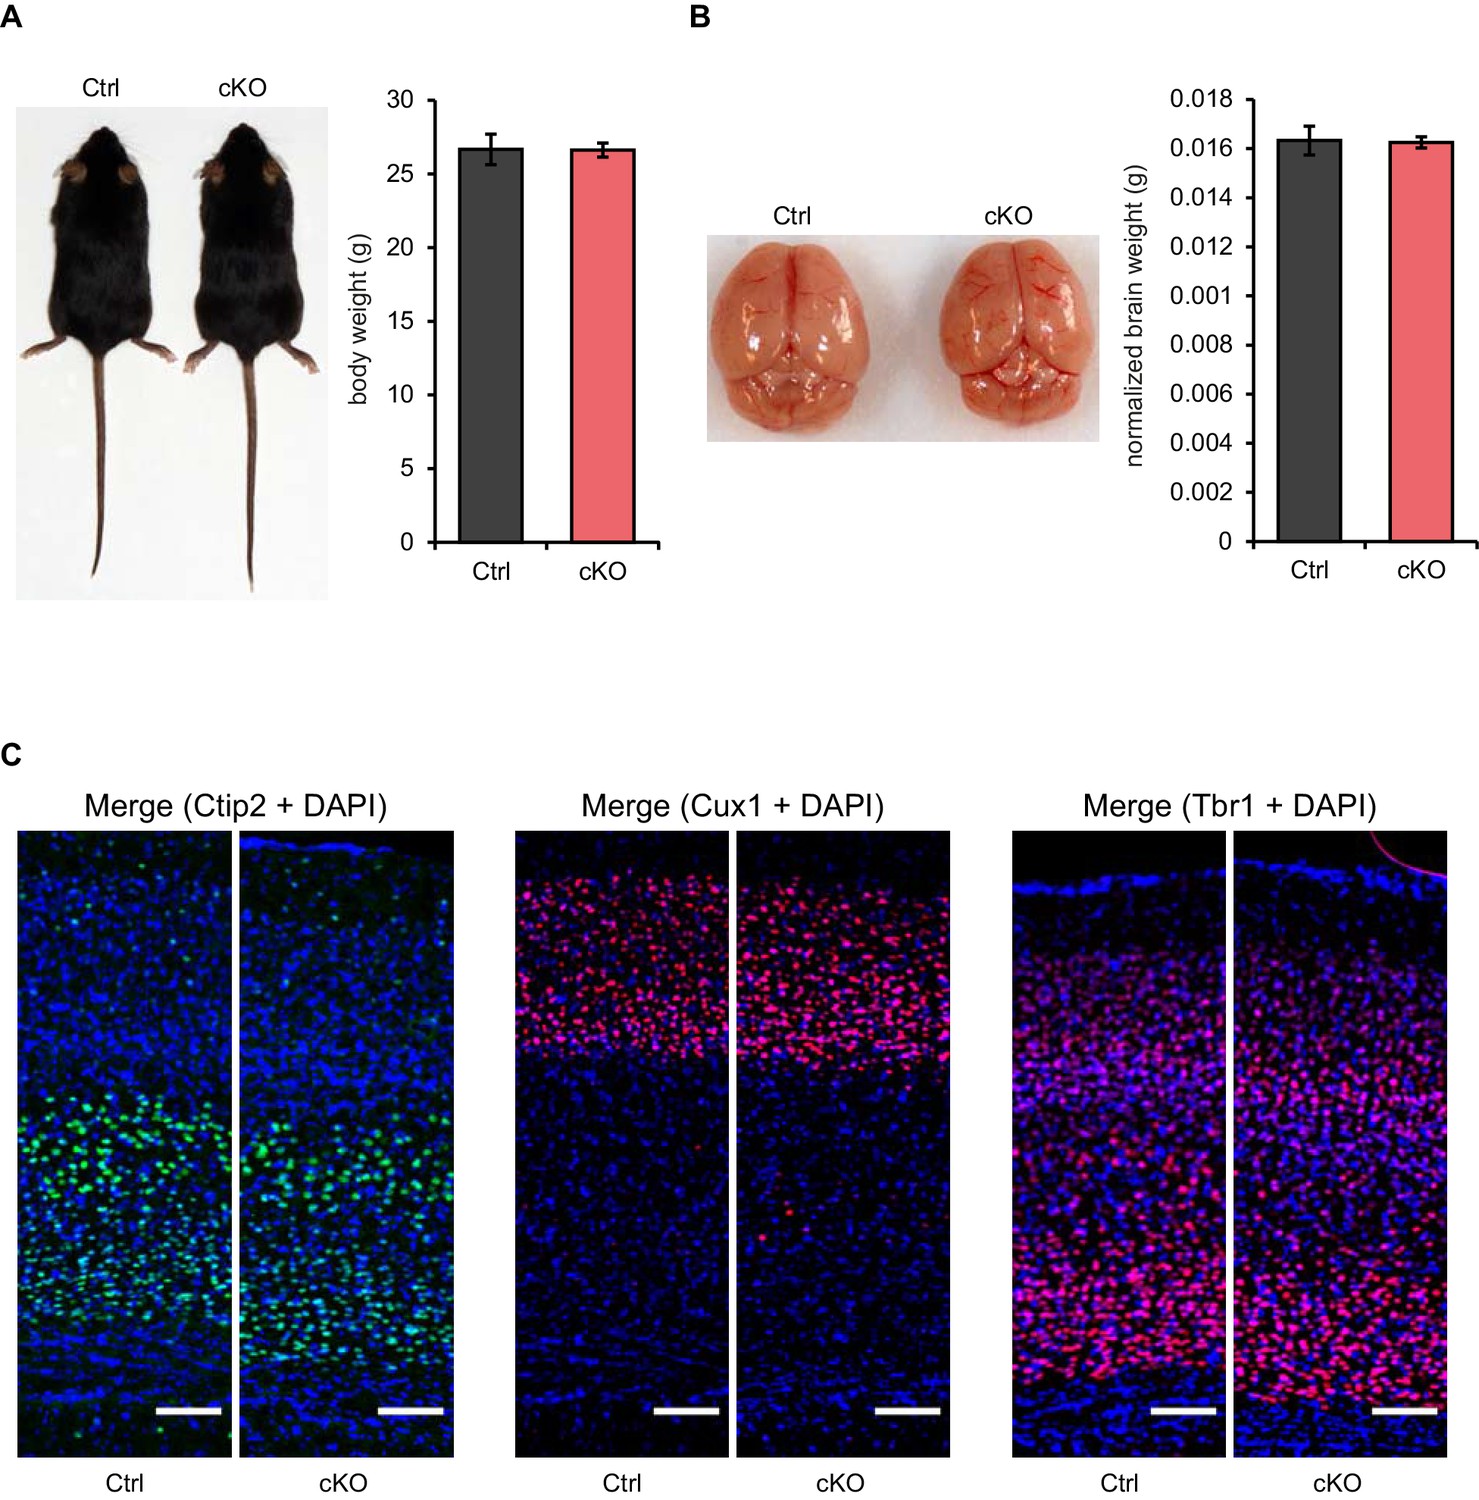
Postnatal Satb2 deletion does not cause alterations in body weight, gross brain morphology and cortical layer-specific marker expression.
(A) Satb2 cKO mice (cKO) are visually indistinguishable from Satb2flox/flox mice (Ctrl) and have similar body weights to their control littermates (Ctrl, n = 12; cKO, n = 17; Student's t test, t27 = 0.0551, p = 0.9665). Left panel: Representative images of 3-month old male mice from both genotypes; Right panel: Bar graph of mean body weights. Data are presented as mean ± SEM. (B) Representative images of freshly dissected brains of 3-month old male Satb2 cKO and control mice (Left panel). Brain weights normalized to the body weights showed no difference between Satb2 cKO mice (n = 17) and littermate controls (n = 12); Student's t test, t27 = 0.1664, p = 0.8691. Data are presented as mean ± SEM (Right panel). (C) Representative images showing Ctip2, Cux1 and Tbr1 immunoreactivity in the cortex of 3-month old Satb2 cKO and Satb2flox/flox mice. Nuclei were counterstained with DAPI. Scale bar: 100 μm.
Figure 2 with 1 supplement
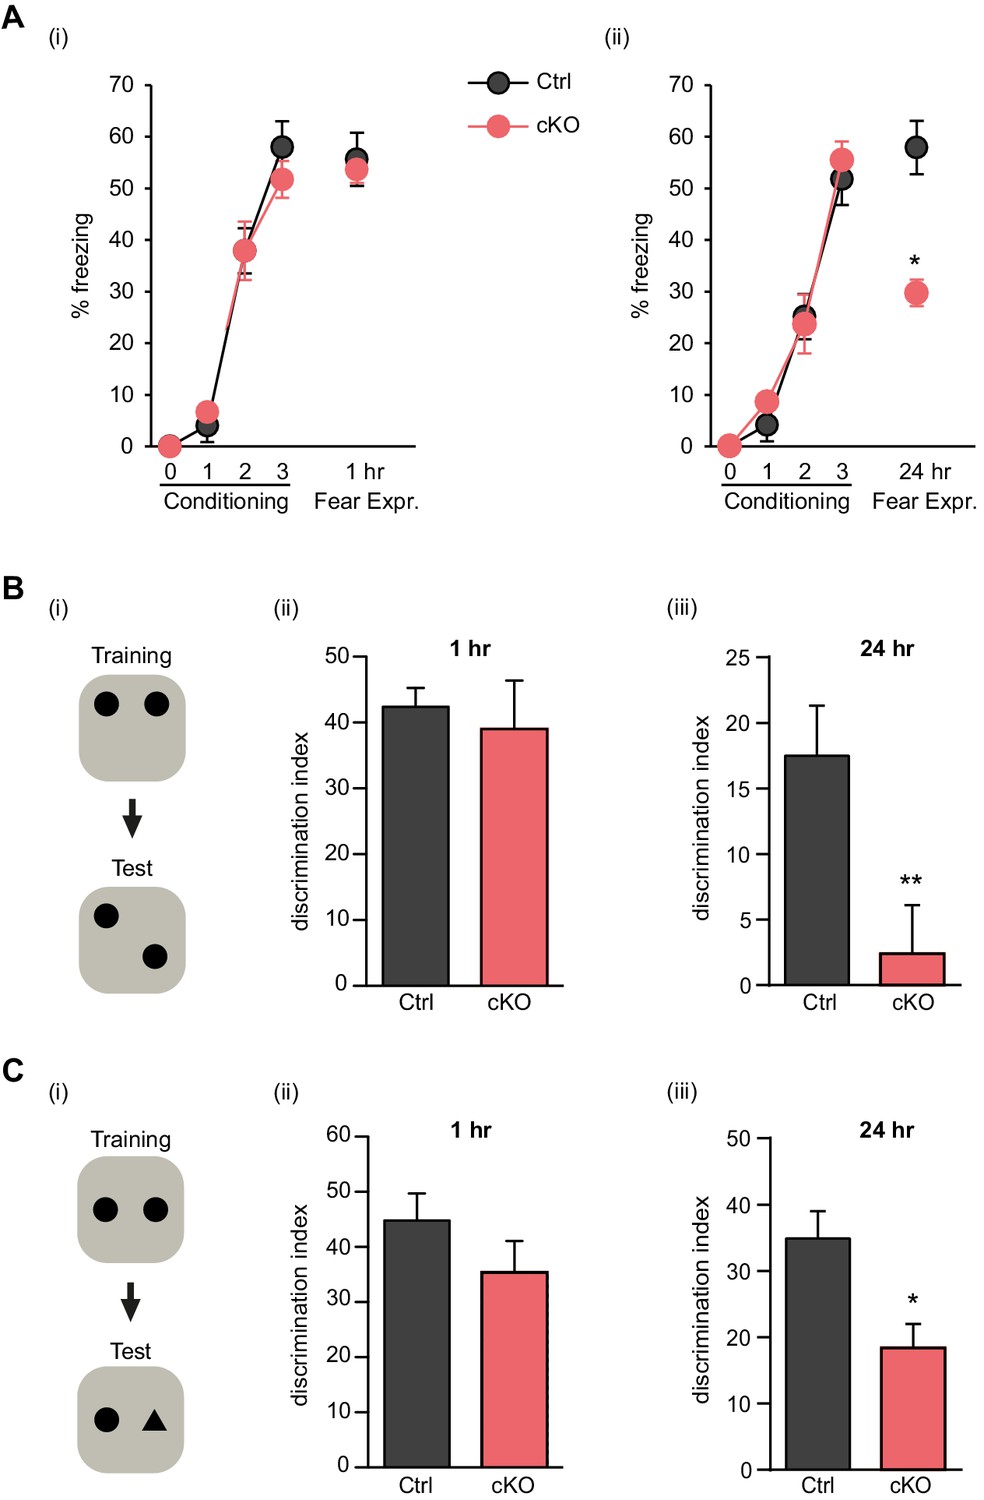
Satb2 is required for long-term memory formation.
(A) In a contextual fear conditioning paradigm, Satb2 cKO mice (cKO), showed (i) similar levels of freezing to Satb2flox/flox mice (Ctrl) during the fear-acquisition phase (cKO, n = 7; Ctrl, n = 6; repeated measures ANOVA, F3,33 = 0.76, p = 0.52) and at the 1 hr fear expression test (Student's t test, t11 = 0.19, p = 0.86) but (ii) froze significantly less than their littermate controls at the 24 hr fear expression test (cKO, n = 8; Ctrl, n = 8; repeated measures ANOVA, F3,42 = 0.36, p = 0.778; Student's t test, t14 = 4.88, p = 0.0002). Data are presented as mean ± SEM, n values refer to the number of mice per group, *p < 0.05. (B) Object location memory test. (i) Scheme of the experiment. (ii) Satb2 cKO mice (n = 11) and control mice (n = 10) exhibited similar preference for the novel location over the familiar location at the 1 hr memory retention test (Student's t test, t19 = 0.46, p = 0.65). (iii) Satb2 cKO mice (n = 8) showed reduced preference for the novel location over the familiar location at the 24 hr memory retention test (Student's t test, t14 = 2.89, p = 0.011) compared to Satb2flox/flox mice (n = 8). The relative exploration time is expressed as a percent discrimination index (D.I. = (tnovel location − tfamiliar location) / (tnovel location + tfamiliar location) × 100%). Data are presented as mean ± SEM, n values refer to the number of mice, **p < 0.01. (C) Novel object recognition test. (i) Scheme of the experiment. (ii) Satb2 cKO mice (n = 10) and control mice (n = 9) exhibited a similar preference for the novel over the familiar object at the 1 hr memory retention test (Student's t test, t19 = 1.11, p = 0.28). (iii) Satb2 cKO mice (n = 8) spent less time exploring the novel object at the 24 hr memory retention test (Student's t test, t14 = 3.0, p = 0.009) compared to Satb2flox/flox mice (n = 8). The relative exploration time is expressed as a percent discrimination index (D.I. = (tnovel object− tfamiliar object) / (tnovel object+ tfamiliar object) × 100%). Data are presented as mean ± SEM, n values refer to the number of mice, *p < 0.05.
Figure 2—figure supplement 1
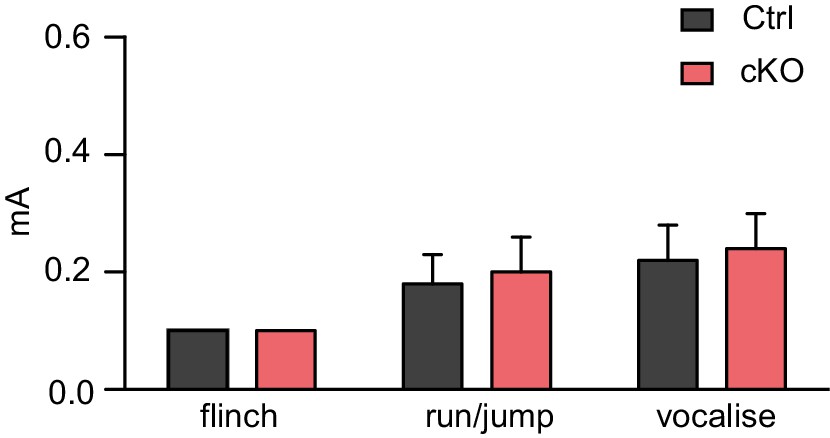
Satb2 cKO mice show normal responses to electric foot shock.
Flinch-Jump test revealed similar general responses to electric foot shock between Satb2 cKO mice (n = 5) and control littermates (n = 5), Student’s t-test, flinch: t8 = 0, p = 1.0, run/jump: t8 = 0.25, p = 0.81, vocalize: t8 = 0.24, p = 0.82. Mice were scored for their first visible response to the shock (flinch), their first pronounced motor response (run or jump), and their first vocalized distress as described in Materials and Methods. Data are presented as mean ± SEM.
Figure 3

Late-LTP maintenance is impaired in Satb2 conditional mutants.
(A) Schaffer collateral-CA1 late-LTP was significantly impaired in Satb2 cKO mice (Student's t test, t28 = 4.92, p < 0.0001 for the interval 180–185 min post-theta burst stimulation, TBS). Shown are field EPSP slopes in Satb2flox/flox (Ctrl, n = 17 slices, 6 mice) vs. Satb2 cKO mice (cKO, n = 13 slices, 6 mice) recorded before and after TBS (100 Hz, repeated three times in a 10 s interval). Data are presented as mean ± SEM. (B) Input-output curves comparing the amplitudes of the presynaptic fiber volley to the field EPSP amplitude across a range of stimulation currents showed that basal synaptic transmission did not differ in hippocampal slices from Satb2 cKO mice (cKO, n = 17 slices, 6 mice) and littermate controls (Ctrl, n = 13 slices, 5 mice); Student's t test, p > 0.05 for all data points. Data are presented as mean ± SEM. (C) Paired-pulse facilitation studies across different inter-stimulus intervals revealed no difference between Satb2 cKO mice (cKO, n = 17 slices, 6 mice) and littermate controls (Ctrl, n = 13 slices, 5 mice); Student's t test, p > 0.05 for all data points. Data are presented as mean ± SEM.
Figure 4 with 2 supplements
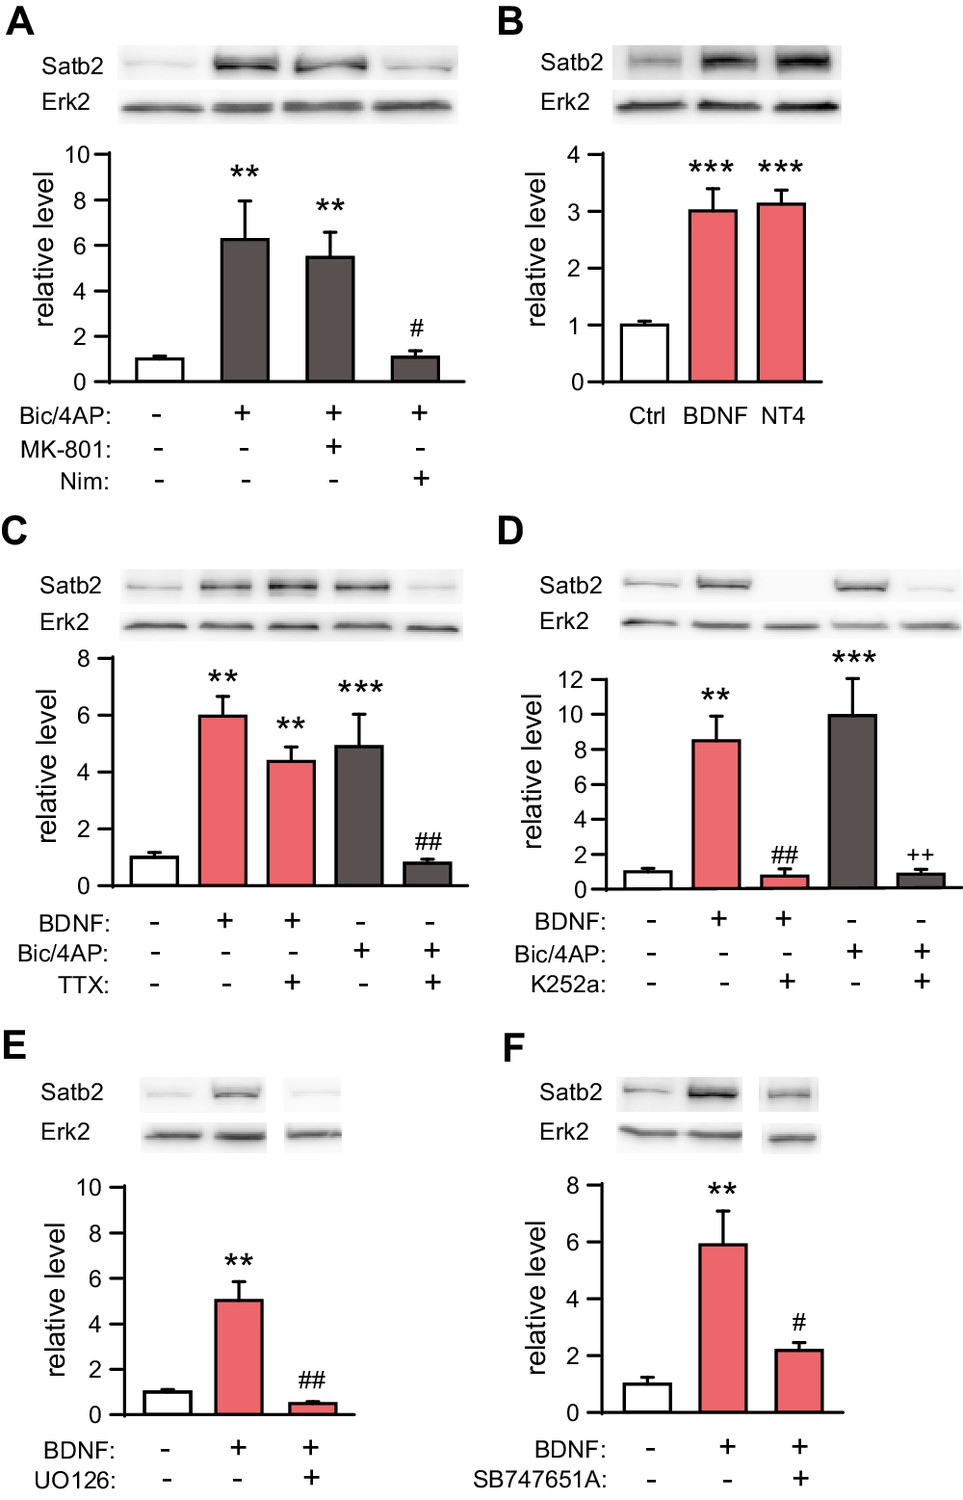
Synaptic activity and BDNF up-regulate Satb2 in primary hippocampal neurons.
(A) Increased synaptic activity up-regulates Satb2 protein depending on calcium influx through L-type VGCC. Representative Western blot (top) and quantification (bottom) of the Satb2 protein level 24 hr after Bic/4AP treatment in the presence or absence of L-VGCC blocker nimodipine or NMDAR antagonist MK-801 (n = 10, 6, 7, 5; ANOVA followed by Hochberg post hoc test; F3,24 = 9.171, Ctrl vs. Bic/4AP, p = 0.002; Ctrl vs. Bic/4AP+MK-801, p = 0.006; Bic/4AP vs. Bic/4AP+Nim, p = 0.011). (B) BDNF and NT4 significantly increase Satb2 protein 24 hr after treatment. Representative Western blot image (top) and quantification of the Satb2 protein level (bottom) are shown, n = 4; ANOVA followed by Tukey post hoc test, F4,15 = 15.4, Ctrl vs. BDNF, p = 0.0004; Ctrl vs. NT4, p = 0.0002. (C) TTX application does not prevent Satb2 induction by BDNF but abolishes Satb2 up-regulation by synaptic activity. Representative image of immunoblot analysis (top) and quantification of the Satb2 protein level (bottom) are shown, n = 3–7; ANOVA followed by Hochberg post hoc test, F4,22 = 12.5, Ctrl vs. BDNF, p = 0.002, Ctrl vs. BDNF+ TTX, p = 0.001, Ctrl vs. Bic/4AP, p = 0.0004, Bic/4AP vs. Bic/4AP+TTX, p = 0.002. Treatments with Bic/4AP also contained MK-801. (D) Treatment with the Trk inhibitor K252a completely blocks the up-regulation of Satb2 by both BDNF and Bic/4AP Representative image of Western blot (top) and quantification of the Satb2 protein level (bottom) are shown, n = 4–6; ANOVA followed by Hochberg post hoc test, F4,20 = 15.6 Ctrl vs. BDNF, p = 0.001, Ctrl vs. Bic/4AP, p = 0.0001, BDNF vs. BDNF+K252a, p = 0.002, Bic/4AP vs. Bic/4AP+K252a, p = 0.0002. Treatment with Bic/4AP also contained MK-801. (E) Blockade of the ERK1/2 signaling pathway with UO126 inhibits the induction of Satb2 by BDNF. Representative image of Western blot (top) and quantification of Satb2 protein levels (bottom) are shown, n = 4; ANOVA followed by Tukey post hoc test, F3,12 = 26.7, Ctrl vs. BDNF, p = 0.003; BDNF vs. BDNF+UO126, p = 0.001. (F) Inhibition of ERK1/2-downstream kinase MSK1 prevents BDNF-induced Satb2 up-regulation. Representative image of Western blot (top) and quantification (bottom) are shown, n = 4–5; ANOVA followed by Hochberg post hoc test, F2,11 = 11.4, Ctrl vs. BDNF, p = 0.002, BDNF vs. BDNF+SB747651A, p = 0.018. In (A–F), data are presented as mean ± SEM of the indicated number of experiments, n values refer to the number of independent hippocampal cultures, *p < 0.05; **p < 0.01; ***p < 0.001, compared with Ctrl; #p < 0.05; ##p < 0.01; ###p < 0.001, compared with BDNF; +p < 0.05; ++p < 0.01; +++p < 0.001, compared with Bic/4AP.
Figure 4—figure supplement 1
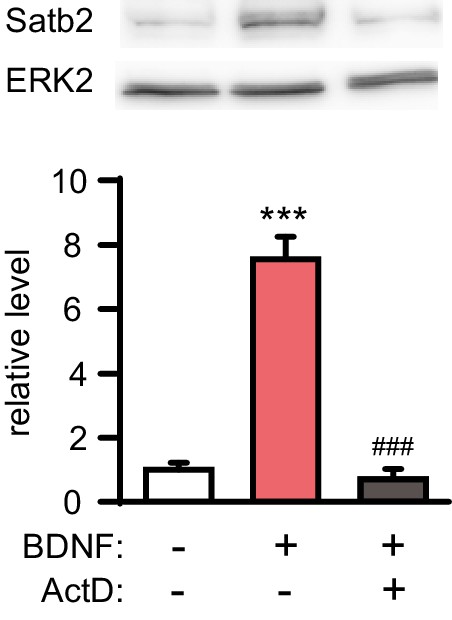
BDNF-induced Satb2 expression requires gene transcription.
Representative image of Western blot (top) and quantification (bottom) of Satb2 protein levels 24 hr after stimulation with BDNF in the presence or absence of actinomycin D, (n = 4, ANOVA followed by Tukey post hoc test, F2,9 = 70.7, Ctrl vs. BDNF, p = 0.000009, BDNF vs. BDNF+ ActD, p = 0.000006). Data are presented as mean ± SEM.
Figure 4—figure supplement 2
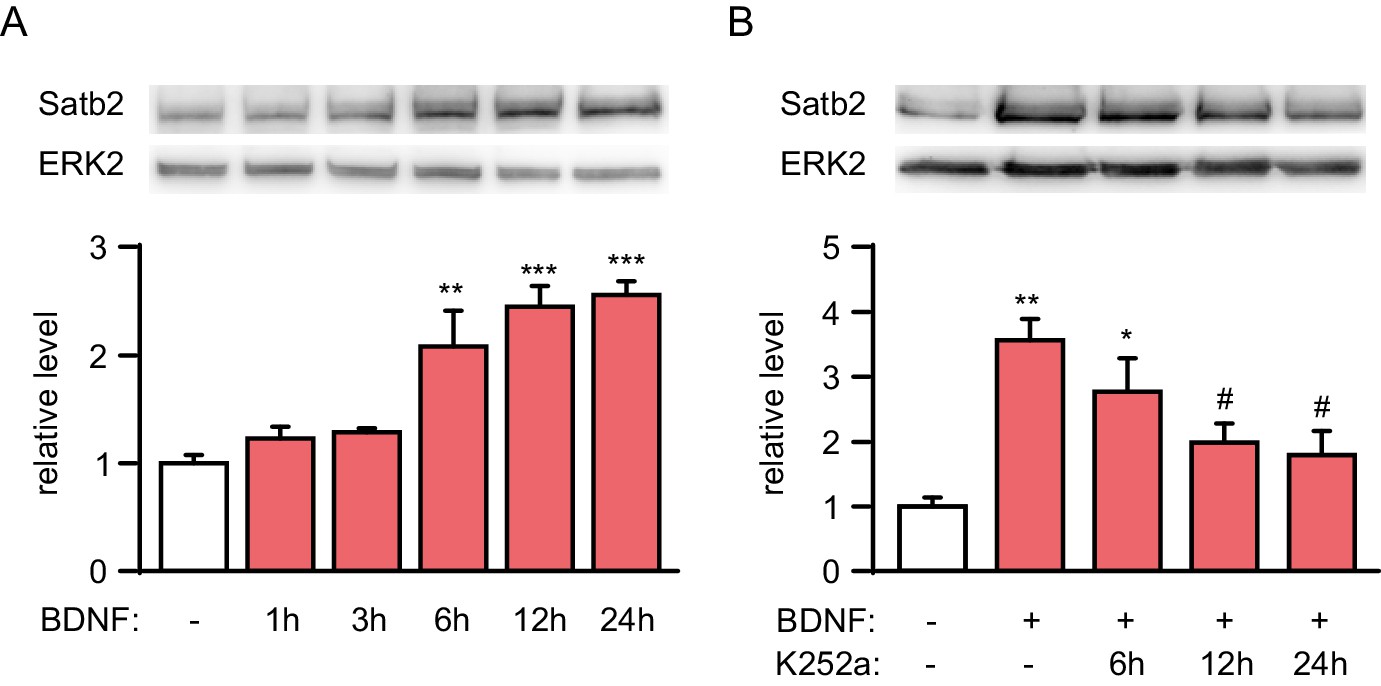
Time-course analysis of Satb2 expression after BDNF treatment.
(A) Representative image of Western blot (top) and quantification (bottom) showing that Satb2 protein is significantly induced 6 hr and peaks at around 12 hr after BDNF application, (n = 4; ANOVA followed by Tukey post hoc test, F5,18 = 15.3, Ctrl vs. BDNF 12 hr, p = 0.004, Ctrl vs. BDNF 6 hr, p = 0.0001, Ctrl vs. BDNF 24 hr, p = 0.00006). (B) Representative image of immunoblot analysis (top) and quantification (bottom) of Satb2 protein level following treatment with K252a to block TrkB signaling. Satb2 was induced by a 24 hr period of BDNF stimulation before K252a application (n = 4; ANOVA followed by Tukey post hoc test, F4,15 = 7.6, Ctrl vs. BDNF, p = 0.001, Ctrl vs. BDNF+K252a (6 hr), p = 0.021, Ctrl vs. BDNF+K252a (12 hr), p = 0.045, Ctrl vs. BDNF+K252a (24 hr), p = 0.022). Data in A and B are presented as mean ± SEM of the indicated number of experiments, n values refer to number of independent hippocampal cultures, *p < 0.05; **p < 0.01; ***p < 0.001, compared with Ctrl; #p < 0.05; ##p < 0.01; ###p < 0.001, compared with BDNF.
Figure 5 with 4 supplements
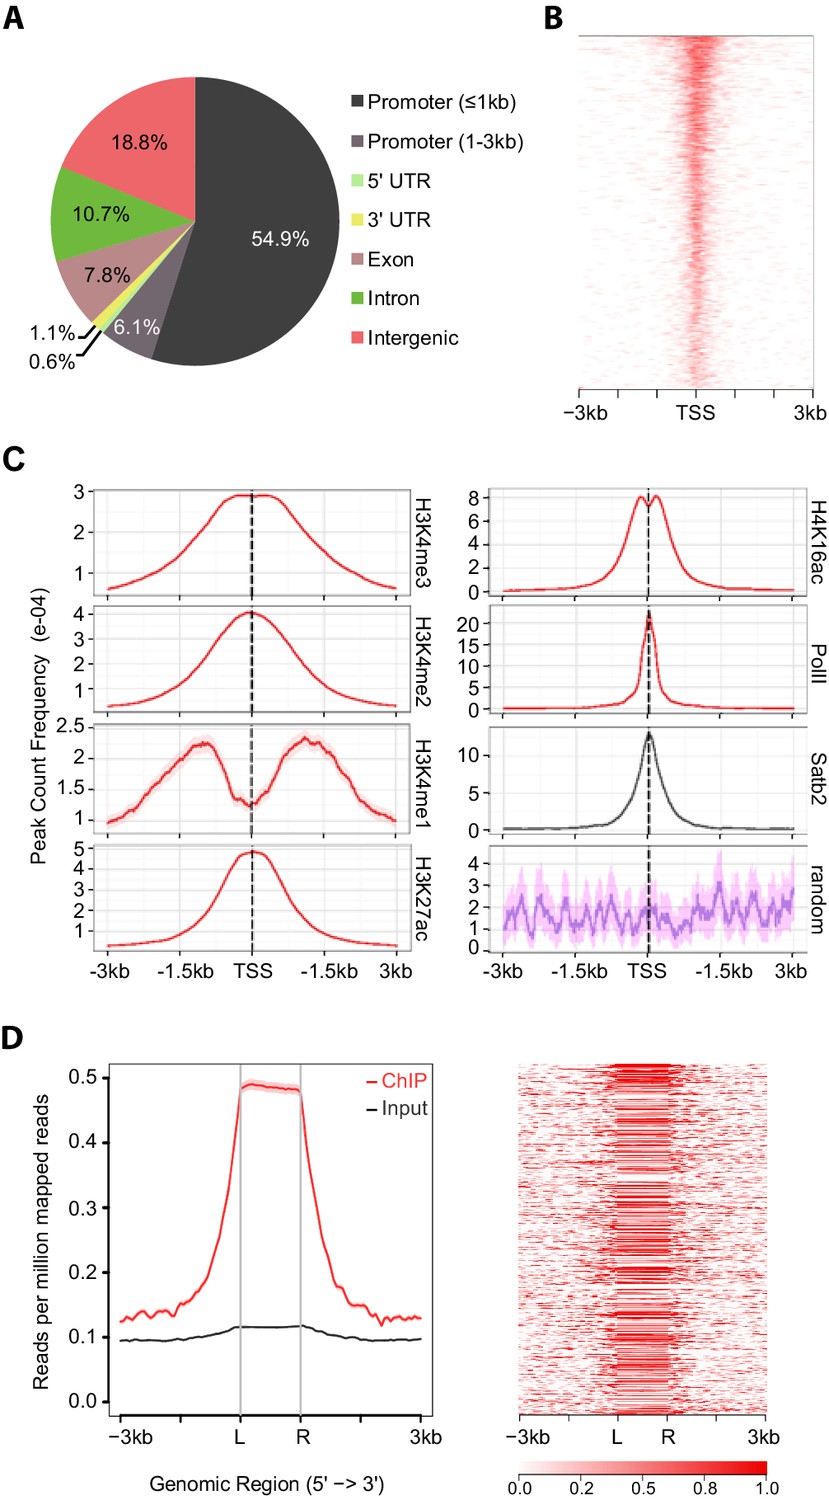
Satb2 binding sites are enriched on active gene promoters including miRNA promoters.
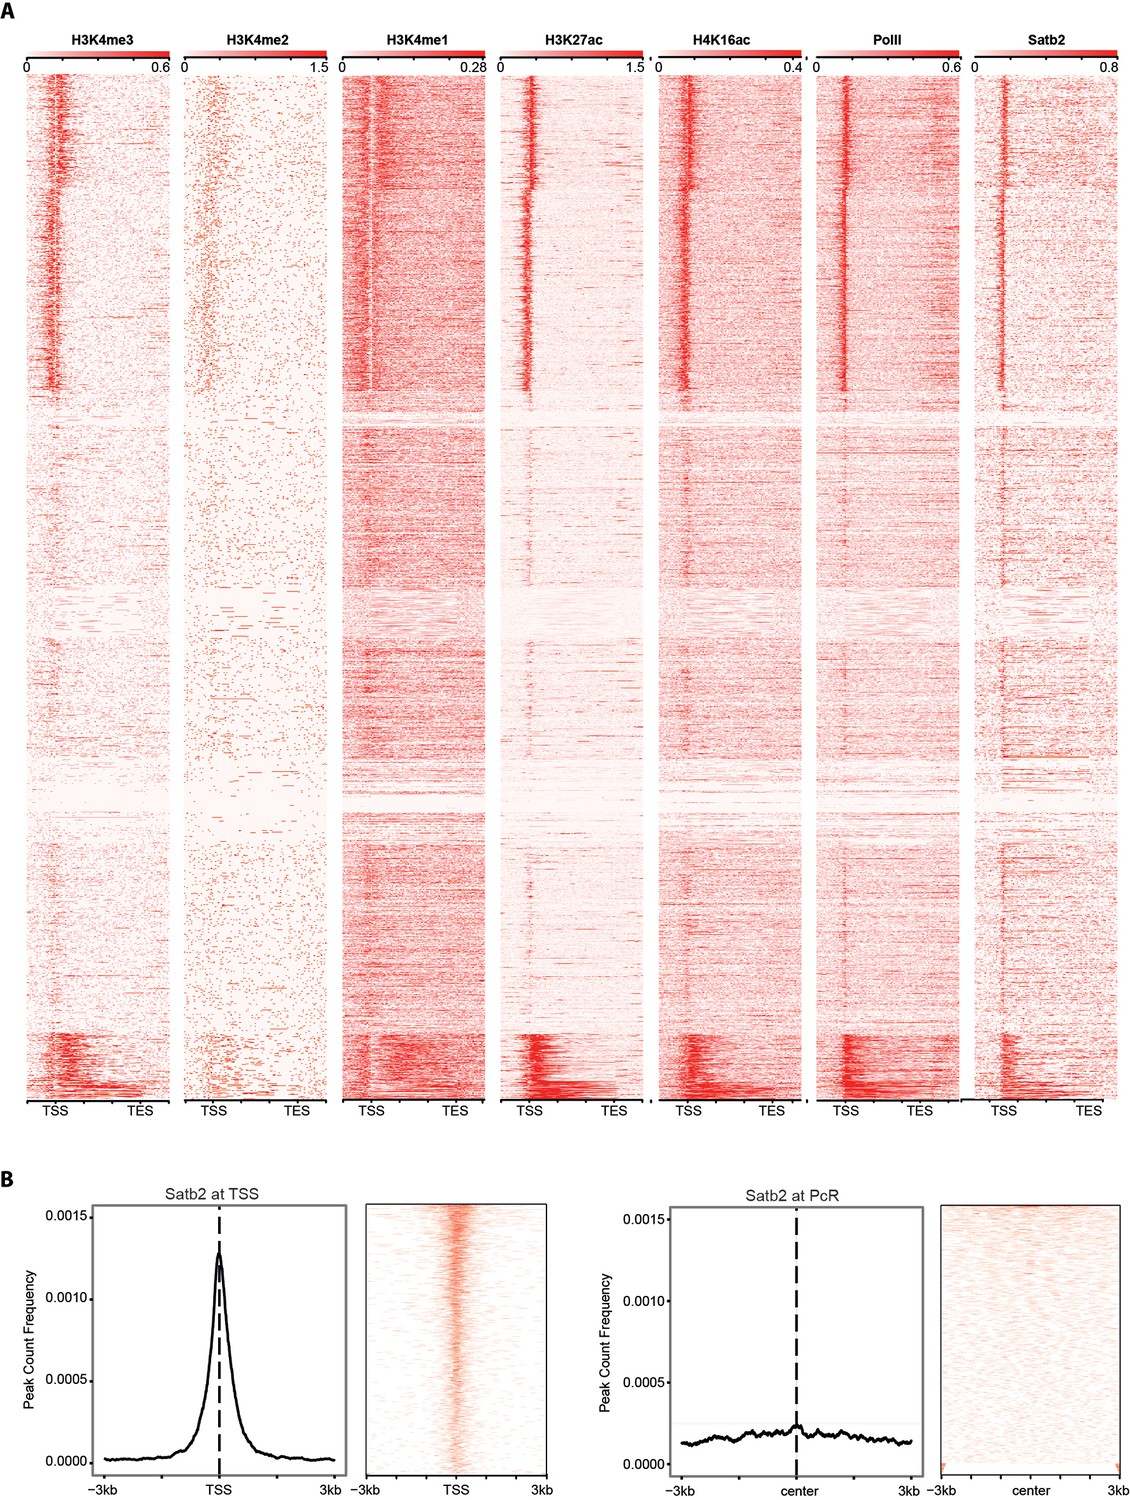
(A) Pie-chart illustrating the genomic annotation of Satb2 binding sites. (B) Heatmap of Satb2 binding to TSS (±3 Kb) regions. (C) Average profiles of H4K16ac, H3K27ac, H3K4me1, H3K4me2, H3K4me3 and PolII peaks (GEO: GSE63271, GSE66701, GSE21161, and GSE65159) at Satb2 bound promoters. (D) Average tag density profiles (ChIP/Input, left panel) and heat map depicting Satb2 ChIP-seq tag density at predicted miRNA promoter regions (right panel). ‘L’ – 5’ left, ‘R’ – 3’ right of the miRNA promoters. The tick marks represent distance of −3 kb, −1.5 kb, +1.5 kb, +3 kb relative to the miR promoters.
-
Figure 5—source data 1
Major GO terms and KEGG pathways, revealed by ChIP-Enrich bioinformatics tool, found to be enriched among the genes having Satb2 peaks within their promoters.
- https://doi.org/10.7554/eLife.17361.012
Figure 5—figure supplement 1

ChIP-qPCR validation of Satb2 enrichment at various identified target regions using chromatin from AAV-Satb2-V5-transduced and non-transduced primary hippocampal neurons.
Each bar represents the ratio of precipitated DNA (bound) to the total input DNA (% Input). Each target region was tested in at least two independent chromatin samples derived from non-transduced hippocampal cultures and in at least one ChIP sample from AAV-Satb2-V5-transduced neurons.
Figure 5—figure supplement 2
Satb2 binding sites are enriched on active gene promoters and do not correlate with the Polycomb-associated H3K27me3 repressive mark (PcR).
(A) Heat maps depicting H3K4me3 (GSM530197), H3K4me2 (GSM1544912), H3K4me1 (GSM1544908), H3K27Ac (GSM1629392), H4K16Ac (GSM1629377), PolII (GSM1544942), and Satb2 tag densities (read counts/million mapped reads) at TSS/genebody/TES (±3 Kb) regions. (B) Average profile and heat maps of Satb2 genome occupancy centered on TSS (left panel) and the Polycomb-associated H3K27me3 peaks (GSE65159, PcR, ±3 Kb) (right panel).
Figure 5—figure supplement 3
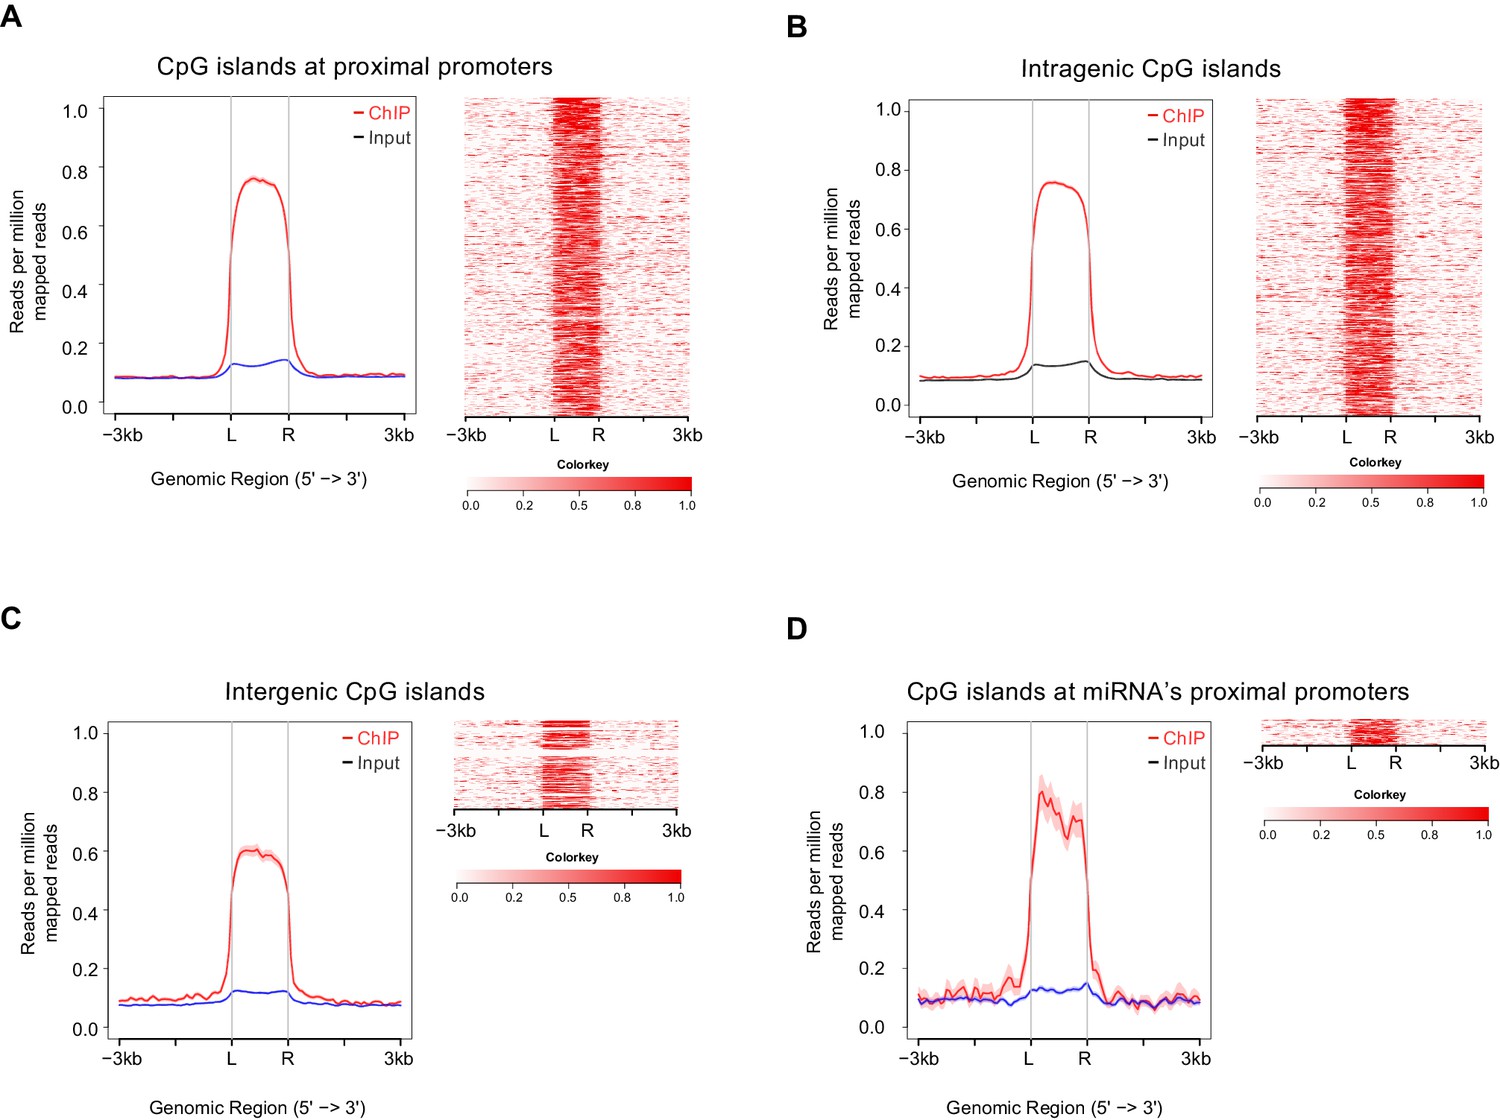
Satb2 is deposited at CpGs.
Average tag density profiles (ChIP/Input) and heat maps depicting Satb2 ChIP-seq tag density at CpG islands localized at proximal promoters (A), gene body (B), intergenic regions (C), and miRNA proximal promoters (D), ‘L’ – 5’ left, ‘R’ – 3’ right of the CpG islands, the tick marks represent distance of −3 kb, −1.5 kb, +1.5 kb, +3 kb relative to the CpG islands.
Figure 5—figure supplement 4
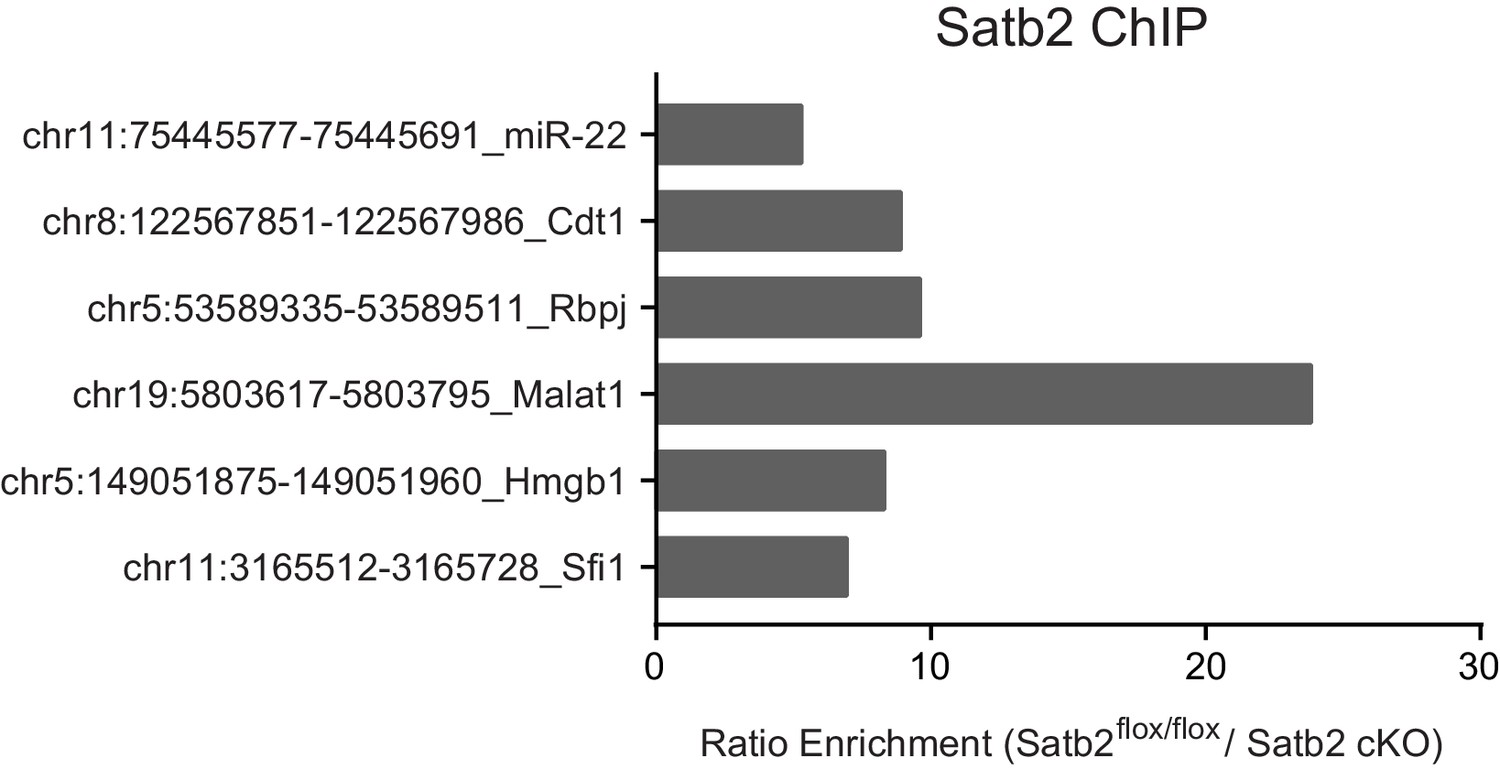
ChIP-qPCR validation of Satb2 targets in vivo.
ChIP-qPCR analysis of chromatin derived from CA1 hippocampal tissue of control and Satb2 cKO mice immunoprecipitated with an antibody to Satb2 at several target sites identified by ChIP-seq in primary hippocampal cultures. Each bar represents the ratio of precipitated DNA (bound) to the total input DNA (% Input) of the region tested, normalized to the % Input in ChIP samples derived from Satb2 cKO mice. Each target region was tested in at least two independent chromatin samples (a pool of CA1 tissue from 8–10 mice).
Figure 6 with 3 supplements
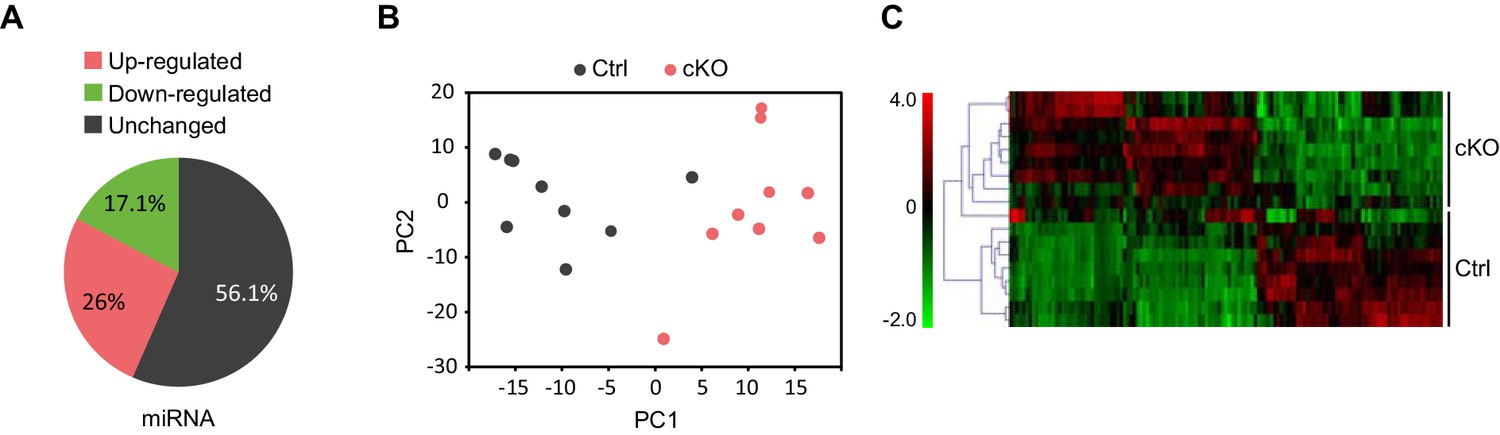
Satb2 regulates miRNA expression in CA1 hippocampal area.
(A) Pie-chart showing the percentage of differentially expressed miRNAs (up-and down-regulated, Figure 6—source data 1) in the CA1 region of Satb2 cKO mice vs. littermate controls as assessed by small RNA-seq analysis (base mean above 10 counts, 1.5-fold change, and adjusted p < 0.05). (B) PCA plot of miRNA counts analyzed by small RNA-seq of Satb2 cKO vs. control CA1 hippocampal tissue. The first two PCs explained 33.3% and 21.4% of the variance, respectively. (C) Heat map from hierarchical clustering of differentially expressed miRNAs (base mean above 100 counts) in the CA1 hippocampal area of Satb2 cKO mice (n = 9) vs. littermate controls (n = 9).
-
Figure 6—source data 1
Differentially expressed genes between Satb2 cKO mice and Satb2flox/flox littermate controls in the CA1 region as assessed by RNA-seq.
Shown are the genomic coordinates of the identified Satb2 binding sites and the distance to the TSS of the corresponding gene.
- https://doi.org/10.7554/eLife.17361.018
-
Figure 6—source data 2
No major significant differences in splicing were observed between the CA1 region of Satb2 cKO mice (n = 9) and littermate controls (n = 9).
Only one gene showed differential exon usage at FDR corrected p-value significance level 0.01 and 12 genes at FDR 0.1 (based on DEXSeq R-package with default parameters).
- https://doi.org/10.7554/eLife.17361.019
-
Figure 6—source data 3
List of differentially expressed miRNAs between Satb2 cKO mice and littermate controls (Satb2flox/floxmice) in the CA1 region as assessed by small RNA-seq analysis (base mean above 10 counts, 1.5-fold change, and adjusted p < 0.05).
- https://doi.org/10.7554/eLife.17361.020
-
Figure 6—source data 4
List of differentially expressed miRNAs in the CA1 region of Satb2 cKO mice vs. littermate controls that contain Satb2 peak(s) within their promoter.
- https://doi.org/10.7554/eLife.17361.021
Figure 6—figure supplement 1
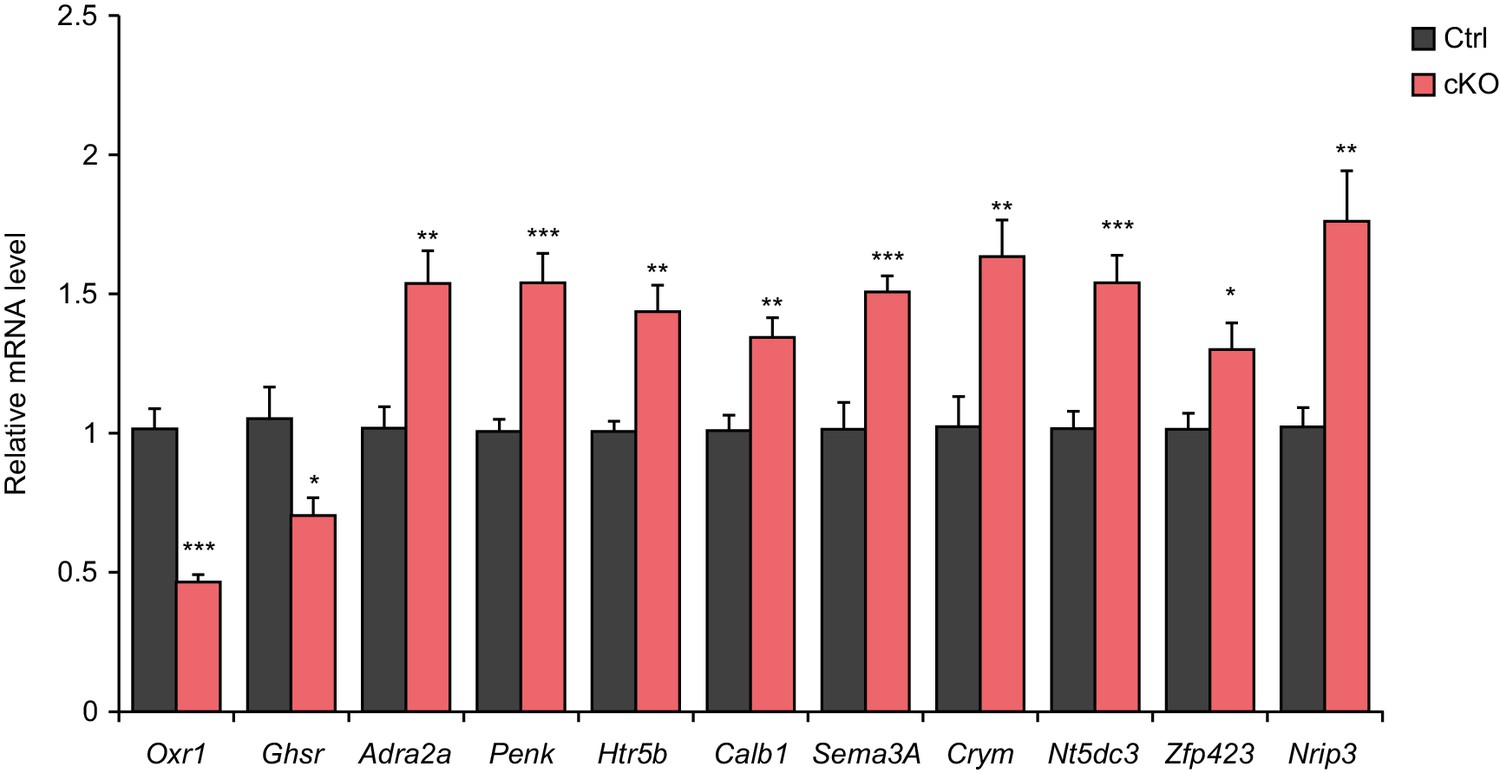
Validation of the differential expression of selected genes by qPCR.
qPCR quantification of selected gene mRNA levels in the CA1 field of Satb2 cKO mice compared to the control group (Oxr1: Ctrl, n = 11; cKO, n = 11; Ghsr: Ctrl, n = 10; cKO, n = 10; Adra2a: Ctrl, n = 8; cKO, n = 12; Penk: Ctrl, n = 8; cKO, n = 12; Htr5b: Ctrl, n = 8; cKO, n = 12; Sema3A: Ctrl, n = 5; cKO, n = 6; Crym: Ctrl, n = 5; cKO, n = 6; Nt5dc3: Ctrl, n = 10; cKO, n = 10; Zfp423: Ctrl, n = 10; cKO, n = 10; Nrip3: Ctrl, n = 10; cKO, n = 10; Student's t test, Oxr1: t24 = 7.978, p < 0.0001; Ghsr: t18 = 2.648, p = 0.0164; Adra2a: t18 = 3.269, p = 0.0043; Penk: t18 = 3.9634, p = 0.0009; Htr5b: t18 = 3.5517, p = 0.0023; Calb1: t18 = 3.435, p = 0.0030; Sema3A: t9 = 4.5756, p = 0.0013; Crym: t9 = 3.4984, p = 0.0067; Nt5dc3: t18 = 4.5276, p = 0.0003; Zfp423: t18 = 2.5701, p = 0.0193; Nrip3: t18 = 3.7965, p = 0.0013), ***p < 0.001, **p < 0.01, *p < 0.05. Data are presented as mean ± SEM.
Figure 6—figure supplement 2
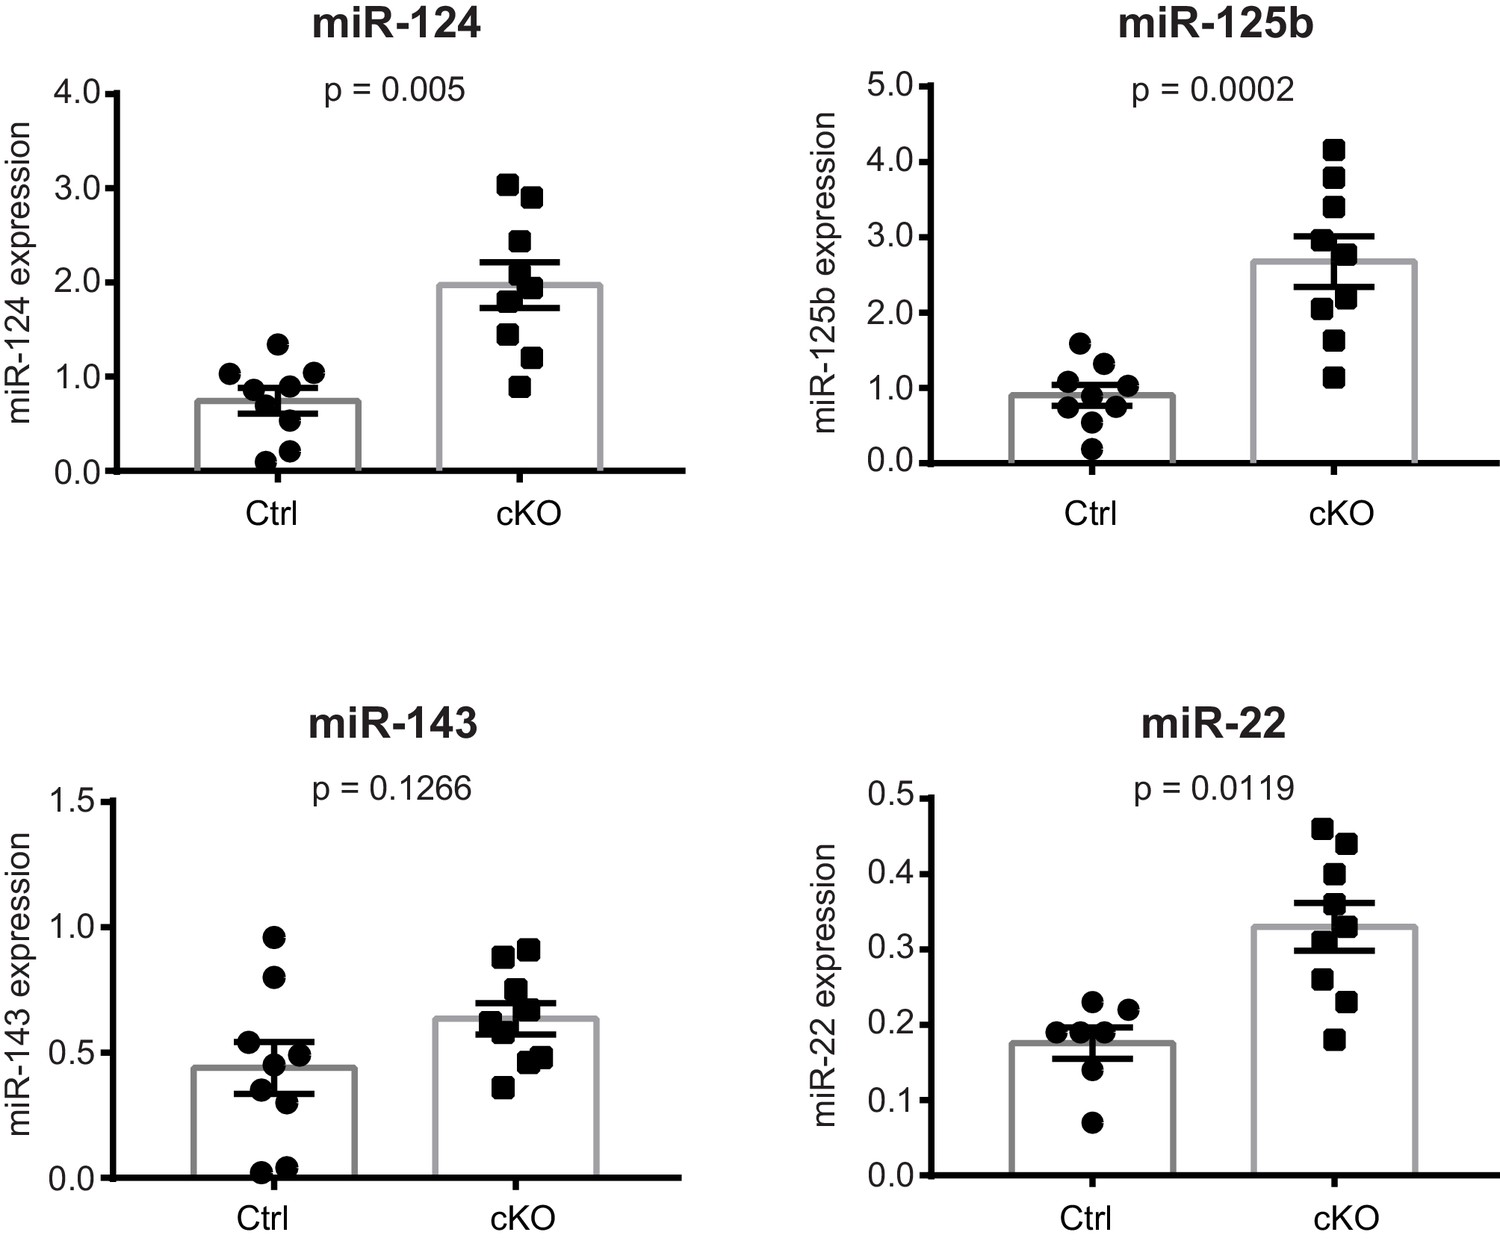
Validation of the differential expression of selected miRNAs by qPCR.
qPCR quantification of miRNA levels in the CA1 field of Satb2 cKO mice compared to the control group (miR-124: Ctrl, n = 9; cKO, n = 9; miR-125b: Ctrl, n = 9; cKO, n = 9; miR-22: Ctrl, n = 7; cKO, n = 9; miR-143: Ctrl, n = 9; cKO, n = 9). Student's t test, miR-124: t = 4.391, p = 0.005; miR-125b: t18 = 4.876, p = 0.0002; miR-22: t18 = 3.806, p = 0.0019; miR-143: t18 = 1.611, p = 0.1266). Data are presented as mean ± SEM.
Figure 6—figure supplement 3

Satb2 binds to miRNA’s promoters.
IGV genome browser images revealing overlapping between Satb2 peaks and predicted promoters (depicted as red rectangles) of selected miRNAs: miR124a (a), miR125a (b), mir132 (c), mir182 (d), found to be deregulated in Satb2 cKO mice. The complete list of all differentially expressed miRNA with Satb2 peak(s) within their promoter is shown in Figure 6—source data 4.
Figure 7
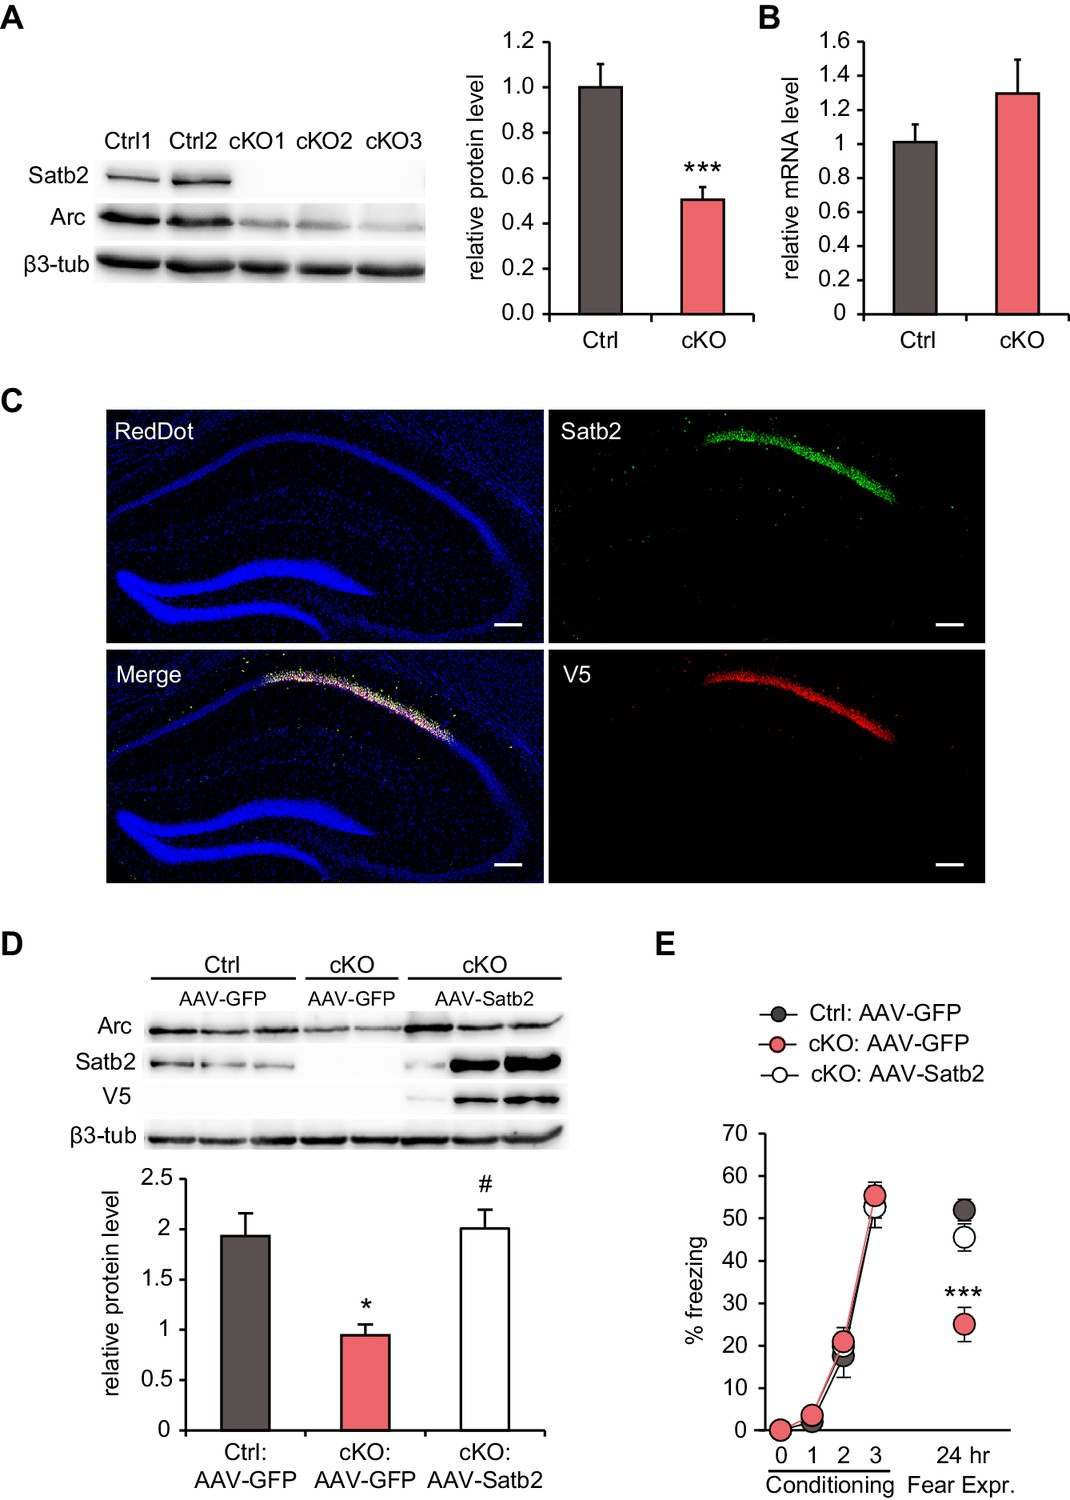
Hippocampal Satb2 re-expression rescues Arc levels and long-term fear memory deficits.
(A) Representative Western blot (left) and quantification (right) of Arc protein level in the CA1 field of Satb2 cKO mice and littermate controls. β3-tubulin was used as a loading control (Ctrl, n = 9; cKO, n = 11; Student's t test, t18 = 4.52, p = 0.0003). Data are presented as mean ± SEM, n values refer to the number of mice per group, ***p < 0.001 compared to Ctrl. (B) qPCR quantification of Arc mRNA level in the CA1 field of Satb2 cKO mice and littermate controls (Ctrl, n = 3; cKO, n = 4; Student's t test, t5 = 1.14, p = 0.303). Data are presented as mean ± SEM, n values refer to the number of mice used. (C) Satb2/V5-immunoreactivity in the CA1 hippocampal area of Satb2 cKO mice after stereotaxic injection of rAAV-hSyn-Satb2-V5 into the dorsal hippocampus. Nuclei were counterstained with RedDot. Representative images are shown. Scale bar: 150 μm. (D) Representative Western blot (left) and quantification (right) of Arc protein level in the CA1 field of Satb2flox/flox mice injected with rAAV-hSyn-eGFP (Ctrl:AAV-GFP, n = 7), Satb2 cKO mice injected with rAAV-hSyn-eGFP (cKO:AAV-GFP, n = 3) and Satb2 cKO mice injected with rAAV-hSyn-Satb2-V5 (cKO:AAV-Satb2, n = 6). β3-tubulin was used as a loading control. Re-expression of Satb2 in the dorsal hippocampus rescued the reduction in Arc protein in the CA1 area of Satb2 cKO mice, bringing it up to control levels (ANOVA followed by Fischer LSD post hoc test, F2,13 = 5.011, cKO:AAV-GFP vs. Ctrl:AAV-GFP, p = 0.014, cKO:AAV-Satb2 vs. cKO:AAV-GFP, p = 0.011, Ctrl:AAV-GFP vs. cKO:AAV-Satb2, p = 0.793). Data are presented as mean ± SEM, n values refer to the number of mice used, *p < 0.05 compared with Ctrl:AAV-GFP, #p < 0.05, compared with cKO:AAV-GFP. (E) In a contextual fear conditioning test, Ctrl:AAV-GFP (n = 9), cKO:AAV-GFP (n = 9) and cKO:AAV-Satb2 (n = 14) mice showed similar levels of freezing during the fear-acquisition phase (repeated measures ANOVA, F6,87 = 0.12, p = 0.99). Freezing behavior, analyzed 24 hr after the training, was significantly impaired in cKO:AAV-GFP mice, however the fear memory deficit was completely rescued in cKO:AAV-Satb2 mice (ANOVA followed by Fischer LSD post hoc test, F2,29 = 12.8, cKO:AAV-GFP vs. Ctrl:AAV-GFP, p = 0.00005, cKO:AAV-Satb2 vs. cKO:AAV-GFP, p = 0.0004, Ctrl:AAV-GFP vs. cKO:AAV-Satb2, p = 0.22). Data are presented as mean ± SEM, n values refer to the number of mice per group, ***p < 0.001 compared with cKO:AAV-Satb2 and Ctrl:AAV-GFP.
-
Figure 7—source data 1
List of miRNAs predicted to target mouse Arc 3’UTR by the bioinformatics tools TargetScan, PITA and miRanda.
The miRNAs identified as up-regulated in the CA1 region of Satb2 cKO vs. control mice are shown in red.
- https://doi.org/10.7554/eLife.17361.026
Author response image 1
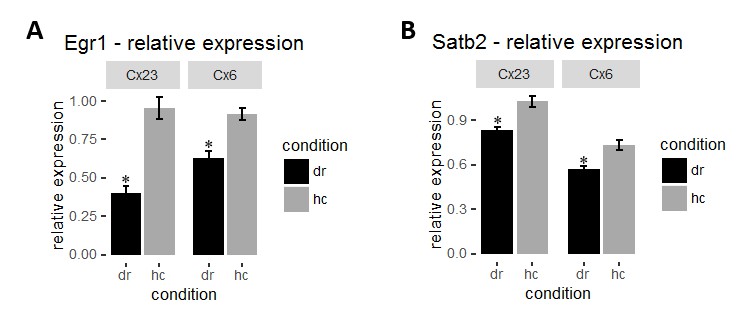
(A) Mean intensity of Egr1 in each layer was normalized to corresponding layer 4 for each mouse to obtain relative Egr1 expression. Dark-rearing leads to a significant reduction in relative Egr1 levels in layer 2/3 and 6. (B) Dark-rearing leads to a reduction in relative Satb2 levels in layer 2/3 and 6.
Additional files
-
Supplementary file 1
List of primers used in RT-qPCR and ChIP-qPCR analyses.
- https://doi.org/10.7554/eLife.17361.027
Download links
A two-part list of links to download the article, or parts of the article, in various formats.
Downloads (link to download the article as PDF)
Open citations (links to open the citations from this article in various online reference manager services)
Cite this article (links to download the citations from this article in formats compatible with various reference manager tools)
Satb2 determines miRNA expression and long-term memory in the adult central nervous system
eLife 5:e17361.
https://doi.org/10.7554/eLife.17361


