bicoid mRNA localises to the Drosophila oocyte anterior by random Dynein-mediated transport and anchoring
- University of Cambridge, United Kingdom
- Princeton University, United States
Figures
Figure 1 with 1 supplement
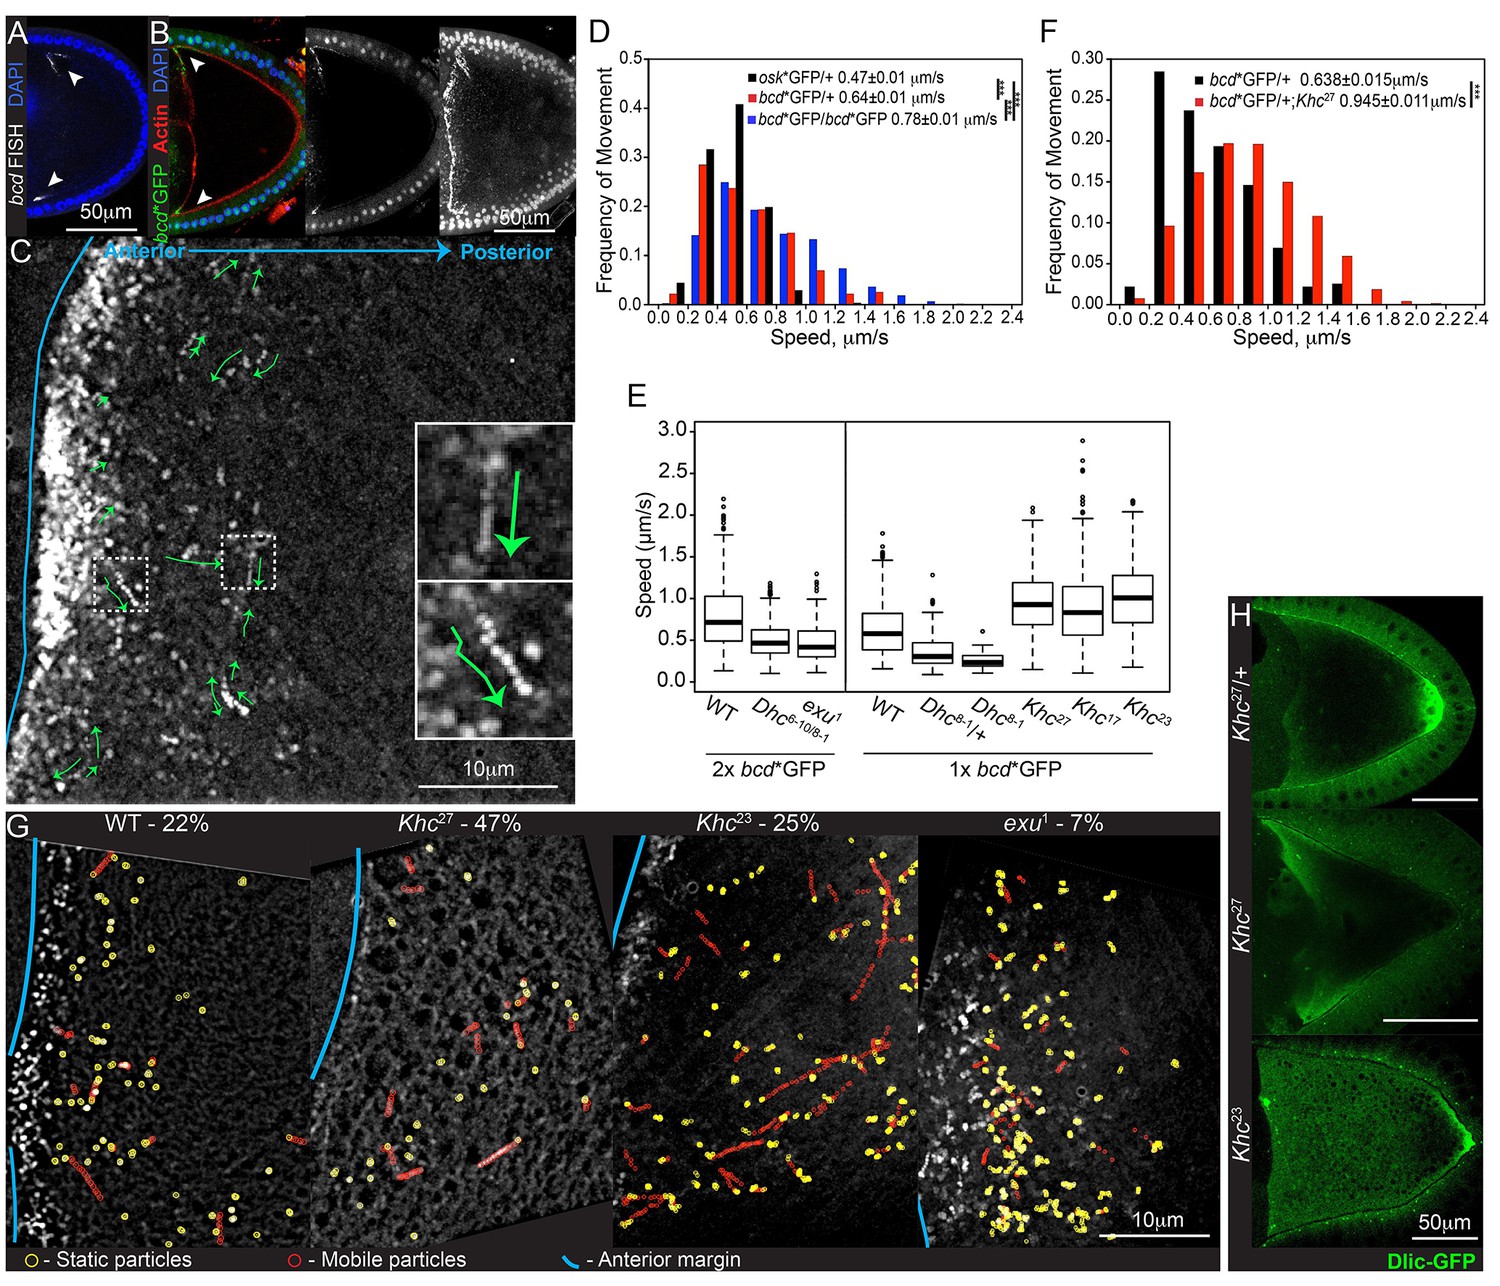
bcd mRNA is actively transported by cytoplasmic Dynein along microtubules.
(A–B) Confocal microscopy images of stage 9 egg chambers showing that the endogenous (A; FISH) and transgenic bcd mRNA (B; bcd*GFP) have the same anterior-lateral localization (arrowheads); DNA (DAPI) in blue. (B) Left – mid-sagittal plane, with bcd*GFP in green and actin (Phalloidin-TRITC) in red; middle – mid-sagittal plane, with bcd*GFP alone; right – maximum intensity projection over half of the oocyte volume, showing the anterior-lateral ring of bcd*GFP. (C) Time-projection of high-magnification, wide-field live imaging of bcd*GFP particles; the green arrows highlight moving particles; the blue line marks the oocyte anterior; insets are magnifications of the dashed white boxes. (D) Speed distribution of fast osk mRNA (black; Zimyanin et al, 2008) or bcd mRNA particles (red - one copy of bcd*GFP; blue - two copies of bcd*GFP). (E) Boxplot of the speeds of bcd mRNA particles in wild-type and mutant oocytes. (F) Speed distribution of fast bcd mRNA particles in wild-type and Khc27 mutant oocytes. (G) Time-projection of high-magnification, wide-field live imaging of bcd*GFP particles in wild-type and mutant oocytes; yellow circles highlight static particles, red circles highlight moving particles and the blue line indicates the oocyte anterior; the percentages show the mobile fraction of bcd mRNA particles during 5 s intervals. (H) Dlic-GFP in wild-type, Khc27 and Khc23 mutant stage 9 oocytes.
Figure 1—figure supplement 1
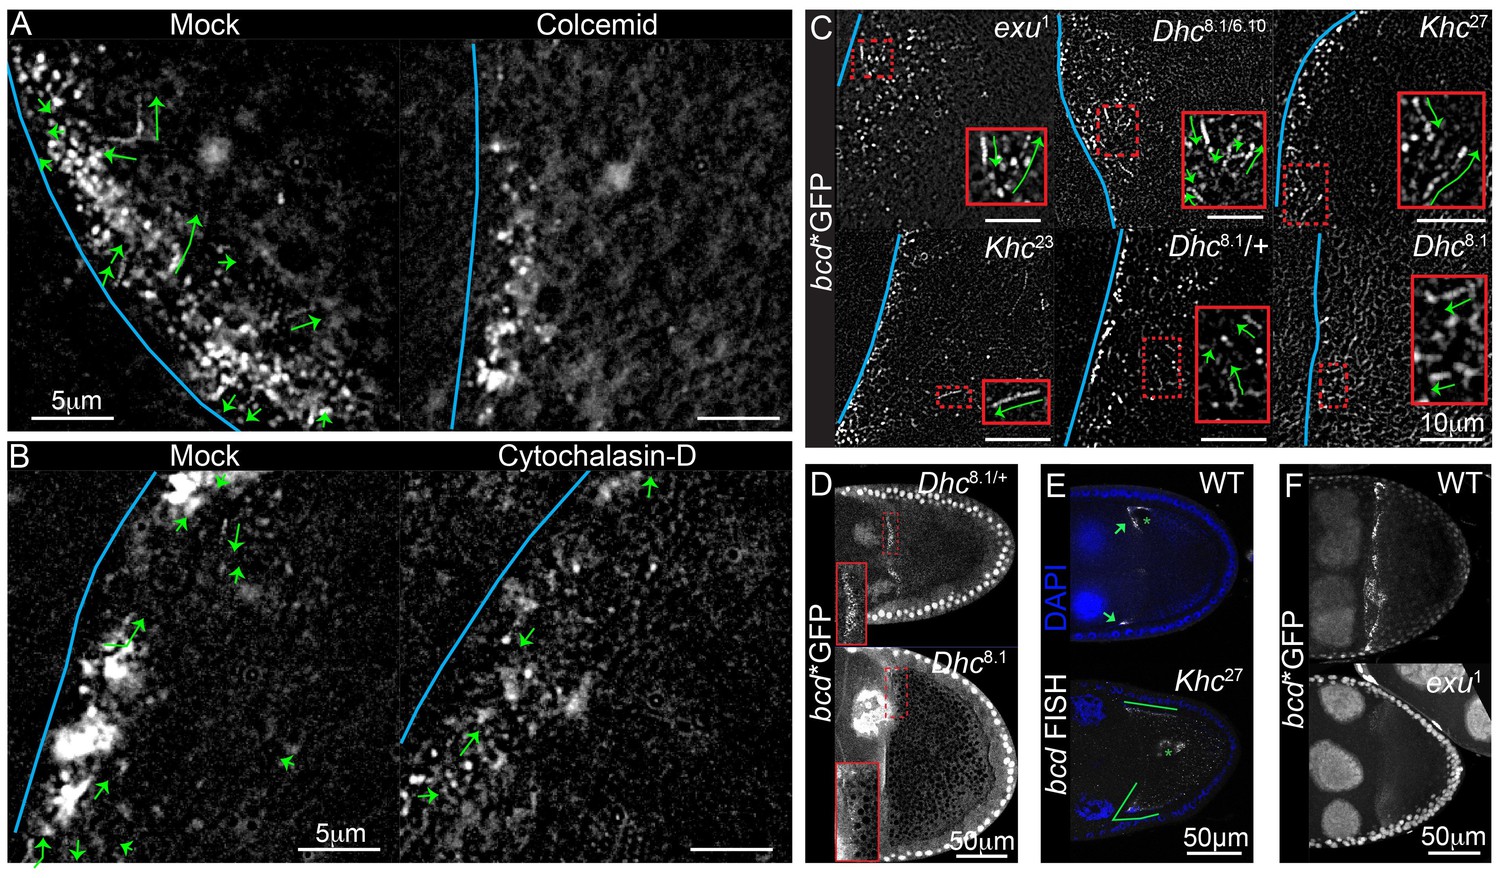
bcdmRNA is actively transported by cytoplasmic Dynein along microtubules.
(A–C) Time-projection of high-magnification wide-field live imaging of bcd*GFP particles in stage 9 oocytes. (A) Wild-type egg chambers were treated with the microtubule depolymerising drug, Colcemid (mock or 400 μg/ml), for 20 min prior to imaging; microtubule depolymerisation abolished all fast movements of bcd mRNA particles. (B) Wild-type oocytes were treated with the actin depolymerising drug, Cytochalasin D (mock or 10 μg/ml), for 20 min prior to imaging. (C) Oocytes from mutants for Dhc, Khc and exu; the blue lines indicate the oocyte anterior; the green arrows represent moving particles of bcd*GFP; insets are magnifications of the red dashed boxes. (D–F) Confocal images of bcd*GFP (D,F) or endogenous bcd mRNA (RNA FISH; E) in Dhc8-1 (D), Khc27 (E) and exu1 (F; Maximum intensity projection over the full volume of the oocyte) mutant stage 9 egg chambers and respective controls; the insets are close-ups of the red dashed boxes; the arrows indicate the normal localization of bcd mRNA to the anterior/lateral corner of the oocyte, whereas the green lines indicate the anterior/lateral spread of the RNA; asterisks indicate the oocyte nucleus.
Figure 2 with 1 supplement

Fast bcd mRNA particles have little directional bias towards the oocyte anterior.
(A) Directionality of the fast bcd*GFP particles imaged near the cortex of stage 9 oocytes; i) Windchart of the frequency of movements per angle interval; the upper semi-circle shows all particles whereas the lower semi-circle shows particles according to their distance from the oocyte anterior; ii) Frequency and average speed of bcd*GFP particles moving towards the anterior or posterior of the oocyte; iii) Frequency table of bcd*GFP particles moving in anterior, posterior or lateral directions. (B–C) Average speed (mean ± S.E.M., 9 oocytes) (B) and speed distribution (C) of bcd*GFP particles moving towards the anterior (black bar) or posterior (red bar) of wild-type oocytes. (D–E) Average speed (mean ± S.E.M., 6 oocytes) (D) and speed distribution (E) of bcd*GFP particles moving towards the anterior (black bar) or posterior (red bar) of Khc27 mutant oocytes. (F–H) Confocal images of microtubules (α-tub; F), endogenous bcd mRNA (RNA FISH; G) or endogenous hts mRNA (RNA FISH; H) in wild-type and shot2A2 mutant oocytes.
-
Figure 2—source data 1
Tracking of bcd*Tom particles in wild- stage 9 oocytes.
Includes the data in: Figure 2—figure supplement 1, panel B.
- https://doi.org/10.7554/eLife.17537.012
Figure 2—figure supplement 1
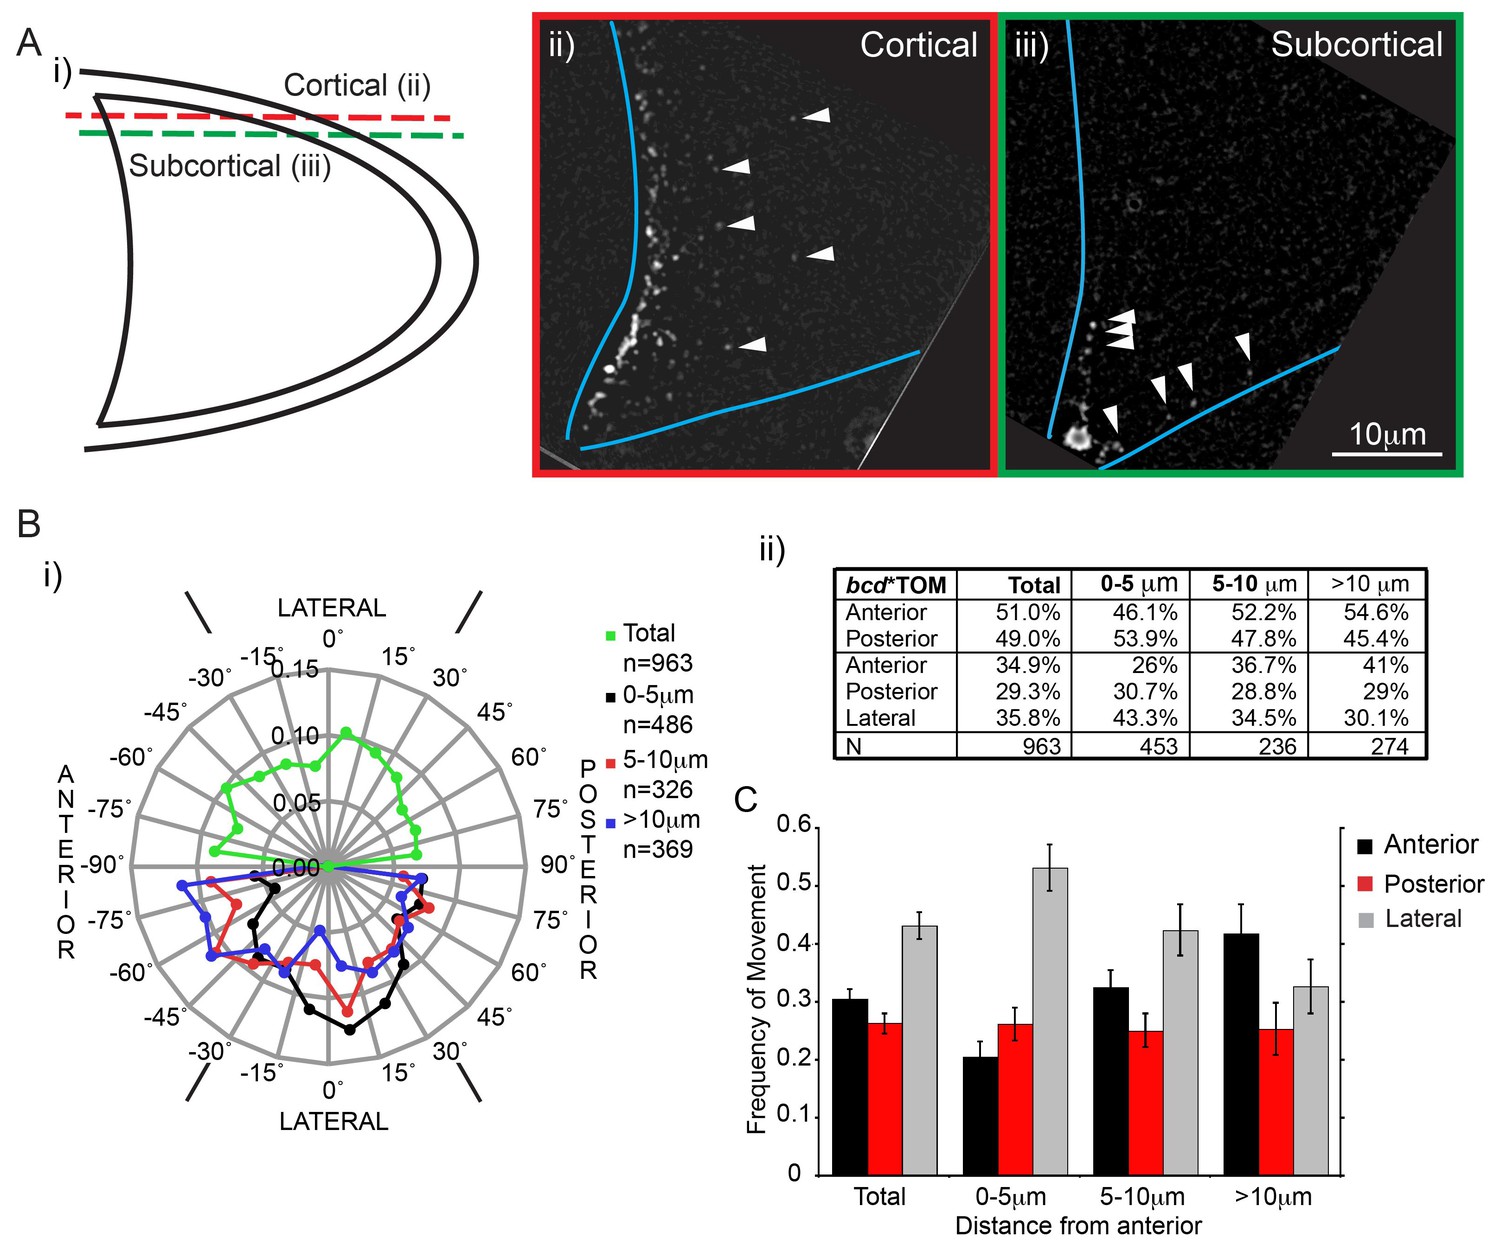
Fast bcd mRNA particles have little directional bias towards the oocyte anterior.
(A) Scheme (i) and examples of cortical (ii) and sub-cortical (iii) focal planes of stage 9 oocytes expressing bcd*Tomato; blue lines show the oocyte margins; arrowheads show individual RNA particles. (B) Directionality of fast bcd*Tomato particles imaged at a deeper, subcortical optical section (as in Aiii)); i) Windchart of the frequency of movements per angle interval; the upper semi-circle shows all particles, whereas the lower semi-circle shows particles according to their distance from the anterior; ii) Frequency table of particles moving in anterior or posterior directions, or in anterior, posterior or lateral directions. (C) Average frequency (mean ± S.E.M., 9 oocytes) of bcd*GFP particle movements in anterior, posterior or lateral directions relative to their distance from the oocyte anterior.
Figure 3 with 1 supplement

Localised bcd mRNA is anchored at the anterior of the oocyte.
(A–E) Confocal time-series of FRAP experiments at the anterior of stage 9 oocytes (A–C) and the corresponding fluorescence recovery curves (D–E). (A–B) Egg chambers expressing bcd*GFP were treated with Colcemid (B, 400 μg/ml) or control vehicle alone (A) 20 min prior to photobleaching. (C) Egg chamber expressing only MCP-GFP. (D–E) Graphs of FRAP of bcd*GFP or MCP-GFP alone, before (D) or after (E) removal of the fast-recovering, nonspecific component. (F–K) Confocal time-series of photo-converted localised bcd*Dendra2 (F,I), osk*Dendra2 (G) and hts*Dendra2 (H) and the corresponding fluorescence decay graphs after removal of the fast-recovering, nonspecific component (J–K). Dashed lines mark the outline of the oocyte; arrows indicate the photobleached or photo-converted regions and the insets are the corresponding close-ups. *** F-test P value <0.0001. N.S. Statistically not significant.
-
Figure 3—source data 1
Photo-conversion data for bcd*Dendra2 and grk*Dendra2 (only timepoints 10 min and 60 min after photo-conversion).
Includes the data in: Figure 3—figure supplement 1, panel D.
- https://doi.org/10.7554/eLife.17537.015
Figure 3—figure supplement 1
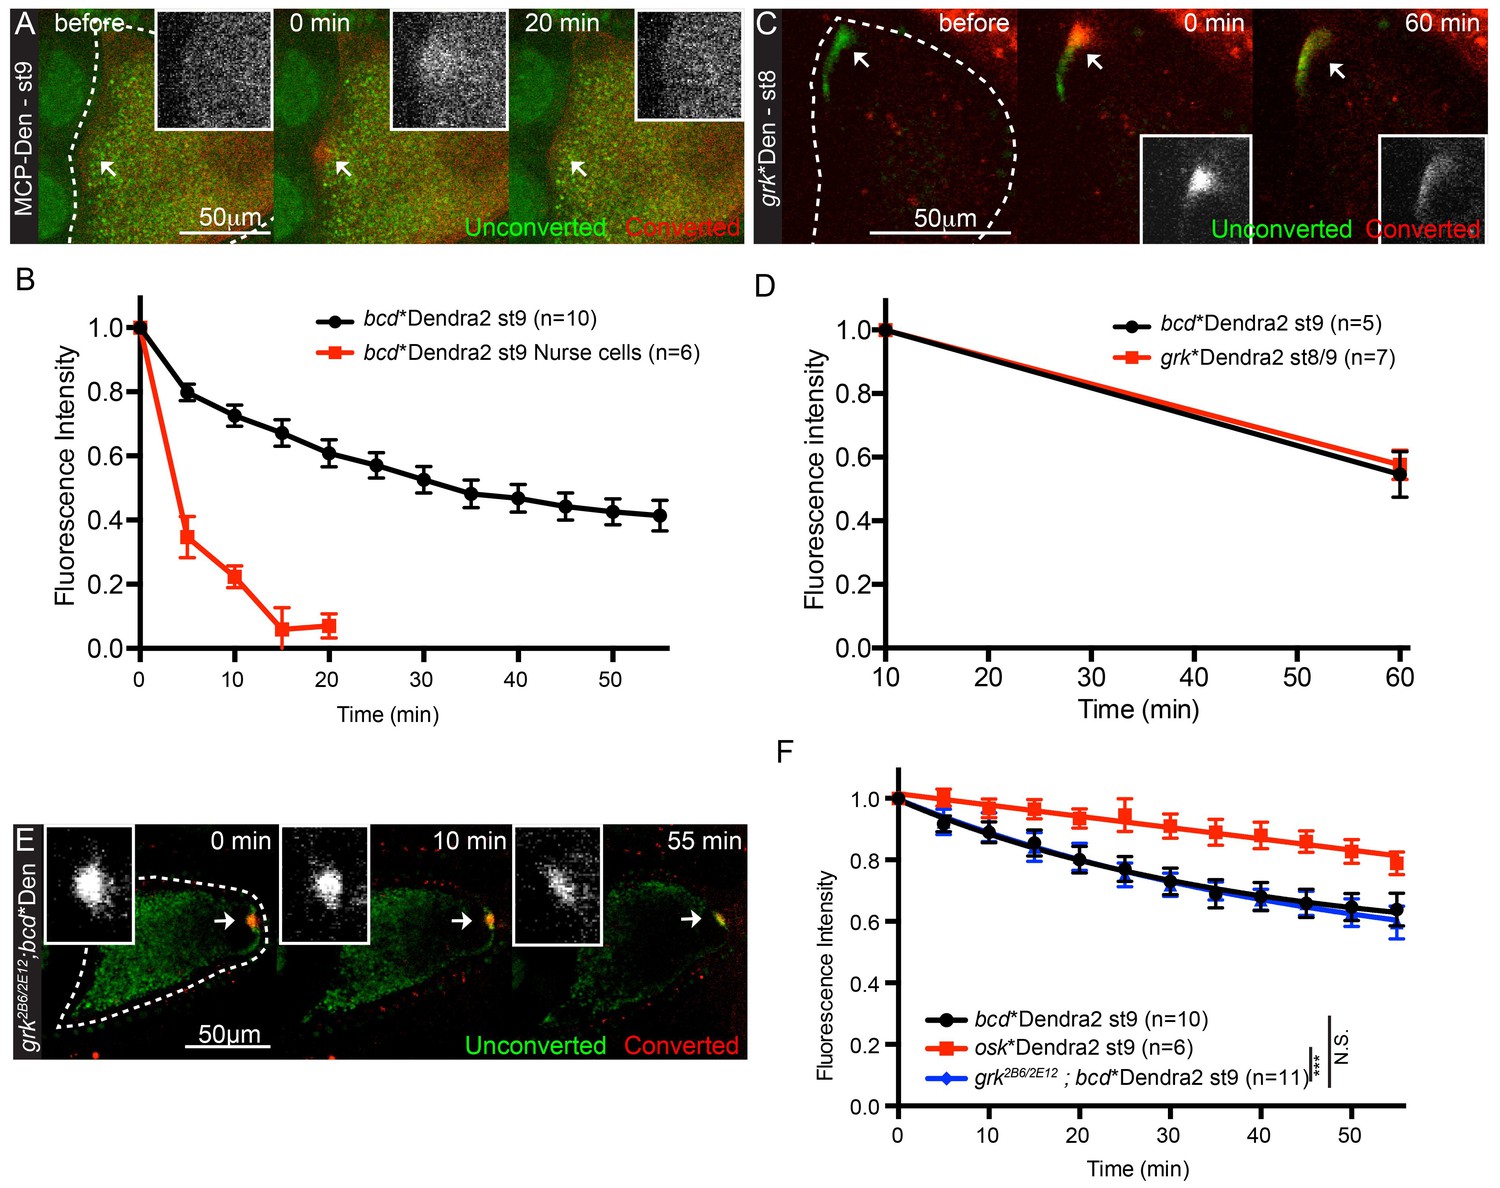
Localised bcd mRNA is anchored at the anterior of the oocyte.
(A) Confocal time-series of photo-conversion at the anterior of stage 9 oocytes expressing just MCP-Dendra2. (B) Graph of the fluorescence decay of photo-converted bcd*Dendra2 in stage 9 egg-chambers. (C–D) Confocal time-series of the photo-conversion of localised grk*Dendra2 in stage 8 oocytes (C) and the corresponding fluorescence decay graph (D). (E–F) Confocal time-series of photo-conversion of posteriorly-localised bcd*Dendra2 in grk2B6/2E12 mutant stage 9 oocytes (E) and the corresponding fluorescence decay graph (F). The arrows indicate the photo-converted regions and the insets are the corresponding close-ups. ***F-test P value <0.0001. N.S. – Not statistically significant.
Figure 4 with 1 supplement
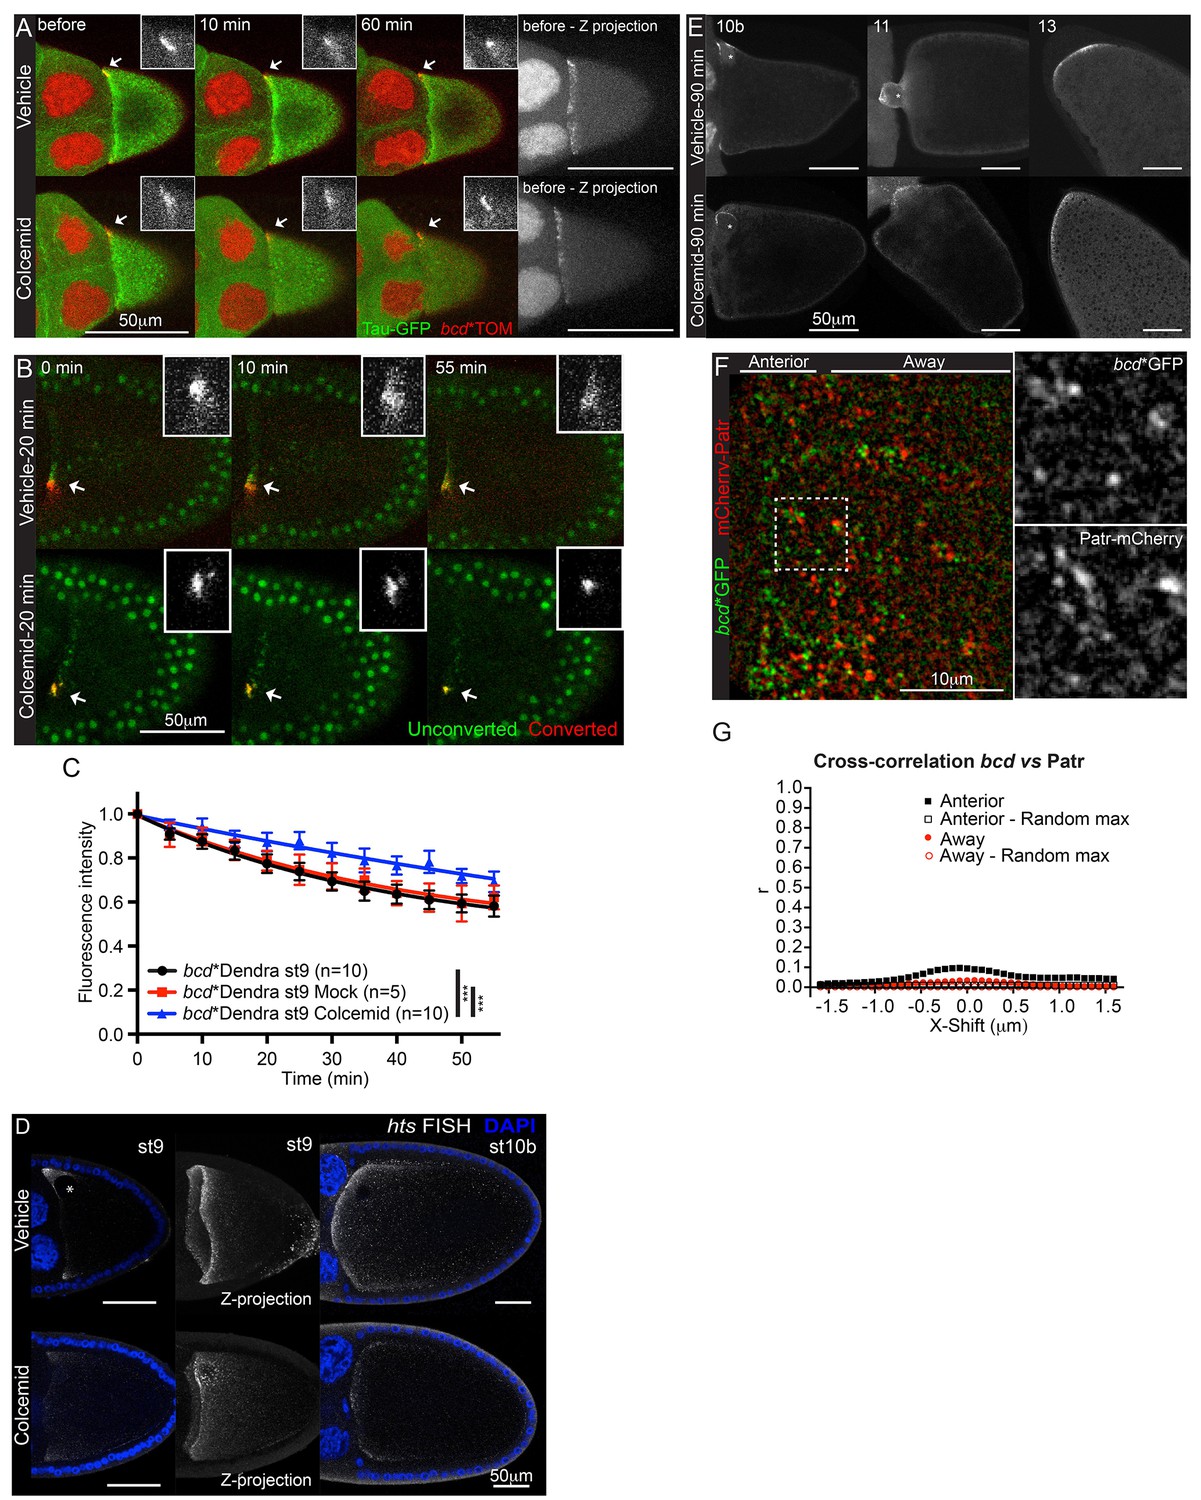
bcd mRNA is not anchored on microtubules at the anterior of stage 9 oocytes.
(A–B) Confocal time-series of stage 9 egg chambers expressing bcd*TOM and Tau-GFP (A) or bcd*Dendra2 (B) treated with the microtubule-depolymerising drug, Colcemid (mock or 400 μg/ml); the arrows indicate anteriorly localised bcd*TOM (A) or photo-converted bcd*Dendra2 (B) and the insets are the corresponding close-ups. (A) Colcemid was added to medium 15 min after the beginning of imaging; Images on the right are maximum intensity projections over the Z-dimension, showing the anterior-lateral ring of bcd*TOM. (B) Colcemid was added to the medium 20 min prior photo-conversion of localised bcd*Dendra2. (C) Graph of the fluorescence decay of photo-converted Dendra2 (B), after removal of the fast-recovering, nonspecific component; ***F-test p value <0.0001. (D) Confocal imaging of endogenous hts mRNA (FISH) in stage 9 (left - single confocal section; right - maximum intensity projection of the full volume of the oocyte) and stage 10b egg chambers after 90 min treatment with Colcemid (mock or 400 μg/ml); DNA (DAPI) in blue; asterisk indicates the oocyte nucleus. (E) Confocal images of bcd*TOM in stage 10b, 11 and 13 egg chambers after 90 min treatment with Colcemid (mock or 400 μg/ml); asterisks indicate the oocyte nucleus. (F–G) High magnification wide-field two-colour imaging of bcd*GFP and the minus-end microtubule marker, mCherry-Patronin, in stage 9 oocytes (F), and the corresponding Van Steensel co-localisation analysis (G).
-
Figure 4—source data 1
Van Steensel co-localisation analyses of bcd*GFP and mCherry-Patr.
Includes the data in: Figure 4, panel G.
- https://doi.org/10.7554/eLife.17537.025
-
Figure 4—source data 2
Van Steensel co-localisation analyses of bcd*Tom and Tau-GFP.
Includes the data in: Figure 4—figure supplement 1, panel B.
- https://doi.org/10.7554/eLife.17537.026
Figure 4—figure supplement 1
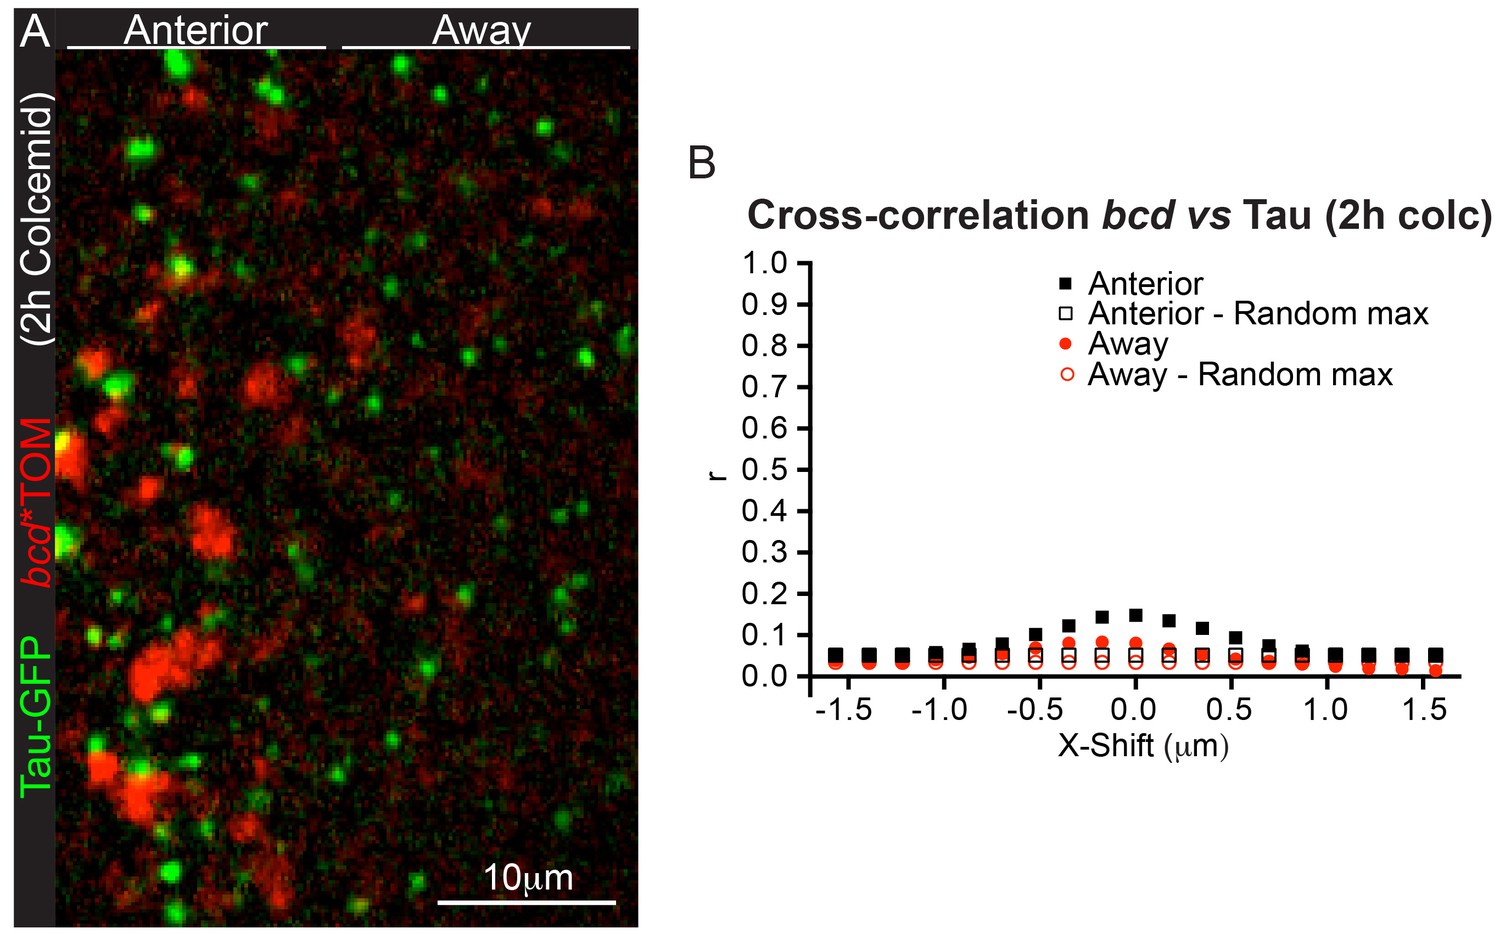
bcdmRNA is not anchored on microtubules at the anterior of stage 9 oocytes.
(A–B) High magnification imaging of the microtubule marker, Tau-GFP (green), and bcd*Tomato (red) in stage 9 oocytes, after feeding flies for 2 hr with fresh yeast paste containing Colcemid (150 μg/ml) (A), and the corresponding Van Steensel co-localisation analysis (B).
Figure 5
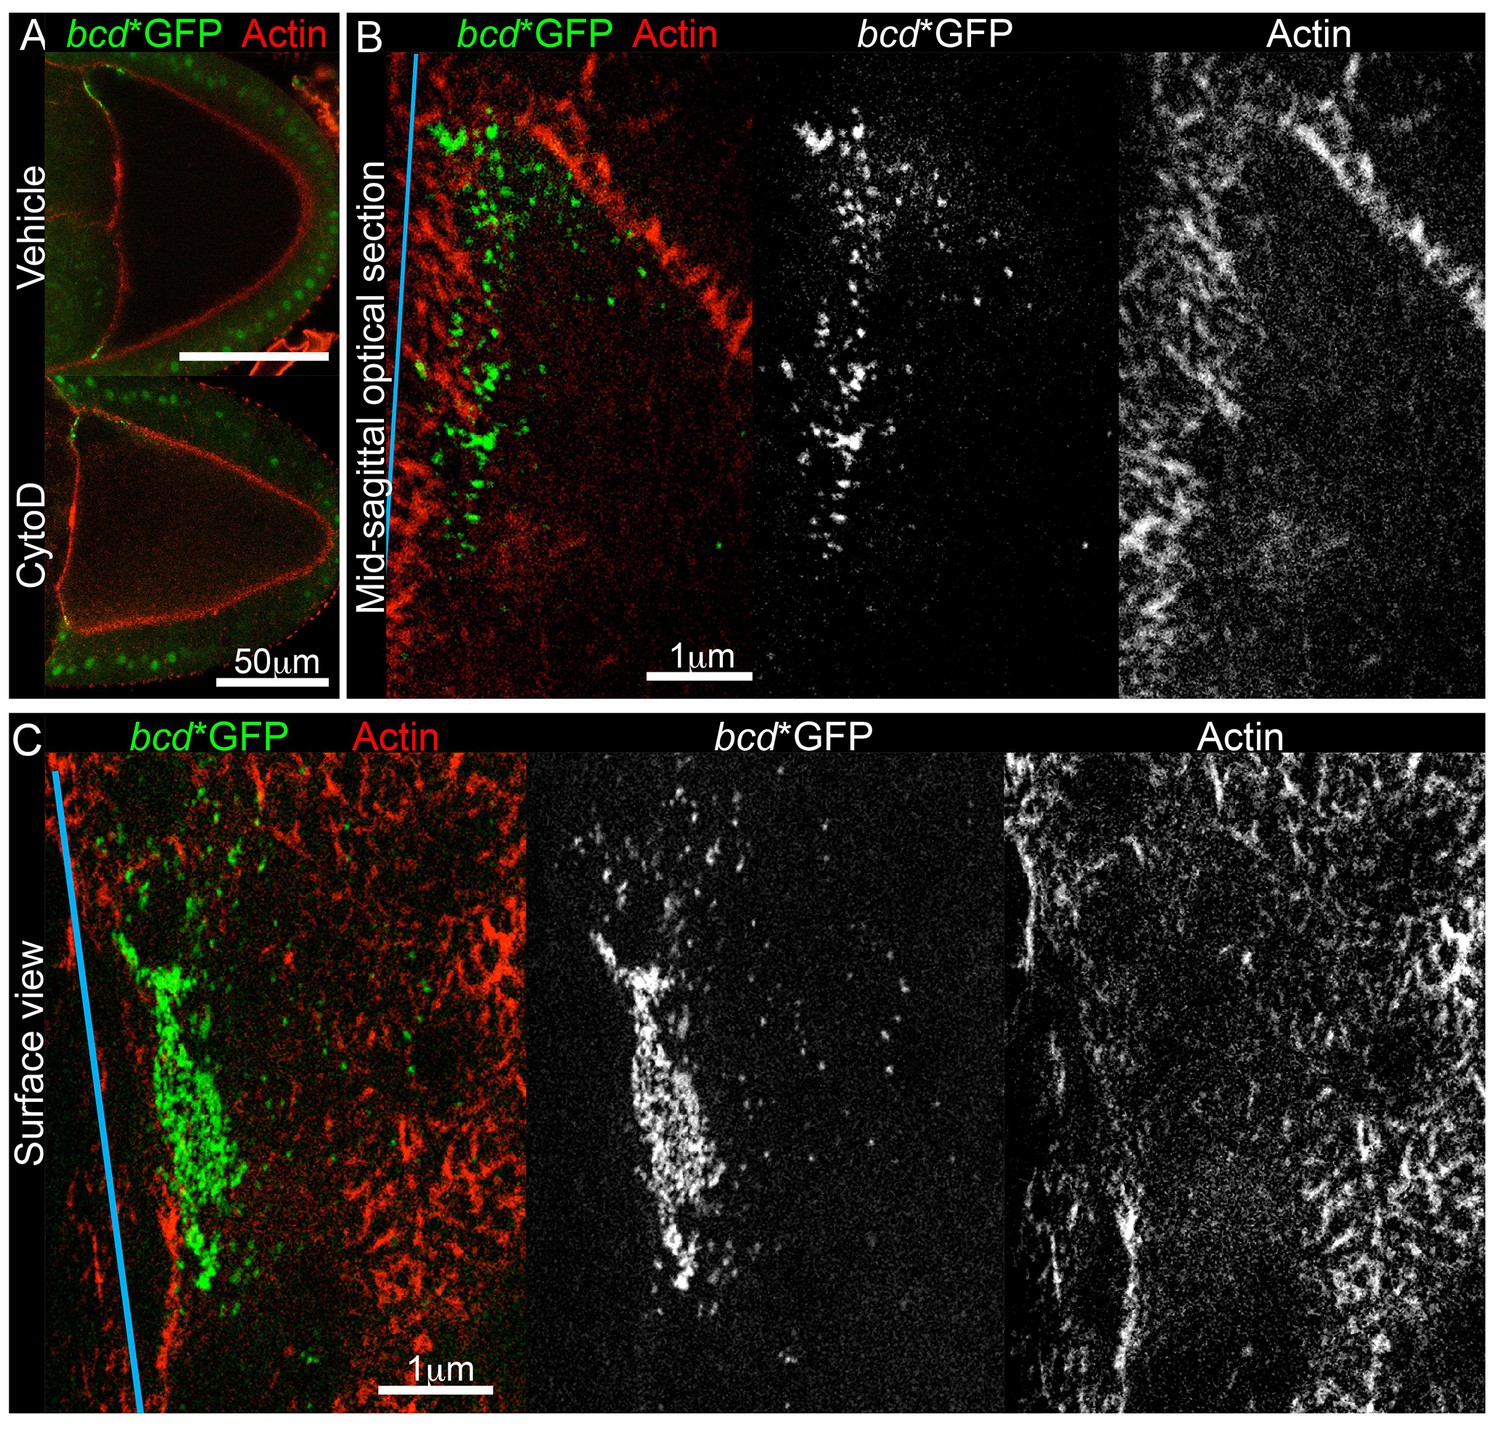
bcd mRNA is not directly anchored on cortical actin at the anterior of stage 9 oocytes.
(A) Confocal imaging of stage 9 egg chambers expressing bcd*GFP (green) and labelled for actin (Phalloidin-TRITC, red), after 90 min treatment with the actin-depolymerising drug, Cytochalasin D (mock or 10 μg/ml). (B–C) STED super-resolution mid-sagittal (B) or surface (C) images of stage 9 egg chambers expressing bcd*GFP (stained with GFP-Booster-ATTO647N, green) and labelled for actin (Phalloidin-ATTO590, red); spectral unmixing was applied to the images; the blue line indicates the oocyte anterior.
Figure 6

bcd mRNA partially co-localise to P-bodies at the anterior of stage 9 oocytes.
(A–B) High magnification wide-field imaging of bcd*GFP (green) and the P-body component, Tral-mRFP (red) (A), and the corresponding Van Steensel co-localisation analysis (B) in stage 9 oocytes. (C) STED super-resolution imaging of a stage 9 egg chamber expressing bcd*GFP (GFP-Booster-ATTO647N, green) and immuno-labelled for the P-body component Me31B (ATTO590, red); spectral unmixing was applied to the image; the blue line indicates the oocyte anterior. (D) Confocal image of a wild-type stage 9 oocyte expressing bcd*GFP (green) and Tral-RFP (red). (E) Confocal imaging of endogenous bcd mRNA (RNA FISH) in wild-type and Ge-1Δ5 mutant stage 9 oocytes.
-
Figure 6—source data 1
Van Steensel co-localisation analyses of bcd*GFP and Tral-mRFP.
Includes the data in: Figure 6, panel B.
- https://doi.org/10.7554/eLife.17537.031
Figure 7 with 1 supplement
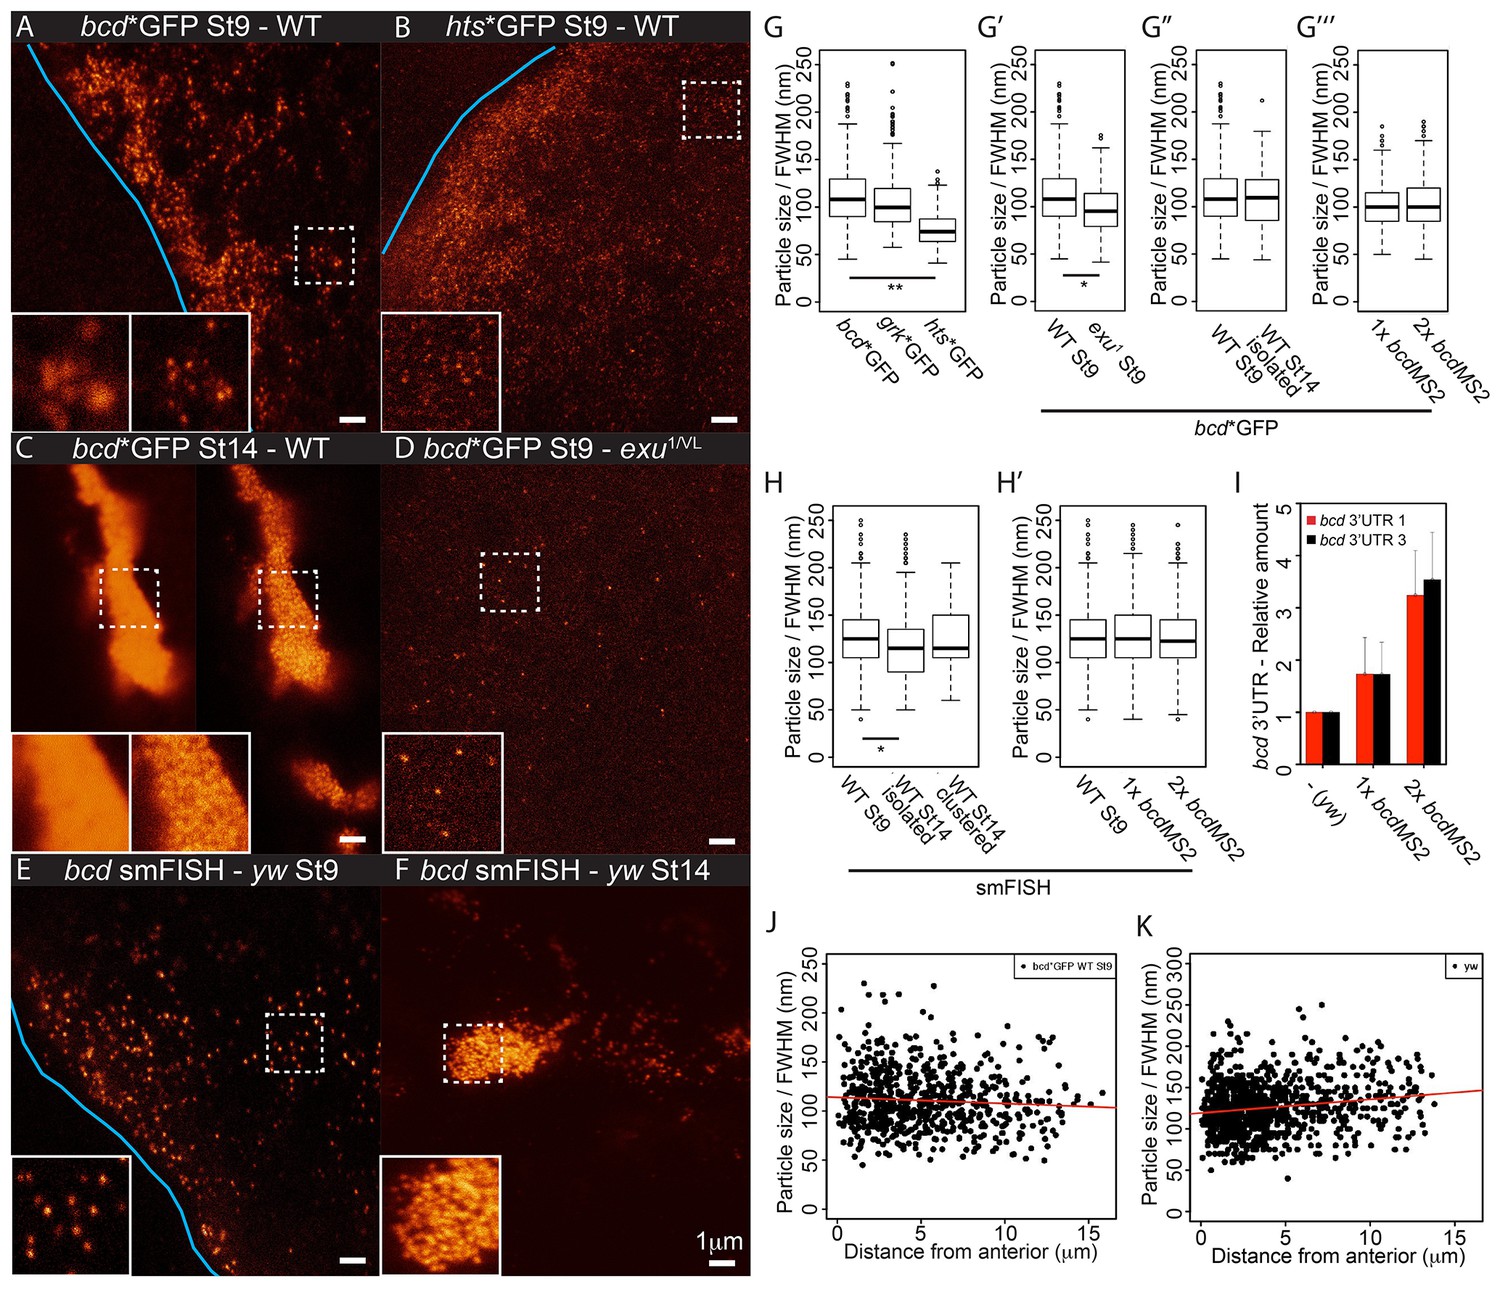
bcd mRNA assembles into stereotypical particles.
(A–F) STED super-resolution imaging of mRNA particles labeled with GFP (A–D) or single molecule fluorescence in situ hybridization (smFISH) (E–F). (A,C,D) bcd*GFP in wild-type stage 9 (A) and stage 14 oocytes (C, confocal mode on the left, STED mode on the right), and exu1/exuVL stage 9 oocytes (D). (B) hts*GFP in wild-type stage 9 oocytes. (E–F) smFISH of endogenous bcd mRNA in stage 9 and stage 14 oocytes. The blue lines indicate the oocyte anterior; the insets are close-ups of the dashed boxes, confocal mode on the left, STED mode on the right. (G–H) Boxplots of the sizes of RNA particles labelled with MCP-GFP (G) or smFISH (H). (G) bcd*GFP, grk*GFP and hts*GFP in stage 9 oocytes. (G’) bcd*GFP particles from wild-type and exu1/exuVL stage 9 oocytes. (G’’) bcd*GFP particles in wild-type oocytes at stage 9 and the isolated particles at stage 14. (G’’’) bcd*GFP particles in stage 9 oocytes expressing one or two copies of the bcdMS2 transgene. (H) bcd RNA particles in wild-type oocytes at stage 9 and isolated or clustered particles at stage 14. (H’) Stage 9 oocytes expressing only endogenous bcd RNA or one or two additional copies of the bcdMS2 transgene. (I) Relative amounts of bcd 3’UTR (RT-qPCR) in ovaries expressing only endogenous bcd mRNA (yw) or one or two additional copies of the bcdMS2 transgene (2 primer pairs, mean ± S.E.M., 3 biological replicates). (J–K) Scatterplots of particle sizes versus distance from the anterior in stage 9 oocytes. (J) MCP-GFP-labelled transgenic bcdMS2. (K) smFISH-labelled endogenous bcd RNA. *p<0.05; **p <0.01.
Figure 7—figure supplement 1
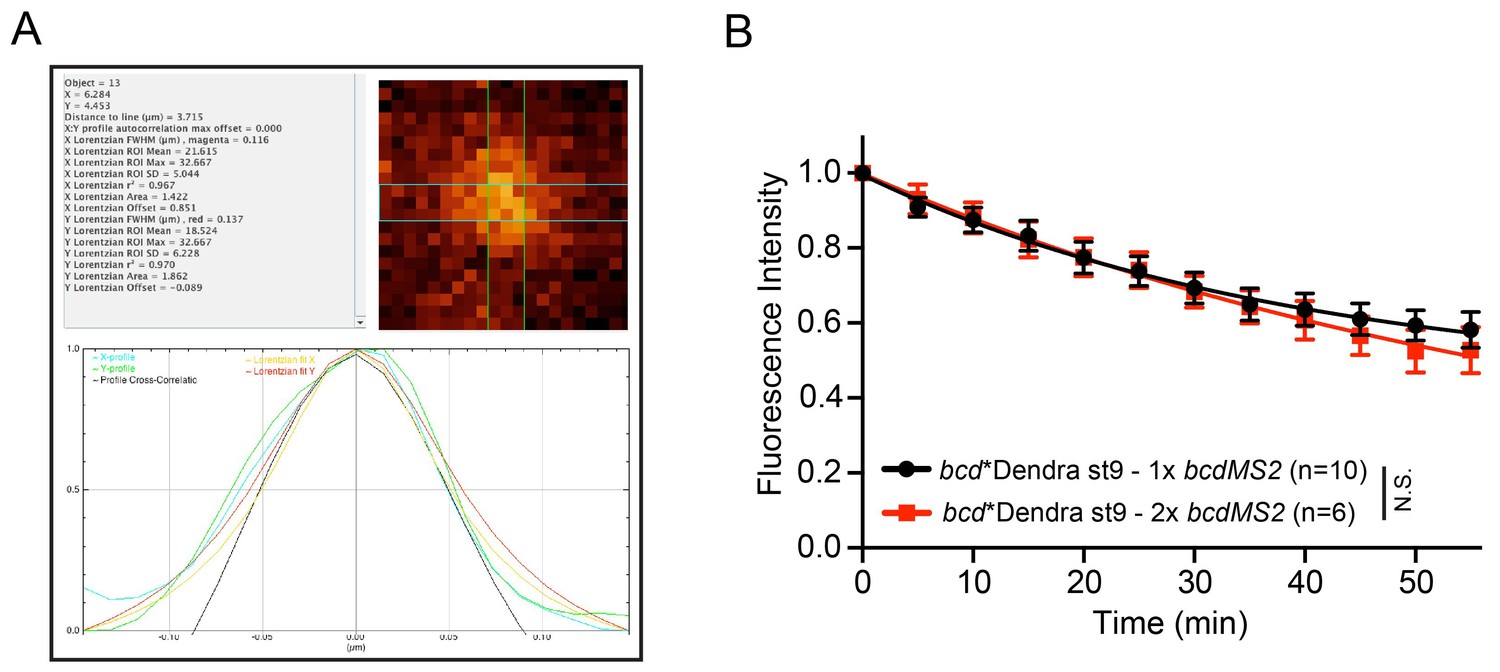
bcd mRNA assembles into stereotypical particles.
(A) Example of a bcd*GFP particle curve-fitted by the Fiji plugin, Profiler. (B) Graph of the fluorescence decay of photo-converted localised bcd*Dendra2 in oocytes expressing one or two copies of bcdMS2; N.S. – F-test p value not statistically significant.
Figure 8
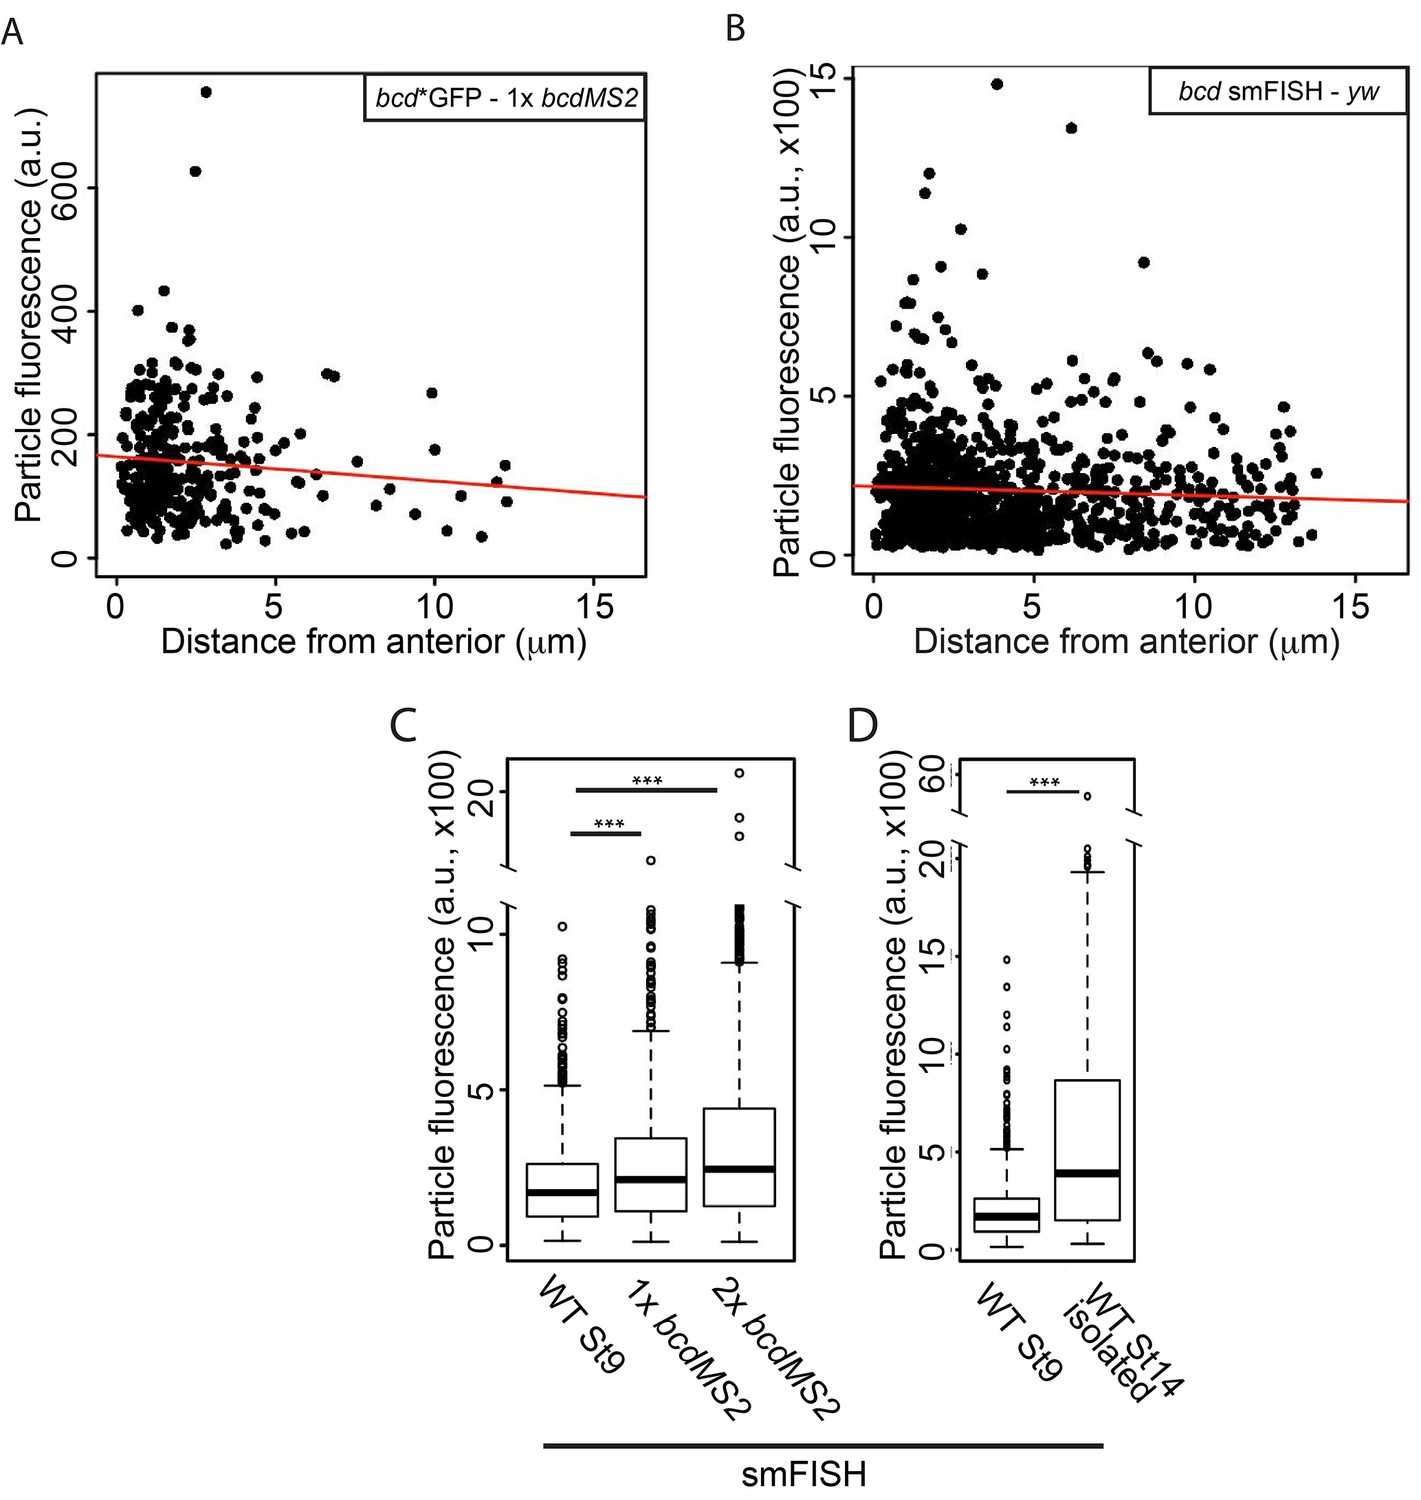
The RNA content of the bcd mRNA particles increases during oogenesis and with higher gene dosage.
(A–B) Scatterplots of the summed fluorescence intensities of bcd RNA particles versus distance from the anterior at stage 9. (A) GFP-labelled transgenic bcdMS2. (B) smFISH-labelled endogenous bcd RNA (yw genotype). (C–D) Boxplots of the summed fluorescence intensities of bcd RNA particles. (C) smFISH-labelled bcd RNA particles from stage 9 oocytes expressing only endogenous bcd mRNA (yw) or one or two additional copies of the bcdMS2 transgene. (D) smFISH-labelled bcd RNA particles from stage 9 and stage 14 (isolated) oocytes expressing only endogenous bcd mRNA (yw). ***p<0.001.
Figure 9
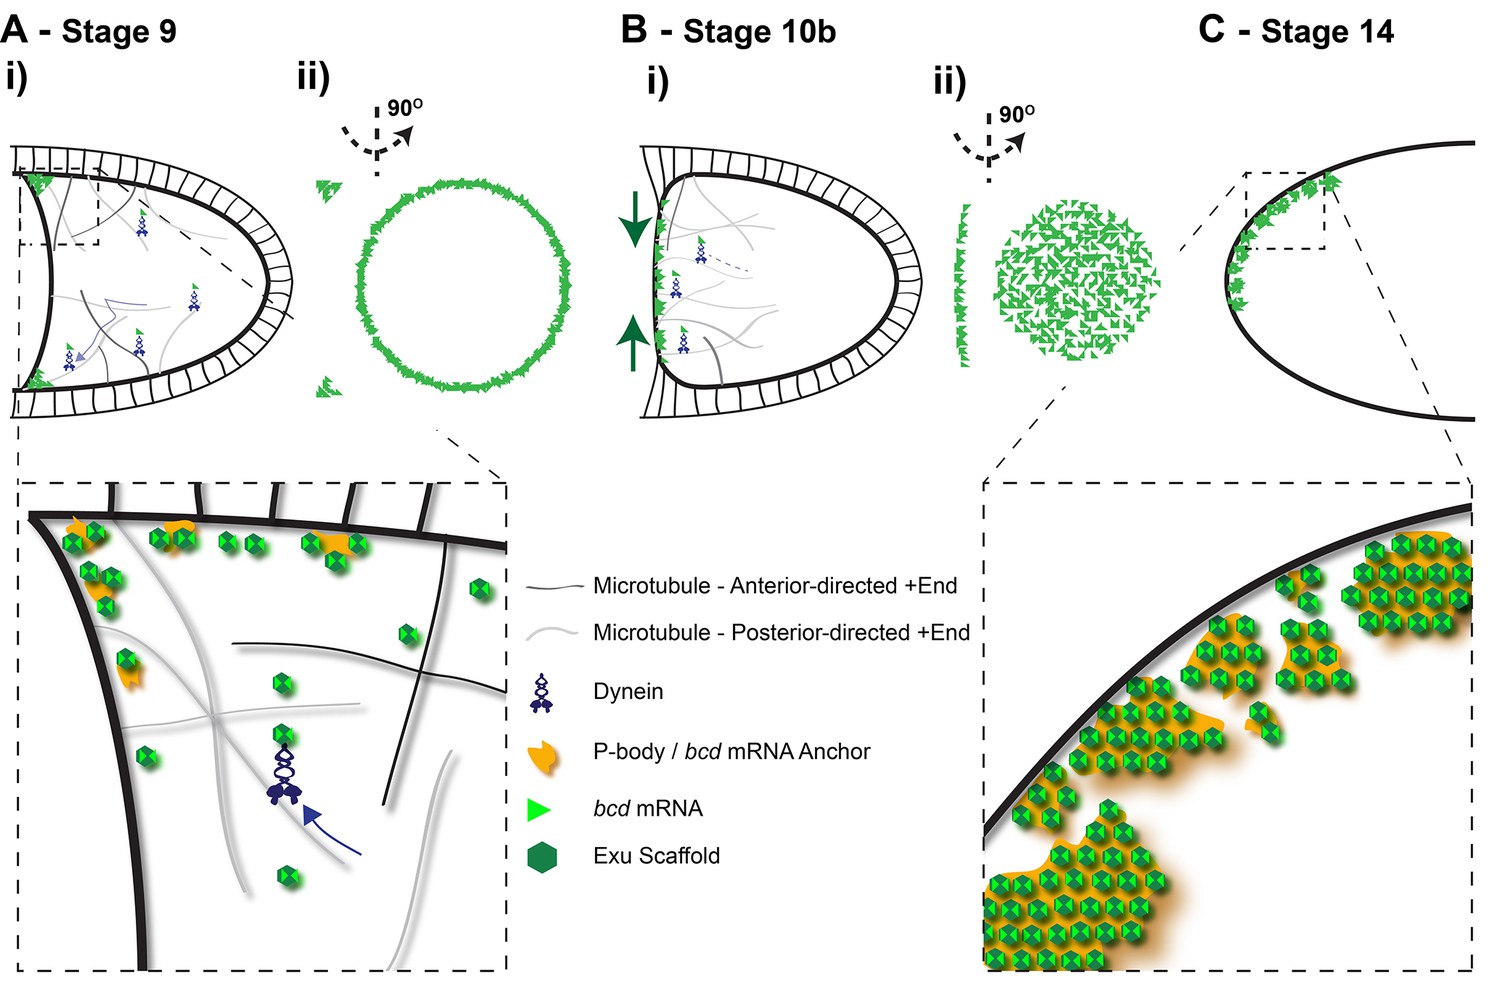
Diagram of the steps in bcd mRNA localisation during oogenesis.
(A) Stage 9 of oogenesis: bcd mRNA localises to the anterior-lateral margins of the oocyte (i), forming a ring when viewed end on (ii). Close-up: bcd mRNA is assembled into Exu-dependent particles that are actively transported by Dynein along an unpolarised microtubule cytoskeleton; On reaching the anterior, bcd RNA particles are anchored independently of microtubules, possibly by docking to P-bodies. (B) Stage 10b of oogenesis: Following the reorganisation of microtubule minus-ends, bcd mRNA re-localises from the anterior-lateral margin to form a disc at the centre of the anterior cortex of the oocyte. (C) Stage 14 of oogenesis: bcd mRNA particles cluster into large aggregates at the oocyte cortex.
Videos
Video 1
(related to Figure 1C) – bcd mRNA assembles into particles that undergo fast active transport.
High-magnification, wide-field live imaging of bcd*GFP in stage 9 oocytes. The right panel shows the fast moving RNA particles as coloured tracks. Images were acquired at a rate of 0.64 s/frame.
Video 2
(related to Figure 1—figure supplement 1C) – bcd mRNA particles undergo microtubule-dependent active transport.
High-magnification, wide-field live imaging of bcd*GFP in stage 9 oocytes, with and without depolymerisation of microtubules. Left – mock; Right – Colcemid (400 μg/ml). The fast moving RNA particles are shown as coloured tracks. Images were acquired at a rate of 0.18 s/frame.
Video 3
(related to Figure 3A–B) – Anteriorly-localised bcd mRNA has slow and limited turn-over.
FRAP of anteriorly-localised bcd*GFP in stage 9 oocytes, with and without depolymerisation of microtubules. Left – Control; Right – Colcemid (400 μg/ml). Confocal images were acquired every 5 min, for 60 min.
Video 4
(related to Figure 3F) – Localised bcd mRNA is stably anchored at the oocyte anterior.
Photo-conversion of anteriorly-localised bcd*Dendra2 in a stage 9 oocyte. Left – Unconverted bcd*Dendra2 in green, photo-converted in red; Right – Photo-converted bcd*Dendra2 alone. Confocal images were acquired every 5 min, for 55 min.
Video 5
(related to Figure 3H) – Localised hts mRNA is less stable at the oocyte anterior and spreads laterally.
Photo-conversion of anteriorly-localised hts*Dendra2 in a stage 9 oocyte. Left – Unconverted hts*Dendra2 in green, photo-converted in red; Right – Photo-converted hts*Dendra2 alone. Confocal images were acquired every 5 min, for 55 min.
Video 6
(related to Figure 4A) – Localised bcd mRNA is anchored at the oocyte anterior independently of microtubules.
Confocal live imaging of bcd*Tom and the microtubule marker, Tau-GFP, in stage 9 oocytes, with and without depolymerisation of microtubules. Top – mock control; Bottom – Colcemid (400 μg/ml). Colcemid was added 15 min after the start of imaging. Confocal images were acquired every 5 min.
Tables
Table 1
Parameters of fast bcd mRNA in wild-type and mutant oocytes.
Genotype (2x bcd*GFP) | Tracks (n) | Movies (n) | Oocytes (n) | Anterior Mov (%/n) | Binomial P-value | a) | Speed ±S.E.M. (µm/s) | Wilcoxon P-value | b) | Mixed-effects P-value | c) | Track distance ±S.E.M. (µm) | Anterior displacement ±S.E.M. (µm/s) | Wilcoxon P-value | d) |
|---|---|---|---|---|---|---|---|---|---|---|---|---|---|---|---|
Wild-type | 1181 | 32 | 9 | 52.6 / 621 | 0.040 | * | 0.78 / 0.01 | 1.41 / 0.03 | 0.02 / 0.02 | 0.200 | |||||
Dhc6-10/8-1 | 669 | 7 | 5 | 50.8 / 340 | 0.350 | 0.50 / 0.01 | <2.2E-16 | *** | 6.90E-10 | *** | 1.61 / 0.05 | 0.01 / 0.01 | 0.500 | ||
exu1 | 215 | 17 | 4 | 53.0 / 114 | 0.207 | 0.47 / 0.02 | <2.2E-16 | *** | 3.10E-09 | *** | 1.39 / 0.07 | 0.03 / 0.02 | 0.230 |
Genotype (1x bcd*GFP) | Tracks (n) | Movies (n) | Oocytes (n) | Anterior Mov (%/n) | Binomial P-value | a) | Speed ±S.E.M. (µm/s) | Wilcoxon P-value | b) | Mixed-effects P-value | c) | Track distance ±S.E.M. (µm) | Anterior displacement ±S.E.M. (µm/s) | Wilcoxon P-value | d) |
|---|---|---|---|---|---|---|---|---|---|---|---|---|---|---|---|
Wild-type | 450 | 22 | 13 | 54.4 / 245 | 0.033 | * | 0.64 / 0.01 | 0.98 / 0.05 | 0.02 / 0.02 | 0.135 | |||||
Khc27 GLC | 921 | 14 | 6 | 53.7 / 495 | 0.013 | * | 0.94 / 0.01 | <2.2E-16 | *** | 1.60E-06 | *** | 1.55 / 0.04 | 0.01 / 0.02 | 0.272 | |
Khc17 GLC | 639 | 21 | 12 | 53.2 / 340 | 0.057 | 0.89 / 0.02 | <2.2E-16 | *** | 2.00E-04 | *** | 1.60 / 0.05 | 0.02 / 0.02 | 0.401 | ||
Khc23 GLC | 612 | 15 | 5 | 53.9 / 330 | 0.029 | * | 1.01 / 0.02 | <2.2E-16 | *** | 2.20E-06 | *** | 1.67 / 0.06 | 0.06 / 0.03 | 0.044 | * |
Dhc8-1/+ | 141 | 7 | 4 | - - - | - - - | 0.38 / 0.02 | 3.61E-16 | *** | 3.00E-04 | *** | 1.15 / 0.08 | 0.06 / 0.02 | - - - | ||
Dhc8-1 GLC | 43 | 16 | 7 | - - - | - - - | 0.25 / 0.02 | <2.2E-16 | *** | 3.10E-07 | *** | 0.72 / 0.06 | -0.05 / 0.03 | - - - |
-
a) Binomial test for the frequency of anterior-directed movements being >50% (one-tailed)
-
b) Wilcoxon rank sum test for speed comparisons - comparison to wild-type (2x bcd*GFP or 1x bcd*GFP)
-
c) Mixed-effects linear model (LMER) test for speed comparisons – comparison to wild-type (2x bcd*GFP or 1x bcd*GFP). Fixed Effect: Genotype; Random Effects: Variability between oocytes and movies
-
d) Wilcoxon 1-sample test for the net anterior displacement. Null hypothesis: mean=0 (two-tailed)
-
*p<0.05; **p<0.01; ***p<0.001
-
- - - Not applicable / Not done
-
Table 1—source data 1
Tracking of bcd*GFP particles in wild-type and mutant stage 9 oocytes.
Includes the data in: Table 1; Figure 1 panels D–F; Figure 2, panels A–E; Figure 2—figure supplement 1, panel C.
- https://doi.org/10.7554/eLife.17537.008
Table 2
Mobile fraction of bcd mRNA particles in wild-type and mutant oocytes.
Genotype | Oocytes | Mobile fraction/5 s | T-test P-value | a) |
|---|---|---|---|---|
bcd*GFP/+ | 5 | 0.22 ± 0.03 | ||
bcd*GFP/+;Khc27 GLC | 5 | 0.47 ± 0.02 | 0.0004 | *** |
bcd*GFP/+;Khc23 GLC | 4 | 0.25 ± 0.02 | 0.624 | |
bcd*GFP/bcd*GFP;Dhc6-10/8-1 | 4 | 0.26 ± 0.05 | 0.556 | |
bcd*GFP/bcd*GFP;exu1 | 4 | 0.07 ± 0.01 | 0.006 | ** |
-
a) T-test for comparison of mobile fractions (two-tailed) - comparisons to bcd*GFP/+ (wild-type)
-
**p<0.01; ***p<0.001
-
Table 2—source data 1
Mobile fraction of bcd*GFP particles in wild-type and mutant stage 9 oocytes.
- https://doi.org/10.7554/eLife.17537.010
Table 3
FRAP kinetics of localised bcd mRNA.
Sample | Mobile fraction @ 20 min | Fluorescence Half-time (min) | Oocyte (n) | |
|---|---|---|---|---|
MCP-GFP - St9 | 0.76 | 3.7 | 6 | |
bcd*GFP / Nurse cell - St9 | 0.71 | 2.0 | 8 |
Sample | Mobile fraction @ 55 min | Fluorescence Half-time (min) | Oocytes (n) | F-test P-value a) |
|---|---|---|---|---|
bcd*GFP - St9 - Mock | 0.33 | 52.2 | 9 | |
bcd*GFP - St9 - Colcemid | 0.10 | 75.6 | 9 | <0.0001 |
-
a) F-test for pairwise comparison of fluorescence recovery curves - comparisons to bcd*GFP/+ (wild-type)
-
Table 3—source data 1
FRAP data for MCP-GFP and bcd*GFP in stage 9 oocytes. Includes the data in: Table 3; Figure 3, panels D–E.
- https://doi.org/10.7554/eLife.17537.018
Table 4
Photo-conversion kinetics of localised mRNAs.
Sample | Mobile fraction @ 20 min | Fluorescence Half-time (min) | Oocytes (n) | ||
|---|---|---|---|---|---|
bcd*Dendra2 / Nurse cell - St9 | 0.93 | 3.2 | 10 |
mRNA | Mobile fraction @ 55 min | Fluorescence Half-time (min) | Oocytes (n) | F-test P value | |
|---|---|---|---|---|---|
bcd*Dendra2 - St9 | 0.37 | 26.0 | 10 | ||
osk*Dendra2 - St9 | 0.20 | 173.6 | 5 | <0.0001 | a) |
hts*Dendra2 - St9 | 0.59 | 31.7 | 10 | <0.0001 | a) |
bcd*Dendra2 - St10 | 0.64 | 16.1 | 8 | <0.0001 | a) |
bcd*Dendra2 - St13 | 0.39 | 24.5 | 7 | 0.81 | a) |
bcd*Dendra2 - St14 | 0.24 | 138.5 | 10 | <0.0001 | a) |
bcd*Dendra2 / grk2E12/2B6 - St9 | 0.40 | 33.2 | 11 | 0.91 | a) |
bcd*Dendra2 / 2x bcdMS2 - St9 | 0.44 | 51.4 | 5 | 0.4 | a) |
mRNA | Mobile fraction @ 55 min | Fluorescence Half-time (min) | Oocytes (n) | F-test P value | |
|---|---|---|---|---|---|
bcd*Dendra2 - St9 - Mock | 0.35 | 27.9 | 5 | 0.86 | a) |
bcd*Dendra2 - St9 - Colcemid | 0.22 | 152.1 | 5 | <0.0001 | a),b) |
-
a),b) F-test for pairwise comparison of fluorescence recovery curves. Comparisons to (a) bcd*Dendra2 - St9 or (b) bcd*Dendra2 - St9 - Mock
-
Table 4—source data 1
Photo-conversion data for all samples (MCP-Dendra2; bcd*Dendra2, osk*Dendra2 and hts*Dendra2 in wild-type stage 9 oocytes; bcd*Dendra2 in stages 10b, 13 and 14 wild-type oocytes; bcd*Dendra2 in wild-type stage9 oocytes expressing 2 copies of the bcdMS2 transgene; bcd*Dendra2 in grk mutant stage9 oocytes; bcd*Dendra2 in wild-type stage 9 oocytes treated with Colcemid or mock Control).
Includes the data in: Table 4; Figure 3, panels J-K; Figure 3—figure supplement 1, panels B, F; Figure 4, panel C.
- https://doi.org/10.7554/eLife.17537.021
Table 5
Analyses of mRNA particle properties.
Genotype | Particles (n) | Particle size ±S.E.M. (nm) | Mixed-effects test P-value | a) | Mixed-effects test P-value | b) | Summed fluorescence ±S.E.M. (a.u.) | Mixed-effects test P-value | c) | Mixed-effects test P-value | d) | |
|---|---|---|---|---|---|---|---|---|---|---|---|---|
MS2-labelling | bcd*GFP - St9 | 732 | 111.9 ± 1.1 | - - - | 0.14 | - - - | - - - | - - - | ||||
grk*GFP - St8-9 | 376 | 106.5 ± 1.6 | 0.41 | - - - | - - - | - - - | - - - | |||||
hts*GFP - St9 | 284 | 76.6 ± 1.0 | 0.002 | ** | 0.56 | - - - | - - - | - - - | ||||
bcd*GFP / exu1 - St9 | 224 | 97.9 ± 1.8 | 0.046 | * | - - - | - - - | - - - | - - - | ||||
bcd*GFP - St14 (isolated) | 165 | 109.6 ± 2.5 | 0.56 | - - - | - - - | - - - | - - - | |||||
bcd*GFP – St9 / 1x bcdMS2 | 293 | 100.2 ± 1.5 | 0.07 | 0.78 | 155.1 ± 5.3 | - - - | 0.11 | |||||
bcd*GFP – St9 / 2x bcdMS2 | 292 | 105.3 ± 1.6 | 0.19 | - - - | 149.3 ± 5.1 | 0.50 | - - - | |||||
smFISH | bcd - St9 endogenous (yw) | 901 | 125.9 ± 1.0 | - - - | <0.0001 | *** | 204.4 ± 5.4 | - - - | 0.13 | |||
bcd – St14 (isolated) endogenous (yw) | 749 | 116.3 ± 1.2 | 0.044 | * | - - - | 687.7 ± 30.0 | <0.0001 | *** | - - - | |||
bcd – St14 (clustered) endogenous (yw) | 125 | 124.6 ± 2.6 | 0.84 | - - - | - - - | - - - | - - - | |||||
bcd – St9 endogenous + 1x bcdMS2 | 935 | 128.6 ± 1.0 | 0.28 | - - - | 264.8 ± 7.4 | <0.0001 | *** | - - - | ||||
bcd – St9 endogenous + 2x bcdMS2 | 1509 | 124.6 ± 0.8 | 0.74 | - - - | 328.5 ± 7.4 | <0.0001 | *** | - - - |
-
a) Mixed effects linear model (LMER) test for comparison of RNA particle sizes (FWHM). Fixed effect: mRNA / Genotype; Random effect: variability between oocytes. Compared to bcd*GFP - St9 or bcd - St9 endogenous (yw)
-
b) Mixed effects linear model (LMER) test to analyse the effect of the distance from the anterior on the RNA particle sizes (FWHM). Fixed effect: Distance from anterior; Random effect: variability between oocytes.
-
c) Mixed effects linear model (LMER) test for comparison of the summed fluorescence of RNA particles. Fixed effect: mRNA / Genotype; Random effect: variability between oocytes. Compared to bcd*GFP - St9 / 1x bcdMS2, or bcd - St9 endogenous (yw)
-
d) Mixed effects linear model (LMER) test for comparison of the summed fluorescence of RNA particles. Fixed effect: Distance from anterior; Random effect: variability between oocytes
-
- - - Not applicable / Not determined
-
a.u. arbitrary units
-
*p<0.05; **p<0.01; ***p<0.001
-
Table 5—source data 1
Properties of RNA particles from STED super-resolution imaging.
- https://doi.org/10.7554/eLife.17537.035
Download links
A two-part list of links to download the article, or parts of the article, in various formats.
Downloads (link to download the article as PDF)
Open citations (links to open the citations from this article in various online reference manager services)
Cite this article (links to download the citations from this article in formats compatible with various reference manager tools)
bicoid mRNA localises to the Drosophila oocyte anterior by random Dynein-mediated transport and anchoring
eLife 5:e17537.
https://doi.org/10.7554/eLife.17537


