Isoform-specific subcellular localization and function of protein kinase A identified by mosaic imaging of mouse brain
- University of California, San Diego, United States
- The Salk Institute for Biological Studies, United States
- Tel Aviv University, Israel
- University of California, San Diego School of Medicine, United States
Figures
Figure 1 with 2 supplements
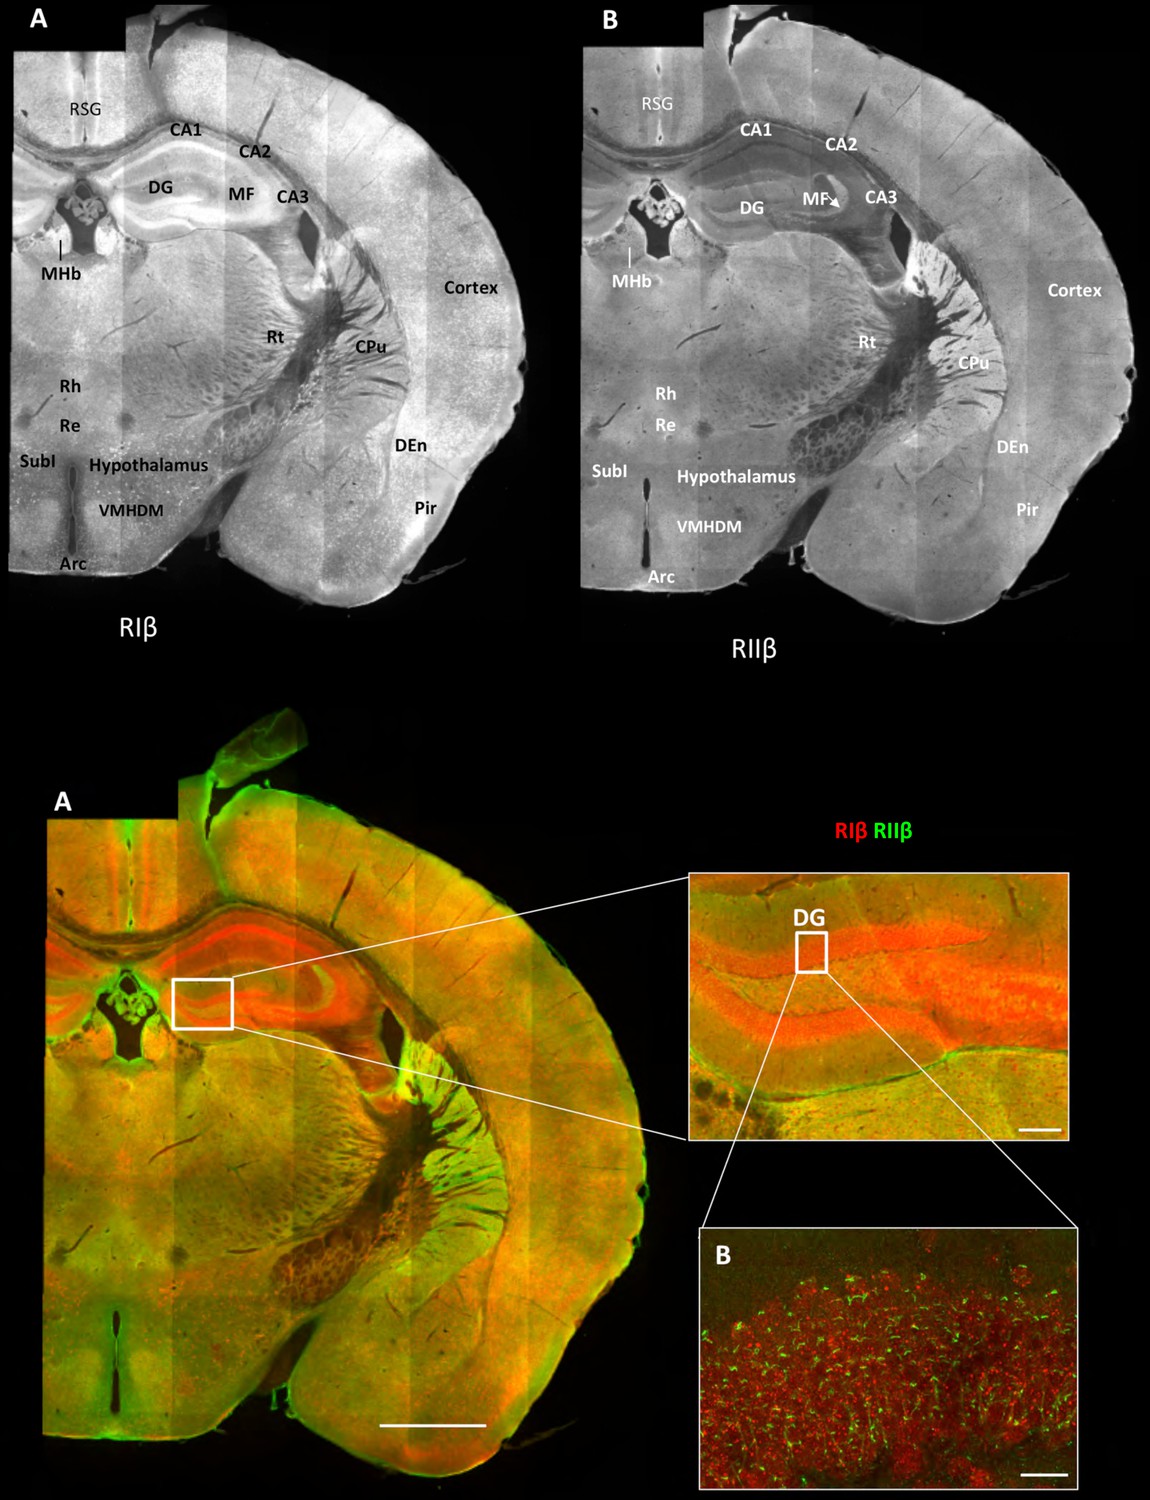
Overview of the regional distribution of RIβ and RIIβ across brain regions.
Wide-field views of a high-resolution large-scale mosaic image for a full coronal tissue slice are shown for RIβ (red in colored image) and RIIβ (green in colored image). The tissue section was labeled with anti-RIβ- and anti-RIIβ-specific antibodies. The mosaic image was made up of 105 tiles. Each tile is a maximum intensity projection of a stack of 15 Z-sections that were stitched together to reconstruct this single, high-resolution 2D image. Colored image: (C) Scale bar inside the full mosaic image: 1 mm. Scale bar inside the small box: 100 µm. (D) Intermediate resolution sample. (E Full-resolution sample of the mosaic allows examination at higher magnification. White boxes represent the areas from which the image was captured. DG, Dentate Gyrus. Scale bar: 10 µM. Abbreviations: Arc, arculate nucleus; CPu, Caudate putamen; DEn, dorsal endopiriform nucleus; MF, mossy fibers; MHb, medial habenular nuclear; Pir, piriform cortex; Re, reuniens thalamic nu; Rh, rhomboid thalamic nucleus; RSG, retrosplenial granular cortex; RSV, retrosplenial granular; Rt, reticular thalamic nucleus; SubI, subincertal nucleus.
Figure 1—figure supplement 1
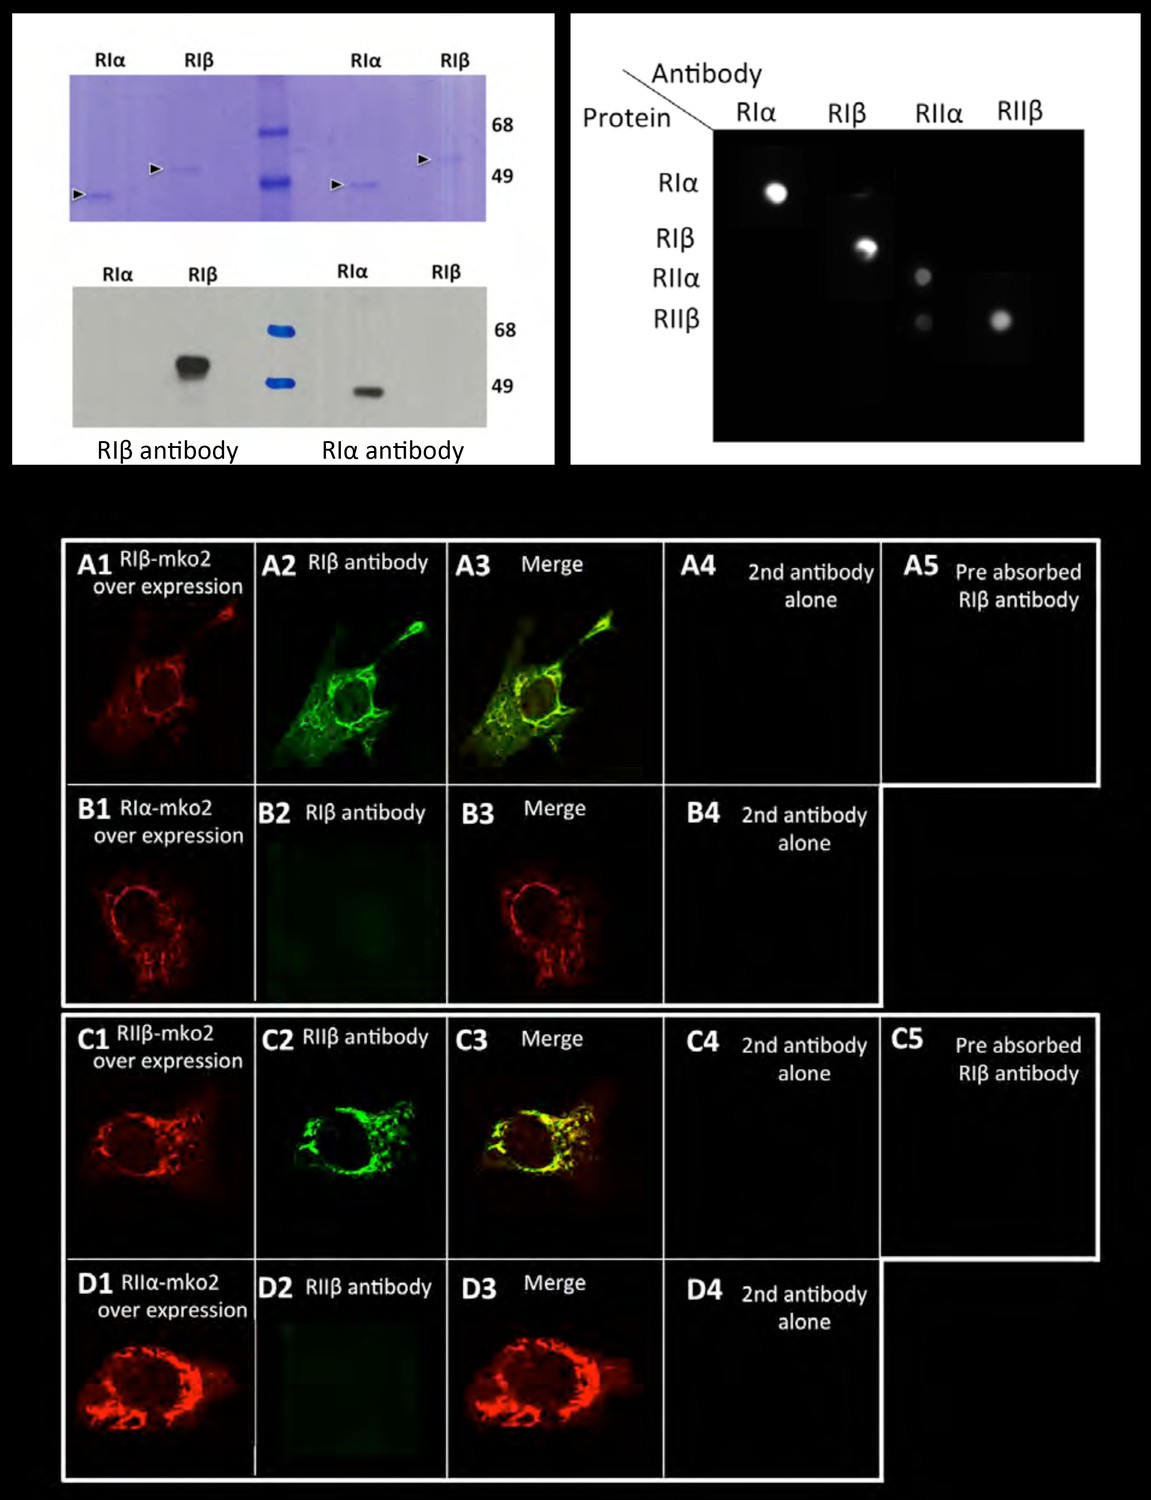
Antibody specificity.
Left panel: Commassie blue stained gel or western blot of purified RIα/RIβ proteins detected by RIα/RIβ antibodies. Right panel: Dot blot analysis. Each row of the nitrocellulose membrane was spotted with all four purified PKA regulatory subunits as indicated, followed by specific antibody detection. Lower panel: 10 T1/2 mouse cell cultures were transfected with (A) RIβ-MKO2 or (B) RIα-MKO2 and were immunostained with RIβ antibody (A2, B2). Merge images are shown (A3, B3). No unspecific staining was detected in controls for secondary antibodies alone (A4–D4). Pre-absorption of RIβ or RIIβ antibodies with purified RIβ or RIIβ proteins, respectively, resulted in blocking the antibody signal (A5, C5). A similar experiment was carried out with overexpressing RIIβ-MKO2 (C1) or RIIα-MKO2 (D1). Cells were immunostained with RIIβ antibody (C2, D2). Merge images are shown in (C3, D3). No unspecific staining was detected in controls for secondary antibodies alone (C4, D4).
Figure 1—figure supplement 2
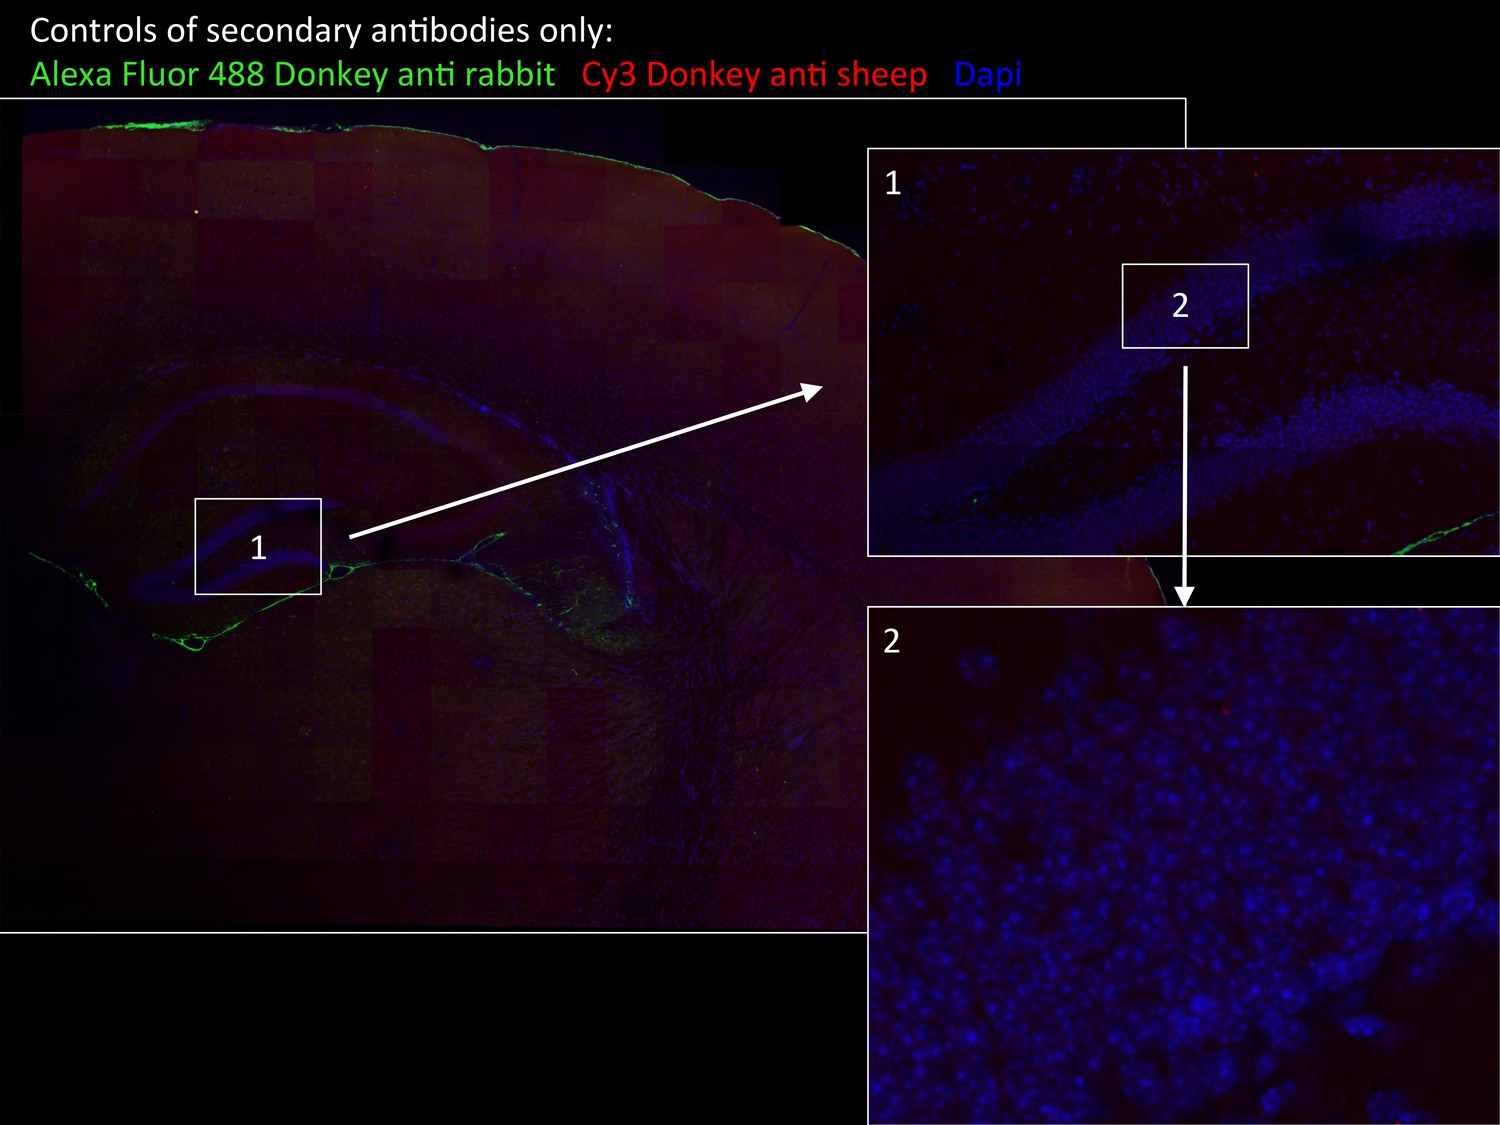
Specificity of secondary antibodies.
Wide-field views of a high-resolution large-scale mosaic image for a full coronal tissue slice are shown for secondary antibodies alone: Alexa Fluor 488 donkey anti-rabbit (green) and CY3 Donkey anti-sheep (red) including dapi staining (blue). (2) Full-resolution sample of the mosaic allows examination at antibody controls at higher magnification. No staining was detected. White boxes represent the areas from which (1) and (2) was captured. DG, dentate gyrus.
Figure 2
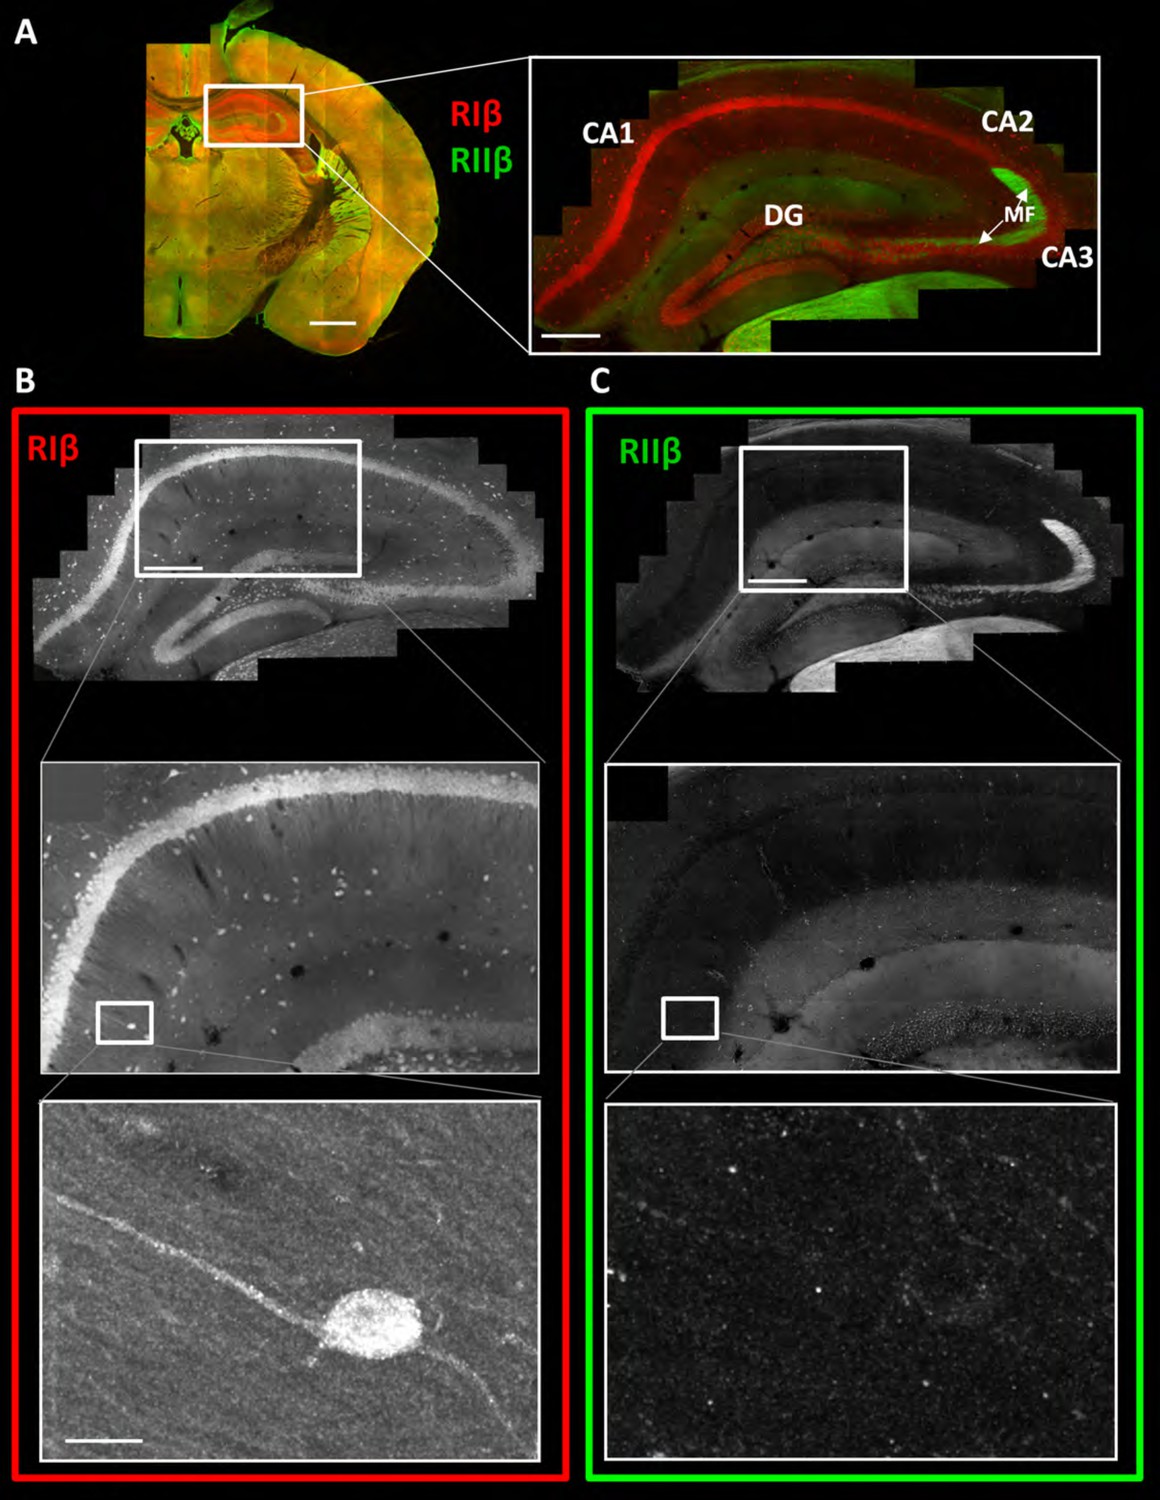
RIβ is predominantly localized to cell bodies and dendrites in different hippocampal cell types.
(A) Coronal sections were taken from a mouse brain and labeled with anti-RIβ (red) and anti-RIIβ antibodies (green). Left: mosaic image of a full brain section made up of 105 tiles. Scale bar: 1 mm. Right: mosaic image of the hippocampus region made up of 1,413 tiles from ten Z sections obtained using a 60x objective lens. Scale bar: 200 µm. (B–C) Top: Mosaic image of the hippocampus at reduced resolution with anti RIβ (B) or anti RIIβ (C). The white box represents the area from which the middle image was captured. Middle: Higher resolution sample of the mosaic showing the pyramidal cell layer in the CA1-2 subfield. Anti- RIβ (left) or anti-RIIβ (right). The white box represents the area from which the bottom image was captured. Scale bar: 200 µm. Bottom: A full resolution image of the mosaic shows a representative interneuron cell within the hippocampus region. Anti-RIβ (left) or anti-RIIβ (right). Scale bars: 10 µm.
Figure 3 with 1 supplement
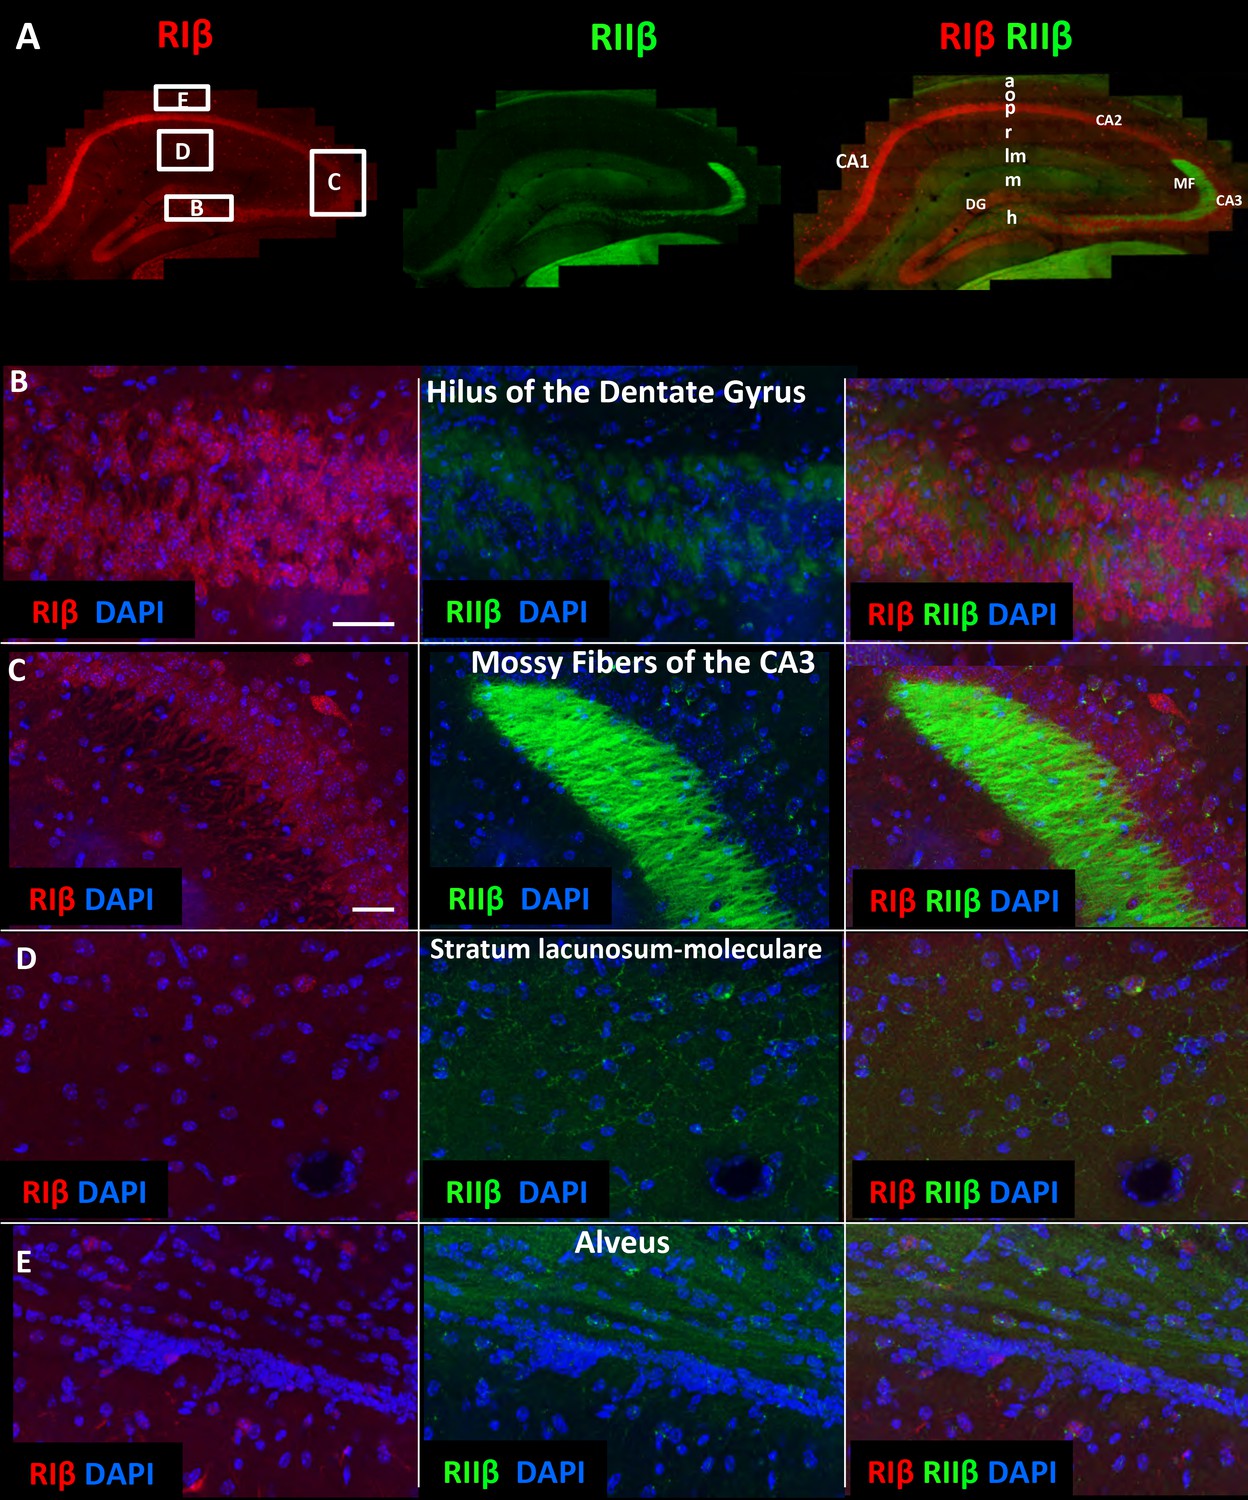
RIIβ is the predominant isoform in cell axons across various hippocampal subfields.
(A) A full representative mosaic of a coronal section through the dorsal hippocampus at reduced resolution. An overview of RIβ (red), RIIβ (green) and RIβ/RIIβ immunostaining at various subfields. The mosaic image is made up of 1,413 tiles from ten Z sections obtained using a 60x objective lens. The white box represents the area from which the (B–E) subfield full-resolution images were captured. (B) Hilus of dentate gyrus. (C) Mossy fiber of the CA3. (D) Stratum lacunosum-moleculare. (E) Alveus. Abbreviations: CA1, stratum oriens; g, granule cell layer (stratum granulosum); h, hilus proper; lm, stratum lacunosum-moleculare; m, dentate molecular layer (stratum moleculare); p, stratum pyramidale; r, stratum radiatum. Scale bar: 25 µm.
Figure 3—figure supplement 1
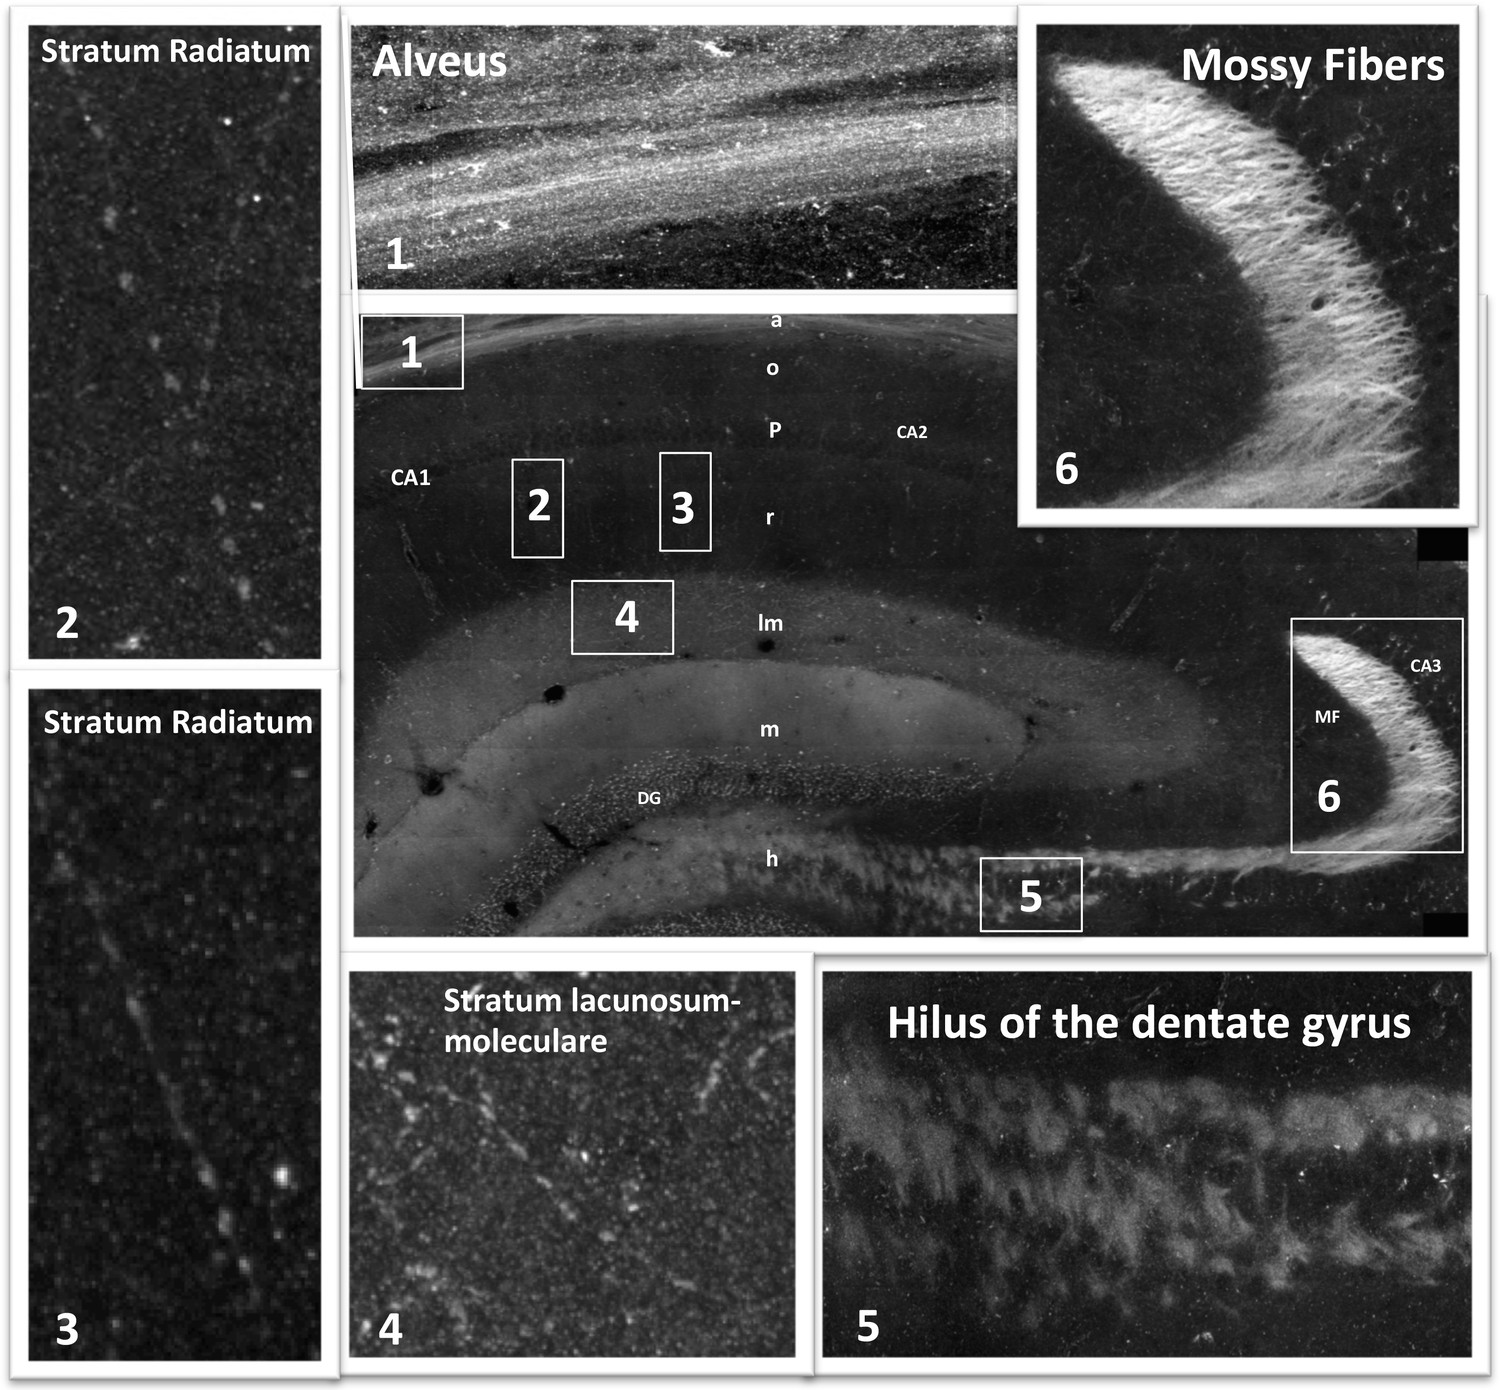
Mosaic images of the hippocampus allow tracing of RIIβ along an axonal pathway and visualization of axonal boutons in the full-resolution mosaic image.
Middle image: Immunostaining of RIIβ in a full representative mosaic of coronal section through the dorsal hippocampus. Subfields of the hippocampus are marked as in the main Figure 3. Numbers in white boxes represents the area from which the full-resolution images (1–6) were captured. Images 5 and 6 show full-resolution images of the axonal pathway that emerges from the granule cells of the dentate gyrus and passes through the hilus to the mossy fibers at the CA3. Images 2, 3 and 4 show full-resolution images of RIIβ staining the axonal terminal boutons.
Figure 4
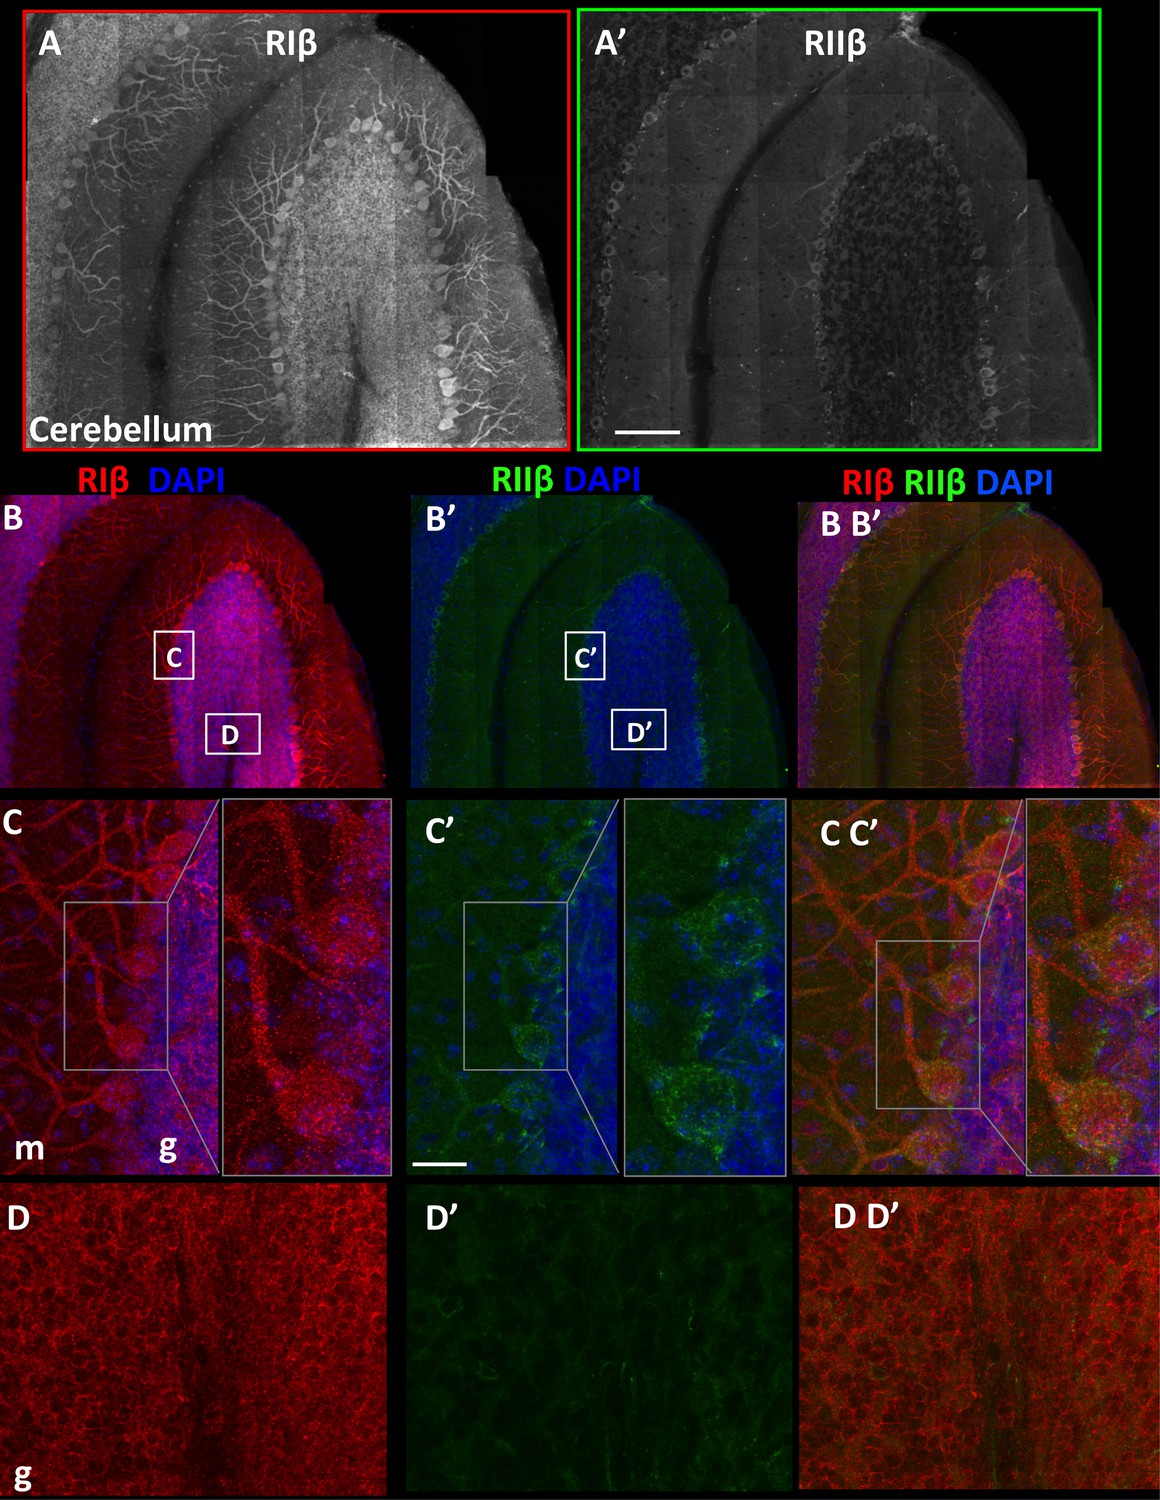
RIβ and RIIβ distinct expression at the cerebellum.
(A) An overview of a full representative sagital section of one folium of the cerebellum immunostained with anti-RIβ (A) or anti- RIIβ (A’) at reduced resolution. The mosaic image is made up of 120 tiles, from 21 Z sections obtained using a 40x objective lens. Scale bar: 100 µm (B). RIβ (red), RIIβ (green) and Dapi (blue). White boxes represent the areas from which (C–D) images were captured. (C) Cerebellar Purkinje cells at the molecular layer (m) and the granular layer (g) are indicated. Right side: full-resolution views of Purkinje cells. RIβ is localized to the somata and the dendrites of these cells. RIIβ is less abundant at their dendrites. Scale bar: 25 µm. (D) Full-resolution views taken from the granular cell layer (g) and the white matter.
Figure 5
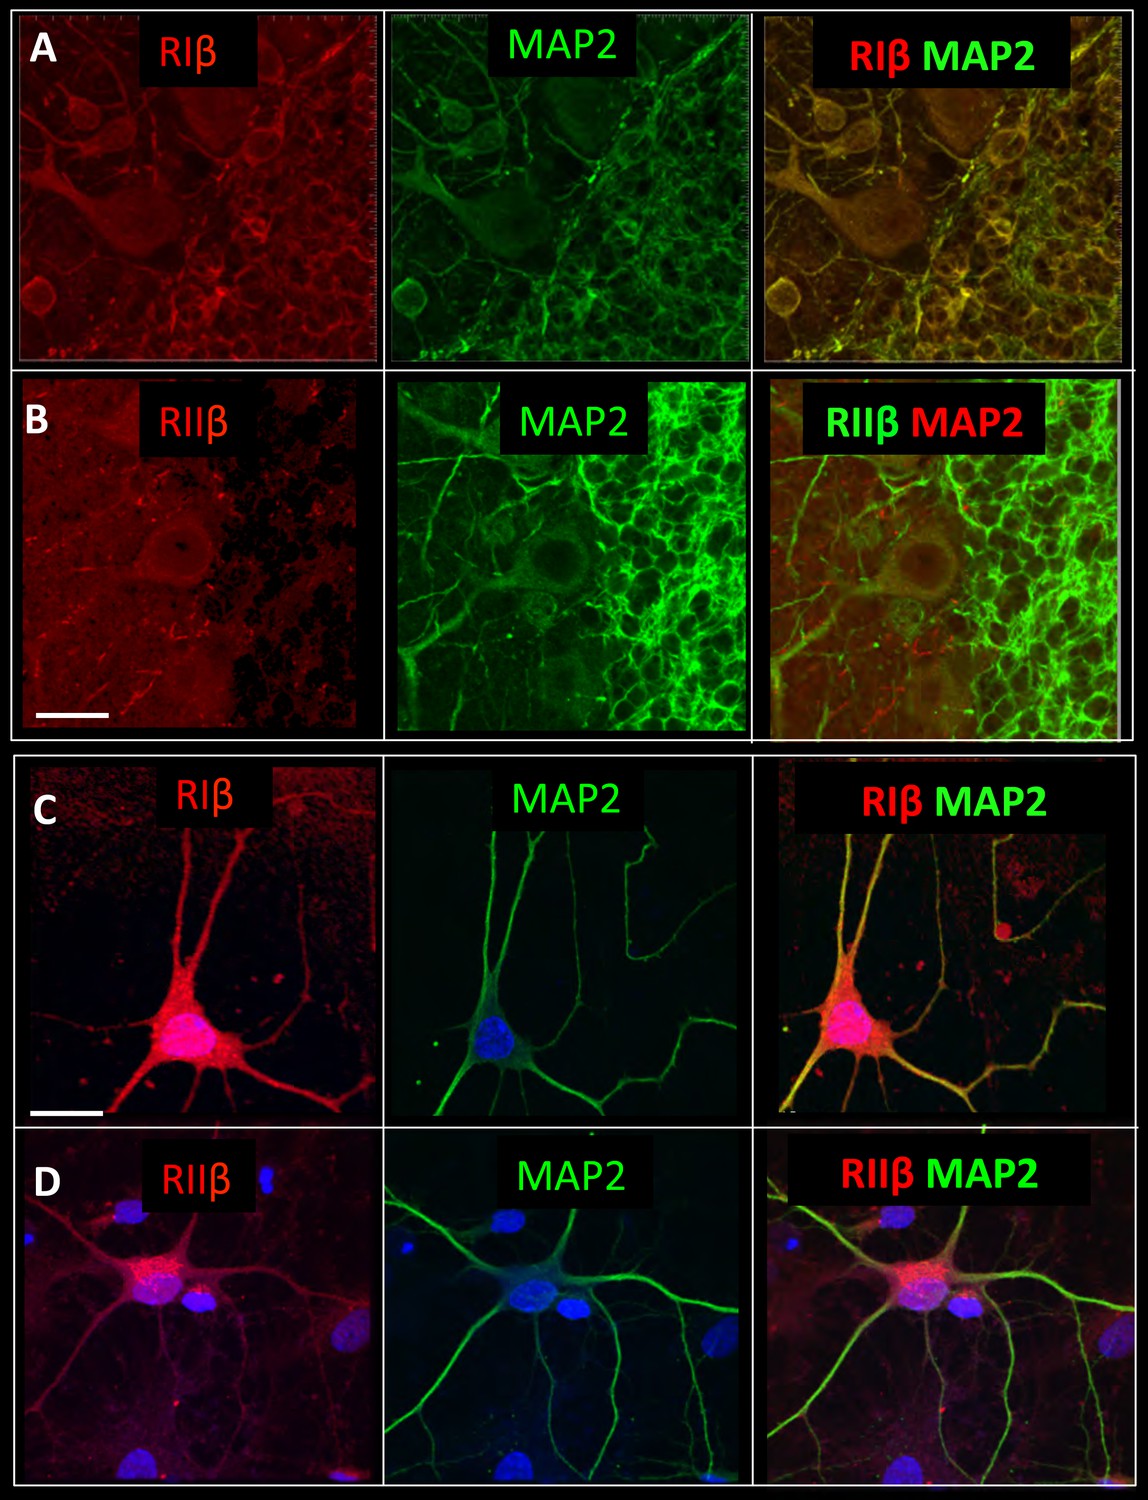
RIβ co-localizes with MAP2.
Sagital sections of the cerebellum were co-stained with microtubule-binding protein (MAP2) antibody, a dendritic marker, and (A) a RIβ antibody or (B) a RIIβ antibody. Primary cortical hippocampal cultured cells were co-stained with (C) MAP2 antibody and RIβ antibody or (D) RIIβ antibody. Dapi staining for the nucleus is shown in blue. Scale bars: 20 µm.
Figure 6 with 1 supplement
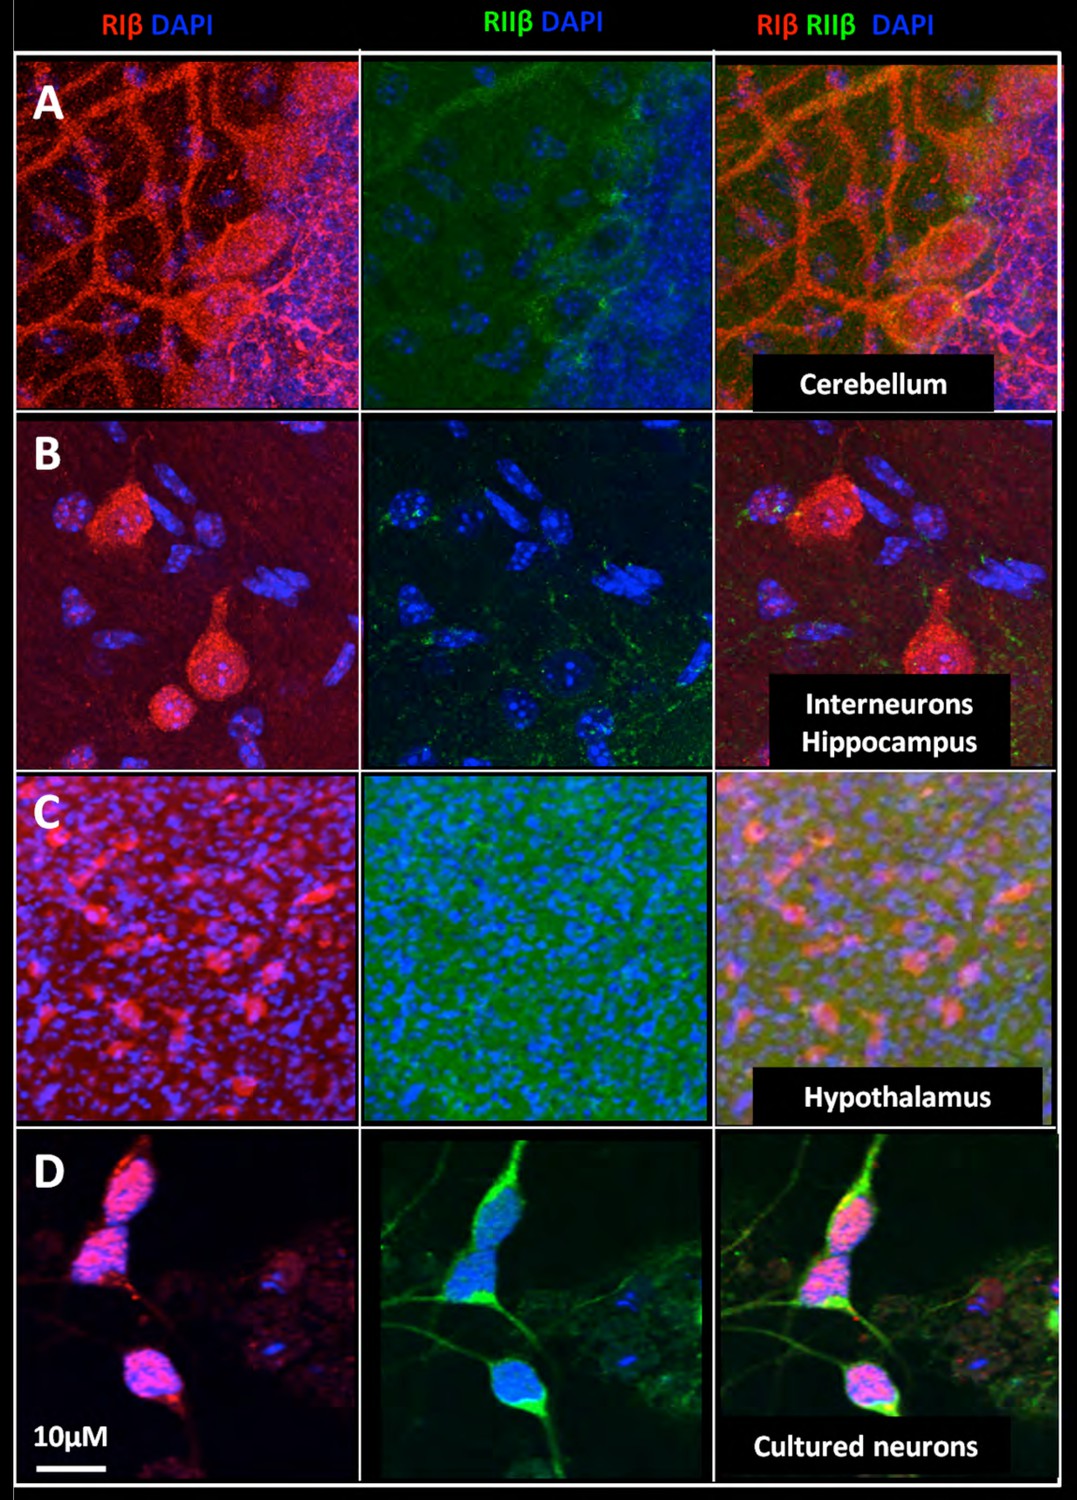
Nuclear localization of RIβ subunit across various brain regions.
Full-resolution views of different brain regions were taken from the mosaic maps or primary cell staining to show the nuclear co-localization. RIβ (red), RIIβ (green) and dapi (blue). One slice of the Z stack is shown (A. Purkinje cells of the cerebellum. (B) Interneurons in the hippocampus. (C) Cells from the thalamus. (D) Cells from the hypothalamus. (E) Primary cortical/hippocampal cells. Scale bar: 10 µm.
Figure 6—figure supplement 1
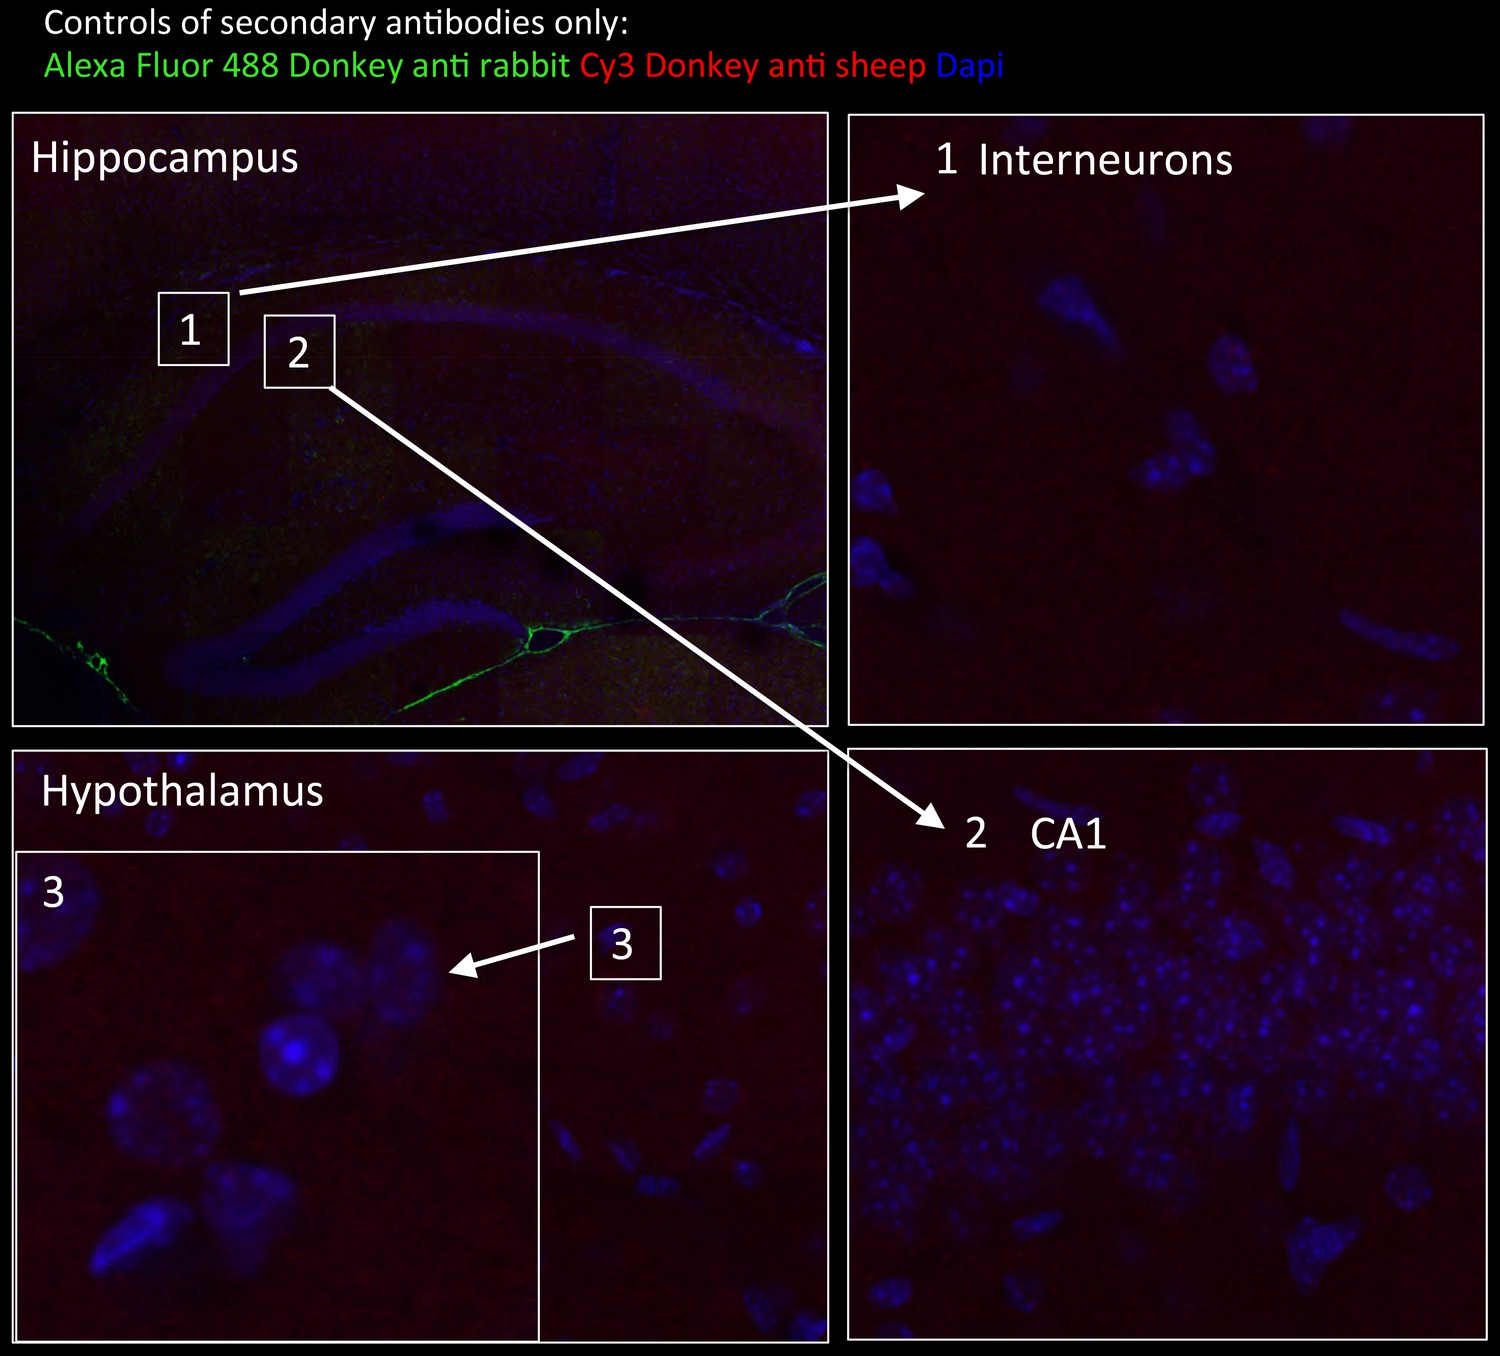
Tissue staining with secondary antibodies alone shown as negative controls for brain regions indicated in Figure 6.
Hippocampus in wide-field views stained with Alexa Fluor 488 donkey anti-rabbit (green) and CY3 Donkey anti-sheep (red) including dapi staining (blue). Numbers represent the areas from which higher magnifications were taken: (1) interneuron; (2) neurons from CA1 region; and (3) hypothalamus in wide field view and at higher magnification. No unspecific staining from secondary antibodies was detected.
Figure 7
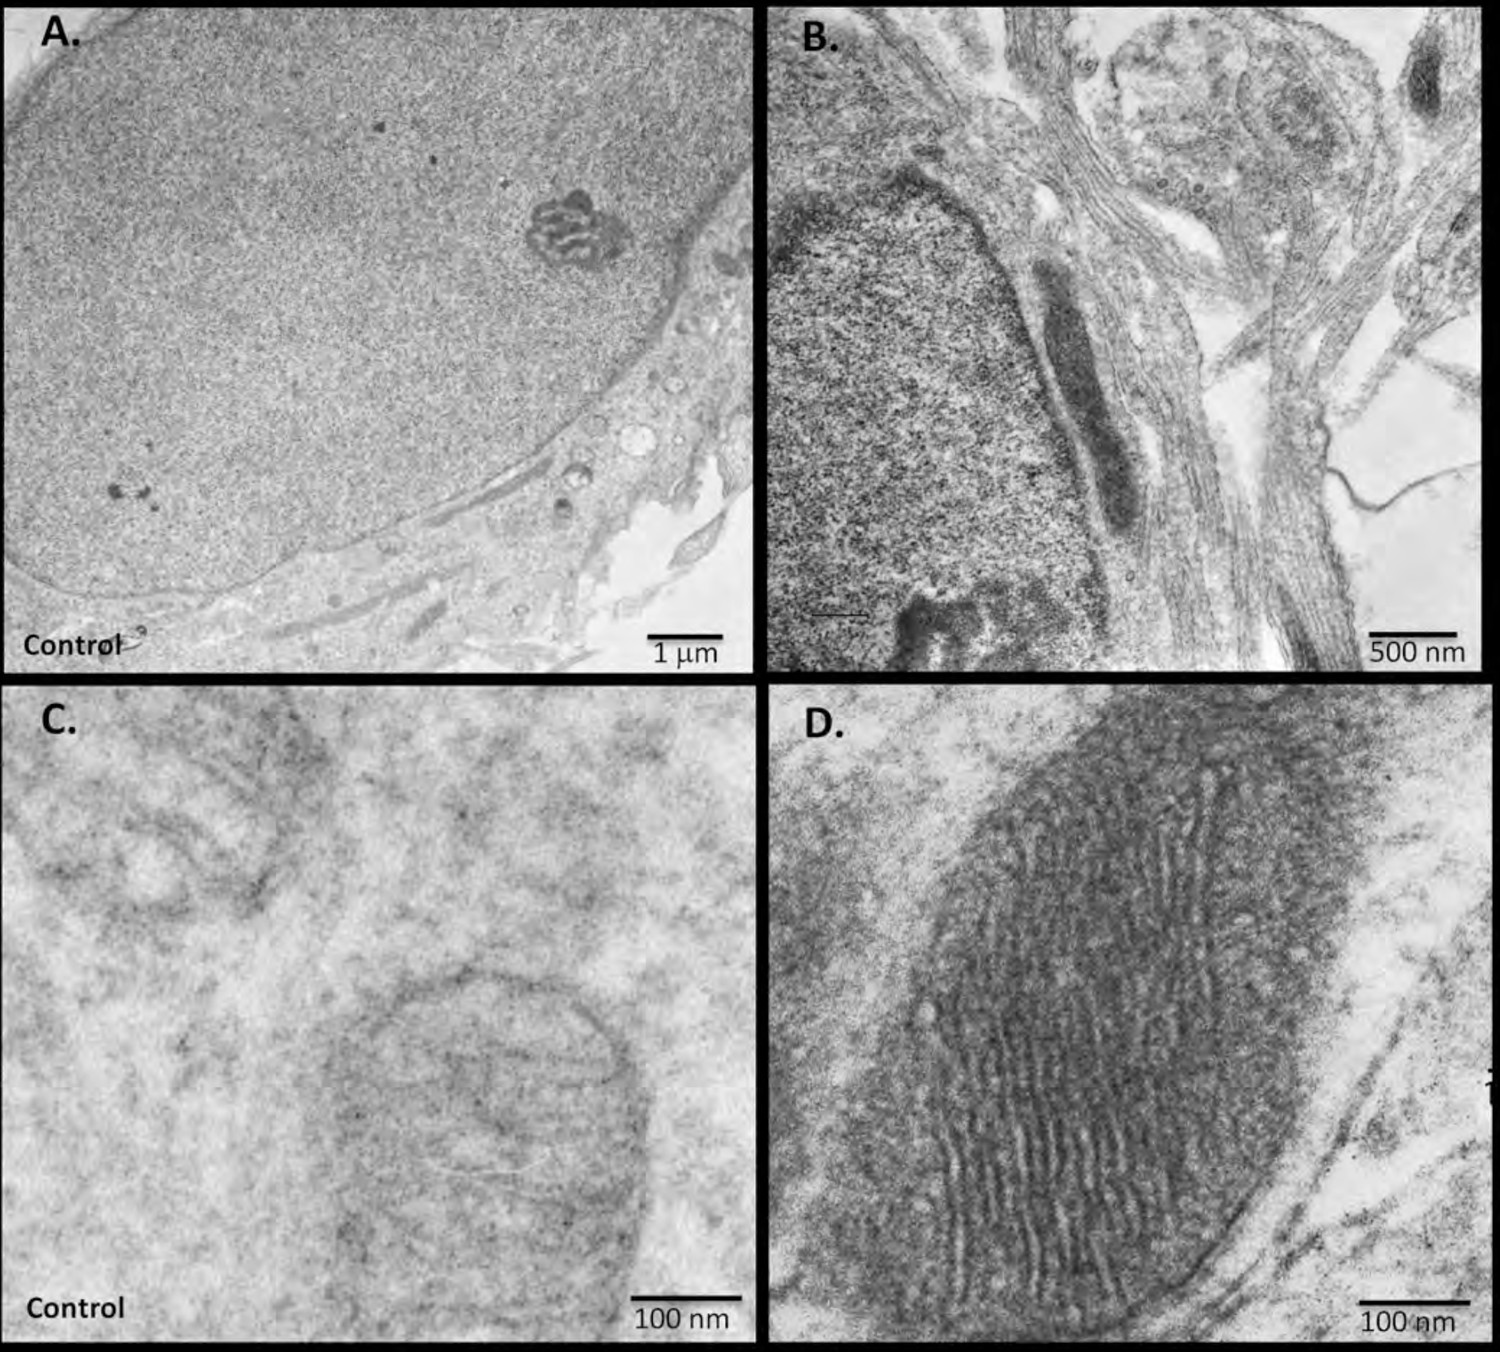
miniSOG-tagged RIβ localizes RIβ to the mitochondria and to the nucleus using electron microscopy.
Primary hippocampal or cortical cells were electrophorated with miniSOG-tagged RIβ. Mersalyl acid was used in the blocking step to reduce background nonspecific labeling of mitochondria. The differential contrast generated between (A) a non-transfected nucleus and (B) a transfected nucleus following photooxidation is evident. RIβ is localized to the nucleus and nuclear envelope. The differential contrast generated between (C) a non-transfected photo-oxidized mitochondrion and (D) a transfected photo-oxidized mitochondrion is evident. The well-preserved mitochondrion allows detection of RIβ at the mitochondrial cristae and the inner membrane. 126 transfected darkened mitochondria and 71 non-transfected light mitochondria were counted. Representative images for (C) non-transfected and (D) transfected mitochondria are shown.
Figure 8 with 1 supplement

Downregulation of RIβ in neurons reduces CREB phosphorylation.
(A) Primary hippocampal cells were treated with shRNAs against RIβ, RIIβ or an irrelevant control. CREB phosphorylation was induced by forskolin incubation. Intensity of CREB phosphorylation at Ser133 was quantified in the nucleus (delineated by DAPI) of neuronal cells (delineated by βIII tubulin) that were infected by the GFP-shRNA lentiviruses (representative cells are indicated by arrows). Either non-neuronal GFP-expressing cells or neuronal cells that did not express GFP were excluded from the analysis (examples are indicted by a circle). Representative infected neurons depicting p-CREB, DAPI, βIII-tubulin and GFP (in squares) are shown close up. (B) Relative fluorescence of pCREB was quantified for each condition using imageJ. Statistical analyses were performed using Tukey’s multiple comparisons test under one-way-ANOVA (GraphPad Prism6 software). Adjusted p-values are reported. In the RIβ knockdown, there is a significant reduction in pCREB fluorescence intensity when compared to control (****p<0.0001) or to RIIβ (***p=0.0003). There is no statistical significance between control and RIIβ (p=0.3999). Results were assessed from three independent experiments. ~50 cells were quantified for each condition.
Figure 8—figure supplement 1
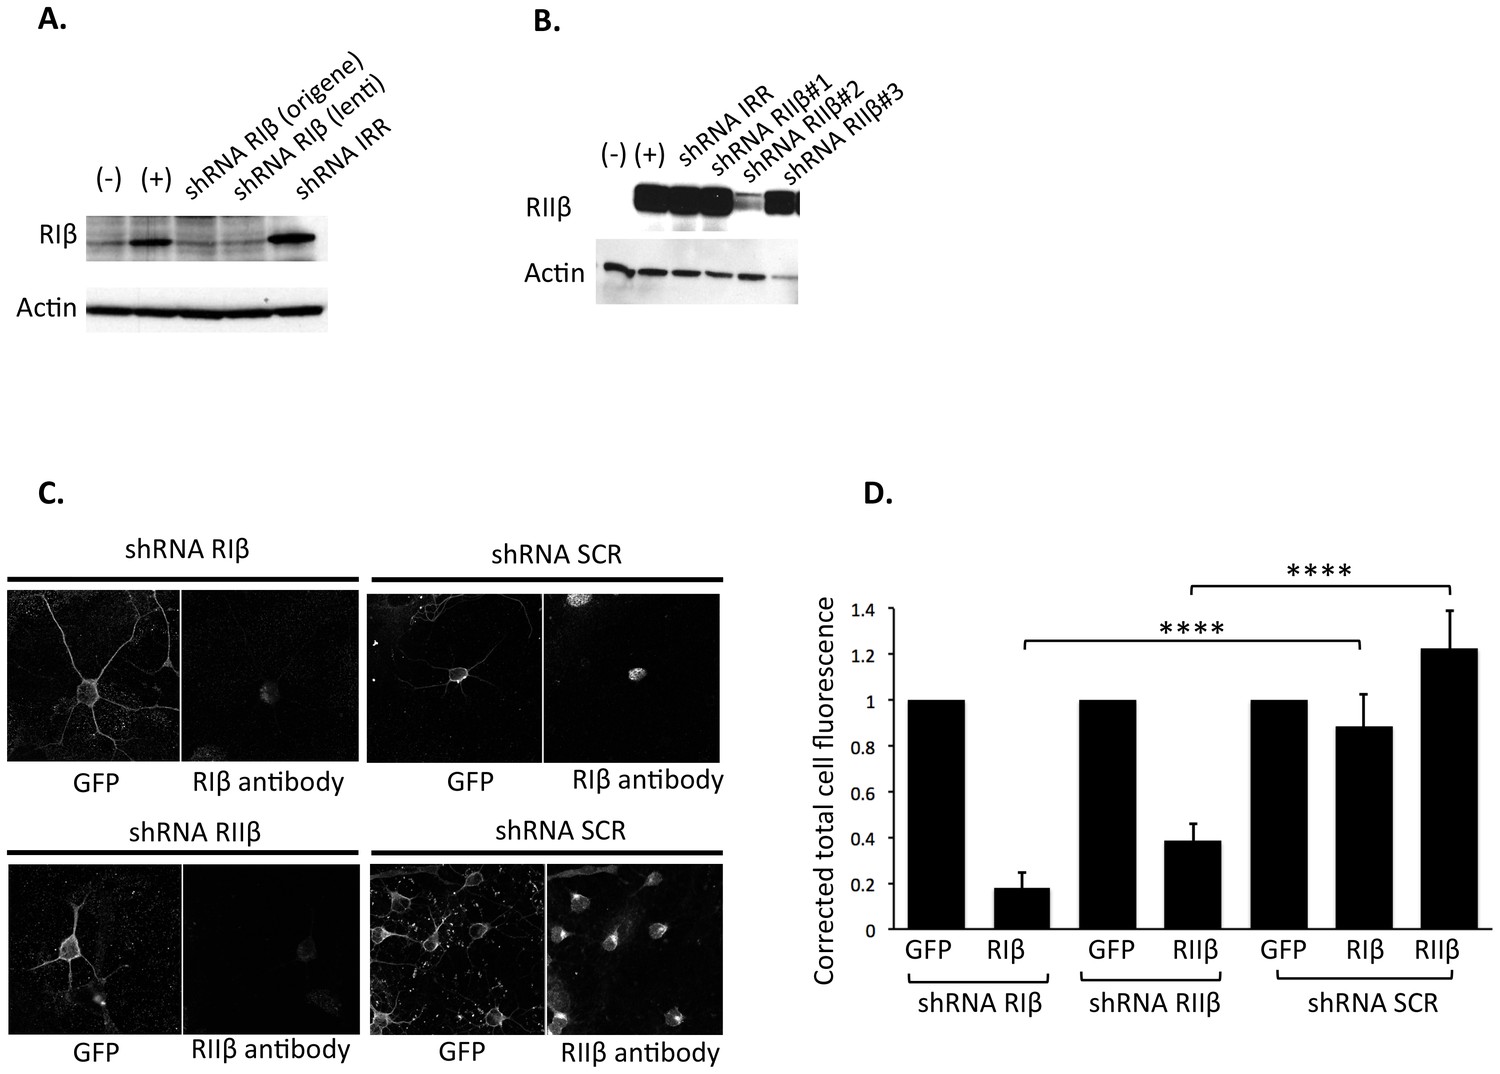
Validation of shRNA knockdown efficiency.
Western blot analysis showing silencing of (A) RIβ and (B) RIIβ. Native 293T cells (−) were transfected with either RIβ (+) or RIIβ cDNA (+). 293T cells in lane 3–5 (A) and lane 3–6 (B) were co-transfected with either RIβ cDNA (A) or RIIβ cDNA (B) together with a scrambled shRNA (shRNA IRR) or shRNA constructs targeting RIβ (A) or RIIβ (B). shRNA RIβ (Origene) and shRNA RIβ (lenti) differ in their lentiviral backbone, the latter also expressing GFP. All the shRNA RIIβ constructs were cloned into the lentiviral vector expressing GFP, and based on the results, we continued working with shRNA RIIβ clone #2. Actin was used as a loading control. (C) Immunofluorescence signal reduced by shRNAs against RIβ or RIIβ. Representative primary neuronal cells infected with either shRNA targeting RIβ/RIIβ or a scrambled negative control (shRNA SCR). GFP expression from the shRNA vector marks infected cells. Cells expressing shRNA-targeting RIβ/RIIβ display a significant reduction in fluorescence signal intensity of RIβ/RIIβ antibody as compared to cells expressing shRNA SCR. CY5 conjugated secondary antibodies were used for both RIβ and RIIβ primary antibodies (D. Corrected total cell fluorescence was measured for each condition using imageJ. Mean fluorescence of background readings in an area of the selected cell were omitted from integrated density. The level of GFP fluorescence was normalized to one for each condition. ~30 cells were quantified for each condition. p-value<0.0001, Student’s t-test.
Download links
A two-part list of links to download the article, or parts of the article, in various formats.
Downloads (link to download the article as PDF)
Open citations (links to open the citations from this article in various online reference manager services)
Cite this article (links to download the citations from this article in formats compatible with various reference manager tools)
Isoform-specific subcellular localization and function of protein kinase A identified by mosaic imaging of mouse brain
eLife 6:e17681.
https://doi.org/10.7554/eLife.17681


