A common bacterial metabolite elicits prion-based bypass of glucose repression
- Stanford University School of Medicine, United States
- Harvard Medical School, United States
Figures
Figure 1 with 3 supplements
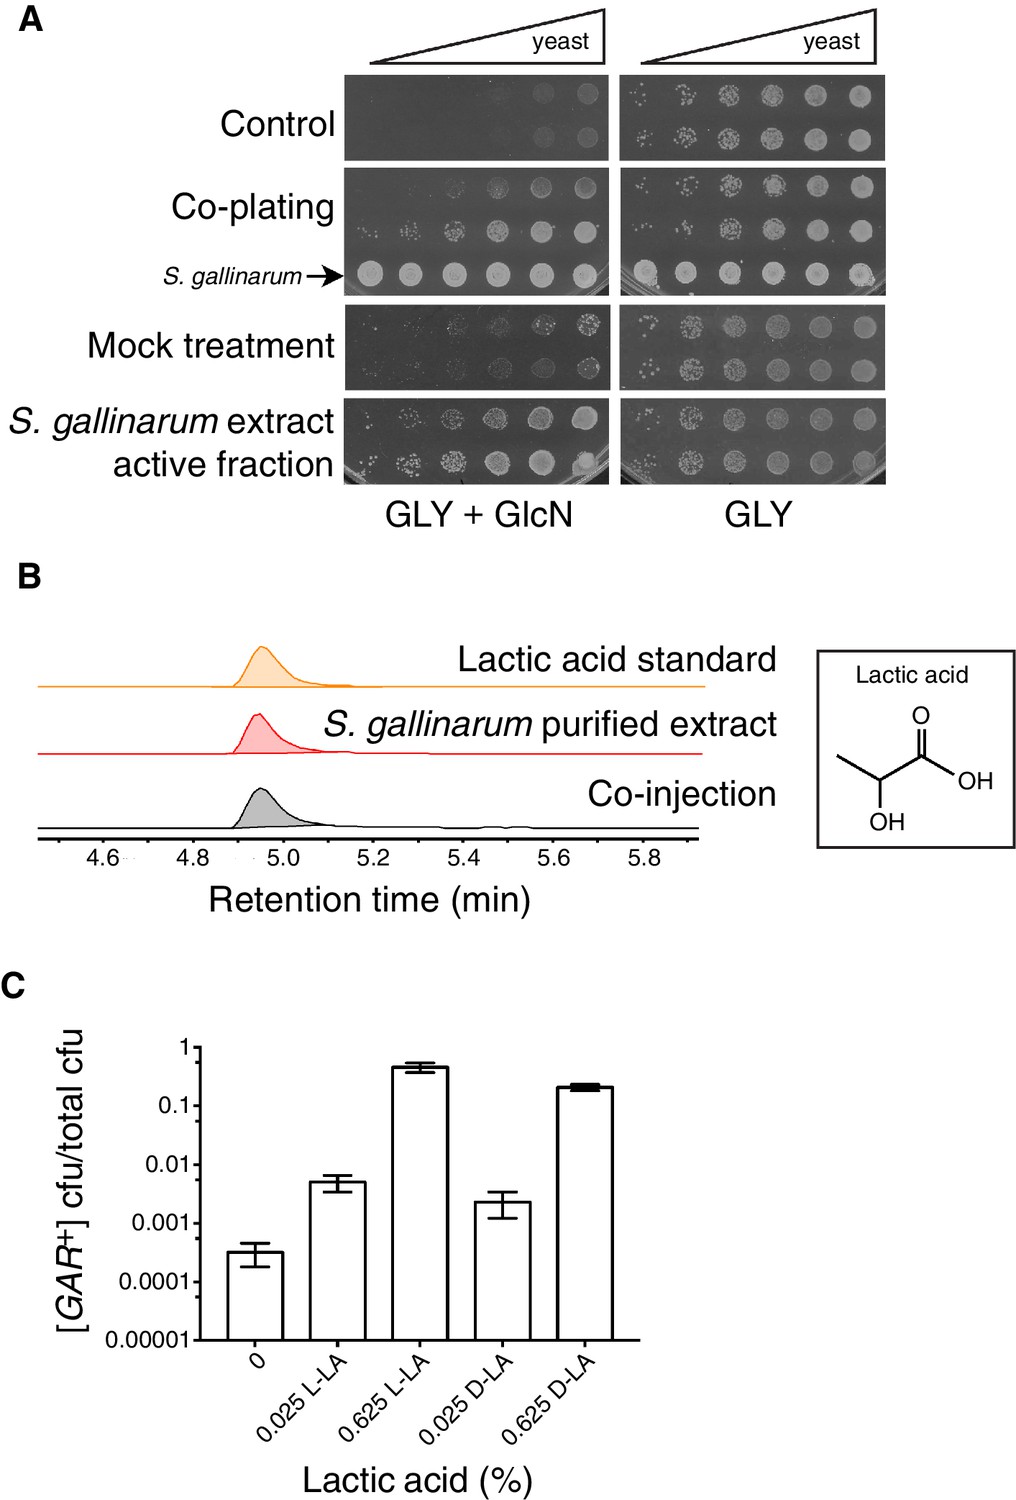
Identification of the small molecule that induces [GAR+] in a concentration dependent manner.
(A) S. gallinarum spotted next to yeast on GLY + GlcN (YP with 2% glycerol and 0.05% glucosamine) induced growth of naïve S. cerevisiae in a spatially dependent manner. An extract prepared from a S. gallinarum conditioned medium induced [GAR+] with similar strength. Each panel shows two biological replicates of yeast colonies spotted in five-fold serial dilutions from saturated cultures. (Bacterial spots are undiluted.) (B) Multiple-reaction monitoring-mass spectrometry (m/z 89.0200, 43.1000) traces of pure lactic acid (top), the purified active fraction from S. gallinarum conditioned medium (middle) and a co-injection of active fraction spiked with pure lactic acid (bottom). Results indicate that lactic acid is present in the active fraction (see Materials and methods). Note that y-axis scale differs between the top two traces due to the difference of lactic acid concentration in the pure standard, but they are normalized here for ease of viewing. (C) Plating assay (see Materials and methods) showing that both L- and D- isomers of lactic acid strongly induce [GAR+] in a concentration dependent manner. Plotted are the fraction of total colony forming units (CFUs) that grew on GLY + GlcN (mean with standard deviation from three biological replicates). Ten-fold dilutions were used for plates lacking lactic acid; 1000-fold and 10,000-fold dilutions were used for plates containing 0.025% LA and 0.625% LA, respectively.
Figure 1—figure supplement 1
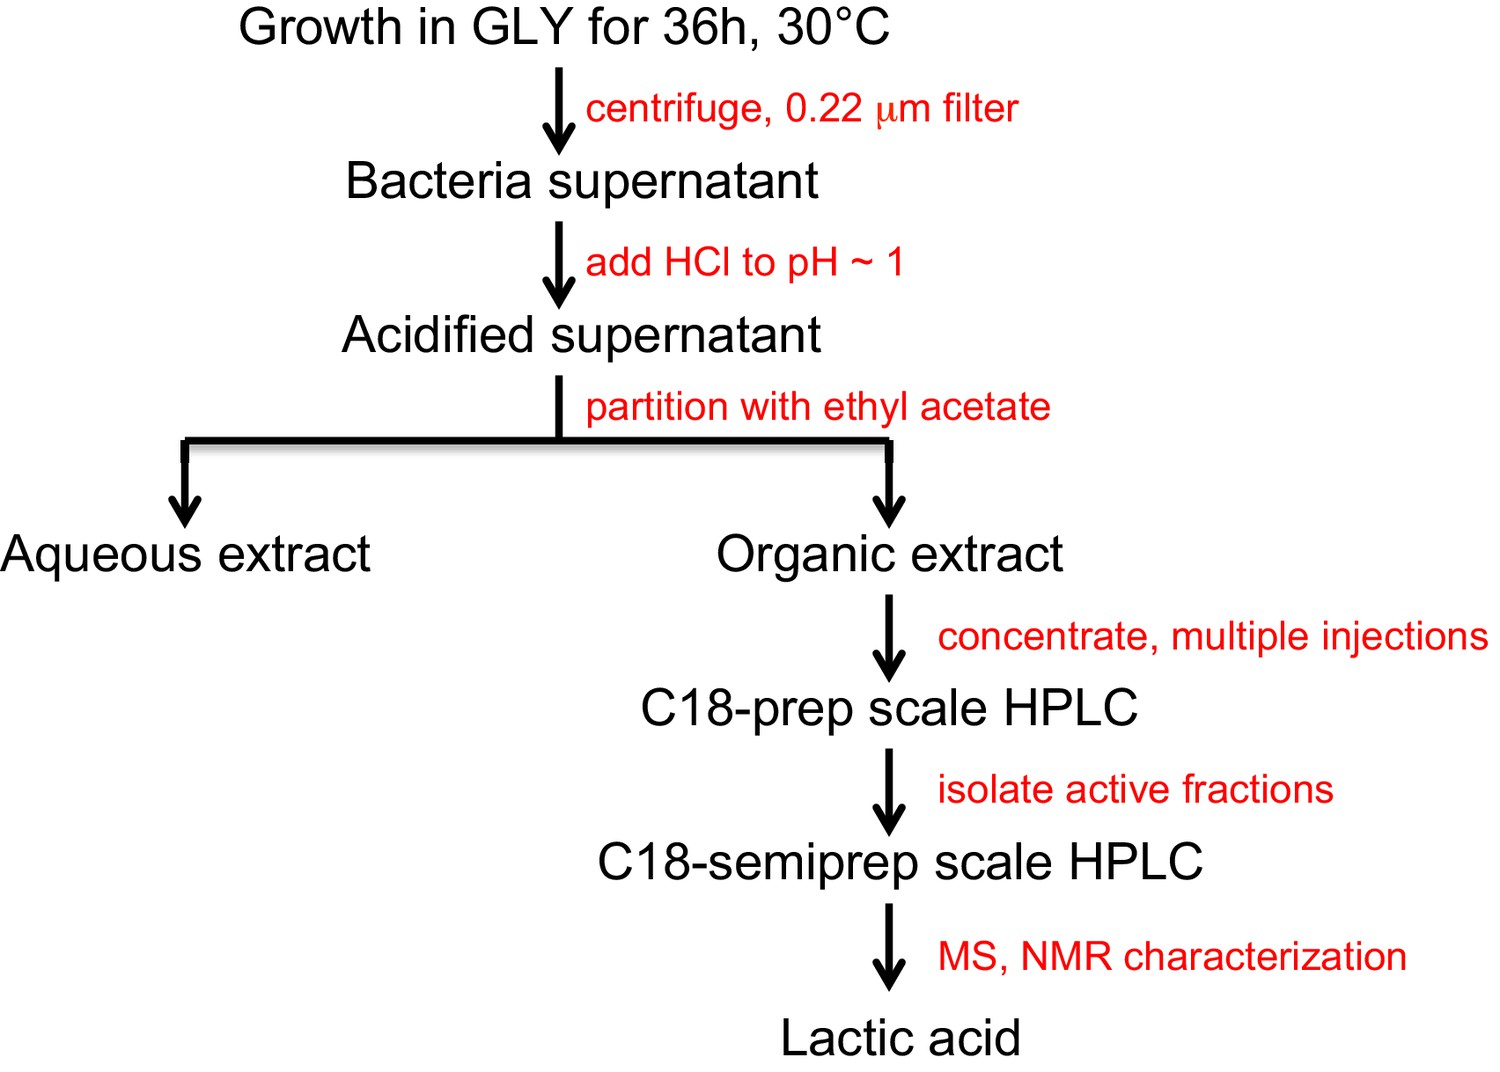
Flow chart depicting the activity guided fractionation strategy used to identify the small molecule that induces [GAR+].
https://doi.org/10.7554/eLife.17978.004
Figure 1—figure supplement 2
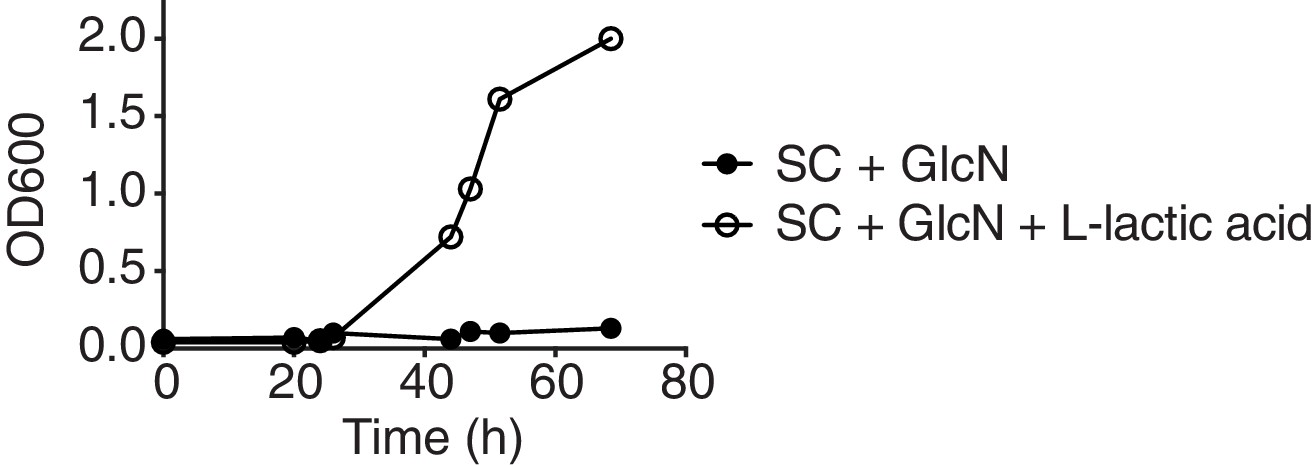
Growth curves—of cells that start as [gar−] at the outset of the experiment—in synthetic complete media (Sigma-Aldrich) containing glucosamine, with or without 0.1% L-lactic acid added.
https://doi.org/10.7554/eLife.17978.005
Figure 1—figure supplement 3
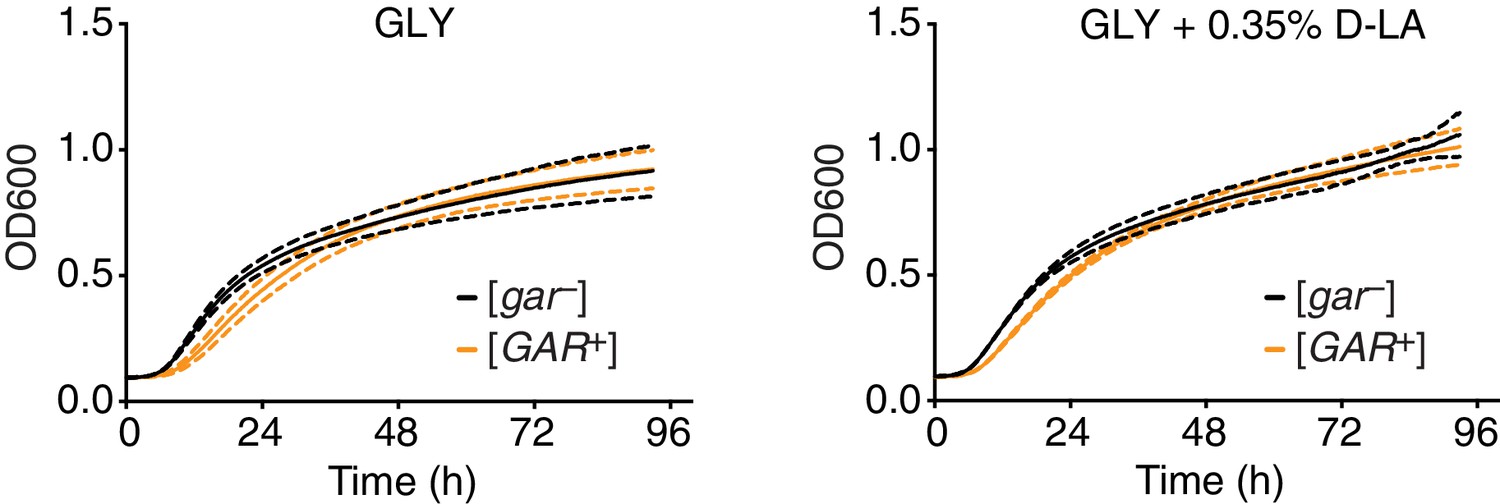
Growth rates of [GAR+] and [gar−] cells do not differ in the presence of lactic acid.
Four biological replicates of [GAR+] or [gar−] cells were grown in GLY or GLY + 0.35% D-lactic acid liquid media, with OD600 measurements taken every six minutes over four days using an automated Eon microplate reader (BioTek Instruments, Winooski, VT). [GAR+] cells neither grew faster than [gar−] cells in glycerol alone nor when lactic acid was added. (Note that [GAR+] cells did have a slightly longer lag time, i.e. slightly more time passed before they entered exponential phase, even though their growth rate during exponential phase was equivalent to that of [gar−] cells.) Solid lines mark mean values, dashed lines standard deviation.
Figure 2 with 2 supplements

Lactic acid induced [GAR+] has the same prion-like features as spontaneous [GAR+].
(A) Dominance in crosses between [GAR+] strains and [gar−] strains is seen in colonies isolated from a GLY + GlcN plate (spontaneous [GAR+]), as well as those induced with 0.1% D-lactic acid (LA-induced [GAR+]). Five-fold serial dilutions are shown for three biological replicates; orange coloring indicates strains exhibiting the [GAR+] phenotype. (B) Lactic acid-induced cells can be cured of the [GAR+] phenotype with transient expression of a dominant negative Hsp70 variant (Ssa1-K69M or Hsp70DN). Single colonies were propagated alone or with a plasmid expressing Hsp70DN for ~125 generations, bottlenecked each ~25 generations. After verifying plasmid loss, colonies were again tested for their capacity to grow on GLY + GlcN medium. Each image shows five-fold serial dilutions for three biological replicates. (C) A strain with diminished expression of PMA1, pma1-DAmP, has reduced spontaneous [GAR+] acquisition and is not induced by lactic acid. Lactic acid-induction frequencies differ from those in Figure 1C due to strain background BY4741, which has a lower frequency of [GAR+] acquisition (Brown and Lindquist, 2009). Plotted as in Figure 1C.
Figure 2—figure supplement 1
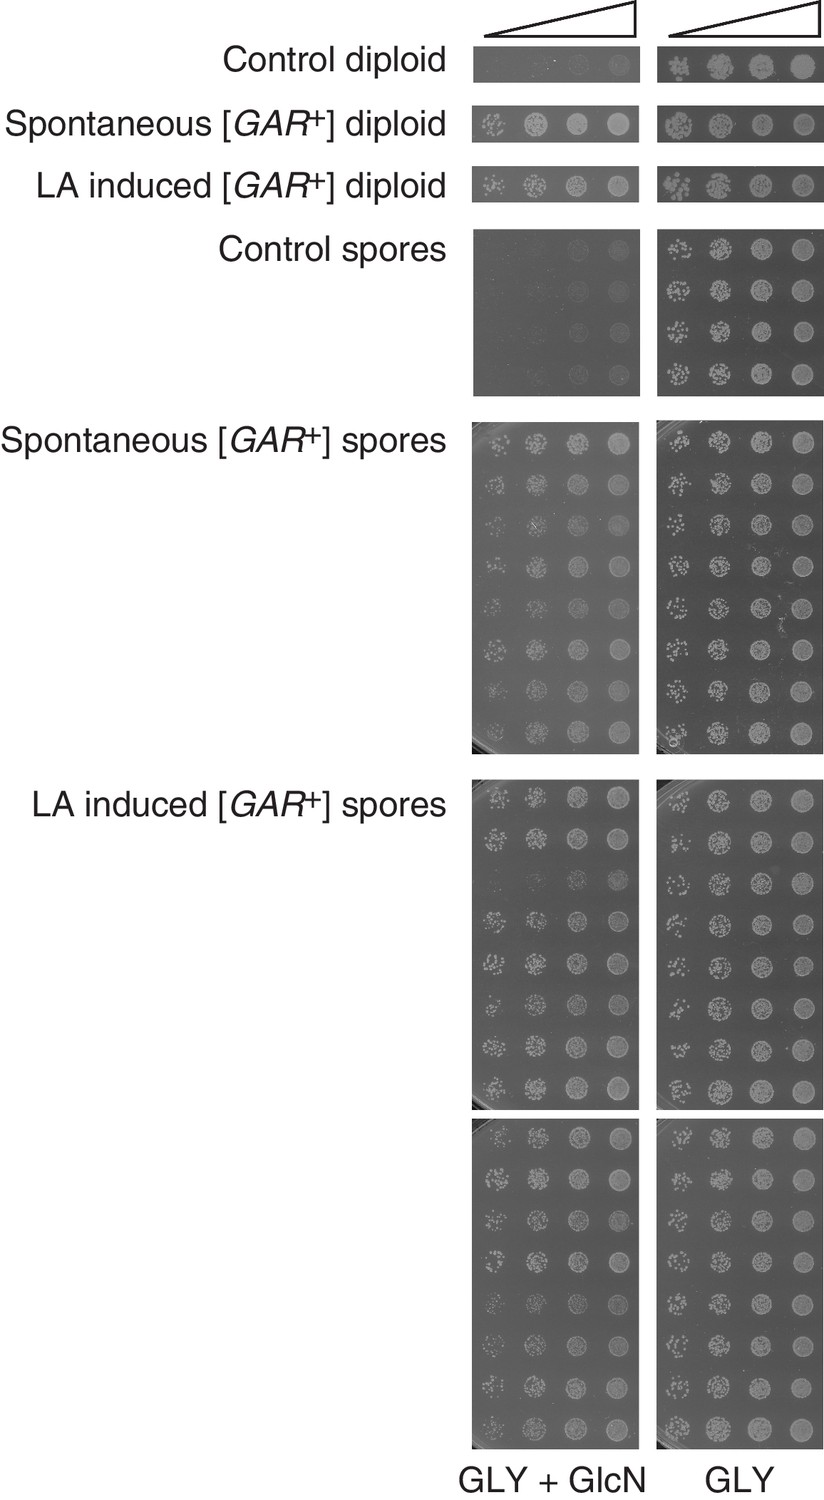
Both spontaneous and lactic acid-induced [GAR+] diploids transmit the phenotype through meiosis to nearly all spores, demonstrating non-Mendelian inheritance.
Representative spores from control (4), spontaneous [GAR+] (8), and lactic acid-induced [GAR+] diploids (16) are shown. Five-fold serial dilutions are shown for each spore.
Figure 2—figure supplement 2
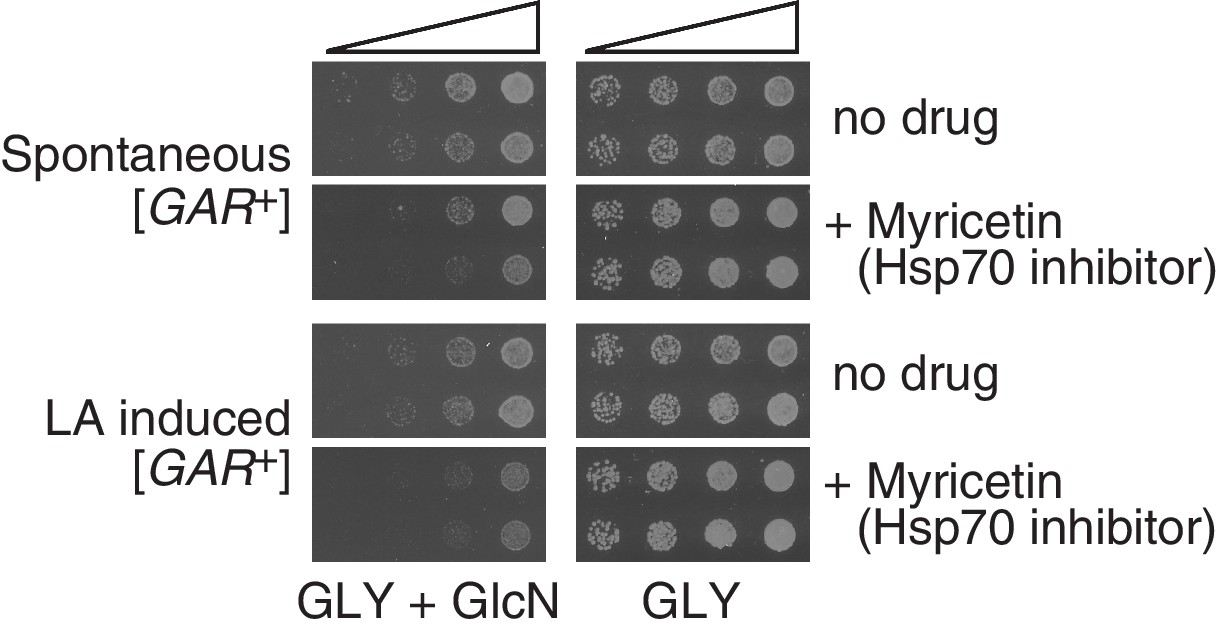
Both spontaneous [GAR+] cells and lactic acid-induced [GAR+] S. cerevisiae cells exhibited sensitivity to the Hsp70 inhibitor myricetin (50 μM) on GLY + GlcN medium.
Each image shows five-fold serial dilutions for two representative biological replicates.
Figure 3
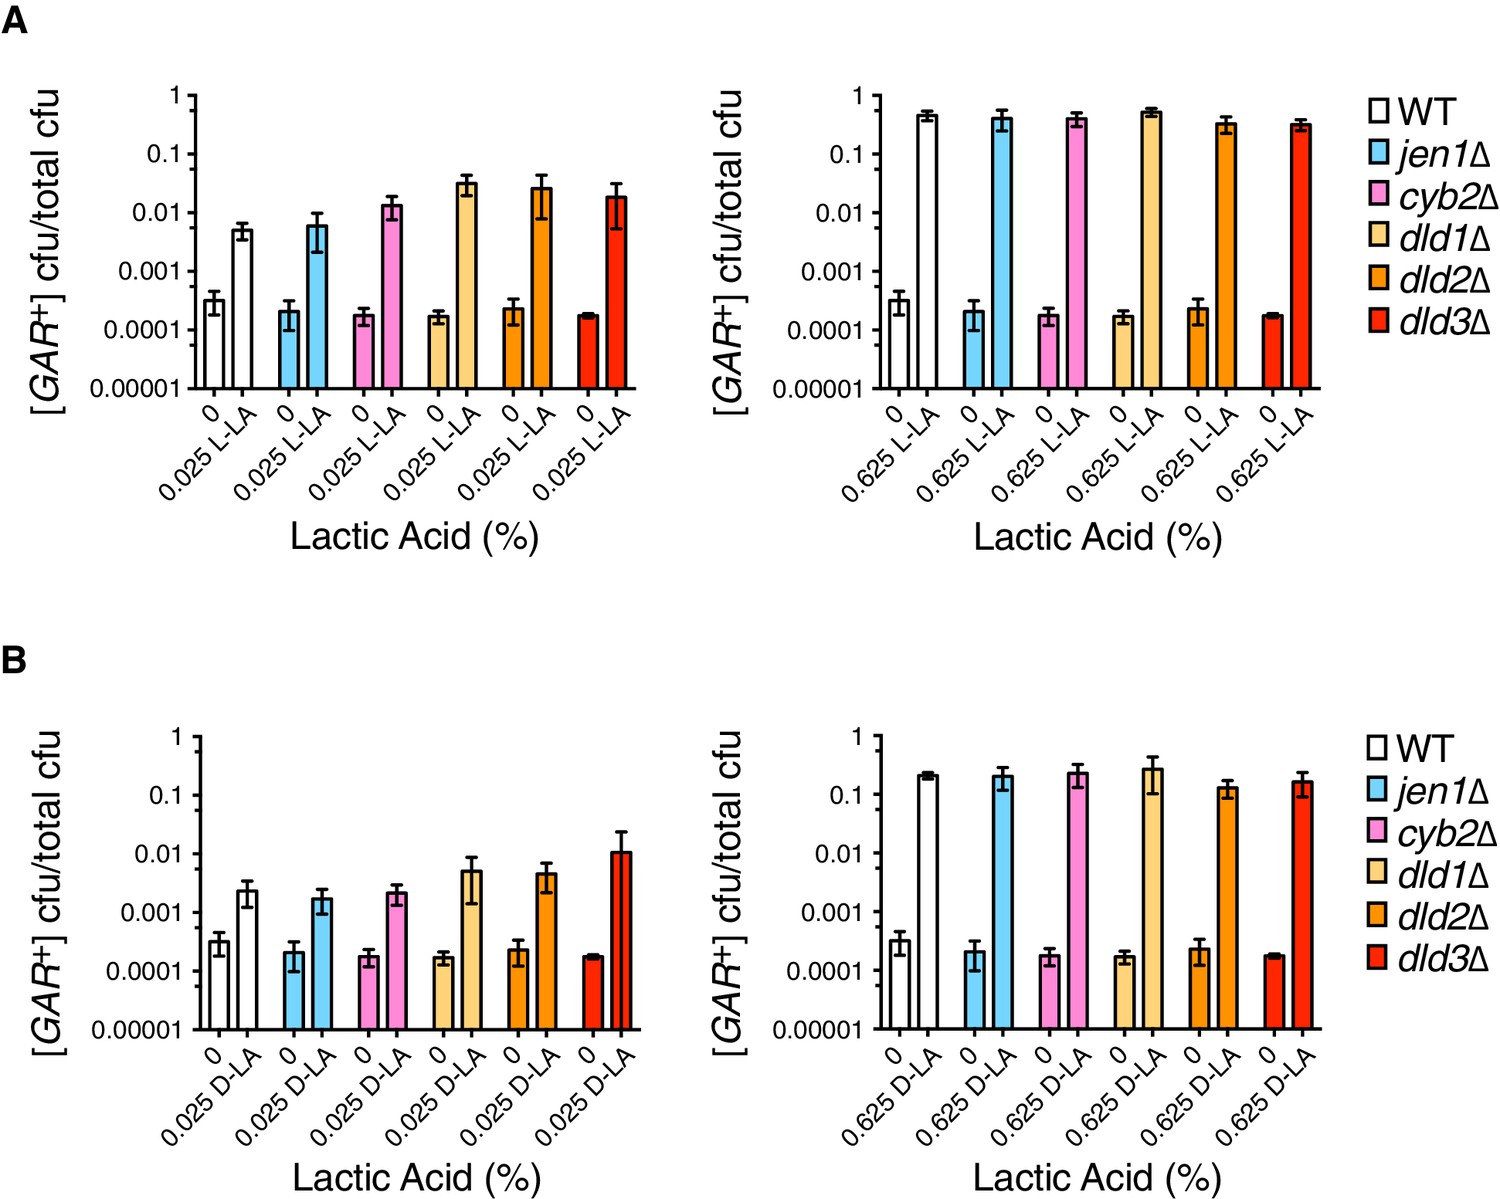
Analysis of induction frequencies in deletion mutants of genes with roles in lactic acid metabolism.
(A) Plating assay (see Materials and methods) measuring induction of [GAR+] at a low (left) or high concentration (right) of L-lactic acid. Strains are in the W303 background, and cell dilutions match those in Figure 1C. We note that annotations of DLD2 and DLD3 as D-lactate dehydrogenases have recently been challenged by data suggesting they are instead transhydrogenases (Becker-Kettern et al., 2016). Only DLD1 is required for yeast to grow on D-lactic acid as a sole carbon source. Plotted the same as in Figure 1C. B.) Plating assay measuring induction of [GAR+] by D-lactic acid. Otherwise as in (A).
Figure 4
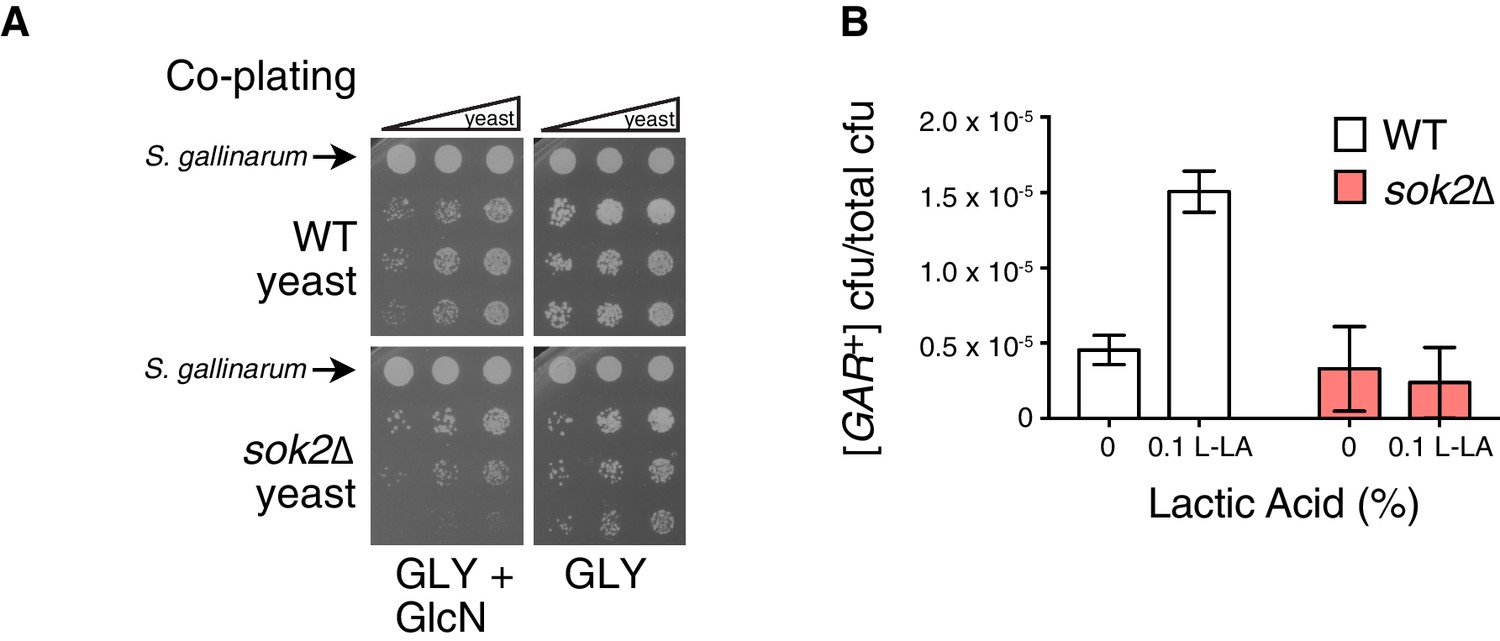
Full induction by S. gallinarum or lactic acid requires the yeast transcription factor SOK2.
(A) S. gallinarum spotted next to either wild type or sok2∆ yeast cells on GLY + GlcN, or control medium GLY. (B) Plating assay (see Materials and methods) comparing spontaneous and lactic acid-induced [GAR+] frequency in wild type and sok2∆ cells. Lactic acid-induction frequencies differ from those in Figure 1C due to strain background BY4741, which has a lower frequency of [GAR+] acquisition (Brown and Lindquist, 2009). Plotted the same as in Figure 1C.
Figure 5
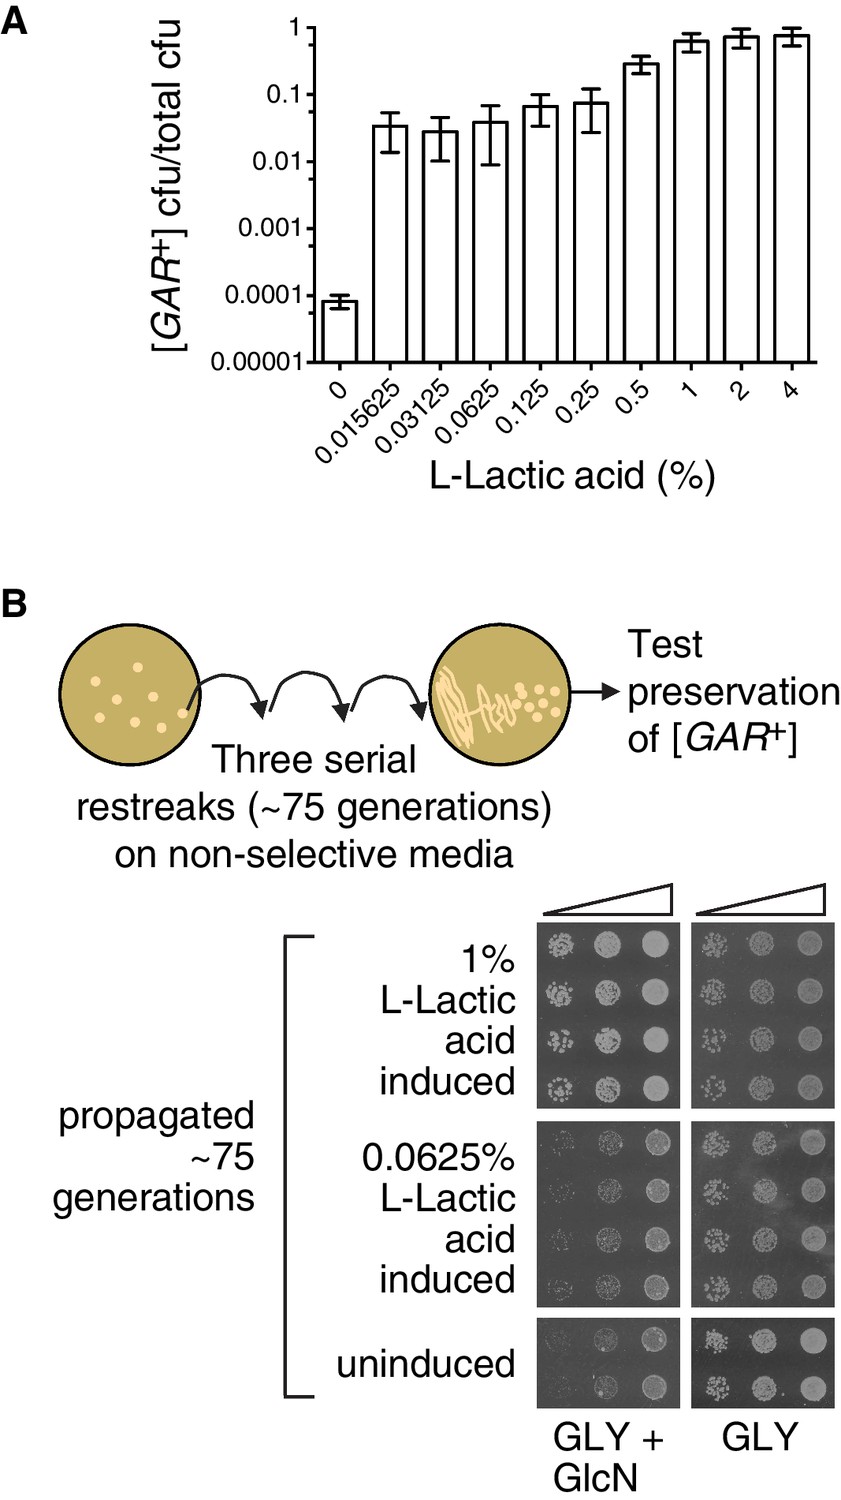
The strength of the [GAR+] phenotype depends on the concentration of lactic acid used for induction.
(A) Plating assay (see Materials and methods) showing that L-lactic acid strongly induced [GAR+] over a wide concentration range. Plotted the same as in Figure 1C. Ten-fold dilutions were used for plates lacking lactic acid and 10,000-fold dilutions were used for plates containing lactic acid (B) Single [GAR+] colonies were picked from two representative concentrations in (A), propagated (restreaked) on non-selective medium (GLY) for approximately 75 generations, and then re-spotted on GLY + GlcN in five-fold serial dilutions. Four biological replicates are shown for each induced group, and two for uninduced cells. Note the growth in the third spots (highest dilution) of 0.0625% L-LA induced cells on GLY + GlcN.
Figure 6
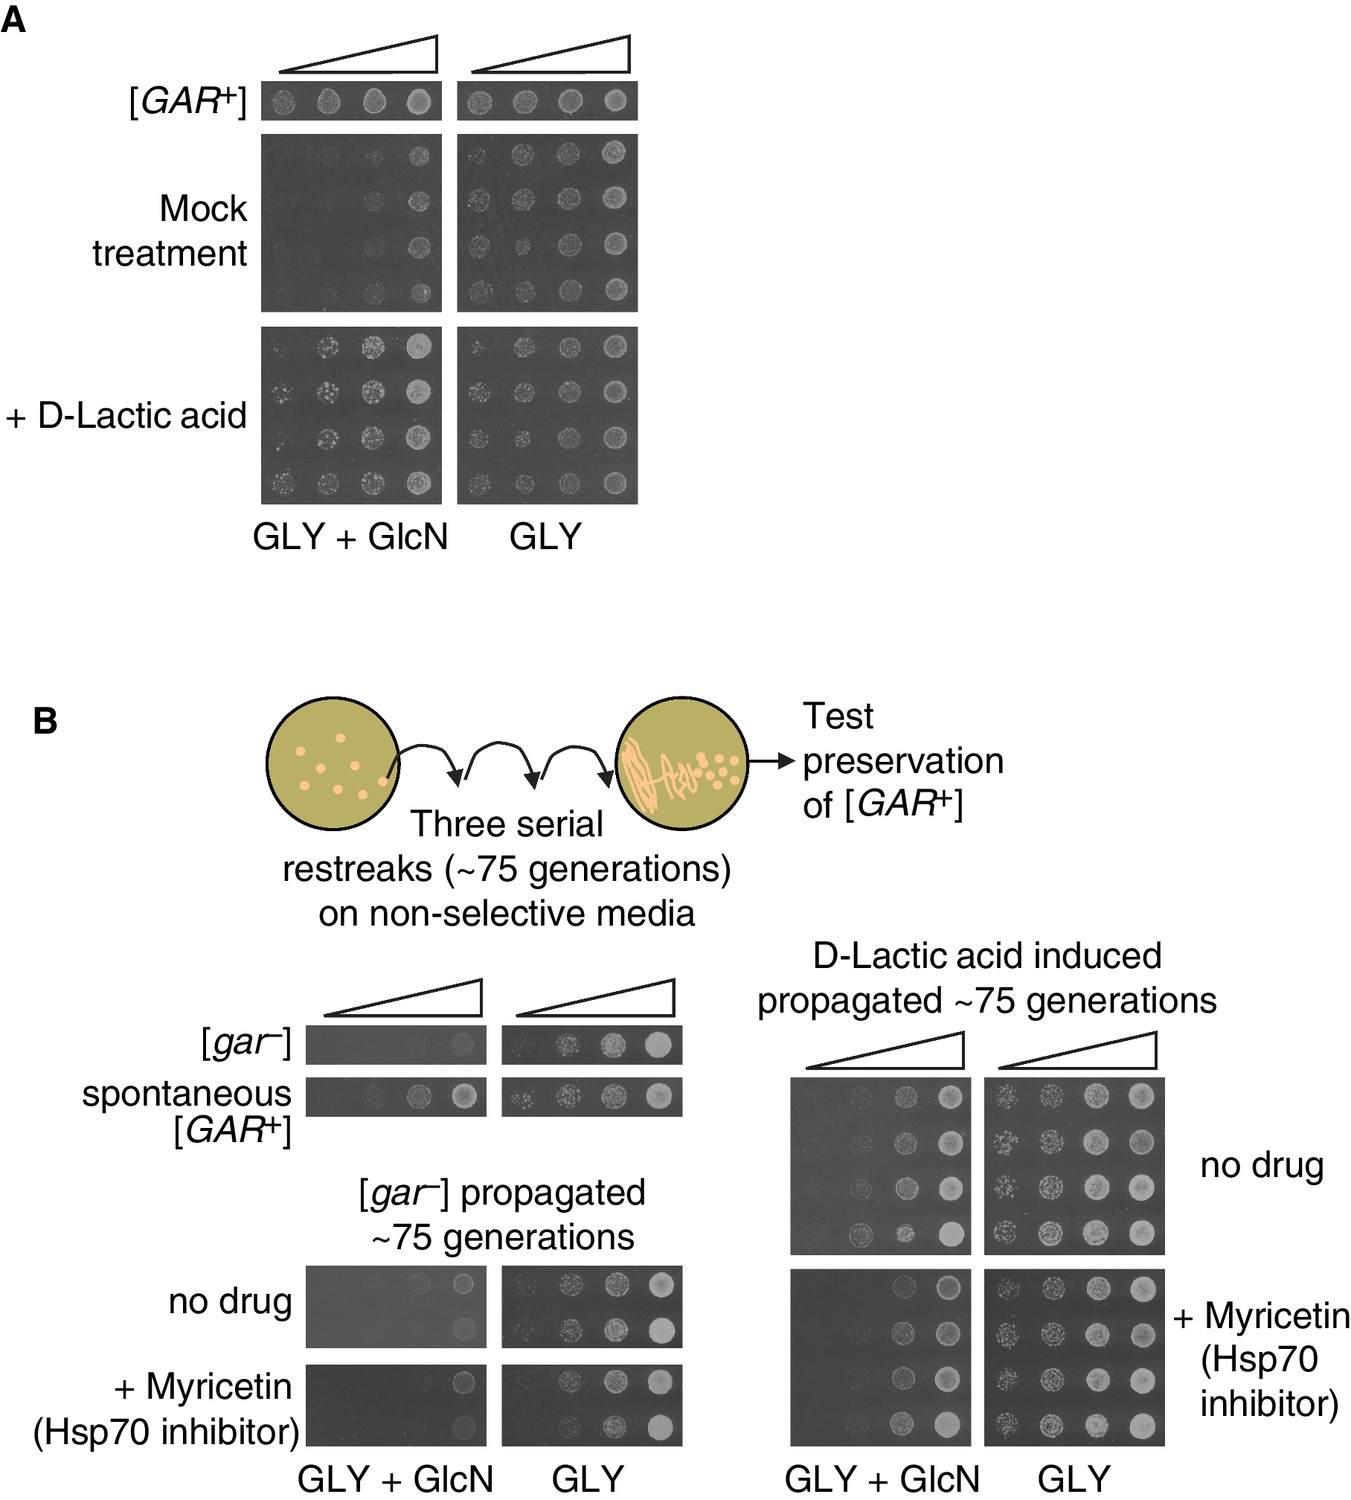
Induction, maintenance, and chaperone dependence of a lactic acid-induced [GAR+]-like state is conserved in the evolutionary distant yeast Dekkera bruxellensis.
(A) Induction of a [GAR+]-like state in D. bruxellensis. [gar−] cells were plated on GLY + GlcN (containing 0.1–0.15% glucosamine) medium with or without 0.02% D-lactic acid. Control cells harbor spontaneous [GAR+]. For each of the treatment images, four biological replicates are shown, in five-fold serial dilutions. (B) Maintenance and chaperone dependence of the lactic acid-induced [GAR+]-like state in D. bruxellensis. Cells induced in A. were propagated non-selectively for ~75 generations by restreaking on YPD plates, then subsequently retested for maintenance of the prion phenotype on GLY + GlcN (0.1–0.15% glucosamine), with or without the Hsp70 inhibitor myricetin (50 μM). Four biological replicates are shown for each induced group, and two shown for the uninduced and propagated [gar−] cells.
Additional files
-
Supplementary file 1
(A) Bacterial strains used in this study. (B) Yeast strains used in this study. (C) Primers used in this study. (D) Plasmids used in this study.
- https://doi.org/10.7554/eLife.17978.014
Download links
A two-part list of links to download the article, or parts of the article, in various formats.
Downloads (link to download the article as PDF)
Open citations (links to open the citations from this article in various online reference manager services)
Cite this article (links to download the citations from this article in formats compatible with various reference manager tools)
A common bacterial metabolite elicits prion-based bypass of glucose repression
eLife 5:e17978.
https://doi.org/10.7554/eLife.17978


